DOI:
10.1039/D4QM00766B
(Review Article)
Mater. Chem. Front., 2025,
9, 541-579
An overview of physical and chemical long-range phenomena governed by Friedel oscillations: a bridge between physics and chemistry
Received
4th September 2024
, Accepted 9th December 2024
First published on 13th December 2024
Abstract
Friedel oscillations (FOs) are quantum mechanical phenomena observed as oscillatory variations in electron density due to the presence of impurity or defect in a medium containing electron gas. FOs profoundly influence surface properties, including the ordering of adsorbates and surface-mediated interactions crucial for catalytic activity. We delve into both experimental and theoretical aspects of FOs, organizing our discussion around the physicochemical systems of interest, the decay pattern, wavelength, and amplitude of FOs caused by different perturbations. Additionally, we present a systematic derivation of perturbed charge density distributions in one-, two-, and three-dimensional systems and establish a conceptual link between FOs, electron delocalization, and the mesomeric effect, using the electron delocalization range function (EDR), offering insights into the reactivity of molecules featuring conjugated bonds. Finally, we propose an effective way to extend the analytical approach native to solid-state physics to describe charge oscillations in cumulenes and polyynes.

Authors of the review – members of the CoopCat group. From the left: James Pogrebetsky, Tomasz Bednarek, Alexandra Siklitskaya & Adam Kubas (PI)
| Cooperative Catalysis (CoopCat) group at the Institute of Physical Chemistry, Polish Academy of Sciences in Warsaw, Poland (IChF), led by Adam Kubas, was established in 2019, three years after Adam joined IChF. He obtained his PhD in 2012 from Karlsruhe Institute of Technology, Germany, under the supervision of Prof. Karin Fink, working on applications of high-level quantum chemical methods in homogeneous catalysis. At that time, he became increasingly interested in the development and application of wave-function-based methods to other types of catalysis, such as enzymatic catalysis when working on hydrogenases with Prof. Jochen Blumberger at the University College London (UK) or heterogeneous catalysis when working on oxides with Prof. Frank Neese and Dr Dimitrios Manganas at Max-Planck-Institute for Chemical Energy Conversion (Germany). The CoopCat group aims to unify these experiences and to develop a robust theoretical framework to describe catalysis, irrespective of catalyst/substrate phases. Moreover, the group explores cooperativity in various dimensions, including theory–experiment synergy and interdisciplinary approaches. The latter is coordinated by dr Alexandra Siklitskaya, who is an experienced physicist (2015 PhD thesis in semiconductor physics at the Ioffe Institute in St. Petersburg, Russia) but also an open-minded and skilled organizer who managed to bridge the physics–chemistry interface smoothly. She developed the analytical model addressing indirect interactions through metallic surfaces while working at the CoopCat group (to be submitted). Her efforts unified theoretical, experimental, and numerical advances into a concise description of surface-mediated interactions governed by Friedel oscillations presented in this review. She supervises the PhD work of Tomasz Bednarek (MSc), who received his MSc in theoretical condensed matter physics in 2022 (distinguished with the 2023 J. Rychlewski Prize for the best MSc thesis in quantum chemistry in Poland). Tomasz works on analytical models to describe surface-adsorbate interactions. Now a PhD student at IChF, he translates physical systems into functional computational models. Alexandra's efforts allowed Tomasz (physicist) to find a common language with James Pogrebetsky, a 2018 chemistry graduate from Taras Shevchenko National University of Kyiv, now PhD student of Adam. James works on corrections for post-Hartree–Fock methods and new embedding schemes for metallic surfaces that benefit a lot from models developed by Alexandra and Tomasz. He also explores the phenomenon of Friedel oscillations in finite-size molecular systems, such as polyconjugate molecules. Such a stimulating environment of the CoopCat group allowed the authors of this review to provide a comprehensive overview of surface-mediated interactions from a unique, interdisciplinary point of view. |
1. Introduction
Friedel oscillations (FOs), first predicted by Jacques Friedel in 1958,1 are a manifestation of quantum mechanical interference of scattered electrons. Currently, no complete analytical theory fully describes the interaction of adsorbates encompassing all aspects of FOs in surface chemistry. Fig. 1 artistically highlights the field's evolution, placing Friedel's 1958 paper at its core, surrounded by other influential studies, each marked by the first author's name and citation references.
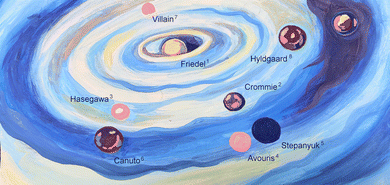 |
| | Fig. 1 An artistic representation of the key scientific advancements discussed in this review. The seminal paper of Friedel1 is found in the middle; other highly cited and influential papers are labeled with the first author's name and citation entry.2–8 | |
Physicist Erwin Schrödinger wrote in the preface of his famous book What is life:9
A scientist is supposed to have a complete and thorough knowledge, at first hand, of some subjects and, therefore, is usually expected not to write on any topic of which he is not a master. This is regarded as a matter of a noblesse oblige. For the presence purpose, I beg to renounce the noblesse, if any, to be freed of the ensuing obligation. My excuse is as follows: we have inherited from our forefathers the keen longing for unified, all-embracing knowledge. […] We feel clearly that we are only now beginning to acquire reliable material for welding together the sum total of all that is known into a whole; but, on the other hand, it has become next to impossible for a single mind fully to command more than a small specialized portion of it. I can see no other escape from this dilemma (lest our true aim be lost forever) than that some of us should venture to embark on the synthesis of facts and theories, albeit with second-hand and incomplete knowledge of some of them – and at the risk of making fools of ourselves.
In 1953, James D. Watson and Francis Crick jointly proposed the double helix structure of deoxyribonucleic acid (DNA) on the basis of, amongst other theoretical insights, X-ray diffraction experiments conducted by Rosalind Franklin. They both credited Schrödinger's book9 with presenting an early theoretical description of how the storage of genetic information would work, and each independently acknowledged the book as a source of inspiration.10
Learning the lesson about the importance of intuition for the interdisciplinary research fields provided by the greatest minds of the XX century, we undertake a modest attempt to bridge together the knowledge about standing waves of electron density that are known to occur in the bulk or near the surface of a metal. We aim to show that the Friedel Oscillations arising around the defects, impurities or any perturbations including the surface of the metal itself delivered theoretically from the seemingly abstract and simple models like Kronig–Penney crystal or Jellium that are exploited vastly in the solid state physics can be almost directly applied to the case of the long molecules featuring delocalized electron density (e.g. polyynes). In solid-state physics, this phenomenon is known under the name of Friedel oscillations, named after Jacques Friedel, who first predicted and described it in 1958.1 This review aims to (i) systematize research on FOs, especially in the field of solid-state physics, and (ii) provide a bridge between physical and chemical concepts related to charge oscillations and prove the importance of FOs for surface science.
We start by exploring and categorizing the literature related to FOs. The results of Scopus queries are graphically presented in Fig. 1. Nearly 10![[thin space (1/6-em)]](https://www.rsc.org/images/entities/char_2009.gif) 000 papers have been published mentioning the experimental observation of FO, with 6000 focusing on theoretical approaches and 3000 employing computational methods.11 Upon thorough examination, the cited works could be divided into areas: scanning transmission microscopy (STM), Green's function (GF), linear response theory (LR), and surface states (SS).
000 papers have been published mentioning the experimental observation of FO, with 6000 focusing on theoretical approaches and 3000 employing computational methods.11 Upon thorough examination, the cited works could be divided into areas: scanning transmission microscopy (STM), Green's function (GF), linear response theory (LR), and surface states (SS).
In this review, we structure and categorize these research findings, consolidate similar results, and offer clear, step-by-step derivations of theoretical advancements using a unified, coherent and concise mathematical approach. We have also cataloged noteworthy experimental papers and highlighted peculiarities such as the observation of asymmetric anisotropic FOs in experiments, along with derivations of FOs in d-dimensional cases. Most importantly, we aim to understand whether indirect interactions occurring in metallic systems, graphene, or any electron gas system can be explained through a detailed analysis of FOs (please see Fig. 2).
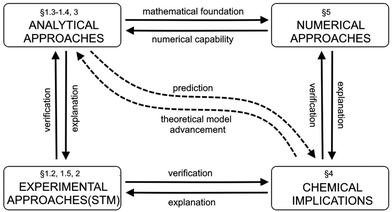 |
| | Fig. 2 The diagram illustrates the roadmap for the present review. It shows the paragraphs related to the topics presented in this review. | |
With well-structured experimental findings and a rigorous theoretical framework developed for solid-state problems, we could relate the FO concept with the response of delocalized electron density in the presence of a disturbing agent (e.g., point charge). Moreover, we have noted that the FOs are somehow related to the mesomeric effect,12 which is generally well-known in chemistry. Understanding this connection would allow one to adapt the chemical knowledge from the field of surface interactions to classical chemical phenomena like the mesomeric effect. For more details on this, please refer to Section 4 of this review. Understanding the correct nomenclature could eliminate the necessity of repeatedly rediscovering fundamental concepts. Another key question we address is whether analytical models based on the physics of electron gas systems can be directly applied or adapted to predict surface chemistry.
Fig. 2 provides a simplified roadmap for this review and interlinks between the paragraphs.
We begin with early experiments primarily conducted on metallic systems, followed by the theoretical derivation of FOs for various systems (1D, 2D, 3D, surface, ideal crystal) involving electron gas. Next, we cover existing numerical approaches and highlight the most notable experimental evidence of FOs, including a discussion of some exotic cases, such as anisotropic FOs and analogy to the mesomeric effect.
1.1. Nomenclature
It is important to define and relate nomenclature used in the literature with particular emphasis on metallic systems most often used in the study of the FO phenomenon. A complete derivation of all aspects of FOs is quite complex; therefore, we present only the most significant points. For a more detailed exploration, we recommend referring to the book by Monceau13 as well as classic textbooks on condensed matter physics.14,15 Charge carriers14,16 are particles within a material that carry an electric charge, facilitating the flow of electric current. In solid-state physics, the most common charge carriers are electrons and holes. In many metals, the charge carriers are conductance electrons. An electron gas is a model that treats electrons in a conductor as a collection of non-interacting, free-moving particles that obey Fermi–Dirac statistics. In contrast, an electron liquid considers the significant interactions between electrons, resulting in correlated movements and collective behaviors. The key difference between the two is that the electron gas model neglects electron–electron interactions, while the electron liquid model includes these interactions, leading to more complex and realistic descriptions of electron behavior. Electron mobility refers to the ability of electrons to move through a material when subjected to an electric field. It measures how quickly electrons can drift in response to an applied electric field. Higher electron mobility means electrons can move freely and conduct electricity more effectively within the material. The electron delocalization range (EDR) function,17 on the other hand, describes the extent to which electrons are spread out or localized within a material. It indicates how far an electron can move before its wave function overlaps significantly with another electron, leading to interactions such as scattering or localization. In simpler terms, EDR describes the range over which an electron can move relatively freely before being confined or influenced by its surroundings. Unlike electron mobility, which focuses on the speed of electron movement, EDR considers the spatial distribution of electron wave functions within the material.
Charge carrier density oscillations or charge density waves (CDWs) are observed, described, and defined differently, depending on the context. Any defect – such as a dislocation or an impurity – on the metal surface or in a system with high electron delocalization gives rise to charge density oscillations. Initially, for metals, we observe so-called Friedel oscillations, which are also defined differently, depending on the context. This phenomenon appears in various fields including low-frequency plasmonics,18 quantum many-body theory,14,15 surface ordering in chemistry,5,19–25 solitons of charge density and, upon discussion, in some molecular systems with high electron delocalization.6 Due to the widespread occurrence in condensed matter systems, FOs may be referred to by various names depending on the specific context or field of study. However, they all describe the same underlying phenomenon of electron density modulation (static or dynamic) around impurities or defects.
Surface charge oscillations26 (SCO) and induced charge density (ICD) oscillations26 are related to the observation and origin of charge oscillations, respectively. Finally, the name used the most in experimental surface science is LDOS (local density of states) oscillations that point out the nature of FOs – the oscillatory perturbation in the electron charge density around a defect. LDOS refers to the spatial variation of the density of available electronic states at a given energy level within a material, particularly near surfaces or interfaces (see Section 1.4.2). These oscillations arise due to interference effects caused by the interaction of electrons with the local environment, such as impurities, defects, or surface roughness. The oscillations in the local density of states have significant implications for electronic properties, such as conductivity, magnetism, and optical response.
Charge–density waves denote the time-dependent case of FOs (for instance, due to the time-dependent external perturbing potential), and the acoustic-surface plasmon (ASP) describes collective oscillations of electrons coupled to surface phonons or acoustic phonons at the interface between a metal and a dielectric. The connection between ASP and FOs lies in their shared context of electron–surface interactions. While ASP involves the collective motion of electrons coupled with surface phonons, Friedel oscillations arise due to the scattering of electrons by surface imperfections.
The Lindhard response function is a theoretical framework used to describe the dynamical polarization of a many-body electron system in response to an external perturbation, such as an electric field or a photon. It provides a formalism for calculating the dielectric function and related properties of materials, considering the collective behavior of electrons. Dynamical charge and spin waves are collective excitations of the charge and spin degrees of freedom in a material, respectively. These waves arise due to the interaction between electrons and their environment, leading to coherent motion of charge or spin carriers. Dynamical charge and spin waves are described within the framework of many-body theory and play essential roles in phenomena such as magnetism and transport. These four concepts are interconnected through their description of the collective behavior of electrons in condensed matter systems and their response to external perturbations. Dynamical polarization and the Lindhard response function provide theoretical frameworks for understanding the electronic response to external fields, while Friedel oscillations and dynamical charge/spin waves are manifestations of the collective behavior of electrons in materials, influenced by interactions with impurities, defects, and other environmental factors.
The relationship between dynamical polarization, Friedel oscillations, Lindhard response function, dynamical charge, and spin waves revolves around the collective behavior of electrons in condensed matter systems and their interactions with external perturbations. Dynamical polarization describes the response of the electronic charge distribution in a material to an external electromagnetic field. It quantifies how the electronic charge density changes dynamically in the presence of an applied field. This concept is crucial in understanding the optical and electronic properties of materials.
1.2. Early experiments
The first theoretical works on Friedel oscillations saw the light in the late fifties.1 To the best of our knowledge, the very first report of experimental observation of FOs has come as early as 197127 from field ion images. However, this claim has been debated28 because FOs should not be observable in such observations.
The first accepted experimental observation came many years later in the work by Crommie et al.2 Later that year, Hasegawa and Avouris3 also presented similar observations. These contributions are the first widely recognized experimental evidence of FOs.29 Crommie and co-workers2 used STM to probe the so-called local density of states, or electron surface states, around defects on the Cu(111) surface. They observed the formation of concentric rings around point defects as well as step edges in the temperature range of 4–77 K (see Fig. 3). STM is a powerful technique used to visualize surfaces at the atomic level by measuring the tunneling current between a sharp tip and a conductive surface, which often involves an electron gas. The interaction of the tip with the surface can reveal information about the electron density and electronic states of the surface, providing insights into phenomena such as Friedel oscillations in the electron gas.30
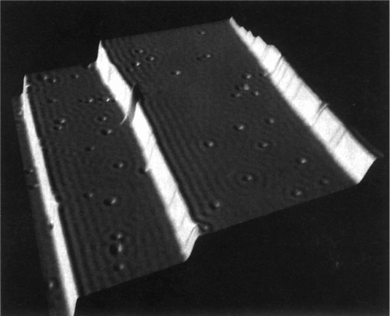 |
| | Fig. 3 Constant-current STM image of the Cu(111) surface. Friedel oscillations from point defects and step edges are clearly visible.2 Friedel oscillations can be identified by their long-range wave-like pattern. Reprinted with permission from Crommie et al.2 | |
The paper by Hasegawa and Avouris3 has also presented experimental evidence in the form of the periodic charge density waves in the STM image of the Friedel oscillations. Similar to the paper of Crommie et al.,2 they have worked on Au(111) surfaces and observed a wave-like pattern arising from steps on the surface. They have further confirmed these findings using Cu(111) and Ag(111) surfaces.3 Avouris and colleagues31 have proved that STM reflects the electronic structure of the adsorbate and, therefore, can and should be used to study FOs. The importance of this paper can hardly be overestimated because, nowadays, most experimental studies of FOs are done using STM. These early works have started a new twist in studying Friedel oscillations. From then on, experimental STM observations have become an important tool in FO research.
1.3. Early theories
The first model describing the metal's electrons was proposed by Paul Drude in 190032 and extended by Hendrik Lorentz in 1905.33 It was quite a successful classical model of the electric and thermal conductivity of metals, and after the appearance of the wave and matrix mechanics in 1925,34,35 it was adjusted to the quantum theory by Hans Bethe and Arnold Sommerfeld in 1933,36 leading to the Drude–Sommerfeld model. However, the more accurate description of metallic properties appeared in 1970 through the jellium model proposed by Lang and Kohn.37 Afterward, more sophisticated models based on the matrix expansion of Green's function were developed, e.g., Korringa–Kohn–Rostoker expansion of the matrix elements.38 The traditional definition of a covalent bond, characterized by the sharing of electron pairs between atoms, has evolved with the understanding that electron delocalization can lead to “fuzzy bonds”,39,40 where the exact nature and strength of the bond are less defined. This concept, which suggests a continuum of bonding scenarios rather than discrete bond classifications, remains a topic of ongoing discussion in the field of chemical bonding, as highlighted by recent studies on the energy and dynamics of covalent interactions.40
As it will be shown, in principle, FOs can be related to any system with an electron gas. However, complications arise due to the diversity of electron gas models and the variety of systems (3D volumes, 2D surfaces, or 1D atomic chains) that can be involved, making the mathematics behind these seemingly simple systems extremely complex. While many physical concepts are covered in graduate-level textbooks, the systems relevant to indirect interactions on a surface (see Fig. 4) are not as mathematically straightforward as one might think. In fact, understanding these interactions in detail has been considered nearly impossible until now.
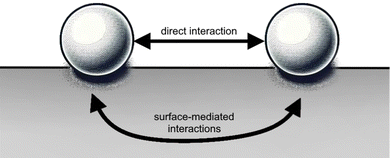 |
| | Fig. 4 Materials surface chemistry aims to describe both types of adsorbate–adsorbate interactions: (i) indirect, that is mediated by the surface, and (ii) direct (through space). | |
Interestingly, for atomic adsorbates, the equilibrium distances between them mainly depend on the surface material and not their chemical identity. Intuitively, this fact must be related to FOs caused by each adsorbate. The same holds even for bulky molecular adsorbates, but van der Waals interactions have to be taken into account.41
To understand the FO phenomenon in metals, let us consider electron gas (see Fig. 5) density around an impurity or a defect that differs from that of the bulk metallic material. The impurity introduces a boundary condition for the electron wavefunctions because the probability of an electron occupying this point in space becomes zero since it is already occupied. Thus, we obtain the reflection of the electron waves from every impurity, and their mutual interference results in an uneven electron density distribution around the impurity. Such a distribution can be characterized by its oscillatory nature, with the amplitude decaying according to the power law the further away we look.
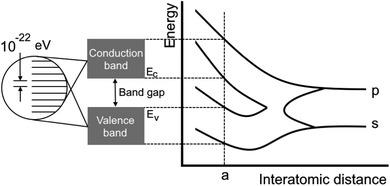 |
| | Fig. 5 Scheme showing the dependence of the bandgap on the distance between atoms. It is highly connected to the definition of electron gas.16 The attempt to classify the electron gas density depends on the distance between AOs or overlapping electronic levels in crystals. One should note here that a chain of atoms can be considered as a 1D crystal and graphene as a 2D crystal. | |
The first theoretical description of FOs is rooted in these considerations. Jacques Friedel1 considered metallic alloys and how their parameters can be described in terms of their electronic structure model. As the standard Thomas-Fermi approximation (classical screening effect resulting in a charge density decaying exponentially from the defect) overestimates the resistivity of the Cu alloys by at least an order of magnitude, he considered the quantum approximation based on the von Laue theorem:42
the free electron gas density ϱ(E, r) – density at pointrof electrons with energy at most E – is independent of the boundary conditions as long as the point r is far enough from the boundary surface.
Friedel applied this theorem for two cases: (1) the one-dimensional square box and (2) the thin spherical well – for both, he obtained the oscillatory interference pattern decaying with the distance from the surface/well. Moreover, he obtained a similar oscillatory pattern caused by any spherical potential using partial-wave analysis from the scattering theory. His method, though, requires analyzing all of the possible electron wavefunctions, therefore effectively making it computationally expensive and impractical in real applications. Here, we should also note that the decay of the electron density disturbance manifested by FOs depends on the dimensionality of the system studied. The latter becomes a limiting factor in the numerical studies, as the theoretical model should be sufficiently extended in each direction. Even with modern available DFT codes, such scale is prohibitively expensive. The Green's function approach allows for an increase in the efficacy of such calculations since it erases the need to calculate multiple wavefunctions. However, a ready-to-use computational method that uses it in the context of FOs is yet to be developed. The absence of fast and easy-to-use methods to account for FOs (and their long-range character) has since limited their computational studies.
1.4. Properties of Friedel oscillations in electron gas – a textbook introduction
1.4.1. Core assumptions.
A lot of textbooks mention the FOs,1 but the problem is often formulated in an abstract manner and seems to be stripped out of practical applicability.14,15,43 Therefore, we feel obligated to systematize some basic facts before getting into an advanced description of FOs.
As mentioned in the previous chapter, any defect (such as dislocation or the impurity atom) on the metal surface gives rise to the so-called Friedel oscillations, which are defined differently, depending on the context. This phenomenon appears in various fields, including low-frequency plasmonics, many-body theory, a few fields in modern chemistry, and others. For instance, the authors of ref. 15 consider a semi-infinite homogeneous 1D non-interacting gas for which, due to the existence of the surface (imposed as the vanishing of the wavefunction at the point x = 0, as its model potential is presented in Fig. 6(a)), they obtained the FOs directed towards the interior of the bulk (see Fig. 6(b)).
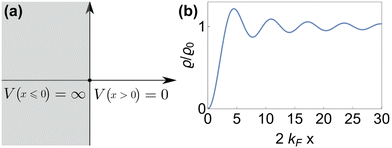 |
| | Fig. 6 (a) Plot of the hard-barrier surface introduced at x = 0 and (b) plot of the resultant Friedel oscillations of charge density.15 | |
There were no realized attempts to provide the theory of full 3D Friedel oscillations on a surface. Originally, this concept was introduced due to the existing question about the distribution of the screening charge. It was long before noticed that two separated electric charges exert lower force upon each other in a metal or electrolyte rather than in a vacuum. The classical argument was that by using the Poisson equation, we have the relationship between the electric potential V(r) and the screening charge ϱ(r) given as
| |  | (1) |
However, we may consider the probability
p(
r) of finding the charge located at a distance
r to be given
via the Boltzmann factor as
| |  | (2) |
and at large distances, we will have the screening charge
| |  | (3) |
where the proportionality constant
κ follows
κ ∝
T−1/2. The solution is then given as
In the framework of the Thomas–Fermi theory,
44,45 we arrive at a similar result, but the proportionality constant
κ does not depend on temperature. The main core assumption here is the local linear proportionality between the screening potential
V(
r) and the screening charge
ϱ(
r), valid only for the localized electrons rather than the nearly free ones. However, Friedel showed
46 (using his famous sum rule) that instead of the exponential decay, we obtain the oscillatory power decay, Friedel oscillations, of the form
| | | ϱ(r) ≈ cos(2kFr + δ)/r3. | (5) |
Moreover, the Thomas–Fermi approximation is applicable only in terms of the long-wavelength charge variations.
7
The common understanding of metals in the bulk is that the material experiences only a minor change due to the presence of a defect (perturbation). Anything that perturbs the ordered structure inside a crystal may be considered as a defect – the presence of an adatom/vacancy/substituted atom and so on. Interestingly, even a surface itself is a defect because the atoms at the surface have a different environment from the atoms in the bulk of the crystal. This, however, also means that anything affecting the electron state of the surface (later termed simply as “surface state”) can also be considered as a defect, like an atom atop an otherwise ideal surface or even a charged particle that approaches the said surface.
1.4.2. Simplified theoretical description.
STM can detect Friedel oscillations by imaging the local variations in electron density at atomic resolution, revealing the oscillatory patterns induced by impurities or defects in the crystal structure. The physical quantity measured by STM is the local density of states which accounts for how many relevant states at given energy ω we have at a given point ![[r with combining right harpoon above (vector)]](https://www.rsc.org/images/entities/i_char_0072_20d1.gif) and is given as the following sum:
and is given as the following sum:| |  | (6) |
where Dirac delta δ(ω − Ej) peaks when ω = Ej, and |ψj(![[r with combining right harpoon above (vector)]](https://www.rsc.org/images/entities/i_char_0072_20d1.gif) )|2 is just a probability density of finding an electron |j〉 in the position
)|2 is just a probability density of finding an electron |j〉 in the position ![[r with combining right harpoon above (vector)]](https://www.rsc.org/images/entities/i_char_0072_20d1.gif) .
.
FOs are usually described as a “standing wave” of the electron density decaying around the perturbation.14–16,26,43,47,48 However, this definition can be somewhat misleading since it does not explicitly specify that the said disturbance is not a function of time. As will be shown later, FOs only depend on the metal and the charged particle above it, and its charge and distance from the surface. Therefore, we believe that a proper definition of Friedel oscillations is a decaying electron density redistribution in a wave-like pattern.
We should emphasize again that FOs are dependent on the number of dimensions of the system that hosts them8 (perturbation goes through the volume, and its decay depends mostly on the dimensionality of the system). Throughout the years, extensive studies have been done with the 1D and 2D electron gas approaches for FO.49
In fact, FOs can be described mainly by the following formula, which nicely grasps the qualitative picture:
| |  | (7) |
where
d is the dimensionality of the considered system,
δF is the Fermi phase shift dependent on the type of perturbation, and
kF is the Fermi wave-vector. The power of decay of FOs is defined by the system's dimensionality. In the case of group-I metals, it may be approximated by a sphere, therefore corresponding to the radius of the Fermi surface.
From the theoretical part of this review, one may notice that the features of FOs are governed by a set of parameters that may be used to fit the experimental observations into a theoretical model. Parameters of FOs include Fermi wavelength (λF), periodicity, and Fermi wavevector (kF). The period of oscillations is connected to the Fermi wavelength, being half of its numerical value. The former may be directly inferred from the STM images. However, that is under the assumption that low bias voltage and temperature are used to make the oscillations visible.
On the other hand, kF may be obtained in multiple ways. It can be obtained from the above-mentioned periodicity by dividing π by the oscillation period. Another approach is from the ring radius in STM picture reciprocal space. Petersen and colleagues have also shown that Fourier-transform scanning tunneling microscopy may be used to study Fermi contour,50 and therefore to obtain kF values (Fig. 7(a) and (b)). Some studies also mention Fermi wavelength λF, a parameter that numerically equals two oscillation periods.
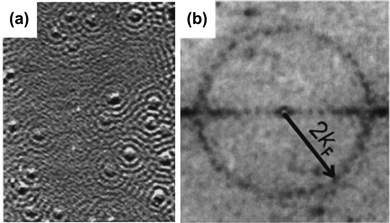 |
| | Fig. 7 (a) STM image of the Cu(111) surface obtained at −5 mV bias voltage. (b) Fourier transform of the STM picture (a), showing the ring radius being 2kF. Please note that the atoms seem to share local density of states oscillations. Panels (a) and (b) are reprinted with permission from the work of Petersen et al.50 | |
1.5. Surface-mediated interactions and applications
Over 50 years ago the existence of surface-mediated interactions (Fig. 4) has been proven experimentally.51–53 Since FOs influence surface charge distribution, it is no wonder they have attracted attention in this field. In fact, a theoretical prediction54 of FOs’ involvement in this phenomenon has been published in the late 70s. Interestingly, as early as 1998, Wahlstrom et al.55 have reported an STM picture of the interference pattern produced by multiple adatoms (you may see the interference in Fig. 7(a)). This study has become the first experimental evidence of long-range surface-mediated interactions56 and hinted at the role of FOs. Since then in a number of studies FOs have been used to account for or explain surface-mediated adsorbate–adsorbate interactions41,55–61 or even adsorbate ordering.6,21–25
Interestingly, not long before the Wahlstrom55 experiment, Avouris and co-workers4 have observed that Ag islands formed on Ag(111) by metal-on-metal epitaxial growth have a radius of approx. 45 Å. Such size is close to three times the period of oscillations expected for 2D electron gas (approx. 18 Å), hinting at a possible FO origin. The size difference in comparison with three oscillation periods (54 Å) can be explained, taking into account that such islands can be described by a mixture of two-electron states.4
The impact of FOs on the ordering of adsorbates on metallic surfaces has an energetic background. As such, it should also be visible when performing catalytic reactions. Take, as an example, CO oxidation at the platinum surface. In this case, the heat of CO adsorption systematically decreases with an increase in coverage up to 0.75 ML (monolayer) for both reconstructed hex and the unreconstructed (1 × 1) surfaces of Pt(100).62
Following this idea, Völkening and Wintterlin63 were looking at CO oxidation on the Pt(111) surface with STM. They observed that initial islands of adsorbed oxygen atoms undergo rearrangement upon introduction of CO to the system. Their calculations indicate that the activation energy of the reaction rises proportionally to the number of neighboring Oad atoms. This observation alone hints at the presence of surface-mediated interactions if one were to consider the inevitable repulsion between the atoms, similar to the observations made in other works.24,64
Interestingly, the CO adsorbed in between the atoms of the (2 × 2)Oad domains was unable to desorb Oad and form CO2,63 contrary to the conclusion reached in an earlier kinetic study,65 where the weaker adsorption energy in such sites has been associated with higher reactivity. This results in a reaction happening only at the border of domains formed by adsorbed Oad and COad species. Again, such Oad behavior seems to be rooted in surface-mediated interactions via FOs.
The FO phenomenon has some interesting applications beyond catalysis. Among others66 FOs may be used to calculate Fermi surfaces and dispersion relations as well as dispersion of the surface states67 and they even allow detection68 and characterization69 of the depth of defects below the surface using STM. FOs may also be explored in the fabrication of diluted magnetic semiconductors and spin-glasses.68
All systems with non-free electron gases should exhibit phenomena such as Friedel oscillations. Therefore, addressing these situations should become a standard procedure in both chemical and physical contexts. Our aim is to enhance the understanding of the nonlocality of these phenomena within the field of chemistry. Additionally, surface physics should devote more effort to providing strict analytical explanations of the chemical aspects and actively disseminate this knowledge.
2. Experimental observations
As stated previously, STM allows the imaging of FOs. Hence, we would like to note that different experimental conditions may influence the observability of FOs. Temperature and bias voltage (Sections 2.1–2.3) are notoriously well-known to influence STM pictures of FOs. The general recommendation is to stick to low temperature and bias voltage. The same is true for pressure. Although the pressure should not influence the FOs, a higher pressure may result in bigger coverage that would prevent the observation of LDOS due to the formation of big islands and other structures. We believe that FOs may be responsible for this process due to surface-mediated interactions that we discuss in connection with the interaction potentials (Section 2.4). We then proceed to discuss studies conducted on various surfaces (Sections 2.5 and 2.6) and their influence on the observed FOs. This section is wrapped up with a discussion of Friedel oscillations of anisotropic nature (Section 2.7) and of those occurring due to the peculiar quasiparticles called skyrmions (Section 2.8).
2.1. Experimental parameters: temperature
Temperature affects the electron gas density and energy level filling differently across materials featuring different conductivity types. Although, in metallic systems, temperature slightly broadens the energy levels near the Fermi surface, it has only a minimal effect on the electron gas density. On the other hand, in semiconductors, it significantly increases electron density by promoting electrons from the valence to the conduction band. In graphene, the electron–hole pair generation slightly increases at higher temperatures. Finally, in the case of long conjugated molecules, one would expect temperature-dependent orbital populations.
Friedel oscillations may usually be detected only at low temperatures due to thermal oscillations. However, in some cases, an image with an unclear oscillatory pattern55 may still appear in the STM picture. The typical temperature range is 4–165 K, with image quality decreasing with temperature.2,3,5,23,41,50,53,55,56,59,70–85
Avouris and colleagues4 have simulated the temperature dependence of FOs and showed that oscillations at low temperatures coincide with theoretical models (Fig. 8(a)).
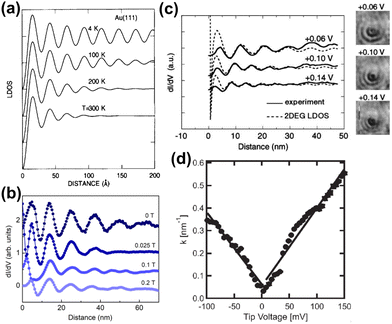 |
| | Fig. 8 (a) Simulated temperature dependence of Friedel oscillations on Au(111) based on earlier photoemission data.86 (b) FOs vs. the magnetic field induction B observed on rhombohedral trilayer graphene at a fixed bias voltage (−7 mV). (c) Propagation of FOs obtained for InAs(111) at various bias voltages (solid curve) vs. calculated with the Friedel model1 (dashed curve) from eqn (7). The inset on the right shows dI/dV images of FOs on the InAs(111) surface. (d) The dependence of the wavevector on bias voltage obtained for graphene on hexagonal boron nitride (hBN). Panels (a) and (b) are reprinted with permission from the works of Avouris et al.4 and Yin et al.,70 respectively. Panels (c) and (d) are reprinted with permission from the works of Kanisawa et al.87 and Xue et al.,71 respectively. | |
2.2. Experimental parameters: magnetic field
FOs also depend on the magnetic field applied. In the case of 1T-TiSe2, it has been found88 that the magnetic field enhances the amplitude of FOs. A study on rhombohedral trilayer graphene,70 however, has led to an opposite observation (Fig. 8(b)), possibly due to the electron localization under a magnetic field, thus suppressing the amplitude of FOs. However, it is worth noting that the LDOS curves exhibit a 1/r spatial decay contrary to the monolayer graphene case with 1/r2 decay characteristic (for more information, please see Section 3.10).
2.3. Experimental parameters: bias voltage
Bias voltage plays an even more important role in FO observation, as its decrease allows for a much clearer image in STM. Fujita et al.72 have noted that for the herringbone reconstructed Au(111) surface at a bias voltage of −2 mV, they have been able to detect long-range spatial oscillations, unlike in their previous measurements at 30 mV. To the best of our knowledge, bias voltage below 100 mV gives the most well-defined FOs.5,41,50,53,55,56,59,68,70,72,73,75,81–85,87,89 The reason for such observation is that smaller bias voltage probes closer to the Fermi level, without causing much disturbance to the material.
Petersen et al.75 and Vonau et al.84 have observed a much clearer STM image of FOs with a decrease in bias voltage. Although lower bias voltage is generally recommended, in some cases, FOs have been observed at bias voltages of −377 to −1 V3 and 0.3–1 V.78
Some experimental observations indicate that lower absolute bias voltage increases the periodicity of the oscillations.77,78 However, for high absolute bias voltages, this effect should not be considered as a universal principle since it is the result of tip-induced band bending,77 most likely due to the very high negative bias voltage used in these studies. As mentioned by Wielen et al.,77 a more negative bias voltage increases the local band bending and therefore increases the Fermi energy, lowering the Fermi wavelength. In our opinion, this should also hold true for positive bias voltages. However, much smaller absolute bias voltage values, which are more reasonable for FO observations, have also shown the same dependence of kF and the oscillation period. Kanisawa et al.87 and Xue et al.71 have noted the decrease of the oscillation period and kF on increasing bias voltage (Fig. 8(c) and (d); please note the higher clarity of FOs for lower bias voltage and how the amplitude of the oscillations decreases with increasing bias voltage). This, however, does not seem to affect noble metals as much.71,72
Other works have also noted the dependence of STM accessibility of oscillatory features on experimental parameters.2,74 In some cases, FOs may be barely noticeable on STM images but become apparent in the differential conductance STM pictures (dI/dV images).90
2.4. Surface-mediated interactions and self-organization of the adsorbants
Direct interactions over big distances become negligible, making indirect interactions (please see Fig. 4) through a medium with higher carrier density more significant. It is well-established in surface chemistry and materials science that defects tend to attract each other, with the attractive forces arising from changes in the elastic tensor and/or electrostatic interactions. Since STM allows observation of relative charge density that is related to LDOS, it has become a tool to visualize the interference pattern from FOs, generated by different defects (you can see the interference in Fig. 7(a)), as well as its dependence on the defect separation distance.64
Repp et al.64 have shown that Cu can form adatom islands at a distance up to the first potential energy minima at 12.5 Å (see Fig. 9(a) and (b)). They have experimentally determined the interaction energy between two Cu atoms on the Cu(111) system to be about approximately −0.4 to 5 meV (see Fig. 10(a)). The STM images they have recorded have shown that in the case of the first and second energy minima of pair potential, a decrease of LDOS is observed, and the reverse has also been detected for the potential energy maxima. They have used the theory developed by Hyldgaard and Persson8 (see Section 3.7) to fit their STM data. The decay rate and periodicity of 1/r2 and 12.5 Å, respectively, that they have obtained are both in good agreement with theoretical values. The calculated value of periodicity is only slightly smaller (∼11 Å).
 |
| | Fig. 9 (a) and (b) STM images of Cu islands on the Cu(111) surface and Cu atoms at the edge, trapped by surface-mediated interaction, respectively. The mean Cu–Cu separation is approx. 12.5 Å. Interference patterns from FOs of different atoms may be visible. (c) dI/dV STM image of bilayer NaCl on Cu(111) and Cu(111). Panels (a)–(c) are reprinted with permission from the works of Repp et al.64 as well as Repp and Meyer.82 | |
 |
| | Fig. 10 (a) Interaction energy between two surface Cu adatoms on Cu(111) at varying distances. At larger separations, the potential energy is decreased (inset). The dotted line represents a fit using the theory by Hyldgaard and Persson8 (please see Section 3.7). (b) Potential interaction energy between the two tris-(2-phenylpyridine)iridium(III) complexes. The black solid line represents a Hyldgaard and Persson8 fit. The dotted red curve represents surface-mediated interaction potential energy with dipole–dipole and dipole-mirror dipole interaction energy corrections (inset). (c) Experimental and calculated interaction energies between the two Co adatoms on Cu(111). The fit has been done to the Hyldgaard and Persson model.8 The inset shows an STM image of the Co strings on Cu(111). Panels (a)–(c) are reprinted with permission from the works of Repp et al.,64 Yokoyama et al.41 and Stepanyuk et al.,5 respectively. | |
Mehlhorn et al.53 and Knorr et al.56 have also obtained similar interaction energies for CO on Cu(111) as well as Cu and Co adatoms on Cu(111) and Ag(111) surfaces, respectively. According to the latter's56 STM results, the decay rate for each of the systems agrees with theoretical decay for 2D electron gas (1/r2). The periodicity of FOs detected on the Ag(111) surface is 38 Å, in perfect agreement with its theoretical kF value of 0.083 nm−1 (ref. 91) (please refer to Section 1.4.2 for more details on parameters that affect FOs).
As mentioned by Simic-Milosevic et al.,57 the decay for the FOs at the Ag surface also decays as predicted by its 2D electron gas. However, that is only the case for the surface electrons. The bulk contribution decays at 1/r5 rate. As mentioned in Section 3.4, the expected decay rate for such a system is 1/r2, and the origin of such discrepancy should be further investigated.
Knorr and co-workers56 have further explored adsorbate–adsorbate FO-mediated interactions. In their experiment, two Co atoms on the Ag(111) surface at short distances face strong repulsion, so the first potential energy minimum is located at a distance of 27 Å. Unlike the Cu/Cu(111) and Co/Cu(111) systems, the repulsion of adsorbates on the Ag(111) surface is much stronger, which is evident from the much smaller first potential energy minimum adsorbate–adsorbate distances for the Cu(111) systems (approx. 11 Å).
Coincidentally, the interaction energy oscillation period is also much smaller for the Cu(111) surface in comparison to the Ag(111) surface, namely 17 Å and 38 Å, respectively. The authors used the theory by Hyldgaard and Persson8 (see Section 3.7) to fit their results. Theoretical and experimental potentials matched very well. This fact, along with the coincidence of interaction energy oscillation periods for all the studied systems with those expected for the FOs,53,64 allows for a conclusion on the origin of the surface interaction between the adsorbates.
Another interesting conjecture may also be made. It is a well-known fact that point defects tend to be subject to attraction force towards other defects (perturbations in the elastic field)92,93 and are also attracted to dislocations with elastic tensor and the electrostatic interactions being a driving force of this phenomenon. Since both – adatoms and dislocations – generate FOs that may be responsible for the surface-mediated interactions, one might argue that FOs also play an important role and may even result in the formation of chains or islands of adsorbed entities. On the other hand, the absence of extensive observations of adatoms located at a distance of the first energy minimum may be due to interference of their FOs, resulting in stronger interaction with dislocations and edges and subsequent concentration there, forming bigger substructures (Fig. 9(b)). Another possibility is that atoms located at the first energy minimum of each other might be able to overcome a potential energy barrier, forming a pair. Subsequently, this may lead to the formation of bigger structures.
The rare example of detailed studies of the coordination complex adsorbed on Cu(111) has also been shown to lead to 1/r2 decay, as expected for the noble metal surfaces.41 In this case, the authors obtained a slightly different interaction potential curve. At close distances, the dipole–dipole interaction between two tris-(2-phenylpyridine)iridium(III) complexes greatly increases interaction energy. Only at high distances of >40 Å does the surface-mediated interaction prevail over dipole–dipole interaction potential energy, as can be seen from Fig. 10(b). For this reason, the first interaction potential energy minimum does not coincide with the molecular separation predicted for solely surface-mediated interaction. However, already the experimental potential energy minimum at 25.9 Å is very close to the expected 27.5 Å separation.
Stepanyuk et al.5 observed the formation of long Co chains on Cu(111) at 0.006 ML coverage at 20 K. Their results are in good agreement with Korringa–Kohn–Rostoker (KKR) scattering theory. The former, however, predicts a rapid decrease in interaction energy below 5 Å distance between two Co atoms, while experimental data suggest an opposite trend (Fig. 10(c)). We think that such behavior might be related to the fact that KKR theory does not account for bulk electronic states. The interaction energy is, however, decaying at an expected 1/r2 rate. Interestingly, the presented STM also shows that Co chains are at a distance of third or fourth interaction energy minimum (Fig. 10(c)).
A more complex structure of adatoms has been observed by Silly et al.59 The authors have reported the formation of a hexagonal Ce superlattice on the Ag(111) surface. The periodicity of FOs generated by Ce atoms corresponds with the Ce–Ce distances, being 32 Å, and similar FOs have also been imaged from the lone Ce pair. The fitting of FOs, generated by lone Ce pairs, that are also present on the surface, using equations used by Crommie et al.,2 has yielded the same phase shift (δ0 = 0.37π) as fitting with theory by Hyldgaard and Persson8 (see Section 3.7) for the surface-mediated interactions, further proving the FO nature of the Ce–Ce interactions. Interestingly, no such superstructures have been found for Ce deposited on the Ag(100) surface due to the lack of electron surface state in the latter. The use of FOs also allows us to understand the unexpectedly higher stability of the superlattice at 4.8 K in comparison to a lower temperature. It appears that thermal energy at this temperature is sufficient to overcome the first potential energy maximum from the Ce-induced FOs.
Lukas et al.24 have studied pentacene adsorbed on Cu(110). They have determined that pentacene arranges into long-ranged structures of parallel molecules. The propagation of the observed oscillations, however, is different from the one expected for the bare Cu(110). Thus, it originates from a different electronic state that is most likely a result of electron interaction (donation/backdonation) between pentacene and the surface. This has been further confirmed with the CO desorption experiment from a Cu(110) surface. It appeared that in the presence of ordered pentacene, CO desorbs at 16 K less than for a surface covered with disordered pentacene. Interestingly, the spacing between the pentacene molecules is about 12 Å24 similar to 12.5 Å found for Cu/Cu(111) adsorbates.64 This distance approximately corresponds to the period of FOs produced by a single adsorbed pentacene molecule (9.5 Å, giving kF of 0.66 Å−1). Small differences might be attributed to repulsion between the molecules. The previously discussed Repp et al.64 paper also mentions the presence of repulsive interaction for individual Cu atoms at distances below 10 Å.
A work by Simic-Milosevic et al.57 illustrates the intricate balance between attractive and repulsive interactions. They showed that at the temperature of 8 K, Li adatoms on the Ag(001) surface form diatomic structures with 7–9 Å Li–Li separations. Although no oscillatory feature is present on the reported STM images, perhaps due to a high bias voltage of 0.3 V, FOs may still be used to explain this result. From previous studies the surface kF for Ag(111) is equal to 0.083 Å−1 (ref. 91) and kbulkF = 1.2 Å−1.26 However, in the case of Ag(001), the surface state is empty, as is the case for Ag(100), due to the same geometry and, consequently, the Fermi surface of the two. Therefore, the FOs may only originate from the bulk electron states. The periodicity found for the latter is equal to 4.55 Å. The absence of Li–Li pairs of such distance may be explained by repulsion between the two atoms, and therefore, the Li–Li pairs should form at the second potential energy minima (9.1 Å), which coincides with the above-mentioned separation of 7–9 Å.
In retrospect, the surface state kF, being an order of magnitude higher than the kF of bulk, would give just as much smaller period for the former, which would not be able to explain the experimentally observed Li–Li distances. On the other hand, the FOs from the bulk electrons are decaying at a much higher rate than expected for the surface state FOs, being 1/r5 (ref. 54) and 1/r2, respectively. This explains the absence of longer Li chains. Interestingly, the authors have also noted that the Li–Li pair may separate into two distinct Li adatoms via interaction with the STM tip. It appears that it may fill an electron state associated with the antibonding orbital that forms on the Li atom via its adsorption.
2.5. STM studies of noble metal surfaces: periodicity of oscillations for various noble metal surfaces
In the case of Cu(111), Au(111) and Ag(111) the kF values have been found to be 0.216 nm−1, 1.73 and 0.080 nm−1, respectively. The numbers agree with both STM72,75 and photoemission measurements.66,86 They also agree with an experimental periodicity of approx 18 Å for Au(111) and Cu(111).2–4,31,50,53,55,72 It is also worth mentioning that the period of oscillations on Cu is slightly smaller than for Au,2–4,50,53,55,72 and it is even smaller for Ag(111),53 in accordance with their respective kF values.
Crommie et al.2 and Fujita et al.72 have analyzed the FOs of Cu and Au surfaces in the form of the above-mentioned equation LDOS(E, x) ∼ 1 − J0(2kFx), where J0 denotes the zeroth-order Bessel function of the first kind.94 The form of the equation is closely related to the 2D expression for Friedel oscillations (see Table 1). Later on, the same equation, used by Crommie et al.2 and Fujita et al.,72 has been used by Ono and co-workers,79,95 to fit the data obtained for the  surface. The authors have observed FOs in tunneling conductance (dI/dV) images, stemming from single point defects with kF = 0.45 nm−1. They have also mentioned that long-distance FOs from step-edges have been observed at up to approx. 50 nm distance, similar to most studies presented in this review.
Table 1 Table of Green's functions G0(r) and Lindhard response functions χ(r) in 1D, 2D and 3D
| Functions |
1D |
2D |
3D |
| Green's |

|

|

|
| Lindhard |
χ(r) = −Si(2kFr) |

|

|
Avouris and co-workers4 have shown that oscillations from steps on Au(111) oscillate as cos(2kFx), where x is the distance from the step, that agrees with the theoretical eqn (7). Their theoretical findings show that such decay and kF should be characteristic of any 2D electron gas surface. On the other hand, they have shown that higher temperatures can increase the oscillation period due to the Fermi distribution of the STM tip and sample, as denoted by their (dI/dV)/(I/V) scans that correspond to the 1/r2 decay rate.
Peterson and co-workers75 have observed FOs generated by point defects on the Cu(111) surface with the periodicity of approx. 17 Å at −2.4 mV. They further confirmed the finding with power images of FT-STM (Fourier-transform scanning tunneling microscopy). Interestingly, using the same technique, they have also observed that the oscillatory pattern formed on the herringbone reconstructed Au(111) surface arises from both surface states (kF = 0.17 ± 0.02 Å−1) and bulk (kF = 0.21 ± 0.02 Å−1) electrons. The same has also appeared to hold for Cu(111) with surface electron state ksurfaceF = 0.21 Å−1 and bulk contribution kbulkF = 0.24 Å−1. As mentioned by the authors,75 both bulk electron kF values agree with magnetoacoustic effect data. The theoretical description they have applied is similar to the above-discussed Crommie2 approach.
2.6. Fermi surface influence on FOs properties in different media
A 2D electron gas of graphene on hBN gives rise to FOs from steps with a period of 15 Å.71 The theoretical description is similar to the one proposed by the Friedel approach, except for a much faster decay as compared to noble metals due to the absence of electron backscattering in graphene (for more theoretical insight please refer to Section 3.10). On the other hand, at a bias voltage of −20 mV, graphene on the Cu(100) substrate as studied by Mallet et al.89 has produced a period similar to noble metals of 22 Å. Both these studies point to the importance of the substrate for the electronic properties of the studied surface.
An observation made in a recent study70 of rhombohedral trilayer graphene suggests that stacking domain walls may also cause the appearance of FOs. The authors have detected LDOS oscillations with a 1/r decay rate. In fact, the decay rate of these oscillations is consistent with the previously observed FOs from point defects and step edges, as well as a theoretical prediction for double-layer graphene. The FOs from point defects have a period of approx. 14 Å, only a little different from the previously mentioned graphene studies.
Kanisawa et al.87 have studied the InAs(111) surface grown on GaAs(111). According to their observation, the system fits into a 2D electron gas theoretical description similar to the one employed in the Avouris paper.4
Hofmann and co-workers73 have studied oscillations on Be(10![[1 with combining macron]](https://www.rsc.org/images/entities/char_0031_0304.gif) 0). Due to its nontrivial Fermi line, the Friedel oscillations are described by a non-trivial function much more complicated than our previous approximations (described in Section 1.4.2), and often requiring numerical integration.
0). Due to its nontrivial Fermi line, the Friedel oscillations are described by a non-trivial function much more complicated than our previous approximations (described in Section 1.4.2), and often requiring numerical integration.
Sprunger et al.81 have studied FOs on the Be(0001) surface. Within the FT-STM methodology, authors have found Fermi wavelength kF to be 0.945 Å−1, which agrees with the slightly anisotropic value of 0.93 and 0.96 Å−1 obtained by photoemission.96,97 However, anisotropicity of FOs and its link to the complexity of the Fermi surface of the media itself should be discussed more thoroughly (please see Section 2.7). The amplitude of the imaged oscillations, however, is much bigger than that observed for other metals and, therefore, as proposed by the authors, might be a result of electron–phonon coupling or a property of the Be electron gas.
In this regard, the observation made by Gawronski et al.98 is the most interesting. The authors explored a similar prospect of FOs. They have investigated inelastic Friedel-like oscillations stemming from the interaction of adsorbate vibrational modes with the surface. Dimers of dichlorobenzene adsorbed on Au(111) seem to produce FOs due to the coupling of molecular vibrations with surface phonons as supported by the IETS spectra and DFT calculations. The authors have debated that the Friedel-like patterns they have observed are a superposition of surface state electrons with scattered surface state electrons.43
A remarkable STM pattern has been obtained by Repp and Meyer.82 They have observed FOs on a bilayer NaCl/Cu(111) surface (Fig. 9(c)). The NaCl film confines the surface state of Cu(111), which results in a slightly bigger oscillation period of 19 Å (vs. 15 Å on the Cu(111) surface). Interestingly, the adsorption of neutral Au adatoms does not result in FOs for such NaCl surfaces. Such occurrence is apparently a result of neutral Au adatoms showing close to no interaction with an ionic lattice of the NaCl surface. On the other hand, applying pulse voltage and negatively charging such an Au adsorbate induces relaxation of the NaCl film and consequently allows for Au 6s electron state interaction with the surface state, resulting in an expected FO STM pattern. Using such a modified surface, the authors have managed to use STM to directly image electron states associated with the HOMO and LUMO of the adsorbed pentacene molecules. However, further discussion of this finding is outside the scope of this review.
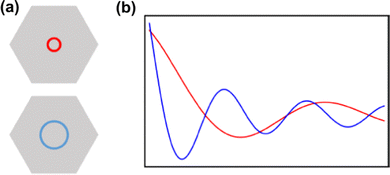 |
| | Fig. 11 The influence of the Fermi surface on the period of the FOs. (a) Schematic representation of the smaller (red) and bigger (blue) Fermi contours, (b) The FOs that arise from the corresponding Fermi contours. | |
2.7. Anisotropicity in FO observations
Before discussing the possible anisotropic character of FOs on some surfaces, we should first delve into how the Fermi surface of the material may affect the FOs. The smaller Fermi contour of the Fermi surface present in the reciprocal space of the metal means that one has fewer states per point of space. Therefore in real space, one would expect electrons to delocalize over farther distances, resulting in a bigger wavelength of the Friedel oscillations (Fig. 11).
Since in real materials the Fermi surface is not perfectly isotropic, the Fermi wavevector kF – the radius of the Fermi surface – is dependent on the direction. Therefore, the decay rate of Friedel oscillations may differ from what is predicted only from the dimensionality of the electron gas.99 Its connection with the oscillation period has been shown in Section 1.4.2. On the other hand, as noted by Xue et al.,71 the chirality of the Dirac electrons may result in faster decay of LDOS oscillations, i.e., instead of 1/r1/2 for noble metals, for graphene, there is 1/r3/2.
Anisotropy, which can manifest itself in locally flat sections of the Fermi contour, allows for much farther propagation of FOs along certain directions, and, therefore, as noted by Weismann et al.,68 should play an important role in surface phenomena. Anisotropic oscillations have also been directly observed in other studies.73,75,88 Weismann and co-workers68 have recorded cross-shaped FOs stemming from Co atoms below the Cu(100) surface (Fig. 12(a)). Interestingly, the anisotropy has only become visible at a very low bias voltage (10 mV).
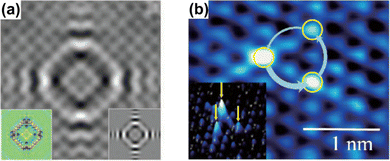 |
| | Fig. 12 (a) STM image of a single Co atom below the Cu(100) surface. The insets on the left and right show the calculation result using the Green's function approach and a DFT computation, respectively. Reprinted with permission from the work of Weismann et al.68 (b) STM image of the 1T-TiSe2 surface, showing chiral triangular FOs. The inset shows a three-dimensional picture. Reprinted with permission from the work of Ishioka et al.88 | |
Anisotropic oscillations arising from steps have also been observed by Hofmann et al.73 on the Be(10![[1 with combining macron]](https://www.rsc.org/images/entities/char_0031_0304.gif) 0) surface. They have found oscillations in two directions with a periodicity of approx. 4.7 Å and 10.0 Å along and perpendicular to the stacking line, respectively. The anisotropicity may be tracked back to its unusual Fermi surface plot43 – the Be(10
0) surface. They have found oscillations in two directions with a periodicity of approx. 4.7 Å and 10.0 Å along and perpendicular to the stacking line, respectively. The anisotropicity may be tracked back to its unusual Fermi surface plot43 – the Be(10![[1 with combining macron]](https://www.rsc.org/images/entities/char_0031_0304.gif) 0) possesses a disconnected surface-state pocket around a distant Ā point (shown in Fig. 13(a)). Such a pocket causes plane-wave-like ripples of charge density (visible in Fig. 13(b)) instead of the expected circular-wave pattern, thus signifying anisotropy. Moreover, it is reflected in the following formula of total charge density at a distance along the y-axis from a step, derived by Hofmann et al.:73
0) possesses a disconnected surface-state pocket around a distant Ā point (shown in Fig. 13(a)). Such a pocket causes plane-wave-like ripples of charge density (visible in Fig. 13(b)) instead of the expected circular-wave pattern, thus signifying anisotropy. Moreover, it is reflected in the following formula of total charge density at a distance along the y-axis from a step, derived by Hofmann et al.:73
| |  | (8) |
where
A is the area of the aforementioned surface-state pocket. At the same time, it is worth noting that for Be(0001), a circular, perfectly isotropic Fermi contour has been observed, resulting instead in circular Friedel oscillations.
81
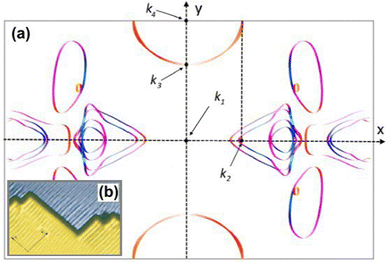 |
| | Fig. 13 (a) Unusual Fermi surface section of 24-layer Be(10![[1 with combining macron]](https://www.rsc.org/images/entities/char_0031_0304.gif) 0) calculated using Quantum Espresso 7.3100,101 with the SSSP PBEsol Precision v1.3.0 functional102 and visualised using FermiSurfer.103 Highlighted k-points: k2 = 0.64 Å−1, k3 = 1.33 Å−1, k4 = 1.75 Å−1. (b) Anisotropic Friedel oscillations due to steps on the surface visible only along the y axis. Reprinted with permission from the work of Hofmann et al.73 0) calculated using Quantum Espresso 7.3100,101 with the SSSP PBEsol Precision v1.3.0 functional102 and visualised using FermiSurfer.103 Highlighted k-points: k2 = 0.64 Å−1, k3 = 1.33 Å−1, k4 = 1.75 Å−1. (b) Anisotropic Friedel oscillations due to steps on the surface visible only along the y axis. Reprinted with permission from the work of Hofmann et al.73 | |
Fe films on W(001)99 have also produced an anisotropic, cross-like surface response due to the appearing quantum well states and resultant non-trivial Fermi surface. They showed anisotropic FOs that decay slower than 1/r3, with a period of approx. 10 Å in accordance with the previously developed theoretical model.104 Moreover, such oscillations are most pronounced along [110] and [1![[1 with combining macron]](https://www.rsc.org/images/entities/char_0031_0304.gif) 0] directions, and almost non-existent along [100] and [010] directions. Such a model, treating Friedel oscillations while a non-trivial Fermi surface is present, predicts the charge density shift at a large distance R from the impurity to be99,104
0] directions, and almost non-existent along [100] and [010] directions. Such a model, treating Friedel oscillations while a non-trivial Fermi surface is present, predicts the charge density shift at a large distance R from the impurity to be99,104
| |  | (9) |
where
k⊥1 is the component of
![[k with combining right harpoon above (vector)]](https://www.rsc.org/images/entities/i_char_006b_20d1.gif) 1
1 perpendicular to the Fermi surface,
C1 is the curvature at the point
![[k with combining right harpoon above (vector)]](https://www.rsc.org/images/entities/i_char_006b_20d1.gif) 1
1 measuring the flatness of the Fermi surface,
δ is the phase shift dependent on the scattering and the Fermi surface, and
t![[k with combining right harpoon above (vector)]](https://www.rsc.org/images/entities/i_char_006b_20d1.gif) 1;−
1;−![[k with combining right harpoon above (vector)]](https://www.rsc.org/images/entities/i_char_006b_20d1.gif) 1
1 is the scattering strength. The momentum vector
![[k with combining right harpoon above (vector)]](https://www.rsc.org/images/entities/i_char_006b_20d1.gif) 1
1 from the Fermi surface is chosen in such a way that its respective group velocity points in the same direction as the position vector
![[v with combining right harpoon above (vector)]](https://www.rsc.org/images/entities/i_char_0076_20d1.gif)
![[k with combining right harpoon above (vector)]](https://www.rsc.org/images/entities/i_char_006b_20d1.gif)
‖
![[R with combining right harpoon above (vector)]](https://www.rsc.org/images/entities/i_char_0052_20d1.gif)
.
Five years after the initial STM observations of FOs by Crommie et al.,2 Peterson et al.75 have conducted a similar study on Cu(111) and herringbone reconstructed Au(111) surfaces. At low temperatures and low bias voltage, they have observed an additional pattern in the FT-STM power spectrum around a point defect. Later, Schouteden et al. have also made a similar observation for the Au(111) surface.80 Both studies have attributed the second pattern to the bulk Fermi surface. Almost 20 years later, after the first report by Peterson et al., this statement has been debated by Sessi and co-workers.74 Similar to most experimental STM papers discussed in this review, they have focused on Cu(111), Ag(111), and Au(111) surfaces, known to exhibit an almost 2D nearly free electron gas quantum structure at the surface.5,25,31,74,95,105 Here, the authors have assigned the second ring to the surface states,43 based on photoemission data and ab initio calculations.66,74,106 Notably, the two rings they have observed merge into one at bias energies close to the Fermi level.74
Ishioka et al.88 have made a rather interesting observation of triangular FOs on the surface of 1T-TiSe2 (Fig. 12(b)). Unlike the previously proposed purely geometrical explanation,107 the authors believe that the answer lies within the collective electronic state of the surface.88 This study also presents a rather rare example of chiral Friedel oscillations, meaning direction-dependent charge oscillations.
2.8. Friedel oscillations caused by skyrmions
As exotic as it may seem for surface chemistry, magnetic skyrmions are spin-swirling solitonic defects that can significantly impact information technology in the near future.108 Their future in applications and devices depends on efficient manipulation and detection. In this study, the authors explore their nature as magnetic inhomogeneities in an otherwise unperturbed magnetic material, specifically a Fe layer covered by a thin Pd film and deposited on an Ir(111) surface, using ab initio methods (see Fig. 14). The presence of skyrmions induces scattering processes that give rise to Friedel oscillations, which mediate interactions among skyrmions or between skyrmions and other surrounding defects. Unlike their wavelengths, the amplitude of these oscillations is strongly influenced by the size of the skyrmion. By drawing an analogy with scattering off atomic defects, Bouhassoune et al.108 assign an effective scattering potential and phase shift to the skyrmionic particles, aiding in the prediction of their behavior using simple scattering frameworks. The induced charge ripples can be employed for noninvasive all-electrical detection of skyrmions, whether on a surface or buried a few nanometers away from the detecting electrode.
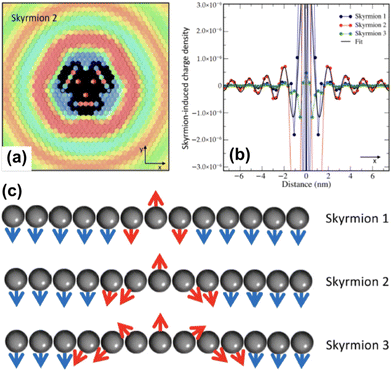 |
| | Fig. 14 Skyrmion-induced charge oscillations in PdFe/Ir(111). (a) Ring-like ripples surrounding Skyrmion 2 at 2.15 eV. Atop the skyrmion, the charge is extremely large and thus removed to observe the surrounding oscillations. (b) Comparison of the Friedel oscillations along the x-direction as a function of the size of the confined noncollinear spin-textures shown side-wise in panel (c). Reprinted with permission from the work of Bouhassoune et al.108 | |
2.9. Friedel oscillations in the superconducting films
Stosiek et al.109 experimentally analyzed Friedel oscillations (of period around 9 Å) appearing on a superconducting Al(111) surface (at 25 mK) due to both a non-magnetic Ar adatom and a magnetic Fe adatom. To properly describe superconducting features close and far from the impurities, the authors applied the Bogoliubov’de Gennes approximation to the attractive Hubbard model. Within this theoretical framework, they simulated two cases of thin (2D) and thick (3D) superconducting films. They found that for the thin film, the Friedel oscillations decay as 1/r instead of the expected 1/r2. On the other hand, for the thick film, the asymptotic of the decay was found to be at least as fast as 1/r3.
3. Physics behind Friedel oscillations
3.1. Original Friedel description
In 1958, Friedel showed that contrary to the well-known classical Thomas–Fermi model of the exponential decay of the charge density around a charged impurity, within the framework of the quantum scattering theory, there occur long-range spatial static oscillations of charge density around the impurity.1 The Friedel oscillations have first been explained using the scattering theory of the electron waves at the localized impurity. Without the impurity, we may assume that the electron wavefunction takes the following form of a plain wave110 dependent on the wavevector ![[k with combining right harpoon above (vector)]](https://www.rsc.org/images/entities/i_char_006b_20d1.gif) : ψ
: ψ![[k with combining right harpoon above (vector)]](https://www.rsc.org/images/entities/i_char_006b_20d1.gif) (
(![[r with combining right harpoon above (vector)]](https://www.rsc.org/images/entities/i_char_0072_20d1.gif) ) = exp(i
) = exp(i![[k with combining right harpoon above (vector)]](https://www.rsc.org/images/entities/i_char_006b_20d1.gif) ·
·![[r with combining right harpoon above (vector)]](https://www.rsc.org/images/entities/i_char_0072_20d1.gif) ). However, in the case of the spherically symmetric scattering potential, we may expand the scattered wave into the Legendre series,111 which results in the following equation:
). However, in the case of the spherically symmetric scattering potential, we may expand the scattered wave into the Legendre series,111 which results in the following equation:| |  | (10) |
where δl describes the phase shifts obtained due to scattering of the l-wave, jl(kr) and yl(kr) are the spherical Bessel functions94 and Pl(cos(θ)) is the Legendre polynomial.94 Of course, we can also expand the unperturbed plain wave in the same manner by putting δl = 0 for all orbital quantum numbers  thus
thus| |  | (11) |
Keeping in mind that often almost all of the phase shifts vanish, except the only one non-zero phase shift (δ0), we can calculate the difference between the spatial probability densities between the scattered and non-scattered wave functions:| | 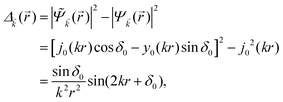 | (12) |
The above equation uses the fact that the spherical Bessel functions have closed analytic forms for l = 0 represented as j0(kr) = sin(kr)/(kr) and y0(kr) = −cos![[thin space (1/6-em)]](https://www.rsc.org/images/entities/char_2009.gif) kr/(kr). In order to calculate the total impurity-induced electron density change at position
kr/(kr). In order to calculate the total impurity-induced electron density change at position ![[r with combining right harpoon above (vector)]](https://www.rsc.org/images/entities/i_char_0072_20d1.gif) from the impurity, one has to account for all possible states within the energy region E ∈ [0, EF] (at the temperature T = 0 up to the Fermi energy EF; it starts from 0 due to the lack of other external potentials), thus arriving at eqn (13),
from the impurity, one has to account for all possible states within the energy region E ∈ [0, EF] (at the temperature T = 0 up to the Fermi energy EF; it starts from 0 due to the lack of other external potentials), thus arriving at eqn (13),| | 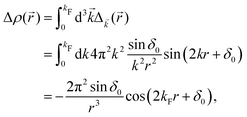 | (13) |
where kF is the Fermi wavevector roughly describing the radius of the Fermi ball in the reciprocal space, and it is related to the Fermi energy via the following relation:| |  | (14) |
Moreover, it is worth mentioning that eqn (13) agrees with the expression well-known and cited throughout the literature.7
3.2. Lang and Kohn jellium description: surface states considered as a special case of the general form of Friedel oscillations.
The result Lang and Kohn obtained is a small modification of the classical model expression| |  | (15) |
where a new parameter z0 appears, denoting the position of the image plane. Moreover, we may define the center of mass of the charge–density correction due to the external electric field zc, and in this particular case, those two parameters happen to be equal z0 = zc. However, in 1995, Finnis et al. found that those two parameters are indeed distinct, and they only coincide in the limit of the linear response theory – that is, the charge center of mass zc depends via the non-linear response on q, whereas the image plane z0 stays independent.112 Moreover, the image potential with the non-linear quartic term takes the form| |  | (16) |
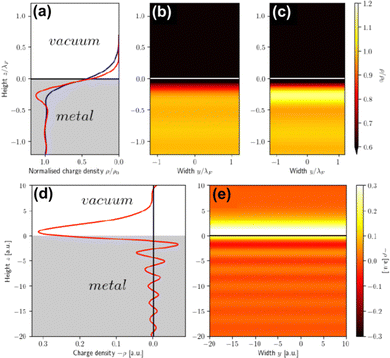
However, that was not the only result obtained by Lang and Kohn, as they also obtained the electron–charge–density profiles in two important cases: (1) simply due to the existence of the surface (being the impurity of the greatest contribution here), as depicted in Fig. 15(a)–(c), and (2) due to the applied uniform external electric field as presented in Fig. 15(d) and (e) – the Wigner (or Wigner–Seitz) radius rs is the parameter describing the electron density of the given metal in the bulk form and is defined as113
| |  | (17) |
where
N denotes the average number of electrons within the
V volume of the given metal bulk and
n =
N/
V is the electron density. We already may notice an oscillatory pattern which may also be called here as the Friedel oscillations – the surface-caused ones are also described by Levitov and Shytov.
15
 |
| | Fig. 15 (a) Normalized electron charge density distribution for the Wigner radii rs = 2 (blue) and rs = 5 (red). Their respective colormaps of the charge density distribution are shown in panels (b) and (c) for rs = 2 and rs = 5, respectively. Panel (d) shows correction to electron charge density due to the influence of any uniform external electric field in a jellium model for the Wigner radius rs = 2, while panel (e) depicts the corresponding colormap. Reproduced using data from the work of Lang et al.114,115 | |
3.3. Why Green's function approach?
In quantum mechanics, the description of any quantum system is fully based on its Hamiltonian Ĥ containing information on all possible interactions between different parts of the system. Let us start with a simple example of an electron in a hydrogen atom with the following Hamiltonian| |  | (18) |
where one can immediately see that the electron interacts only with a proton via the attracting Coulomb interaction  . In other words, we retrieved all essential information about the hydrogen atom just from the total energy operator Ĥ.
Because of the energy conservation law, we are interested only in the quantum states (eigenstates) ΨE conserving the total energy (eigenenergy) E. The standard procedure in such a situation is to solve the time-independent Schrödinger's equation
For some values of
E,
eqn (19) has solutions, but sometimes it does not – one can imagine the quadratic equation
ax2 +
bx +
c = 0 and recall that its number of solutions strongly depends on the coefficients
a,
b, and
c. Those permissible values of energy
E – for which
eqn (19) is solvable – form the spectrum of the Hamiltonian
Ĥ.
In the case of the hydrogen atom, we have a discrete spectrum, meaning that the permissible values of energy levels E form a well-separated energetic ladder. However, for metals or semiconductors (i.e. complex, extended systems) that are of particular interest when considering Friedel oscillations, these levels merge into conduction and valence bands. The spectrum of the Hamiltonian for such systems is continuous. Our simple free electron gas model has a continuous spectrum, and in general, if we have a very finely combed discrete spectrum, the usual approach is to replace it with an approximate continuous one as it is easier to approach from a mathematical point of view.
The main point here is that if we consider many-electron systems like molecules, then we can easily associate each electron with the corresponding energy eigenstate. However, in the case of continuous-spectrum systems, this becomes impractical. As we are interested in finding a universal way of describing both discrete- and continuous-spectrum systems, the Green's function approach is more applicable rather than repeatedly solving the Schrödinger equation for each eigenenergy.
Green's function can be defined as an inverse operator of a given Hamiltonian:116
where
ω is the probing parameter with which we “test” the given Hamiltonian
Ĥ. In functional analysis, usually, it is introduced to research the spectrum (
i.e., the set of eigenvalues) of a given operator simply by checking the analyticity of the resolvent operator (in this case
Ĝ).
117 The key idea here is that whenever
ω, colloquially speaking, hits the eigenvalue
λ, then Green's function is supposed to diverge in such a way that the numerator in the Laurent expansion
118 tells us right away about the eigenwavefunctions associated with the given eigenvalue
λ. The advantages of this approach and its mathematical details will become clear in the next sections. If one has a task of understanding the indirect interactions occurring through the surface, it seems obvious that taking into account the CDW or FOs is an essential step towards the successful solution. Derivation of a FO problem, such as mentioned in ref.
26,
48 and
119, has been known for decades, and it should not be too hard to apply the results of it to the exact problem. The reality, though, is much tougher than at first glance, and the introduction of any change into the mathematical model of this system meets huge analytical complications. It is relatively easy to deliver the solution for a system with spherical symmetry even in the
d-dimensional case (Section 3.4), although any symmetry lowering,
e.g., introducing a crystal periodic structure (Sections 3.5 and 3.6), complicates things drastically even if we consider the electrostatic interactions only (we explain the relationship between the interaction and its energy or Hamiltonian in Section 3.3 within the Green's function approach). If one wants to investigate FOs in the presence of more sophisticated interactions like RKKY interaction (the unprepared reader might think of it as simply the magnetic interaction), see Section 3.8, or two-body interaction, see Section 3.7.1. The aforementioned theory works for electron gas defined in a pretty abstract manner; thus the derived formalism should work as well for all systems with electron gas including graphene (Section 3.10). Section 3.11 is related to the dynamic CDWs or time-dependent FOs. We apologize in advance to anyone who might consider this part trivial.
3.4. Description of FOs induced in a d-dimensional free electron gas
It may seem trivial to some readers, but let us begin by defining the dimensionality d of the system to avoid any misunderstanding. Here, d represents the integer dimension of the system, excluding fractal dimensionalities, which may be non-integer.
Green's function satisfies the following equation:
| | (Ĥ − ω)G(d)0(![[x with combining right harpoon above (vector)]](https://www.rsc.org/images/entities/i_char_0078_20d1.gif) , , ![[y with combining right harpoon above (vector)]](https://www.rsc.org/images/entities/i_char_0079_20d1.gif) ) = −δ(d)( ) = −δ(d)(![[x with combining right harpoon above (vector)]](https://www.rsc.org/images/entities/i_char_0078_20d1.gif) − − ![[y with combining right harpoon above (vector)]](https://www.rsc.org/images/entities/i_char_0079_20d1.gif) ), ), | (21) |
where
δ(d)(
![[r with combining right harpoon above (vector)]](https://www.rsc.org/images/entities/i_char_0072_20d1.gif)
) is a generalised
d-dimensional Dirac delta.
120 We derived the general
d-dimensional form of Green's function to be
| |  | (22) |
where
H(1)d/2−1 is the Hankel function of the first kind of the order
d/2 − 1. Moreover, the Lindhard response function is given as
| | 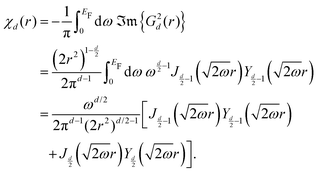 | (23) |
Rigorous proof of these two expressions is presented in Appendix A.1. For particular cases of
d = 1, 2, 3 (corresponding to typical 1D/2D/3D systems), explicit formulations of
(22) and (23) are presented in
Table 1. Visually, the response Lindhard functions are depicted in
Fig. 16. It is worth noting that for very localized defects/impurities, the resultant Friedel oscillations are of identical shape to the Lindhard functions.
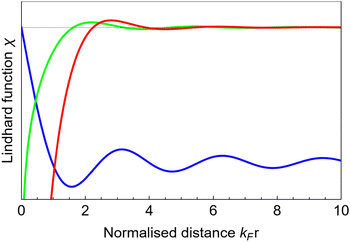 |
| | Fig. 16 Schematic plot of 1D (blue), 2D (green) and 3D (red) Lindhard response functions from Table 1. One can notice the decay being the slowest for the 1D case whereas the fastest for the 3D case. | |
Lindhard response functions are crucial as they are directly related to the charge density change via the following integral:
| |  | (24) |
where
V(
![[z with combining right harpoon above (vector)]](https://www.rsc.org/images/entities/b_char_007a_20d1.gif)
′) is the perturbing potential at point
![[z with combining right harpoon above (vector)]](https://www.rsc.org/images/entities/b_char_007a_20d1.gif)
′. In other words, the Lindhard function
χ0(
![[x with combining right harpoon above (vector)]](https://www.rsc.org/images/entities/b_char_0078_20d1.gif)
,
![[z with combining right harpoon above (vector)]](https://www.rsc.org/images/entities/b_char_007a_20d1.gif)
′) tells us how perturbation at point
![[z with combining right harpoon above (vector)]](https://www.rsc.org/images/entities/b_char_007a_20d1.gif)
′ affects the electrons at point
![[x with combining right harpoon above (vector)]](https://www.rsc.org/images/entities/b_char_0078_20d1.gif)
(and
vice versa). Then we sum over all possible points
![[z with combining right harpoon above (vector)]](https://www.rsc.org/images/entities/b_char_007a_20d1.gif)
′, and we obtain the total contribution towards charge density at point
![[x with combining right harpoon above (vector)]](https://www.rsc.org/images/entities/b_char_0078_20d1.gif)
.
Let us now see how we can use (24) for a delocalized potential like Coulomb electrostatic interaction (schematics of the vectors used above is presented in Fig. 17)
| | 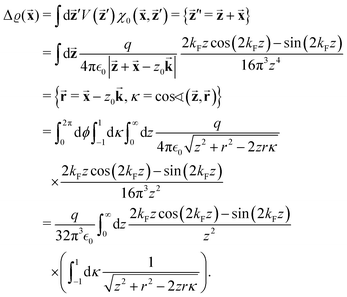 | (25) |
The integral over the cosine
κ is equal to
| |  | (26) |
thus we need to split the
z-integral into two parts 0 ≤
z ≤
r and
r ≤
z ≤ ∞, obtaining
| | 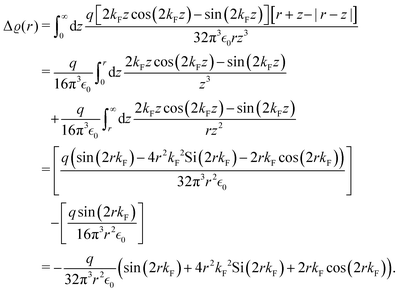 | (27) |
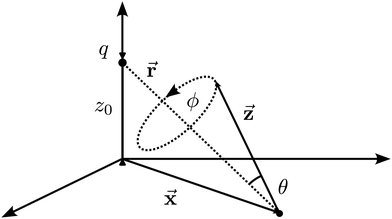 |
| | Fig. 17 Schematics of the introduced vectors and variables in formulas (25). | |
For large enough distances r we obtain
| |  | (28) |
where we indeed retrieve the same decay asymptotics as for the Dirac delta case.
3.5. Green's function of a d-dimensional ideal crystal
Let us start with a one-dimensional crystalline potential as a periodic function of coordinate against the distance from a chosen starting atom V(x) = V(x + a) (see Fig. 18(a)). In solid-state physics, an ideal, pure, or perfect crystal is defined as a crystalline material in which the constituent atoms, ions, or molecules are arranged in a perfectly ordered, repeating three-dimensional lattice structure. This means that every unit cell of the crystal is identical, and there are no defects or impurities within the structure. The lattice extends infinitely in all directions, and the periodic arrangement results in well-defined physical properties, such as symmetry, electronic band structure, and phonon dispersion, that can be described using crystallography principles and quantum mechanics. In practice, no real crystal is perfect, but the concept of an ideal crystal serves as a useful theoretical model for understanding the fundamental properties of crystalline solids. Some discussion exists about the validity of the definition of covalent bonding and the relationship between electron delocalization and covalent bonding.40
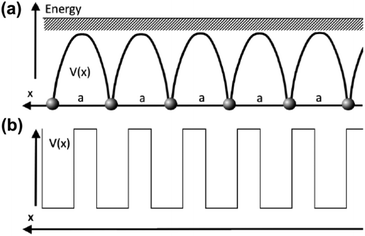 |
| | Fig. 18 1D crystal with an ideal translational symmetry: (a) model of an ideal (also referred to as pure in the literature) crystal and (b) Kronig–Penney model of a crystal. | |
If we assume translational symmetry of the crystal—meaning that Green's function will be dependent only on the relative position ![[R with combining right harpoon above (vector)]](https://www.rsc.org/images/entities/i_char_0052_20d1.gif) −
− ![[R with combining right harpoon above (vector)]](https://www.rsc.org/images/entities/i_char_0052_20d1.gif) ′—we get7
′—we get7
| |  | (29) |
and if we additionally assume the spherical symmetry of the
E(
![[k with combining right harpoon above (vector)]](https://www.rsc.org/images/entities/i_char_006b_20d1.gif)
) =
E(
k) function, then we obtain
| |  | (30) |
and for large enough distances
r the sin(
kr) oscillates so fast that the only contribution comes from the neighborhood of
k(
ω) (such that the equation
ω −
E(
k) = 0 ⇒
k(
ω) is satisfied for a particular
ω), henceforth we may apply the Sokhotski–Plemelj theorem
121| |  | (31) |
in order to approximate
(30) to a form
| |  | (32) |
That is exactly the result obtained by Villain
et al. in 2016 if we neglect differences in the normalization constant.
7 We would like to go a step further and explore the Lindhard functions and well-known dispersion relations obtained for various crystal lattices. In the above form, given the particular relation
k(
ω) dependent on the Fermi surface, one can obtain the Friedel oscillation form
via the below expression:
| |  | (33) |
The general expression for FOs
(33) reduces to the 3D result from
Table 1| |  | (34) |
when we apply the easiest 3D non-periodic spherical Fermi surface, for which

.
3.6. Green's function of a 1D Dirac–Kronig–Penney crystal
If one wants to include in a theoretical model more details of the crystal structure itself, then instead of an ideal crystal approximation (see Fig. 18(a)), which directly approximates the Fermi surface of a metal to a sphere (which is valid for alkaline metals mostly), one should introduce the periodicity via the Kronig–Penney model (see Fig. 18(b)). Firstly, this model was introduced as a periodic lattice of rectangular potentials.122 However, there exists a simpler model (i.e. with fewer free parameters) called the Dirac–Kronig–Penney (DKP) model, i.e. instead of the rectangular quantum wells, we have the Dirac potentials, as below:| |  | (35) |
Maleev obtained Green's function for the 1D DKP model in 1960.123 He described, in principle, the general procedure to obtain Green's function for a cubic 3D DKP model. However, the problem is that only the 1D result was somehow analytical (while not taking into account the hard reproducibility of the very lengthy and tedious calculations), and in higher dimensions, it is simply easier to model the systems numerically (just as Berezin did in 1986 with the calculation of effective electron masses for 1D, 2D and 3D DKP models124). Fortunately, Kasamanyan obtained the final result for 1D DKP Green's function in 1972.47 However, to use it in any other context, one needs to repeat Maleev's procedure. Unfortunately, it turned out to be hardly generalizable except for the case of the Shah function (i.e., the sum of equally spaced Dirac deltas). Kasamanyan's result47 is as follows:| |  | (36) |
where  is an auxiliary variable introduced to simplify the expression. The above Green's function describes the propagation between 0 ≤ x0 ≤ a and r points in a crystal of the lattice constant a,
  is the integer index, and P = λa/2 is the renormalized crystal-potential strength. Except for this very formula, to the best of our knowledge, there is no other analytical description of the Kronig–Penney models in d ≥ 2-dimensions.
3.7. Formal description of surface-mediated interactions between adsorbates
Although it may appear straightforward, the previous paragraph described Friedel oscillations around a single perturbation (adsorbate). However, what happens when there are multiple perturbations or the presence of external fields or inhomogeneity in the electron gas? Analyzing adsorbate self-assembly, catalytic activity, on-surface reactions, and electronic and magnetic structures (schematically depicted in Fig. 19) would be incomplete without incorporating the interaction term into the system's Hamiltonian.
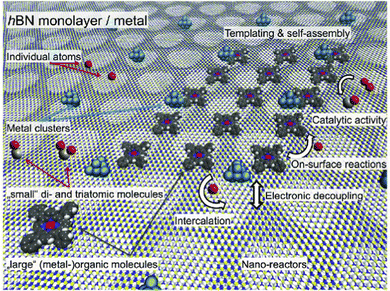 |
| | Fig. 19 An artistic representation of adsorbates (atoms, clusters, molecules) interacting with a superstructured, surface-supported hBN monolayer (depicted in blue and yellow). The right side highlights key functionalities of the hBN/metal interfaces, such as templating, electronic decoupling, catalytic activity, and intercalation. For interpretation of the color references in this figure legend, please refer to the web version of this article. Reprinted with permission from the work of Auwärter.125 | |
Apart from the simplified approximate expression for the FOs detailed in the previous paragraph, there is also a second popular description of the FOs devised by Hyldgaard and Persson often used in the experimental literature.8 The authors started with the Shockley-type surface-state bands, and by using the scattering T-matrix, they obtained some approximate results for the two- and three-body interactions between the adsorbates on the metallic surface. Below, we dive deeper into the possible interactions they published.
3.7.1. Two-body interaction.
As we could see earlier, the Friedel oscillations depend on the system's dimensionality. However, even though a thick metallic surface is three-dimensional, due to the abrupt breaking of lattice symmetry, surface states appear (localized close to the surface layer), besides bulk states. For example, the (111) surfaces of noble metals do form the 2D nearly free electron gas (NFEG),5 meaning that one could expect the 1/r2 asymptotic decay of the Friedel oscillations. In 1999, Hyldgaard and Persson derived the adsorbate–adsorbate interaction mediated by the Shockley-type surface state,43 which may be expressed as (between two adsorbates i and j being apart at distance dij)8| |  | (37) |
where EF is the Fermi energy measured from the bottom of the Shockley state (i.e. the kinetic energy of the electrons in such a state),  is the associated Fermi wavevector, m* is the effective mass of the considered band and δF is the standard Fermi-level phase shift. They derived the above equation in the following way: for an interference-related density of states (DOS) difference, we obtain
| |  | (38) |
where  denotes
  and Ti(E) functions denote the T-matrices characterizing the scattering from the i-th adatom, whereas G0(E) is a one-electron Green's function for the bare surface. Fortunately, we can approximate the above integral as below:
| |  | (39) |
where t0(E) is an s-wave T-matrix function defined as| |  | (40) |
3.7.2. Three-body interaction.
Hyldgaard and Einstein126 also described the case of the 3-body interaction between adsorbates. They found that the three-body interaction term is of the following form:| |  | (41) |
where we introduced  as a shape-dependent dimensionless ratio and d123 = d12 + d23 + d31 is the traversed distance by electrons scattered by all three adsorbates (which is a leading-order factor in this interaction).
3.8. Roth and RKKY interaction
Since real electrons possess spins and are not solely described by electrostatic interactions, we should begin by introducing the interactions between spins. It is crucial to explain why it is so complex and remains analytically unachieved to derive Friedel oscillations for magnetic particles with spin. However, the Ruderman–Kittel–Kasuya–Yosida (RKKY) effect provides deep insight into how two spins interact with each other. Therefore, we encourage the readers to delve into the following analytical formulation of the problem, despite its complexity.
Ruderman and Kittel119 derived an indirect interaction between two spins through conduction-band electrons given as follows:
| |  | (42) |
where
![[S with combining right harpoon above (vector)]](https://www.rsc.org/images/entities/i_char_0053_20d1.gif) i
i,
![[S with combining right harpoon above (vector)]](https://www.rsc.org/images/entities/i_char_0053_20d1.gif) j
j are the relevant interacting spins, |
Δ|
2 is the strength of the hyperfine interaction,
m* is the effective electron mass inside the crystal and
kF is the Fermi momentum. The quantity

is introduced to generalize the problem for any quantum system, but for the above case it is
| |  | (43) |
The interesting feature of this Hamiltonian is that the coupling constant between two spins oscillates with distance; therefore it does explain ferro- and antiferromagnetic order observed in rare-earth metals where the direct exchange is negligible. The already mentioned Ruderman–Kittel–Kasuya–Yosida (RKKY) interaction was generalized to a non-spherical Fermi surface by Roth
et al. in 1966.
119,127 We will present here the most important two edge cases: (1) flat part and (2) cylinder region of the Fermi surface. For the flat part, we obtain the following expression for the indirect interaction:
| |  | (44) |
and for the cylinder part
| |  | (45) |
where
A is the area of the flat region,
L is the length of the cylinder and

is the average value of the auxiliary quantity

over the considered regions. The
z-axis is defined as being along the
![[r with combining right harpoon above (vector)]](https://www.rsc.org/images/entities/i_char_0072_20d1.gif)
direction, and points
![[k with combining right harpoon above (vector)]](https://www.rsc.org/images/entities/i_char_006b_20d1.gif) 1
1,
![[k with combining right harpoon above (vector)]](https://www.rsc.org/images/entities/i_char_006b_20d1.gif) 2
2 are respectively the lowest and highest points of the considered Fermi surface. Vectors
![[v with combining right harpoon above (vector)]](https://www.rsc.org/images/entities/i_char_0076_20d1.gif) 1
1,
![[v with combining right harpoon above (vector)]](https://www.rsc.org/images/entities/i_char_0076_20d1.gif) 2
2 are their respective
z-axis-projected normal vectors (see
Fig. 20). Roth
et al.127 demonstrated that, contrary to expectations based on the d-dimensional case of Friedel oscillations, in certain three-dimensional quantum systems, if the Fermi surface contains lower-dimensional components (such as flat or cylindrical sections), the decay of the RKKY interaction—and by analogy, the Friedel oscillations—is slowed or dampened, leading to “slower” decay and persistence over longer distances.
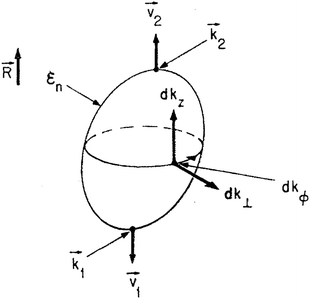 |
| | Fig. 20 Explanation of the symbols used in eqn (39) and (40). Reprinted with permission from the work of Roth et al.127 | |
3.9. Tight-binding models of carbon chains
Su, Schrieffer, and Heeger in 1979128 presented a simplified tight-binding model to describe quantum-mechanically solitons in polyacetylene chains. Using their Hamiltonian, we may write the lattice Green's function for the 1D cumulene chain (one atom in the unit cell, thus the first Brillouin zone defined as k ∈ [−π, π]) in the following form straightforwardly from the definition:| |  | (46) |
with substitution we get z = exp(ik) and then| |  | (47) |
The roots of the denominator are as follows:| |  | (48) |
and if  then both roots lie exactly on a unit circle |z−| = |z+| = 1. However, if we consider a limit ω → ω + i0, then we can notice that z− always lies within the unit circle, whereas z+ is placed outside. Therefore
| | 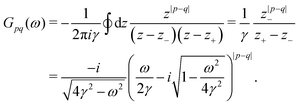 | (49) |
Let us check what is the electron density throughout the chain—if we assume one electron per carbon, then we get a half-filled molecular orbital, and thus our Fermi energy EF = 0 when the spectrum goes like E ∈ [−2γ, 2γ]. Thus, we get (as expected)
| |  | (50) |
Let us introduce a new variable
z− = exp(
iθ) ⇒
ω = 2
γ![[thin space (1/6-em)]](https://www.rsc.org/images/entities/char_2009.gif)
cos
![[thin space (1/6-em)]](https://www.rsc.org/images/entities/char_2009.gif) θ
θ. Then we can rewrite Green's function in the following way:
| |  | (51) |
| |  | (52) |
and the Lindhard function is defined below:
| | 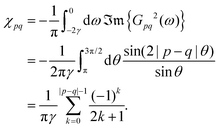 | (53) |
In the limit of very far distanced sites from each other
| |  | (54) |
3.10. Graphene case
Until now, we have focused almost exclusively on metals. Now, we introduce graphene. Graphene is a two-dimensional system which, with some degree of simplification, can be considered as a metallic system; however, it is a unique material with quite unusual behavior of FOs. It has the ability to exhibit Friedel oscillations, similar to all systems with a two-dimensional electron gas, but decays faster. Interestingly, the interactions of adsorbents change character depending on whether they belong to the same or the other sublattice.
3.10.1. Dynamical polarisation of graphene.
Wunsch et al.129 calculated dynamical polarisation of graphene exactly for any frequency ω, wavevector q and doping within the random-phase approximation (RPA) framework14 to the first order. The aforementioned dynamical polarisation can be split into two parts| | | Π(1)(q, ω) = Π(1)0(q, ω) + ΔΠ(1)(q, ω). | (55) |
The former part is independent of the chemical potential μ| |  | (56) |
where vF = 3aτ/(2ħ) ≈ 9 × 10⁵ m s−1 is the velocity corresponding to the Fermi energy within graphene, a ≈ 1.42 Å corresponds to the nearest-neighbor distance and τ ≈ 2.7 eV is the hopping energy between neighbors. The latter part describes any doping-related processes (characterized by the chemical potential μ) and is equal to| | 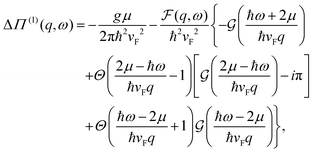 | (57) |
where g = gSgV = 4 describes the total spin-valley degeneracy and Θ(x) is the Heaviside-theta function defined as| |  | (58) |
We also define additional functions below:| |  | (59) |
| |  | (60) |
Screening of either charged or magnetic impurities lies in the static limit (ω → 0) for which we obtain the following form for the undoped graphene where the chemical potential μ = 0:| |  | (61) |
The first term is related to the long-wavelength (q ≪ 2kF) behavior and it is called the Thomas-Fermi term. The second term instead introduces a discontinuity in the first derivative and is responsible for the Friedel oscillations we observe.
3.10.3. Different long-range interactions in graphene depending on a sublattice.
In 2009, Shytov et al.132 described the theory of the long-range interaction between adatoms in graphene with the 1/r asymptotic decay using the tight-binding approximation. It appears that this interaction is of a different type than the standard Friedel-oscillation-mediated one (for which we know that if it is mediated by the surface-state electrons, then the decay of Friedel spatial oscillations is 1/r2, whereas for the bulk-state mediated interaction, the decay is 1/r3). In graphene, as it is well-known, there are two sublattices A and B, and the authors considered the interaction between adatoms in two cases: (1) when both adatoms reside on the same sublattice (case denoted by AA) and (2) when they reside on different sublattices (case denoted by AB). The interaction between them in the first case is described by the following formula:| |  | (64) |
and in the second case| |  | (65) |
where ![[K with combining right harpoon above (vector)]](https://www.rsc.org/images/entities/i_char_004b_20d1.gif) denotes the wavevector of graphene's K-point, δ is the energy of adatom resonance (in other words describing the detuning of resonance from the Dirac point), v0 is the electron Fermi velocity, W is the electron half-bandwidth, and K0 and K1 are the modified Bessel functions of the second kind.94 The above integral may be significantly simplified if we notice that the Bessel functions might be approximated by their asymptotic, leading to the following expression for the same-sublattice repulsive interaction (AA case)
denotes the wavevector of graphene's K-point, δ is the energy of adatom resonance (in other words describing the detuning of resonance from the Dirac point), v0 is the electron Fermi velocity, W is the electron half-bandwidth, and K0 and K1 are the modified Bessel functions of the second kind.94 The above integral may be significantly simplified if we notice that the Bessel functions might be approximated by their asymptotic, leading to the following expression for the same-sublattice repulsive interaction (AA case)| |  | (66) |
and the attractive interaction for different sublattices (AB case)| |  | (67) |
Both the above analytical expressions are shown in Fig. 21.
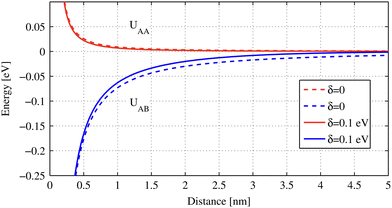 |
| | Fig. 21 Plot of the repulsive (61) and attractive (62) parts of the adatom–adatom indirect interaction through graphene vs. distance. Energy δ is associated with the adatom resonance. Reprinted with permission from the work of Shytov et al.132 | |
3.11. FOs caused by an external magnetic field
Rusin and Zawadzki133 investigated FOs caused by an external magnetic field. They presented an analytic procedure using the exact renormalized single-particle Green's function obtained via summation of the corresponding Dyson series. They showed the procedure's validity on a simple example of the 2D free electron gas, and later employed it for two cases: (1) monolayer graphene and (2) group-VI dichalcogenides. Their FO results seem to be valid for a wide range of physical parameters such as potential strength, magnetic field, and distances. It appears that for weak impurity potentials, the amplitude of FOs is proportional to the impurity potential strength. However, they also found that given a specific set of parameters, the total charge density becomes negative, contradicting the electric neutrality of the whole system – therefore, their single-particle procedure has limitations, and in the aforementioned case, the interacting fermionic system should be used instead.
3.12. Applied linear response theory
In 2005, Silkin et al.134 described the so-called induced charge–density (ICD) oscillations at the Cu(111) surface within the linear response theory. They were caused by an external perturbing charge. The innovation here was to split the Cu electron structure into two parts: the 3D bulk electrons and s–pz surface state43 denoted as the 2D electron system. They found that in both electron systems, the charge density distribution decays as 1/r2, but for the periodically time-varying potential, they got decay asymptotics of the form 1/r. Expressions for the charge density distributions are as below:| |  | (68) |
| |  | (69) |
where k2DF is the 2D-surface Fermi wavevector and v2DF is the corresponding 2D-surface Fermi velocity. In 2006,135 they moved to the general description of the (111) noble metal surfaces (in this particular case Ag(111)) for which they got the checker-like structure close to the very surface caused by both 2D- and 3D-system responses, and there also appeared an interesting off-angle peak of charge–density–change going deep into the Ag bulk at an angle of ≈45° due to only the 3D bulk electrons. Furthermore, in 2010,136 they described the complete procedure of obtaining their results, which is mostly numerical. It consists of the following points: (1) obtaining the reliable z-dependent pseudo-potential of the metal bulk with the surface, (2) computing the wavefunctions from Schrödinger's equation with the potential from (1), (3) determining the Lindhard response function from the definition (i.e. they calculate the integral numerically with the η parameter cutoff set to be η = 1 meV), and lastly (4) by repeating this integral in a self-consistent manner. The induced charge density can be described by the following equation:| |  | (70) |
where ![[r with combining right harpoon above (vector)]](https://www.rsc.org/images/entities/i_char_0072_20d1.gif) is the position we probe for the charge density,
is the position we probe for the charge density,  is any point from which the electron propagates to
 ![[r with combining right harpoon above (vector)]](https://www.rsc.org/images/entities/i_char_0072_20d1.gif) ,
,  is the Lindhard response function describing how the potential at
  contributes to the charge density at
 ![[r with combining right harpoon above (vector)]](https://www.rsc.org/images/entities/i_char_0072_20d1.gif) , and finally
, and finally  is the external potential (here caused by an external impurity). The Lindhard response function is expressed in the following way:
| |  | (71) |
where ϕ denotes the z-dependent wavefunctions obtained from the aforementioned pseudopotential, ij denote the band indices, ![[k with combining right harpoon above (vector)]](https://www.rsc.org/images/entities/i_char_006b_20d1.gif) ‖ is just a 2D-surface wavevector, fi(
‖ is just a 2D-surface wavevector, fi(![[k with combining right harpoon above (vector)]](https://www.rsc.org/images/entities/i_char_006b_20d1.gif) ‖ +
‖ + ![[q with combining right harpoon above (vector)]](https://www.rsc.org/images/entities/i_char_0071_20d1.gif) ‖) is the Fermi function describing the probability of an electron being in a state i and with the wavevector
‖) is the Fermi function describing the probability of an electron being in a state i and with the wavevector ![[k with combining right harpoon above (vector)]](https://www.rsc.org/images/entities/i_char_006b_20d1.gif) ‖ +
‖ + ![[q with combining right harpoon above (vector)]](https://www.rsc.org/images/entities/i_char_0071_20d1.gif) ‖, ω is the probing energy, and
‖, ω is the probing energy, and ![[q with combining right harpoon above (vector)]](https://www.rsc.org/images/entities/i_char_0071_20d1.gif) ‖ is the particular wavevector. The meaning of the above formula is to measure how much an electron would scatter from a given potential with the wavevector change
‖ is the particular wavevector. The meaning of the above formula is to measure how much an electron would scatter from a given potential with the wavevector change ![[q with combining right harpoon above (vector)]](https://www.rsc.org/images/entities/i_char_0071_20d1.gif) ‖ at a probing energy ω.
‖ at a probing energy ω.
3.13. Dynamical charge and spin waves
Until this very point, we mostly discussed the statically caused Friedel oscillations; however, we mostly do encounter dynamic systems. Thus, Poyli et al.137 in 2018 investigated the dynamical response to an external oscillating dipole (of the dipole moment μ = 1e nm and emitting radiation of wavelength λ = 35 μm) in thin (i.e. of thickness d = 10 nm) topological insulators (TIs).138 They modeled such a TI via a sandwich model, where we have a thin slab of insulator (with relative electric permittivity  ) with two 2D Fermi liquids (i.e. 2D interacting electron gases describing the typical state of the majority of metals at low enough temperatures)48 on both sides. They obtained two interesting things (in terms of this review): (1) when the dipole oscillates close to the TI (i.e. at a distance of 5 nm), then the charge density oscillations (of wavelength ≈100 nm) on those two sides are in counter phase; however when the dipole is instead far from the TI (i.e. at about 150 nm), then we can notice the oscillations (of wavelength ≈1000 nm) to be in phase instead, and (2) they also obtained the charge- and spin-density 3D plots, showing the oscillatory decaying patterns, which are also presented in Fig. 22. Plots of surface charge density distributions are shown in Fig. 22 for both cases. Moreover, we may notice that in the former case (i.e. of the dipole close by), we obtain almost zero average charge density, but the spin-density oscillations do not vanish, whereas in the latter case (i.e. of the dipole far away), we get the reverse situation – the average spin-density is almost non-existent, while the average charge-density is quite apparent. Furthermore, we may relate those quantities by the following simple formula:
| |  | (72) |
where sT is the spin-density, vF is the Fermi velocity, u/b denotes the upper/bottom side (for which we also have −/+), q is the wave vector and ω is the frequency.
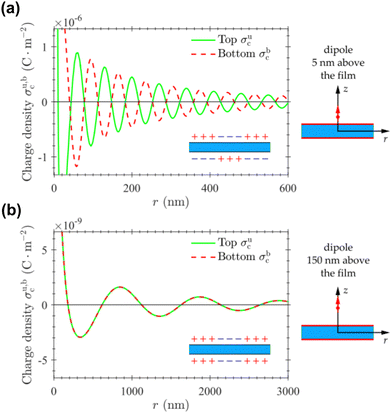 |
| | Fig. 22 Surface charge density distribution plots for the oscillating dipole placement (a) 5 nm and (b) 150 nm above the film. We can also notice the amplitude difference to be 3 orders of magnitude. Reprinted with permission from the work of Poyli et al.137 | |
4. Conceptual bridge: FOs in π pi-conjugated systems
Friedel oscillations arise due to the large enough electron delocalization within a considered molecule or quantum system (please see Appendix A.2 for different delocalization measures). The most obvious candidates for such a system are metals; however, strongly conjugated π-electron systems should also be considered. For example, a prediction of charge density waves in conjugated π-electron systems has been introduced as early as 1968 in a paper by E. W. Fenton139 to explain the bond alteration in long polyenes. In this section, we show how FOs appear in such carbon chains. To illustrate some effects and provide the basis for an in-depth discussion of FOs, we have performed some textbook Hartree–Fock and density functional theory calculations for selected long carbon chains. The details of these calculations can be found in Appendix A.3. Finally, we make a connection with the mesomeric effect observed in various organic molecules.12
4.1. Terminus-induced FOs in unperturbed polyene
Friedel oscillations appear in systems characterized by a delocalized electron structure. Thus, they could also be present in any molecule with conjugated bonds. Canuto et al.6 have shown a similarity in charge density oscillation on metal surfaces and a well-known phenomenon of atom-wise alternating charges (i.e., alternating polarity) in polyene chains for both unperturbed and perturbed cases. They have presented the charge–density oscillations for both unperturbed and perturbed cases. The oscillatory pattern in polyenes appears already at the Hückel theory level as well as at free electron level approximation, thus revealing the origin of the oscillations to be atom–atom polarizabilities.6
In fact, such charge distribution is to be expected from experimental chemistry, given the varying reactivity for the different atomic positions along the chain. Interestingly, the charge oscillation of the non-neutral chain does not follow the expected atom-wise character and depends on the electron density instead—meaning that for a chain with M sites and N free electrons, the period of oscillations becomes equal to λ = 2Ma/N = a/r, where a is the lattice constant.6
Our calculations on the unperturbed chain also show clear oscillations caused by the termini – acting as perturbations (Fig. 23(a)). The perturbation is highly localized on both ends of the polyene chain, decaying towards the center. The presence of the terminus-induced FOs in half-filled-band structures (such as polyene, cumulene, and polyyne) shows that a simple tight-binding model alone is not enough to describe precisely the electronic structure of open carbon chains. Here, for the filling factor r = 0.5 (half-filled band), tight-binding predicts no charge density oscillations. However, oscillations readily appear for other filling factors. For example, the pattern shown as a dashed line in Fig. 23(c) has been obtained with r = 10/16, meaning a total of 10 free electrons in the C16 carbon chain. This number has been chosen as the closest to 0.5 ≡ 8/16, which also preserves the mirror symmetry, requiring an even number of electrons and has maxima placed at the chain ends. However, such an FO case is nicely reproduced if the π-electron system is treated more like the free electron gas, which has also been shown by Canuto et al.6
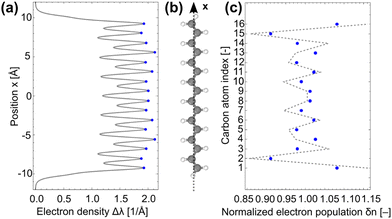 |
| | Fig. 23 (a) π-Orbital electron density oscillation present on carbon atoms of the polyene chain C16H18 shown in panel (b), calculated along the x-axis. Panel (c) features the corresponding integrated normalised atomic charges140 on each carbon atom (blue) and open-boundary tight-binding fit141 for the filling factor r = 10/16 (gray dashed line). | |
4.2. Perturbation-induced FOs in long carbon chains
4.2.1. Polyyne and cumulene as models of long-chained molecules.
As mentioned previously, FOs are most pronounced in the case of one-dimensional quantum systems (please see Fig. 16). In fact, the FOs observed for the one-dimensional Dirac–Kronig–Penney crystal model (for more details, please see Section 3.6) could also manifest in existing conjugated long-chain molecules. Good examples of the molecules that satisfy this condition are cumulene and polyyne carbon chains, having all-double and alternating single–triple bonds, respectively. Given the sufficient chain length, these two molecules could be treated as approximations to the ideal crystal case, presented in Section 3.5, and can be described theoretically either within a tight-binding framework or as a Dirac–Kronig–Penney crystal (Section 3.6). Cumulenes and polyynes also satisfy another important condition – they are well-studied systems from both experimental (synthesis) and theoretical perspectives. This makes them the perfect candidates to compare the physical phenomenon of FOs against chemical knowledge.
4.2.2. Differences between the computed FOs in the polyyne and cumulene case.
In the case of cumulene and polyyne molecules, the conjugated 2p carbon electrons effectively form a 1D electron gas. An external charge (q = −0.5e, −1.0e, −1.5e, −2.0e) located 10 Å away from the terminal carbon atom induces charge–density oscillations inside the molecule presented in Fig. 24. Indeed, in both cases, the Friedel oscillations' decay asymptotics has a 1/r behavior, as expected for the 1D electron gas. Its amplitude linearly depends on the external charge (Fig. 24) following the theoretical part of this review (for more details, please refer to Section 1.4.2). On the other hand, for both structures, the corresponding wavelength is strictly related to the C–C distance instead of the Fermi wavelength (related to the Fermi energy).
 |
| | Fig. 24 Panels (a) and (b) show the oscillation pattern obtained for the π-orbital electron density of cumulene and polyyne C100 chains, respectively, induced by −e/2 external point charge located 10 Å away from the terminal carbon atom. The actual calculations are shown in red, while the blue line represents the fitted 1D Friedel model (eqn (67)) truncated after the last right maximum for the sake of clarity. Fitting parameters are presented in Table 2. The insets show the dependence of the strength of charge oscillations (determined by the amplitude of the third positive maximum) on the magnitude of the external point charge. As expected from the linear response theory, the relationship is linear and crosses zero in both cases. | |
The charge oscillations can be described by the well-established simplified fit (eqn (7)) discussed in Section 1.4.2 (also depicted as blue continuous curves in Fig. 24):
| |  | (73) |
where
σ0 describes the amplitude of the Friedel oscillations,
kF is a Fermi wavevector,
δF is a Fermi phase shift, and
x0 sets a starting point. The fitting parameters obtained for the external point charges {−
e/2, −
e, −3
e/2, −2
e} for both cumulene and polyyne are shown in
Table 2.
Table 2 Fitting parameters for the charge density curves of both cumulene and polyyne C100 chains shown in Fig. 24
| External point charge q |
−e/2 |
−e
|
−3e/2 |
−2e |
| Cumulene |
Polyyne |
Cumulene |
Polyyne |
Cumulene |
Polyyne |
Cumulene |
Polyyne |
| Amplitude σ0 [e Å−2] |
0.037 |
0.017 |
0.074 |
0.033 |
0.111 |
0.047 |
0.151 |
0.067 |
| Fermi wavevector kF [Å−1] |
1.232 |
1.213 |
1.232 |
1.214 |
1.232 |
1.214 |
1.228 |
1.215 |
| Fermi phase shift δF [rad] |
−1.619 |
1.532 |
−1.554 |
1.475 |
−1.478 |
1.445 |
−1.056 |
1.419 |
| Starting point x0 [Å] |
64.77 |
38.82 |
64.77 |
38.87 |
64.77 |
38.95 |
64.86 |
38.87 |
Under its strong π-bond conjugation, the oscillations for the cumulenic structure are approximately two times larger amplitude-wise (σ0) as compared to those obtained for the polyyne molecule. This difference can be explained by the metallicity of long-chain cumulenes142,143 and semi-conductivity of long-chain polyynes,142,143 resulting in different band gaps, here understood as the HOMO–LUMO gap. For metals, the band gap between the conductive band and the valence band is zero, causing a much higher free charge carrier density than for semiconductors with wider band gaps. This results in metallic conductivity being much larger than for semiconductors.
Moreover, the Fermi wavevector kF fit is independent of the point charge size (as it is characteristic of the system itself) and is equal to 1.23 Å−1 and 1.21 Å−1 for cumulene and polyyne, respectively. These are related to the average bond length 〈|C–C|〉 for cumulene (1.275 Å) and polyyne (1.292 Å). The formula relating these two quantities is
| |  | (74) |
which straightforwardly describes that moving to the neighboring carbon atom makes a π rad ≡ 180° change in phase. It directly corresponds to the atom-wise charge alternation related to the law of alternating polarity.
6 Chemically, the external negative point charge pushes out the electron density from the closest carbon atom, thus polarising the nearest C–C bond. Such polarization then propagates farther down the chain
via the mesomeric effect alternatingly.
Usually, the Fermi phase shift δF could tell us how hard the potential is—that is, for the soft potential, we would get small δF ≈ 0, whereas for the hard one δF ≈ π/2. Both physical intuition and quantum-chemical data agree on the first positive maximum being placed at the closest carbon atom. Therefore, as we fit both the starting point x0 and the Fermi phase shift δF, their values are intertwined with each other, and on their own, discrepancies between them do not possess any further meaning. Therefore, in this case, the latter does not reflect any physical characteristic of the material.
It is also worth mentioning that instead of the simplest free-electron–gas approximation viaeqn (73), one could, in principle, use the Dirac–Kronig–Penney model described in Section 3.6. This is demonstrated in Appendix A.4. This approach deserves further studies.
4.2.3. Relationship of FOs and delocalization measures.
Quantifying electron delocalization is a long-standing problem, and many indices have been developed.144–147 Among them, the one most extensively used is the delocalization index (DI). Despite its accuracy in the prediction of aromaticity, its physical legitimacy has been debated.148 On the other hand, a recently derived electron delocalization range (EDR)17 function appears not to have such limitation and may be used to connect the FO theory with delocalization in chemical systems. For details on DI and EDR and discussion on the latter's advantages, please refer to Appendix 7.2. The conjugated π-orbital system in polyynes results in a set of carbon pairs with triple bonds – formed with orthogonal px and py orbitals of both atoms – separated by single bonds. On the other hand, the double bonds in cumulenes are constructed via alternating px and py orbitals. In both cases, such similar π-conjugated orbitals result in the similarity of both averaged  profiles (see blue and red lines in Fig. 25). However, EDR shows that electrons delocalize slightly more in cumulene over large distances than in polyyne. Owing to the success of free-electron gas approximation in describing FOs in both systems, it is not surprising that the EDR profile for the 3D free electron gas has a very similar shape as the EDRs for actual molecules (see the black line in Fig. 25).
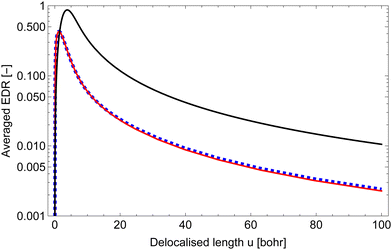 |
| | Fig. 25 Plot of the averaged EDR function obtained for cumulene (dashed blue line) and polyyne (solid red line) at various delocalization lengths u. The black solid line refers to the analytical 3D free-electron–gas result obtained assuming kF = 1.223 Å−1. | |
The DI results agree with the EDR and allow us to investigate delocalization mechanisms in the two systems studied, as well as directly relate delocalization effects with FOs. The first-neighbour π-DIs (i.e., between the 1st and 2nd carbon atoms, etc.) throughout the chain reflect the expected bond structure for both cumulene (uniform double bonds) and polyyne (alternating single and triple bonds) (Fig. 26(a) and (d)). The second-neighbour π-DIs (i.e. between the 1st and 3rd carbon atoms, etc.) do not differ much between the considered carbon chains (due to the symmetry reasons) (Fig. 26(b) and (e)), but the third-neighbour π-DIs (i.e. between the 1st and 4th carbon atoms, etc.) show a vast discrepancy in behavior between the two (Fig. 26(c) and (f)). For cumulene, the third-neighbour π-DIs asymptotically converge to a constant value (Fig. 26(c)), whereas for polyyne, the third-neighbour π-DIs oscillate instead (Fig. 26(f)). This can be explained by the fact that in this case, the DIs are taken over either two single bonds with one triple bond (≈0.02 electrons shared), or vice versa (≈0.12 electrons shared), as the delocalization between two triple bonds is expected to be much stronger than between two single bonds. Interestingly, though, the average of asymptotes for both cumulene and polyyne third-neighbour π-DIs is quite similar (0.07 vs. 0.08 shared electrons), indicating that the same overall charge is delocalized over π bonds in both structures, meaning that it is a characteristic value for p orbitals in sp-hybridized carbon chains. For the free electron gas, any n-neighbour DI should be constant throughout the chain, implying that cumulene better fits this description, as in polyyne the delocalization between the conjugated triple bonds becomes hindered by single bonds. Therefore, the differences in DIs explain larger amplitudes of FOs observed for the cumulene chain as compared to the polyyne chain of the same size.
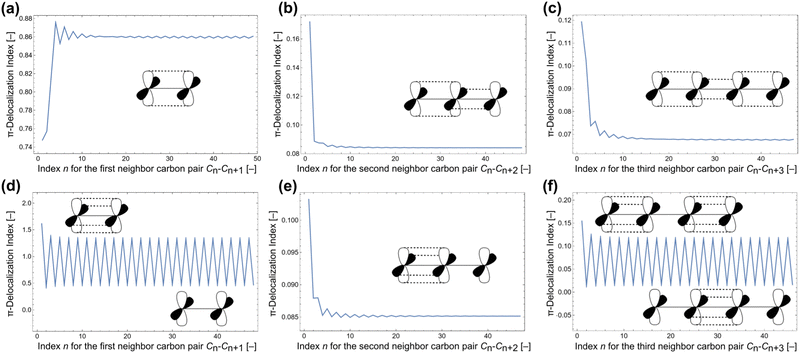 |
| | Fig. 26 π-DI of C100 cumulene obtained for (a) Cn–Cn+1 carbon–carbon pairs (first neighbors), (b) Cn–Cn+2 (second neighbors), and (c) Cn–Cn+3 (third neighbors). Similar π-DI plots for C100 polyyne are shown in panels (d)–(f), respectively. The insets show the local atomic orbital overlaps for the region where the DI value is calculated. | |
Perturbation-induced FOs should be relevant in conductance studies of linear molecules. Indeed, the effect of single bonds mentioned above may also explain different conductance trends in cumulenes and polyynes. The former is known to become more conducive with a longer chain,149 probably because of a decreasing HOMO–LUMO gap. Polyynes, on the other hand, show a decrease in conductance with longer chain sizes.149 This may reflect an increase in the number of single bonds in the chain that hinder delocalization and cooperatively dump any long-range charge oscillations.
4.3. Mesomeric effect
Friedel oscillations and charge alteration in long, conjugated organic molecules are representations of the same phenomenon. A similar effect can be observed in low-weight organic compounds such as α,β-unsaturated carbonyl, and it has a profound impact on their reactivity. These species represent a typical case of a conjugated carbon system perturbed by a heteroatom—oxygen in this case. In terms of FOs, heteroatoms act as impurities that perturb the electronic state of the molecule.
The chemical properties of the α,β-unsaturated carbonyls may be explained by drawing mesomeric structures, i.e., the graphical representation of the electron delocalization effect (see Fig. 27(a)). In this approach, the molecule is assumed to be a superposition of all of its mesomeric structures. In the presented case, the susceptibility to the attack of electron-rich species appears to be the result of a more positive charge present on these atoms due to electron delocalization via the conjugated bonds, perturbed by the O orbitals, similar to what would be expected from the FOs.150
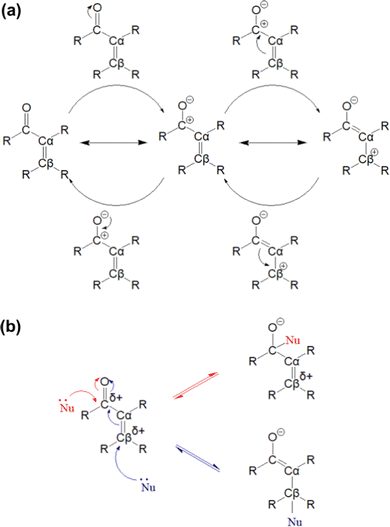 |
| | Fig. 27 (a) Three mesomeric structures of the α,β-unsaturated carbonyl compounds, showing the origin of the partial positive charges on the carbonyl carbon atom and β carbon atom. Structures at the top or bottom depict the mechanism the electron density takes to create a new mesomeric structure of the same molecule. Stands for a radical and is a notation typically used in chemistry as a functional group abbreviation. (b) Representation of electronic structure-based chemical properties of β carbon and carbonyl carbon atoms in α,β-unsaturated carbonyls, showing their affinity to negatively charged species. “Nu” is a typical abbreviation for a nucleophilic (electron-rich) entity. Blue and red arrows show the attack on the β carbon and carbonyl carbon atoms, respectively, and subsequent electron rearrangement. | |
It is well-known that both carbonyl and β carbon atoms are susceptible to a nucleophilic attack (see Fig. 27(b)), meaning that the atom directly bonded to the O atom and the third closest carbon atom are more positively charged. Although this is well expected for the former case due to strong polarization caused by the adjacent oxygen atom, it is not true for the Cβ atom.
5. Numerical studies
5.1. Perspective on using the density functional theory for FO studies
Investigating Friedel oscillation-related effects via density functional theory (DFT), which is a powerful computational quantum mechanical modeling method, presents significant challenges. While DFT allows one to study the electronic structure of systems with considerable accuracy (owing to appropriate approximate functional choice), it encounters significant problems related to the periodic boundary conditions: interferences caused by neighboring cells in the periodic boundary conditions typically used in DFT calculations. These interferences can mask the true nature of the oscillations, making it difficult to discern their genuine properties. A recent study by Scivetti et al.151 explores the electrostatics of metallic surfaces under periodic boundary conditions for Ag, Li, and Al beyond the linear response regime, offering insights into these complex phenomena and promoting the development of new semiclassical methodologies to address surface-related challenges.
Besides the periodic boundary conditions, another primary difficulty lies in the scale of the models required for a relevant description of such a long-range effect. To accurately capture these oscillations, especially in metallic systems, models must be exceptionally large, often exceeding 1000 metal atoms or requiring extremely large unit cells. Such extensive models are necessary to ensure that the oscillations are not artificially influenced by the boundaries of the simulation cell, which can lead to erroneous results. The limitations of current computational resources further exacerbate these challenges. Simulating large models with high precision demands substantial computational power and memory. While there are continuous advances in supercomputing and novel algorithms, the stage where such extensive DFT calculations can be performed routinely and efficiently is not yet reached. Despite these difficulties, ongoing research in the field holds promise.
One example often explored via periodic DFT modeling in the context of FOs is graphene due to its unique 2D structure. It can serve as a model system to study impurities on surfaces. Parq et al.152 investigated how ionized metal adsorbates on graphene can function as point-charge impurities to examine the charge response of graphene with its Dirac cone band structure (Fig. 28). The authors focused on the physics behind the metal–atom-induced charge and spin polarization in graphene by modeling the scanning tunneling spectroscopy (STS) simulations based on DFT calculations. Their findings indicate that a Cs atom on graphene is fully ionized, displaying a significant band-bending feature in the STS, whereas the charge and magnetic states of Ba and La atoms on graphene are more complex due to orbital hybridization and Coulomb interaction. Other studies focus on the effects of the crystallographic planes and crystal parameters with respect to the FOs. For example, Li and co-workers153 studied in-depth single dimensionality FOs near Al(100), (110), and (111) surfaces (Fig. 29(a)). The results align well with the theoretical predictions for the Kronig–Penney crystal (Fig. 29(b)). Tang and co-workers154 have determined that in the Mg(10![[1 with combining macron]](https://www.rsc.org/images/entities/char_0031_0304.gif) n) series, the structures with low Miller indices show less stability than their higher-index counterparts. Interestingly, they have found that FOs may be responsible for local relaxation in such low-index surfaces (see Fig. 30).
n) series, the structures with low Miller indices show less stability than their higher-index counterparts. Interestingly, they have found that FOs may be responsible for local relaxation in such low-index surfaces (see Fig. 30).
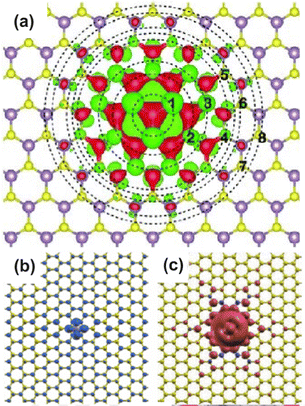 |
| | Fig. 28 (a) Schematic representation of the wave function interference of two defect sites in a crystal lattice. Reprinted with permission from the work of Kazeev et al.155 Panels (b) and (c) correspond to DFT-computed isosurface plots of charge density around a metallic impurity on graphene obtained with the local-spin-density approximation (LSDA) and the generalized gradient approximation (GGA), respectively. Reprinted with permission from the work of Parq et al.152 | |
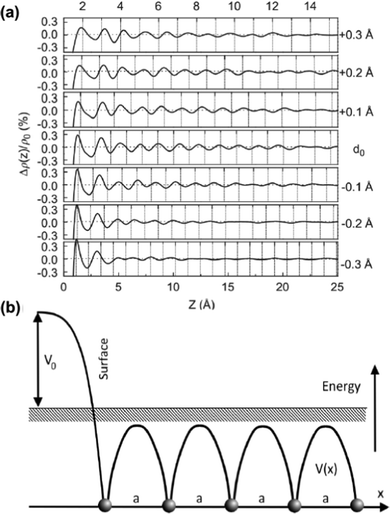 |
| | Fig. 29 (a) FOs within the surface-truncated Al(110) bulk for various interlayer distances d0 along the ref. 108 direction, taken in steps of 0.1 Å. The z axis denotes the distance from the surface to the bulk, and the top abscissa depicts the index of the atomic layers. Reprinted with permission from the work of Li et al.153 Panel (b) depicts a mathematical model of the surface of a crystal or a half-infinite space.16 | |
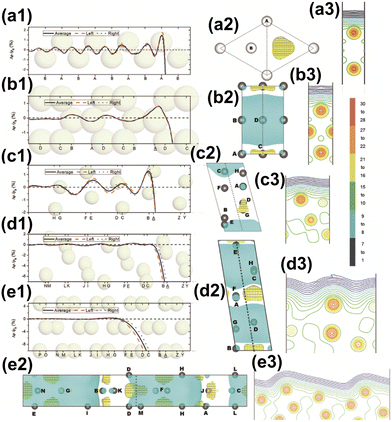 |
| | Fig. 30 Friedel oscillations as a function of the depth z are shown for (a1) Mg(0001), (b1) Mg(10![[1 with combining macron]](https://www.rsc.org/images/entities/char_0031_0304.gif) 0), (c1) Mg(10 0), (c1) Mg(10![[1 with combining macron]](https://www.rsc.org/images/entities/char_0031_0304.gif) 1), (d1) Mg(10 1), (d1) Mg(10![[1 with combining macron]](https://www.rsc.org/images/entities/char_0031_0304.gif) 3) and (e1) Mg(10 3) and (e1) Mg(10![[1 with combining macron]](https://www.rsc.org/images/entities/char_0031_0304.gif) 8). Subsequent top-down views of charge transfer are presented for (a2) Mg(0001), (b2) Mg(10 8). Subsequent top-down views of charge transfer are presented for (a2) Mg(0001), (b2) Mg(10![[1 with combining macron]](https://www.rsc.org/images/entities/char_0031_0304.gif) 0), (c2) Mg(10 0), (c2) Mg(10![[1 with combining macron]](https://www.rsc.org/images/entities/char_0031_0304.gif) 1), (d2) Mg(10 1), (d2) Mg(10![[1 with combining macron]](https://www.rsc.org/images/entities/char_0031_0304.gif) 3) and (e2) Mg(10 3) and (e2) Mg(10![[1 with combining macron]](https://www.rsc.org/images/entities/char_0031_0304.gif) 8). Cross-sectional views of charge densities are displayed for (a3) Mg(0001), (b3) Mg(10 8). Cross-sectional views of charge densities are displayed for (a3) Mg(0001), (b3) Mg(10![[1 with combining macron]](https://www.rsc.org/images/entities/char_0031_0304.gif) 0), (c3) Mg(10 0), (c3) Mg(10![[1 with combining macron]](https://www.rsc.org/images/entities/char_0031_0304.gif) 1), (d3) Mg(10 1), (d3) Mg(10![[1 with combining macron]](https://www.rsc.org/images/entities/char_0031_0304.gif) 3) and (e3) Mg(10 3) and (e3) Mg(10![[1 with combining macron]](https://www.rsc.org/images/entities/char_0031_0304.gif) 8). The topmost surface layer is indicated with an underline. In the charge transfer sections specifically in graphs (a2), (b2), (c2), (d2), and (e2) light blue and yellow squares represent charge depletion and accumulation in the surface region. The color bar illustrates the logarithmic range of charge densities from low (blue 1) to high (red 30), and the charge density value for a specific line can be obtained by the formula ρ = 0.001 × 2n/2. Reprinted with permission from the work of Tang et al.154 8). The topmost surface layer is indicated with an underline. In the charge transfer sections specifically in graphs (a2), (b2), (c2), (d2), and (e2) light blue and yellow squares represent charge depletion and accumulation in the surface region. The color bar illustrates the logarithmic range of charge densities from low (blue 1) to high (red 30), and the charge density value for a specific line can be obtained by the formula ρ = 0.001 × 2n/2. Reprinted with permission from the work of Tang et al.154 | |
We must mention that some DFT studies of FOs suffer from an unfortunate lack of computational detail, with some only briefly mentioning their final results. For example, Stepaniuk et al.5 stated: in contrast, our ab initio calculations are in perfect agreement with the experimental data, and predict a first minimum of the interaction energy, without mentioning the source for such conclusion. In another work, Weismann et al.68 did not present sufficient calculation details to reproduce the results.
5.2. Perspectives for machine-learning models
Machine learning (ML) discovery was awarded with the Nobel Prize in 2024 for its transformative impact on scientific progress and its ability to solve complex problems across various fields.
Recent ML studies155 indicate that using sparse representation along with graph neural networks allows for significantly boosted accuracy and decreased computational cost compared to other ML models. The authors investigated the oscillatory dependency of formation energies on the distance between defects in MoS2 with one Mo and one S vacancy. They have utilized sparse MEGnet to replicate the results from DFT calculations efficiently, as shown in Fig. 31.
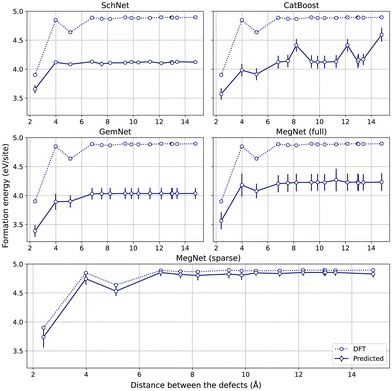 |
| | Fig. 31 The dependency of formation energies on the distance between defects in MoS2 with one Mo and one S vacancy obtained with neural network approaches (SchNet, CatBoost, GemNet, MagNet) and DFT. Reprinted with permission from the work of Kazeev et al.155 | |
Another interesting study reports on a universal machine learning framework and training protocol for learning nonlocal functionals, combining equivariant convolutional neural networks with the weighted-density approximation.156 The approach was applied to several 1D and quasi-1D systems, demonstrating that functionals with identical hyperparameters achieve high accuracy across diverse systems.156 These examples included hard-rod fluid, the inhomogeneous Ising model, the exact exchange energy of electrons, orbital-free DFT electron kinetic energy, and liquid water with 1D inhomogeneities.
The development of AI is predicted to significantly influence the modeling of surface phenomena, offering new possibilities for more efficient and accurate simulations. However, it is crucial to emphasize the importance of proper benchmarking and thorough analysis of machine learning results to avoid potential artifacts. Careful validation of ML models ensures that the predictions are reliable and free from misleading results.
5.3. Hubbard chain
Vieira and co-workers157 have investigated the charge density and magnetization density profiles of one-dimensional metals using two complementary many-body methods: numerically exact (Lanczos) diagonalization and the Bethe–Ansatz local-density approximation, both with and without a simple self-interaction correction. They found that, depending on the magnetization of the system, local approximations could reproduce different Fourier components of the exact Friedel oscillations. We should stress that the oscillatory pattern obtained by Vieira et al.157 (see Fig. 32) shows a very similar character to the atom-wise charge alternating oscillation for polyenes (Fig. 23). We believe that this stems from the similarity between the electron systems.
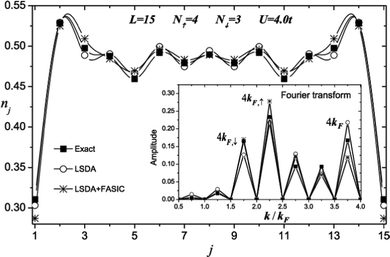 |
| | Fig. 32 Electron density oscillations generated by termini in a Hubbard 15-atom chain. Reprinted with permission from the work of Vieira et al.157 | |
6. Conclusions and future outlook
In this review, we have examined the phenomenon of Friedel oscillations from three perspectives: physical, chemical, and computational. The physical perspective offers a robust theoretical framework for analyzing Friedel oscillations' origin, properties, and peculiarities in various abstract setups, beginning with J. Friedel's seminal work in 1958.1 The chemical perspective encompasses numerous systems that facilitate experimental studies of Friedel oscillations, such as through STM imaging. We have also shown that FOs dictate the reactivity of systems that feature electron delocalization. The computational perspective employs the most contemporary methodologies, requiring both physical and chemical perspectives to verify computational results and avoid artifacts while also providing tools for predicting the behavior of complex systems. This constitutes a challenge in itself.
Despite the distinct terminologies used by physicists and chemists, we have identified areas in chemistry where the Friedel oscillation framework can offer valuable insights, such as in electron delocalization. We have aimed to create a seamless, textbook-like experience to enhance interdisciplinary collaboration and unify efforts. Additionally, the field of chemistry offers opportunities for developing new physical models and challenges existing ones.
In the context of FOs, when approaching a chemical system with the intention of using physical tools to obtain an initial viable approximation, one should begin by assessing the dimensionality of the system and identifying any existing symmetries. For instance, in the case of metallic alloys, a 3D bulk model with point impurities is appropriate when the concentration of one metal significantly exceeds that of others. Conversely, for surface adsorption scenarios, the system is typically two-dimensional. Depending on the objectives, one might start by considering cylindrical symmetry around the adsorbate molecule.
Long π-conjugated carbon chains that were the subject of the current review can be represented with the simplified one-dimensional model of Su–Schrieffer–Heeger (SSH).128 Here, the physical model disregards the presence of hydrogen atoms and the complex atomic structure surrounding carbon atoms. It assumes one electron per carbon atom, with an associated energy when localized on a carbon atom and an energy when the electron hops between atoms. Under this model, cumulene is represented as an evenly spaced one-dimensional atomic chain, while polyyne is modeled as a one-dimensional atomic chain with alternating bond lengths. This approach demonstrates that cumulene could behave as a metal (due to the absence of a band gap), whereas polyyne could act as a semiconductor with an open band gap.
As discussed extensively in the current work, Friedel oscillations are a phenomenon arising from the Fermi liquid of electrons158 formed in metallic systems. Unlike tight-binding models,16 which require electrons to be localized solely on atomic sites, models such as the nearly free electron model allow for greater freedom. This results in the appearance of oscillations in response to an external perturbation of the system. We have presented many experimental examples where FOs appear on the STM images. Usually, they manifest themselves as concentric rings of electron density with the intensity sinusoidally oscillating with decreasing amplitude as their radii increase. Such an electron density pattern is similar to the mesomeric effect in chemistry. Unlike the latter, the Friedel oscillations travel in three dimensions and do not necessarily result in atom-wise charge alteration. The three-dimensional character of Friedel oscillations is also apparent from the STM pictures,77 showing the oscillatory pattern generated by the point defect below the materials' surface.
While Friedel oscillations have traditionally not been attributed to the chemical properties of nanoparticles and surface chemistry, recent studies have begun to explore this possibility.5,8,21–25,41,55–61,105 Various theoretical models of FOs, such as the widely used Hyldgaard and Persson theory,8 are being used to describe the spacing between adsorbates. One has to bear in mind that in the case of molecular adsorbates, the dipole–dipole and dipole-mirror dipole interactions become important, especially at separation distances below 3 nm.41 Therefore, an appropriate theoretical model should take this into account.
A 2016 paper by Villain et al.7 may be a good start to understanding the theory of FOs. However, it only scratches the surface of the interesting theoretical parts, leaving only the not-so-popular approximation of the 3D pure crystal and its resultant FOs.
We have noticed several experimental papers73,99 showing a hint of the theoretical explanation, but usually, it seems too short (to the point of not being understandable) and quite vague. Silkin's book chapter136 provides a much better description of the methods than the papers alone,134,135 but the employed physical model seems to be questionable. For the latter, the floating 2D electron gas above the half-infinite 3D metallic bulk has been considered, and the reproducibility level seems quite low due to the high dependence on the system's pseudopotential. Riechers et al.49 have shown the experimental potential and sense of probing the FOs in the 1D ultra-cold fermionic gas, but that is more of a conceptual study (or the data-analysis method proposal) rather than the actual theory or experiment. Furthermore, Khotkevych et al.159 have shown the real application of those FOs in terms of the proper STM imagining – that is, e.g., the real-space image of FOs should not be considered while trying to obtain the Fermi line or that even the STM tip also may induce oscillations in the investigated sample.
In 2008, Affleck et al.160 investigated an interesting case of magnetically induced FOs via the Kondo effect.161 They have shown nontrivial dependence of charge density oscillations on distance, especially in a range close to the Kondo length scale. For small distances r, standard Friedel oscillations from the point impurity are obtained, but with increasing distance, the phase shift changes accordingly from 0 to π/2. Moreover, this paper mentions an important fact that the Kondo nontrivial effect would not appear in the STM energy-resolved image; however, it should after integrating over the energies (i.e. for the total charge density distribution as the Kondo effect appears only in the energy dependence).
The findings of Roth et al.127 show by analogy that even within 3D systems, if some parts of the Fermi surface are flat or cylindrical, then the decay of Friedel oscillations should also be slower and dictated by respectively 1/r and 1/r2 instead of typical 3D 1/r3. Unfortunately, the derivations presented are also quite challenging to reproduce directly.
Cheianov et al.130 and Shytov et al.132 disagree on the decay type of the interaction on graphene. Cheianov et al. claim the 1/r3 decay of the FOs on monolayer graphene due to the strong influence of electron chirality. In contrast, Shytov et al. describe a new 1/r Friedel-resembling interaction between adsorbates via the graphene surface. Gawronski et al.98 and Silkin et al.134 have described an interesting case of stronger Friedel oscillations coming from the coupling to the acoustic phonon mode. In terms of describing the FOs straightforwardly from the crystal Green's function, Villain7 has given a good concise explanation that could be useful if the shape of the particular Fermi line is already known. However, in 1960, Maleev123 described a mathematical procedure, which got him the DKP Green's function for a 1D Dirac–Kronig–Penney crystal model.47 But the problem is that his procedure only works due to the Shah function (being a sum of equally spaced Dirac deltas) transforming almost into itself via the Fourier transform. In contrast, we generally do not have such a nice property. Of course, for some physical insights, his procedure may be used. But, mostly, it is reduced to just numerical computations.
Although some theoretical parameters of FOs may be obtained with photoemission studies, the STM studies of FOs are more common as they allow for direct observation of the phenomenon from the STM pictures or the dI/dV images. Using STM alone allows one to obtain a Fermi wavevector as half a radius of the first concentric ring around a point defect on the surface and the oscillation period as a spacing between the said concentric rings. Moreover, owing to the new experimental technique called IETS (inelastic electron tunneling spectroscopy)162 one can even obtain d2I/dV2 images which can differentiate the type of contribution into Friedel oscillations, just as in the case of the inelastic phonon contribution.98
The FO concept may have broad applications when describing systems with highly delocalized electrons. The response to the disturbing agent (e.g., point charge) depends on the degree of electron delocalization. We expect this fact to be explored in new delocalization descriptors with broad applicability. In principle, these can be simply based on charge analysis; however rigorous theoretical framework is still to be developed.
In this review (see roadmap in Fig. 2), we aimed to show the reader that the chemical implications of FOs cannot be appropriately considered without analytical, physical models (rooted in physics) and numerical simulations (rooted in computational physics and chemistry). As we have mentioned in the introduction, charge density oscillations are given various names depending on the field of study. We believe that a unified terminology throughout the plethora of already-established descriptions is the first step to a new common theory that links chemical reactivity with the physical properties of the systems studied. However, there is an increasing need for an accurate theoretical description of FOs that can be readily transformed into a working code. Unfortunately, reliable calculations using conventional techniques (such as DFT) on chemically relevant systems (such as catalyst surface) require prohibitively large molecular models (due to bulk cuts or large unit cells). Such calculations borderline the currently available computational power.
In 2024, machine learning (ML) discovery was awarded with the Nobel Prize for its transformative impact on science, with recent studies156 showcasing the benefits of sparse representation and graph neural networks for improved accuracy and reduced computational cost, while new ML frameworks for nonlocal functionals demonstrated high precision across systems, and AI's potential to revolutionize surface modeling underscores the need for proper benchmarking and careful analysis to avoid artifacts and ensure reliable results.
We feel that there is an urgent need to develop FO theory (covering long-range oscillations) that can be readily interfaced with existing approximate quantum chemical methods (such as DFT covering complex local electron density changes due to impurities). Such theory can be then used in hybrid quantum mechanical/molecular mechanical calculations (QM/MM), where the MM part is covered with the new FO theory. We note that starting from the original Friedel description,1 modern physical methods have made a qualitative leap and rely on Green's function formalism to model FOs. Unlike the partial-wave Friedel approach, the latter provides a much more compact analytical solution. The Green's function approach is taking its rightful place as a powerful tool to predict and model surface interactions to gain insights into the origin of cooperative catalysis and surface chemistry. This will be a presiding theme of a series of articles we are about to publish.
Author contributions
AS – conceptualization, formal analysis, methodology, supervision, validation, visualization, writing – original draft, review & editing; TB – formal analysis, methodology, data curation, investigation, visualization, writing – original draft; JP – formal analysis, methodology, data curation, investigation, visualization, writing – original draft; AK – conceptualization, formal analysis, methodology, supervision, validation, writing – review & editing, funding acquisition, resources.
Data availability
Quantum chemical calculations presented in this review were performed only for illustrative purposes and all data necessary to repeat them are presented in the Appendix, Section A.3.
Conflicts of interest
There are no conflicts to declare.
Appendix
A Appendix
A.1. Technical derivation of the d-dimensional functions.
From the definition we obtain for the d-dimensional system116| |  | (75) |
| |  | (76) |
where ∇d2 is the d-dimensional Laplace operator and δ(d) is the d-dimensional Dirac delta. Let us notice that this equation is spherically invariant, thus it is natural to introduce the spherical coordinates with r = |![[x with combining right harpoon above (vector)]](https://www.rsc.org/images/entities/i_char_0078_20d1.gif) −
− ![[y with combining right harpoon above (vector)]](https://www.rsc.org/images/entities/i_char_0079_20d1.gif) |. This approach allows to deliver the following:
|. This approach allows to deliver the following:| |  | (77) |
where the factor Ωdrd−1 comes from the differential volume form dV = Ωdrd−1dr, Dirac delta satisfies (from the definition) δ(d)(![[r with combining right harpoon above (vector)]](https://www.rsc.org/images/entities/i_char_0072_20d1.gif) ) = Ωdrd−1δ(r), and we use the radial term for the Laplacian in d dimensions. In the region where r > 0 and the Dirac delta is zero, we obtain instead
) = Ωdrd−1δ(r), and we use the radial term for the Laplacian in d dimensions. In the region where r > 0 and the Dirac delta is zero, we obtain instead| |  | (78) |
If we substitute G0(d)(r) = f(r)r1−d/2, we get the modified Bessel differential equation94| |  | (79) |
with the following general solution:| |  | (80) |
where we have the Bessel function of the first kind  94 and the second kind
  .94 The asymptotic series associated with the above function is given below (for large enough r → ∞):
| |  | (81) |
where the phase shift ϕ0 = (d − 1)π/4. Thus the boundary condition  is satisfied as long as d ≥ 1. However, we also require the analytic continuation118 (in our case defined by replacing
  with
with  ) to satisfy the boundary condition, meaning
| |  | (82) |
and we impose on the divergent terms (as r → ∞) to cancel out (because the propagator, i.e. Green's function between two points, should at least decrease to the finite value while the distance increases to infinity, otherwise it would be unphysical)| |  | (83) |
thus we get ![[c with combining tilde]](https://www.rsc.org/images/entities/i_char_0063_0303.gif) 1 = −i
1 = −i![[c with combining tilde]](https://www.rsc.org/images/entities/i_char_0063_0303.gif) 2 ⇒ c1 = −ic2 and Green's function takes the form
2 ⇒ c1 = −ic2 and Green's function takes the form| |  | (84) |
where  is the Hankel function of the first kind.94 Let us now consider the short-distance asymptotic instead for d = 2
| |  | (85) |
and for general d ≠ 2| |  | (86) |
where C2 and Cd are just some constants dependent only on the dimension d. The Dirac delta affects the normalization, thus we need to integrate the equation over the ball B(0, R):| |  | (87) |
Let us analyze the second part of formula (87)| |  | (88) |
where  is a finite constant defined as
| |  | (89) |
where G(d)0;div(r) denotes the divergent part of Green's function G(d)0(r) as r → 0. Therefore we are allowed to drop the second part of formula (87) and consider only its first part written down here| | 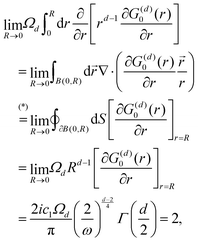 | (90) |
where in the (*) in formula (90) the Gauss' divergence theorem was applied (which is applicable in the distributional sense) as| |  | (91) |
because the singular support is contained in the neighborhood of the ball's center:| |  | (92) |
Plugging in the ansatz we obtained, the following form emerges for d = 2:| |  | (93) |
and for different d ≠ 2:| |  | (94) |
| |  | (95) |
where we used the relation  . Therefore it appears that both of the abovementioned cases can be incorporated into the general formula:
| |  | (96) |
and for which we may obtain the Lindhard response function being equal to (assuming d ≠ 1):| | 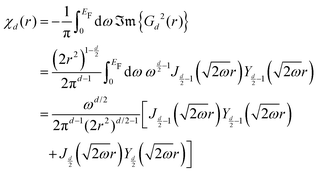 | (97) |
A.2. Quantifying electron delocalization as an analog for “chemical” carrier or electron gas.
A.2.1. Introduction into DI vs. EDR.
In order to properly discuss both descriptions of electron delocalization, first we need to introduce auxiliary functions derived from the electron wavefunction. For any N electron quantum system described by the wavefunction Ψ(![[r with combining right harpoon above (vector)]](https://www.rsc.org/images/entities/i_char_0072_20d1.gif) ,
, ![[r with combining right harpoon above (vector)]](https://www.rsc.org/images/entities/i_char_0072_20d1.gif) 2,…,
2,…, ![[r with combining right harpoon above (vector)]](https://www.rsc.org/images/entities/i_char_0072_20d1.gif) N) we can introduce non-local one-electron density matrix defined as
N) we can introduce non-local one-electron density matrix defined as| |  | (98) |
which diagonal terms are electron density ϱ(![[r with combining right harpoon above (vector)]](https://www.rsc.org/images/entities/i_char_0072_20d1.gif) ) ≡ ϱ1(
) ≡ ϱ1(![[r with combining right harpoon above (vector)]](https://www.rsc.org/images/entities/i_char_0072_20d1.gif) ;
;![[r with combining right harpoon above (vector)]](https://www.rsc.org/images/entities/i_char_0072_20d1.gif) ) and pair density. The last appears as
) and pair density. The last appears as| |  | (99) |
Using the pair density and the electron density, we can obtain the exchange–correlation density| | ϱxc(![[r with combining right harpoon above (vector)]](https://www.rsc.org/images/entities/i_char_0072_20d1.gif) 1, 1, ![[r with combining right harpoon above (vector)]](https://www.rsc.org/images/entities/i_char_0072_20d1.gif) 2) ≡ ϱ( 2) ≡ ϱ(![[r with combining right harpoon above (vector)]](https://www.rsc.org/images/entities/i_char_0072_20d1.gif) 1)ϱ( 1)ϱ(![[r with combining right harpoon above (vector)]](https://www.rsc.org/images/entities/i_char_0072_20d1.gif) 2) − ϱ2( 2) − ϱ2(![[r with combining right harpoon above (vector)]](https://www.rsc.org/images/entities/i_char_0072_20d1.gif) 1, 1, ![[r with combining right harpoon above (vector)]](https://www.rsc.org/images/entities/i_char_0072_20d1.gif) 2). 2). | (100) |
With those three physical quantities describing the electron spatial distribution within the molecule, now we are able to provide a comparison of the two methods.
A.2.2. Delocalization index (DI).
The following description is based on the paper by Outeiral and co-workers.163 We divide the whole 3D space  into disjoint (non-overlapping) atomic basins or quantum atoms Ωi (containing only the i-th atom) in such a way that the so-called zero-flux condition holds (meaning that the electron density ϱ(
![[r with combining right harpoon above (vector)]](https://www.rsc.org/images/entities/i_char_0072_20d1.gif) ) stays almost constant while crossing the boundary surface ∂Ωi)
) stays almost constant while crossing the boundary surface ∂Ωi)| |  | (101) |
but the main problem is that such a division is not unique; therefore all the localization indices (LI) λi and delocalization indices (DI) δij are not uniquely determined. They are given in the following form:| |  | (102) |
and for i ≠ j| |  | (103) |
The only normalization relating those indices to the number of electrons N is the following one:| |  | (104) |
and if provided only with the DIs for the nearest bonds, then it is impossible to check the normalization. For example, in Fig. 33, the sum of nearest DIs sums up to 12.33 pairs, whereas from the electron structure, one would expect 14 pairs for the N8 molecule.
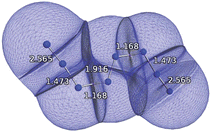 |
| | Fig. 33 The N8 molecule with delocalization indices calculated at the Hartree–Fock level (HF/6-311++G(2d,2p)). Delocalization indices do not add up to the expected 14 shared electron pairs. The number of electron pairs may be calculated by considering that 2 electrons form a single bond. Reprinted with permission from the work of Carlos Outeiral and co-workers.163 | |
Among the advantages of the DI method, we should mention the following:
• the first-order Hartree–Fock exchange energy δVij between basins Ωi and Ωj is proportional to the delocalization index δij and it can be approximated as
| |  | (105) |
where
Rij is the distance between atoms
i and
j.
The key disadvantages are:
• arbitrary choice of atom basins Ωi ⇒ values of DIs and LIs are not uniquely determined,
• no normalization check available if we are given only the nearest DIs,
• delocalization within the basin Ωi is treated just as the localization on a given atom, which contradicts the physical definition of electron delocalization.
A.2.3. Electron delocalization range (EDR) as an analog of the merit of the electrons freedom in the electron (carrier) gas.
The definition below is based on the work of Janesko and co-workers.17
The EDR definition relies on the non-local one-electron density matrix ϱ1(![[r with combining right harpoon above (vector)]](https://www.rsc.org/images/entities/i_char_0072_20d1.gif) ′;
′; ![[r with combining right harpoon above (vector)]](https://www.rsc.org/images/entities/i_char_0072_20d1.gif) ) and it describes how much an electron at point
) and it describes how much an electron at point ![[r with combining right harpoon above (vector)]](https://www.rsc.org/images/entities/i_char_0072_20d1.gif) delocalizes over a distance l
delocalizes over a distance l
| |  | (106) |
where the Gaussian kernel
g(
![[r with combining right harpoon above (vector)]](https://www.rsc.org/images/entities/i_char_0072_20d1.gif)
,
![[r with combining right harpoon above (vector)]](https://www.rsc.org/images/entities/i_char_0072_20d1.gif)
′;
l) is given in the following way
| |  | (107) |
chosen in such a way that 0 ≤ EDR(
![[r with combining right harpoon above (vector)]](https://www.rsc.org/images/entities/i_char_0072_20d1.gif)
,
u) ≤ 1 is always bounded. Using EDR we can easily investigate the various delocalization degrees of electrons in a given molecule. For instance, let us take a look at naphthalene (
Fig. 34).
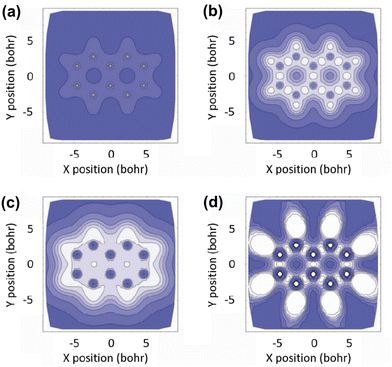 |
| | Fig. 34 EDR and ELF plots for the naphthalene molecule, computed at the DFT level (PBE0/6-311G(2d,2p)). (a) EDR plot calculated at the delocalization length of u = 0.25 bohr shows the core electrons. (b) EDR at u = 1 bohr represents the delocalization of the electrons forming single bonds. (c) The electron delocalization over the aromatic rings becomes apparent at EDR obtained for the bigger u = 2 bohr. (d) Plot of the electron localization function (ELF). Reprinted with permission from the original paper by Janesko and co-workers.17 | |
For delocalization length u = 0.25 bohr we can see only the carbon-core electrons; for u = 1 bohr we can notice the valence electrons’ delocalization related to the C–C and C–H bonds, and at u = 2 bohr we see the delocalization of the peripheral electrons. However, if one is only interested in the characteristic delocalization parameter for the whole molecule/system, the authors of ref. 17 advise to use the  weighted over the electron distribution density ϱ(
![[r with combining right harpoon above (vector)]](https://www.rsc.org/images/entities/i_char_0072_20d1.gif) )
)
| |  | (108) |
The advantages of the EDR method are as follows:
• analysis of all possible delocalizations of electrons depending on the delocalization length u – instead of just investigating the intra-basin delocalization from DI,
• one can also obtain the plot of how many electrons delocalize over a given length u in the whole molecule, which is a more descriptive characteristic than DIs for closest bonds,
• EDR is uniquely and precisely determined – there is no dependence on the atom basin shapes,
• EDR has clear bounds – values closer to zero mean that almost no electrons delocalize at a considered length, whereas values closer to one mean the opposite.
We strongly recommend using the EDR function as an analog of the unperturbed charge density. In our research, we applied this approach, which enables the transfer of results obtained from Green's function methodology in condensed matter physics directly to molecular systems with conjugated bonds for the first time. Despite its potential, the EDR function is not yet widely used for these purposes, and there are no practical guides available on how to implement it for such computational schemes besides this review.
A.3. Details of quantum chemical calculations.
To illustrate and discuss in detail some concepts in this review, we performed computations using the ORCA 5.0 program package.164 The geometries of the polyene carbon chain, as well as 1,3-butadiene and the corresponding α,β-unsaturated carbonyl, have been optimized at the restricted Hartree–Fock level (HF) of theory using the def2-SVP basis set.165 To prevent the appearance of charge–density waves in the presented density-difference plots associated with Peierls instability, the final single-point calculations have been performed at the density functional theory (DFT) level with simple LDA approximate functional, along with the def2-SVP basis set.
The perturbation to the electronic structure of the molecules has been modeled with a point charge placed 10 Å away from the terminal carbon. Since Friedel oscillations are reflected from the structure's borders, cumulene and polyyne chains have been constructed to have one hundred carbon atoms each to accommodate a Friedel oscillation generated by the external point charge. We have conducted calculations involving −0.5e, −1.0e, −1.5e and −2.0e point charges.
π-electron charge densities have been generated with Multiwfn166 software. To see the effect of the perturbation (external point charge) on the electronic structure of the carbon chains, the volumetric charge densities obtained for the unperturbed structure of cumulene and polyyne have been subtracted from the perturbed structures. To analyze the data, the volumetric charge density difference Δρ(x, y, z) along the carbon chain has been summed over the axis perpendicular to the carbon chain, obtaining the surface charge density difference Δσ(x, y) depicted for both cumulene and polyyne in Fig. 24. This figure shows a clear Friedel oscillations pattern, with electron density decaying along the carbon chain.
EDR functions presented in Section 4.2.3 have been sampled at a step size of 0.2 bohr over the entire carbon chains, and their values have been multiplied by the electron density at the same point in space and summed to a single number for a given delocalization length u. In the EDR approach, this procedure must be consistent with the number of electrons in the system. For more information, please refer to Appendix A.2.3. All the DI values have been obtained using Multiwfn software.166
A.4. Dirac–Kronig–Penney models of cumulene and polyyne.
Instead of the simplest free-electron–gas approximation viaeqn (73), FOs of cumulene and polyyne can be, in principle, approached by using the Dirac–Kronig–Penney model described in Section 3.6. The only difference would be that for cumulene, we start with the equally spaced lattice of Dirac deltas, whereas for polyyne, one needs a refined elementary cell with two atoms and, in fact, two lattice constants (see Fig. 35). A similar story holds for the tight-binding realization of both chains (discussed in Section 3.9); however it is applied via the difference of hopping constants, implying that hopping through a single bond is more difficult than hopping through a shorter triple bond.
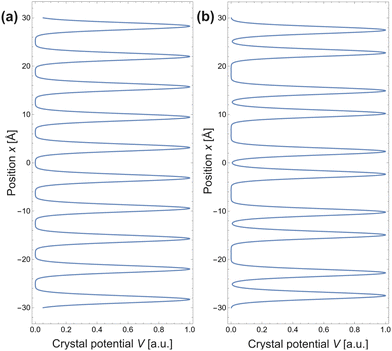 |
| | Fig. 35 Comparison between the proposed cumulene (a) and polyyne (b) Dirac–Kronig–Penney models. | |
Acknowledgements
We acknowledge discussions with Mikhail Glazov. This work was supported by the National Science Centre of Poland Grant No. 2018/30/E/ST4/00004. The authors gratefully acknowledge computing time provided by the Interdisciplinary Centre for Mathematical and Computational Modelling in Warsaw, Poland, under grant no. G60-08.
References
-
J. Friedel, Metallic alloys, Il Nuovo Cimento (1955–1965), 1958, vol. 7, pp. 287–311 Search PubMed.
- M. Crommie, C. Lutz and D. Eigler, Imaging standing waves in a two-dimensional electron gas, Nature, 1993, 363, 524–527 CrossRef CAS.
- Y. Hasegawa and P. Avouris, Direct observation of standing wave formation at surface steps using scanning tunneling spectroscopy, Phys. Rev. Lett., 1993, 71, 1071–1074 CrossRef CAS PubMed.
- P. Avouris, I. Lyo, R. E. Walkup and Y. Hasegawa, Real space imaging of electron scattering phenomena at metal surfaces, J. Vac. Sci. Technol., B: Microelectron. Nanometer Struct.--Process., Meas., Phenom., 1994, 12, 1447–1455 CrossRef CAS.
- V. S. Stepanyuk, A. N. Baranov, D. V. Tsivlin, W. Hergert, P. Bruno, N. Knorr, M. A. Schneider and K. Kern, Quantum interference and long-range adsorbate-adsorbate interactions, Phys. Rev. B: Condens. Matter Mater. Phys., 2003, 68, 205410 CrossRef.
- S. Canuto, J. L. Calais and O. Goscinski, Alternating polarity and Friedel oscillations, J. Phys. B: At. Mol. Phys., 1981, 14, 1409 CrossRef CAS.
- J. Villain, M. Lavagna and P. Bruno, Jacques Friedel and the physics of metals and alloys, C. R. Phys., 2016, 17, 276–290 CrossRef CAS.
- P. Hyldgaard and M. Persson, Long-ranged adsorbate-adsorbate interactions mediated by a surface-state band, J. Phys.: Condens. Matter, 2000, 12, L13 CrossRef CAS.
-
E. Schrödinger, What is Life? The Physical Aspect of the Living Cell, Cambridge University Press, Cambridge, 1944 Search PubMed.
- R. Phillips, Schrödinger′s What Is Life? at 75, Cell Syst., 2021, 12, 465–476 CrossRef CAS PubMed.
- As of 01.07.2024, Scopus database returned 10258 hits for Friedel oscillation. Among them, 8308 experimental papers have been published, 5614 mentioned theoretical FOs descriptions, and 1965 works have referred to computations.
-
P. Sykes, A Guidebook to Mechanism in Organic Chemistry, Longman, 1986, p. 416 Search PubMed.
- P. Monceau, Electronic crystals: an experimental overview, Adv. Phys., 2012, 61, 325–581 CrossRef CAS.
-
A. Altland and B. D. Simons, Condensed matter field theory, Cambridge University Press, 2010 Search PubMed.
-
L. S. Levitov and A. V. Shytov, Green's functions. Theory and practice, Fizmatlit, Moscow, 2003 Search PubMed.
-
N. W. Ashcroft and N. D. Mermin, Solid state physics, Cengage Learning, 2022 Search PubMed.
- B. G. Janesko, G. Scalmani and M. J. Frisch, How far do electrons delocalize?, J. Chem. Phys., 2014, 141, 144104 CrossRef PubMed.
- Z. A. Kasamanyan, On the theory of impurity levels, J. Exp. Theor. Phys., 1971, 34, 648–650 Search PubMed.
- N. Petrova and I. Yakovkin, Lateral interaction and CO adlayer structures on the Pt(111) surface, Surf. Sci., 2002, 519, 90–100 CrossRef CAS.
- A. V. Myshlyavtsev and P. V. Stishenko, Potential of lateral interactions of CO on Pt(111) fitted to recent STM images, Surf. Sci., 2015, 642, 51–57 CrossRef CAS.
- R. Szukiewicz, J. Kołaczkiewicz and I. N. Yakovkin, Zigzag chain structures of Gd on the Mo(1 1 0) surface, Surf. Sci., 2008, 602, 2610–2616 CrossRef CAS.
- M. Wiejak, M. Jankowski, I. Yakovkin and J. Kołaczkiewicz, Adsorption of Nd on the Mo(1 1 0) surface, Appl. Surf. Sci., 2010, 256, 4834–4838 CrossRef CAS.
- M. Kulawik, H.-P. Rust, M. Heyde, N. Nilius, B. Mantooth, P. Weiss and H.-J. Freund, Interaction of CO molecules with surface state electrons on Ag(111), Surf. Sci., 2005, 590, L253–L258 CrossRef CAS.
- S. Lukas, G. Witte and C. Wöll, Novel Mechanism for Molecular Self-Assembly on Metal Substrates: Unidirectional Rows of Pentacene on Cu(110) Produced by a Substrate-Mediated Repulsion, Phys. Rev. Lett., 2002, 88, 4 Search PubMed.
- M. Lee, S. Kang, M. Oh, J. Chae, J. Yu and Y. Kuk, Superstructures of Se adsorbates on Au(111): scanning tunneling microscopy and spectroscopy study, Surf. Sci., 2019, 685, 19–23 CrossRef CAS.
-
N. Ashcroft and N. Mermin, Solid State Physics, Saunders College, 1976 Search PubMed.
- T. Page and B. Ralph, Shape of the Field-ion Image Points for Certain Solute Atom the Halo Effect, Nat. Phys. Sci., 1971, 234, 163–165 CrossRef CAS.
- T. T. Tsong and C.-L. Chen, Impurity adsorption induced surface charge-density oscillation and indirect atomic interactions, Mod. Phys. Lett. B, 1990, 4, 775–782 CrossRef CAS.
- Y. S. Avotina, Y. A. Kolesnichenko and J. M. van Ruitenbeek, Theory of oscillations in STM conductance caused by subsurface defects, Low Temp. Phys., 2010, 36, 849–864 CrossRef CAS.
- L. Bürgi, N. Knorr, H. Brune, M. A. Schneider and K. Kern, Two-dimensional electron gas at noble-metal surfaces, Appl. Phys. A: Mater. Sci. Process., 2002, 75, 141–145 CrossRef.
- P. Avouris, I.-W. Lyo and P. Molinas-Mata, STM studies of the interaction of surface state electrons on metals with steps and adsorbates, Chem. Phys. Lett., 1995, 240, 423–428 CrossRef CAS.
- P. Drude and Z. E. Der Metalle, Ann. Phys., 1900, 306, 566–613 CrossRef.
-
H. A. Lorentz, The motion of electrons in metallic bodies I, KNAW Proc., 1905, 7, 438–453 Search PubMed.
- E. Schrödinger, Quantisierung als Eigenwertproblem, Ann. Phys., 1926, 386, 109–139 CrossRef.
- W. Heisenberg, Über quantentheoretische Umdeutung kinematischer und mechanischer Beziehungen, Z. Phys., 1925, 33, 879–893 CrossRef CAS.
-
A. Sommerfeld and H. Bethe, Elektronentheorie der Metalle, Springer Berlin Heidelberg, Berlin, Heidelberg, 1933, pp. 333–622 Search PubMed.
- N. D. Lang and W. Kohn, Theory of Metal Surfaces: Charge Density and Surface Energy, Phys. Rev. B: Condens. Matter Mater. Phys., 1970, 1, 4555–4568 CrossRef.
- P. Mavropoulos and N. Papanikolaou, The Korringa-Kohn-Rostoker (KKR) Green function method I. Electronic structure of periodic systems, Comput. Nanosci., 2006, 31, 131–158 Search PubMed.
- S. Nordholm and G. B. Bacskay, The Basics of Covalent Bonding in Terms of Energy and Dynamics, Prog. Theor. Phys., 2020, 25, 2667 CAS.
- S. Nordholm, Delocalization the key concept of covalent bonding, J. Chem. Educ., 1988, 65, 581 CrossRef CAS.
- T. Yokoyama, T. Takahashi, K. Shinozaki and M. Okamoto, Quantitative Analysis of Long-Range Interactions between Adsorbed Dipolar Molecules on Cu(111), Phys. Rev. Lett., 2007, 98, 206102 CrossRef PubMed.
- N. Bloembergen, Nuclear magnetic resonance and electronic structure of conductors, Can. J. Phys., 1956, 34, 1299–1314 CrossRef.
-
S. G. Davison and M. Steślicka, Basic theory of surface states, Oxford University Press, 1996, vol. 46 Search PubMed.
- E. Fermi, Un metodo statistico per la determinazione di alcune priorieta dell′atome, Rend. Accad. Naz. Lincei, 1927, 6, 32 Search PubMed.
-
L. H. Thomas, Math. Proc. Cambridge Philos. Soc., 1927, pp. 542–548 Search PubMed.
- J. Friedel, XIV. The distribution of electrons round impurities in monovalent metals, London, Edinburgh Dublin Philos. Mag. J. Sci., 1952, 43, 153–189 CrossRef CAS.
- Z. Kasamanyan, On the theory of impurity levels, J. Exp. Theor. Phys., 1972, 34, 648–650 Search PubMed.
- L. D. Landau, The theory of a Fermi liquid, J. Exp. Theor. Phys., 1957, 3, 920–925 CAS.
- K. Riechers, K. Hueck, N. Luick, T. Lompe and H. Moritz, Detecting Friedel oscillations in ultracold Fermi gases, Eur. Phys. J. D, 2017, 71, 1–6 CrossRef CAS.
- L. Petersen, P. T. Sprunger, P. Hofmann, E. Lægsgaard, B. G. Briner, M. Doering, H.-P. Rust, A. M. Bradshaw, F. Besenbacher and E. W. Plummer, Direct imaging of the two-dimensional Fermi contour: Fourier-transform STM, Phys. Rev. B: Condens. Matter Mater. Phys., 1998, 57, R6858–R6861 CrossRef CAS.
- T. T. Tsong, Direct Observation of Interactions between Individual Atoms on Tungsten Surfaces, Phys. Rev. B: Condens. Matter Mater. Phys., 1972, 6, 417–426 CrossRef CAS.
- T. T. Tsong, Field-Ion Microscope Observations of Indirect Interaction between Adatoms on Metal Surfaces, Phys. Rev. Lett., 1973, 31, 1207–1210 CrossRef CAS.
- M. Mehlhorn, V. Simic-Milosevic, S. Jaksch, P. Scheier and K. Morgenstern, The influence of the surface state onto the distance distribution of single molecules and small molecular clusters, Surf. Sci., 2010, 604, 1698–1704 CrossRef CAS.
- K. Lau and W. Kohn, Indirect long-range oscillatory interaction between adsorbed atoms, Surf. Sci., 1978, 75, 69–85 CrossRef CAS.
- E. Wahlström, I. Ekvall, H. Olin and L. Wallden, Long-range interaction between adatoms at the Cu(111) surface imaged by scanning tunnelling microscopy, Appl. Phys. A: Mater. Sci. Process., 1998, 60, 1107–1110 Search PubMed.
- N. Knorr, H. Brune, M. Epple, A. Hirstein, M. A. Schneider and K. Kern, Long-range adsorbate interactions mediated by a two-dimensional electron gas, Phys. Rev. B: Condens. Matter Mater. Phys., 2002, 65, 1–5 CrossRef.
- V. Simic-Milosevic, M. Heyde, N. Nilius, M. Nowicki, H.-P. Rust and H.-J. Freund, Substrate-mediated interaction and electron-induced diffusion of single lithium atoms on Ag(001), Phys. Rev. B: Condens. Matter Mater. Phys., 2007, 75, 195416 CrossRef.
- A. P. Graham, J. Toennies and G. Benedek, Evidence for long-range surface state mediated interaction between sodium atoms on copper (001), Surf. Sci., 2004, 556, L143–L149 CrossRef CAS.
- F. Silly, M. Pivetta, M. Ternes, F. Patthey, J. P. Pelz and W. D. Schneider, Creation of an Atomic Superlattice by Immersing Metallic Adatoms in a Two-Dimensional Electron Sea, Phys. Rev. Lett., 2004, 92, 4 CrossRef PubMed.
- D. O. Demchenko, G. M. Sacha, M. Salmeron and L. W. Wang, Interactions of oxygen and hydrogen on Pd(1 1 1) surface, Surf. Sci., 2008, 602, 2552–2557 CrossRef CAS.
- A. C. Qu, P. Nigge, S. Link, G. Levy, M. Michiardi, P. L. Spandar, T. Matthé, M. Schneider, S. Zhdanovich, U. Starke, C. Gutiérrez and A. Damascelli, Ubiquitous defect-induced density wave instability in monolayer graphene, Sci. Adv., 2022, 8, 5180 CrossRef PubMed.
- Y. Y. Yeo, L. Vattuone and D. A. King, Energetics and kinetics of CO and NO adsorption on Pt(100): Restructuring and lateral interactions, J. Chem. Phys., 1996, 104, 3810–3821 CrossRef CAS.
- S. Völkening and J. Wintterlin, CO oxidation on Pt(111)-scanning tunneling microscopy experiments and Monte Carlo simulations, J. Chem. Phys., 2001, 114, 6382–6395 CrossRef.
- J. Repp, F. Moresco, G. Meyer, K.-H. Rieder, P. Hyldgaard and M. Persson, Substrate Mediated Long-Range Oscillatory Interaction between Adatoms: Cu/Cu(111), Phys. Rev. Lett., 2000, 85, 2981–2984 CrossRef CAS PubMed.
- M. Xu, J. Liu and F. Zaera, Kinetic evidence for the dependence of surface reaction rates on the distribution of reactants on the surface, J. Chem. Phys., 1996, 104, 8825–8828 CrossRef CAS.
- F. Reinert, G. Nicolay, S. Schmidt, D. Ehm and S. Hüfner, Direct measurements of the L-gap surface states on the (111) face of noble metals by photoelectron spectroscopy, Phys. Rev. B: Condens. Matter Mater. Phys., 2001, 63, 115415 CrossRef.
- M. Hengsberger, D. Purdie, P. Segovia, M. Garnier and Y. Baer, Photoemission Study of a Strongly Coupled Electron–Phonon System, Phys. Rev. Lett., 1999, 83, 592–595 CrossRef CAS.
- A. Weismann, M. Wenderoth, S. Lounis, P. Zahn, N. Quaas, R. G. Ulbrich, P. H. Dederichs and S. Blügel, Seeing the Fermi Surface in Real Space by Nanoscale Electron Focusing, Science, 2009, 323, 1190–1193 CrossRef CAS PubMed.
- J. E. Inglesfield, M. H. Boon and S. Crampin, Nature of Friedel oscillations around Si dopants in the GaAs(110) accumulation layer, J. Phys.: Condens. Matter, 2000, 12, L489 CrossRef CAS.
- L.-J. Yin, Y.-Y. Zhou, L.-H. Tong, L.-J. Shi, Z. Qin and L. He, Imaging Friedel oscillations in rhombohedral trilayer graphene, Phys. Rev. B, 2023, 107, L041404 CrossRef CAS.
- J. Xue, J. Sanchez-Yamagishi, K. Watanabe, T. Taniguchi, P. Jarillo-Herrero and B. J. LeRoy, Long-Wavelength Local Density of States Oscillations Near Graphene Step Edges, Phys. Rev. Lett., 2012, 108, 016801 CrossRef PubMed.
- D. Fujita, K. Amemiya, T. Yakabe, H. Nejoh, T. Sato and M. Iwatsuki, Anisotropic Standing-Wave Formation on an Au(111)-(23 × 3) Reconstructed Surface, Phys. Rev. Lett., 1997, 78, 3904–3907 CrossRef CAS.
- P. Hofmann, B. G. Briner, M. Doering, H.-P. Rust, E. W. Plummer and A. M. Bradshaw, Anisotropic Two-Dimensional Friedel Oscillations, Phys. Rev. Lett., 1997, 79, 265–268 CrossRef CAS.
- P. Sessi, V. M. Silkin, I. A. Nechaev, T. Bathon, L. El-Kareh, E. V. Chulkov, P. M. Echenique and M. Bode, Direct observation of many-body charge density oscillations in a two-dimensional electron gas, Nat. Commun., 2015, 6, 8691 CrossRef CAS PubMed.
- L. Petersen, P. Laitenberger, E. Lægsgaard and F. Besenbacher, Screening waves from steps and defects on Cu(111) and Au(111) imaged with STM: Contribution from bulk electrons, Phys. Rev. B: Condens. Matter Mater. Phys., 1998, 58, 7361–7366 CrossRef CAS.
- J. E. Ortega, J. Lobo-Checa, G. Peschel, S. Schirone, Z. M. Abd El-Fattah, M. Matena, F. Schiller, P. Borghetti, P. Gambardella and A. Mugarza, Scattering of surface electrons by isolated steps versus periodic step arrays, Phys. Rev. B: Condens. Matter Mater. Phys., 2013, 87, 115425 CrossRef.
- M. C. M. M. van der Wielen, A. J. A. van Roij and H. van Kempen, Direct Observation of Friedel Oscillations around Incorporated SiGa Dopants in GaAs by Low-Temperature Scanning Tunneling Microscopy, Phys. Rev. Lett., 1996, 76, 1075–1078 CrossRef CAS PubMed.
- N. Sato, S. Takeda, T. Nagao and S. Hasegawa, Electron standing waves on the Si(111)–Ag surface, Phys. Rev. B: Condens. Matter Mater. Phys., 1999, 59, 2035–2039 CrossRef CAS.
- M. Ono, Y. Nishigata, T. Nishio, T. Eguchi and Y. Hasegawa, Electrostatic Potential Screened by a Two-Dimensional Electron System: A Real-Space Observation by Scanning-Tunneling Spectroscopy, Phys. Rev. Lett., 2006, 96, 016801 CrossRef PubMed.
- K. Schouteden, P. Lievens and C. Van Haesendonck, Fourier-transform scanning tunneling microscopy investigation of the energy versus wave vector dispersion of electrons at the Au(111) surface, Phys. Rev. B: Condens. Matter Mater. Phys., 2009, 79, 195409 CrossRef.
- P. T. Sprunger, L. Petersen, E. W. Plummer, E. Laegsgaard, F. Besenbacher, E. Lqsgaard and F. Besen, Giant Friedel Oscillations on the Beryllium(0001) Surface, Science, 1997, 275, 1764–1767 CrossRef CAS PubMed.
- J. Repp and G. Meyer, Scanning tunneling microscopy of adsorbates on insulating films. from the imaging of individual molecular orbitals to the manipulation of the charge state, Appl. Phys. A: Mater. Sci. Process., 2006, 85, 399–406 CrossRef CAS.
- O. Y. Kolesnychenko, G. M. M. Heijnen, A. K. Zhuravlev, R. de Kort, M. I. Katsnelson, A. I. Lichtenstein and H. van Kempen, Surface electronic structure of Cr(001): experiment and theory, Phys. Rev. B: Condens. Matter Mater. Phys., 2005, 72, 085456 CrossRef.
- F. Vonau, D. Aubel, G. Gewinner, C. Pirri, J. C. Peruchetti, D. Bolmont and L. Simon, Fermi contour imaging of the two-dimensional semimetal ErSi2 by Fourier transform STM, Phys. Rev. B: Condens. Matter Mater. Phys., 2004, 69, 081305 CrossRef.
- J. Lagoute, K. Kanisawa and S. Fölsch, Manipulation and adsorption-site mapping of single pentacene molecules on Cu(111), Phys. Rev. B: Condens. Matter Mater. Phys., 2004, 70, 1–6 CrossRef.
- S. D. Kevan and R. H. Gaylord, High-resolution photoemission study of the electronic structure of the noble-metal (111) surfaces, Phys. Rev. B: Condens. Matter Mater. Phys., 1987, 36, 5809–5818 CrossRef CAS PubMed.
- K. Kanisawa, M. J. Butcher, H. Yamaguchi and Y. Hirayama, Imaging of Friedel oscillation patterns of two-dimensionally accumulated electrons at epitaxially grown InAs(111)A surfaces, Phys. Rev. Lett., 2001, 86, 3384–3387 CrossRef CAS PubMed.
- J. Ishioka, T. Fujii, K. Katono, K. Ichimura, T. Kurosawa, M. Oda and S. Tanda, Charge-parity symmetry observed through Friedel oscillations in chiral charge–density waves, Phys. Rev. B: Condens. Matter Mater. Phys., 2011, 84, 245125 CrossRef.
- P. Mallet, I. Brihuega, V. Cherkez, J. M. Gómez-Rodríguez and J. Y. Veuillen, Friedel oscillations in graphene-based systems probed by Scanning Tunneling Microscopy, C. R. Phys., 2016, 17, 294–301 CrossRef CAS.
- C. Wittneven, R. Dombrowski, M. Morgenstern and R. Wiesendanger, Scattering States of Ionized Dopants Probed by Low Temperature Scanning Tunneling Spectroscopy, Phys. Rev. Lett., 1998, 81, 5616–5619 CrossRef CAS.
- O. Jeandupeux, L. Burgi, A. Hirstein, H. Brune and K. Kern, Thermal damping of quantum interference patterns of surface-state electrons, Phys. Rev. B: Condens. Matter Mater. Phys., 1999, 59, 15926–15934 CrossRef CAS.
- A. M. Stoneham, The theory of defects in solids, Contemp. Phys., 1979, 20, 535–545 CrossRef CAS.
-
A. M. Stoneham, Theory of Defects in Solids: Electronic Structure of Defects in Insulators and Semiconductors, Oxford University Press, 2001 Search PubMed.
-
NIST Digital Library of Mathematical Functions, ed. F. W. J. Olver, A. B. Olde Daalhuis, D. W. Lozier, B. I. Schneider, R. F. Boisvert, C. W. Clark, B. R. Miller, B. V. Saunders, H. S. Cohl and M. A. McClain, https://dlmf.nist.gov/, Release 1.1.9 of 2023-03-15, 2023 Search PubMed.
- M. Ono, T. Nishio, T. An, T. Eguchi and Y. Hasegawa, Observation of the screened potential and the Friedel oscillation by low-temperature scanning tunneling microscopy/spectroscopy, Appl. Surf. Sci., 2009, 256, 469–474 CrossRef CAS.
- E. Chulkov, V. Silkin and E. Shirykalov, Surface electronic structure of Be(0001) and Mg(0001), Surf. Sci., 1987, 188, 287–300 CrossRef CAS.
- E. Plummer and J. Hannon, The surfaces of beryllium, Prog. Surf. Sci., 1994, 46, 149–158 CrossRef CAS.
- H. Gawronski, J. Fransson and K. Morgenstern, Real-space imaging of inelastic Friedel-like surface oscillations emerging from molecular adsorbates, Nano Lett., 2011, 11, 2720–2724 CrossRef CAS PubMed.
- M. Bouhassoune, B. Zimmermann, P. Mavropoulos, D. Wortmann, P. H. Dederichs, S. Blügel and S. Lounis, Quantum well states and amplified spin-dependent Friedel oscillations in thin films, Nat. Commun., 2014, 5, 5558 CrossRef CAS PubMed.
- P. Giannozzi, S. Baroni, N. Bonini, M. Calandra, R. Car, C. Cavazzoni, D. Ceresoli, G. L. Chiarotti, M. Cococcioni, I. Dabo, A. Dal Corso, S. de Gironcoli, S. Fabris, G. Fratesi, R. Gebauer, U. Gerstmann, C. Gougoussis, A. Kokalj, M. Lazzeri, L. Martin-Samos, N. Marzari, F. Mauri, R. Mazzarello, S. Paolini, A. Pasquarello, L. Paulatto, C. Sbraccia, S. Scandolo, G. Sclauzero, A. P. Seitsonen, A. Smogunov, P. Umari and R. M. Wentzcovitch, QUANTUM ESPRESSO: a modular and open-source software project for quantum simulations of materials, J. Phys.: Condens. Matter, 2009, 21, 395502 (19pp) CrossRef PubMed.
- P. Giannozzi, O. Andreussi, T. Brumme, O. Bunau, M. B. Nardelli, M. Calandra, R. Car, C. Cavazzoni, D. Ceresoli, M. Cococcioni, N. Colonna, I. Carnimeo, A. D. Corso, S. de Gironcoli, P. Delugas, R. A. D. Jr, A. Ferretti, A. Floris, G. Fratesi, G. Fugallo, R. Gebauer, U. Gerstmann, F. Giustino, T. Gorni, J. Jia, M. Kawamura, H.-Y. Ko, A. Kokalj, E. Küçükbenli, M. Lazzeri, M. Marsili, N. Marzari, F. Mauri, N. L. Nguyen, H.-V. Nguyen, A. O. De-la Roza, L. Paulatto, S. Poncé, D. Rocca, R. Sabatini, B. Santra, M. Schlipf, A. P. Seitsonen, A. Smogunov, I. Timrov, T. Thonhauser, P. Umari, N. Vast, X. Wu and S. Baroni, Advanced capabilities for materials modelling with QUANTUM ESPRESSO, J. Phys.: Condens. Matter, 2017, 29, 465901 CrossRef CAS PubMed.
- G. Prandini, A. Marrazzo, I. E. Castelli, N. Mounet and N. Marzari, Precision and efficiency in solid-state pseudopotential calculations, npj Comput. Mater., 2018, 4, 72 CrossRef.
- M. Kawamura, FermiSurfer: Fermi-surface viewer providing multiple representation schemes, Comput. Phys. Commun., 2019, 239, 197–203 CrossRef CAS.
- S. Lounis, P. Zahn, A. Weismann, M. Wenderoth, R. G. Ulbrich, I. Mertig, P. H. Dederichs and S. Blügel, Theory of real space imaging of Fermi surface parts, Phys. Rev. B: Condens. Matter Mater. Phys., 2011, 83, 035427 CrossRef.
- R. K. Tiwari, D. M. Otálvaro, C. Joachim and M. Saeys, Origin of the contrast inversion in the STM image of CO on Cu(1 1 1), Surf. Sci., 2009, 603, 3286–3291 CrossRef CAS.
- P. M. Echenique, R. Berndt, E. V. Chulkov, T. Fauster, A. Goldmann and U. Höfer, Decay of electronic excitations at metal surfaces, Surf. Sci. Rep., 2004, 52, 219–317 CrossRef CAS.
- A. S. Razinkin, A. N. Enyashin, T. V. Kuznetsova, A. N. Titov, M. V. Kuznetsov and A. L. Ivanovskii, Atomic defects on the surface of quasi two-dimensional layered titanium dichalcogenides: stm experiment and quantum chemical simulation, J. Struct. Chem., 2010, 51, 737–743 CrossRef CAS.
- M. Bouhassoune and S. Lounis, Friedel oscillations induced by magnetic skyrmions: From scattering properties to all-electrical detection, Nanomaterials, 2021, 11, 194 CrossRef CAS PubMed.
- M. Stosiek, C. Baretzky, T. Balashov, F. Evers and W. Wulfhekel, Friedel oscillations and superconducting gap enhancement by impurity scattering, Phys. Rev. B, 2022, 105, L140504 CrossRef CAS.
-
L. E. Ballentine, Quantum mechanics: a modern development, World Scientific Publishing Company, 2014 Search PubMed.
-
A. M. Legendre, Recherches sur l attraction des spheroides homogenes, 1785 Search PubMed.
- M. W. Finnis, R. Kaschner, C. Kruse, J. Furthmuller and M. Scheffler, The interaction of a point charge with a metal surface: theory and calculations for (111), (100) and (110) aluminium surfaces, J. Phys.: Condens. Matter, 1995, 7, 2001 CrossRef CAS.
-
L. A. Girifalco, Statistical mechanics of solids, OUP, USA, 2003, vol. 58 Search PubMed.
- N. D. Lang and W. Kohn, Theory of Metal Surfaces: Charge Density and Surface Energy, Phys. Rev. B: Condens. Matter Mater. Phys., 1970, 1, 4555–4568 CrossRef.
- N. D. Lang and W. Kohn, Theory of Metal Surfaces: Induced Surface Charge and Image Potential, Phys. Rev. B: Condens. Matter Mater. Phys., 1973, 7, 3541–3550 CrossRef CAS.
-
E. N. Economou, Green's functions in quantum physics, Springer Science & Business Media, 2006, vol. 7 Search PubMed.
-
S. Kesavan, Functional analysis, Springer Nature, 2023, vol. 52 Search PubMed.
-
L. Hormander, An introduction to complex analysis in several variables, Elsevier, 1973 Search PubMed.
- M. A. Ruderman and C. Kittel, Indirect Exchange Coupling of Nuclear Magnetic Moments by Conduction Electrons, Phys. Rev., 1954, 96, 99–102 CrossRef CAS.
-
S. Hassani, Dirac delta function, Mathematical Methods: For Students of Physics and Related Fields, 2009, pp. 139–170 Search PubMed.
-
E. Ladopoulos, Singular integral equations: linear and non-linear theory and its applications in science and engineering, Springer Science & Business Media, 2013 Search PubMed.
- R. D. L. Kronig and W. G. Penney, Quantum mechanics of electrons in crystal lattices, Proc. R. Soc. A, 1931, 130, 499–513 Search PubMed.
- S. V. Maleev, Three-dimensional generalization of the Kronig-Penney model, Phys. Solid State, 1960, 7, 2423–2427 Search PubMed.
- A. A. Berezin, Two-and three-dimensional Kronig–Penney model with δ-function-potential wells of zero binding energy, Phys. Rev. B: Condens. Matter Mater. Phys., 1986, 33, 2122 CrossRef PubMed.
- W. Auwärter, Hexagonal boron nitride monolayers on metal supports: Versatile templates for atoms, molecules and nanostructures, Surf. Sci. Rep., 2019, 74, 1–95 CrossRef.
- P. Hyldgaard and T. Einstein, Surface-state-mediated three-adsorbate interaction, Europhys. Lett., 2002, 59, 265 CrossRef CAS.
- L. M. Roth, H. J. Zeiger and T. A. Kaplan, Generalization of the Ruderman–Kittel–Kasuya–Yosida Interaction for Nonspherical Fermi Surfaces, Phys. Rev., 1966, 149, 519–525 CrossRef CAS.
- W.-P. Su, J. R. Schrieffer and A. J. Heeger, Solitons in polyacetylene, Phys. Rev. Lett., 1979, 42, 1698 CrossRef CAS.
- B. Wunsch, T. Stauber, F. Sols and F. Guinea, Dynamical polarization of graphene at finite doping, New J. Phys., 2006, 8, 318 CrossRef.
- V. V. Cheianov and V. I. Fal'ko, Friedel Oscillations, Impurity Scattering, and Temperature Dependence of Resistivity in Graphene, Phys. Rev. Lett., 2006, 97, 226801 CrossRef PubMed.
- P. Avouris, Electron transport and excitations in graphene, Proc. Chem., 2011, 3, 352–362 CrossRef CAS.
- A. V. Shytov, D. A. Abanin and L. S. Levitov, Long-Range Interaction between Adatoms in Graphene, Phys. Rev. Lett., 2009, 103, 016806 CrossRef PubMed.
- T. M. Rusin and W. Zawadzki, Theory of Friedel oscillations in monolayer graphene and group-VI dichalcogenides in a magnetic field, Phys. Rev. B, 2018, 97, 205410 CrossRef CAS.
- V. Silkin, I. Nechaev, E. Chulkov and P. Echenique, Induced charge–density oscillations at metal surfaces, Surf. Sci., 2005, 588, L239–L245 CrossRef CAS.
- V. Silkin, I. Nechaev, E. Chulkov and P. Echenique, Charge-density oscillations at (111) noble metal surfaces, Surf. Sci., 2006, 600, 3875–3878 CrossRef CAS.
-
V. M. Silkin, E. V. Chulkov and P. M. Echenique, in Low-Energy Collective Electronic Excitations at Metal Surfaces, John Wiley & Sons, Ltd, 2010, ch. 8, pp. 167–188 Search PubMed.
- M. A. Poyli, M. Hrto
![[n with combining breve]](https://www.rsc.org/images/entities/char_006e_0306.gif) , I. A. Nechaev, A. Y. Nikitin, P. M. Echenique, V. M. Silkin, J. Aizpurua and R. Esteban, Controlling surface charge and spin density oscillations by Dirac plasmon interaction in thin topological insulators, Phys. Rev. B, 2018, 97, 115420 CrossRef CAS.
, I. A. Nechaev, A. Y. Nikitin, P. M. Echenique, V. M. Silkin, J. Aizpurua and R. Esteban, Controlling surface charge and spin density oscillations by Dirac plasmon interaction in thin topological insulators, Phys. Rev. B, 2018, 97, 115420 CrossRef CAS.
- M. Z. Hasan and C. L. Kane, Colloquium: topological insulators, Rev. Mod. Phys., 2010, 82, 3045 CrossRef CAS.
- E. W. Fenton, Overhauser Phase and Bond Alternation in Long-Chain Molecules, Phys. Rev. Lett., 1968, 21, 1427–1430 CrossRef CAS.
- Midpoints of each C–C bond on x-axis defined a boundary and we integrated the charge densities within each region.
- U. Busch and K. Penson, Tight-binding electrons on open chains: Density distribution and correlations, Phys. Rev. B: Condens. Matter Mater. Phys., 1987, 36, 9271 CrossRef PubMed.
- M. Weimer, W. Hieringer, F. D. Sala and A. Görling, Electronic and optical properties of functionalized carbon chains with the localized Hartree–Fock and conventional Kohn–Sham methods, Chem. Phys., 2005, 309, 77–87 CrossRef CAS.
- K. Zhang, Y. Zhang and L. Shi, A review of linear carbon chains, Chin. Chem. Lett., 2020, 31, 1746–1756 CrossRef CAS.
- D. W. Szczepanik, M. Andrzejak, J. Dominikowska, B. Pawełek, T. M. Krygowski, H. Szatylowicz and M. Solà, The electron density of delocalized bonds (EDDB) applied for quantifying aromaticity, Phys. Chem. Chem. Phys., 2017, 19, 28970–28981 RSC.
-
D. W. Szczepanik and M. Solà, in Aromaticity, ed. I. Fernandez, Elsevier, 2021, pp. 259–284 Search PubMed.
- F. Feixas, E. Matito, J. Poater and M. Solà, Quantifying aromaticity with electron delocalisation measures, Chem. Soc. Rev., 2015, 44, 6434–6451 RSC.
- J. Poater, M. SolÃ, M. Duran and X. Fradera, The calculation of electron localization and delocalization indices at the Hartree–Fock, density functional and post-Hartree–Fock levels of theory, Theor. Chem. Acc., 2002, 107, 362–371 Search PubMed.
- C. Outeiral, M. A. Vincent, A. Martín Pendás and P. L. A. Popelier, Revitalizing the concept of bond order through delocalization measures in real space, Chem. Sci., 2018, 9, 5517–5529 RSC.
- Y. Zang, T. Fu, Q. Zou, F. Ng, H. Li, M. L. Steigerwald, C. Nuckolls and L. Venkataraman, Cumulene Wires Display Increasing Conductance with Increasing Length, Nano Lett., 2020, 20, 8415–8419 CrossRef CAS PubMed.
- We further prove this notion by conducting the RHF/def2-SVP level calculations of 1,3-butadiene and the corresponding α,β-unstaurated carbonyl (for details on the performed calculations, please refer to Section 7.3). Expectedly, both Mulliken and Loewdin charges show higher positive atomic charge on the α- and β-carbon atoms as well as a slightly more negative charge on the carbon atom in between, in full accordance with the previous chemical considerations.
- I. Scivetti, N. I. Gidopoulos and G. Teobaldi, Electrostatics of metallic surfaces in periodic density functional theory simulations within and beyond the linear response regime, Phys. Rev. B, 2023, 108, 165423 CrossRef CAS.
- J.-H. Parq, J. Yu, Y.-K. Kwon and G. Kim, Tunable charge donation and spin polarization of metal adsorbates on graphene using an applied electric field, Phys. Rev. B: Condens. Matter Mater. Phys., 2010, 82, 193406 CrossRef.
- J. Li, J. Wang, Q. Sun and Y. Jia, First-principles study of Friedel oscillations normal to the low index surfaces of Al, Phys. B, 2011, 406, 2767–2771 CrossRef CAS.
- J.-J. Tang, X.-B. Yang, L. OuYang, M. Zhu and Y.-J. Zhao, A systematic first-principles study of surface energies, surface relaxation and Friedel oscillation of magnesium surfaces, J. Phys. D: Appl. Phys., 2014, 47, 115305 CrossRef.
- N. Kazeev, A. R. Al-Maeeni, I. Romanov, M. Faleev, R. Lukin, A. Tormasov, A. H. Castro Neto, K. S. Novoselov, P. Huang and A. Ustyuzhanin, Sparse representation for machine learning the properties of defects in 2D materials, npj Comput. Mater., 2023, 9, 113 CrossRef.
- M. M. Kelley, J. Quinton, K. Fazel, N. Karimitari, C. Sutton and R. Sundararaman, Bridging electronic and classical density-functional theory using universal machine-learned functional approximations, J. Chem. Phys., 2024, 161, 144101 CrossRef CAS PubMed.
- D. Vieira, H. J. Freire, V. Campo and K. Capelle, Friedel oscillations in one-dimensional metals: From Luttinger's theorem to the Luttinger liquid, J. Magn. Magn. Mater., 2008, 320, e418–e420 CrossRef CAS.
-
G. Baym and C. Pethick, Landau Fermi-liquid theory: concepts and applications, John Wiley & Sons, 2008 Search PubMed.
- N. V. Khotkevych, Y. A. Kolesnichenko and J. M. van Ruitenbeek, Electron tunneling into surface states through an inhomogeneous barrier: asymptotically exact solution of the problem, and STM theory, Low Temp. Phys., 2013, 39, 299–303 CrossRef CAS.
- I. Affleck, L. Borda and H. Saleur, Friedel oscillations and the Kondo screening cloud, Phys. Rev. B: Condens. Matter Mater. Phys., 2008, 77, 180404 CrossRef.
- J. Kondo, Resistance minimum in dilute magnetic alloys, Prog. Theor. Phys., 1964, 32, 37–49 CrossRef CAS.
- M. A. Reed, Inelastic electron tunneling spectroscopy, Mater. Today, 2008, 11, 46–50 CrossRef CAS.
- C. Outeiral, M. A. Vincent, A. Martín Pendás and P. L. A. Popelier, Revitalizing the concept of bond order through delocalization measures in real space, Chem. Sci., 2018, 9, 5517–5529 RSC.
- F. Neese, Software update: The ORCA program system Version 5.0, Wiley Interdiscip. Rev.: Comput. Mol. Sci., 2022, 12, e1606 Search PubMed.
- F. Weigend and R. Ahlrichs, Balanced basis sets of split valence, triple zeta valence and quadruple zeta valence quality for H to Rn: Design and assessment of accuracy, Phys. Chem. Chem. Phys., 2005, 7, 3297 RSC.
- T. Lu and F. Chen, Multiwfn: a multifunctional wavefunction analyzer, J. Comput. Chem., 2012, 33, 580–592 CrossRef CAS PubMed.
Footnote |
| † These authors contributed equally. |
|
| This journal is © the Partner Organisations 2025 |
Click here to see how this site uses Cookies. View our privacy policy here.  Open Access Article
 *,
Tomasz
Bednarek†
 ,
James
Pogrebetsky†
 and
Adam
Kubas
 *
*

![[thin space (1/6-em)]](https://www.rsc.org/images/entities/char_2009.gif) 000 papers have been published mentioning the experimental observation of FO, with 6000 focusing on theoretical approaches and 3000 employing computational methods.11 Upon thorough examination, the cited works could be divided into areas: scanning transmission microscopy (STM), Green's function (GF), linear response theory (LR), and surface states (SS).
000 papers have been published mentioning the experimental observation of FO, with 6000 focusing on theoretical approaches and 3000 employing computational methods.11 Upon thorough examination, the cited works could be divided into areas: scanning transmission microscopy (STM), Green's function (GF), linear response theory (LR), and surface states (SS).


![[r with combining right harpoon above (vector)]](https://www.rsc.org/images/entities/i_char_0072_20d1.gif) and is given as the following sum:
and is given as the following sum:
![[r with combining right harpoon above (vector)]](https://www.rsc.org/images/entities/i_char_0072_20d1.gif) )|2 is just a probability density of finding an electron |j〉 in the position
)|2 is just a probability density of finding an electron |j〉 in the position ![[r with combining right harpoon above (vector)]](https://www.rsc.org/images/entities/i_char_0072_20d1.gif) .
.


 surface. The authors have observed FOs in tunneling conductance (dI/dV) images, stemming from single point defects with kF = 0.45 nm−1. They have also mentioned that long-distance FOs from step-edges have been observed at up to approx. 50 nm distance, similar to most studies presented in this review.
![[1 with combining macron]](https://www.rsc.org/images/entities/char_0031_0304.gif) 0). Due to its nontrivial Fermi line, the Friedel oscillations are described by a non-trivial function much more complicated than our previous approximations (described in Section 1.4.2), and often requiring numerical integration.
0). Due to its nontrivial Fermi line, the Friedel oscillations are described by a non-trivial function much more complicated than our previous approximations (described in Section 1.4.2), and often requiring numerical integration.
![[1 with combining macron]](https://www.rsc.org/images/entities/char_0031_0304.gif) 0) surface. They have found oscillations in two directions with a periodicity of approx. 4.7 Å and 10.0 Å along and perpendicular to the stacking line, respectively. The anisotropicity may be tracked back to its unusual Fermi surface plot43 – the Be(10
0) surface. They have found oscillations in two directions with a periodicity of approx. 4.7 Å and 10.0 Å along and perpendicular to the stacking line, respectively. The anisotropicity may be tracked back to its unusual Fermi surface plot43 – the Be(10![[1 with combining macron]](https://www.rsc.org/images/entities/char_0031_0304.gif) 0) possesses a disconnected surface-state pocket around a distant Ā point (shown in Fig. 13(a)). Such a pocket causes plane-wave-like ripples of charge density (visible in Fig. 13(b)) instead of the expected circular-wave pattern, thus signifying anisotropy. Moreover, it is reflected in the following formula of total charge density at a distance along the y-axis from a step, derived by Hofmann et al.:73
0) possesses a disconnected surface-state pocket around a distant Ā point (shown in Fig. 13(a)). Such a pocket causes plane-wave-like ripples of charge density (visible in Fig. 13(b)) instead of the expected circular-wave pattern, thus signifying anisotropy. Moreover, it is reflected in the following formula of total charge density at a distance along the y-axis from a step, derived by Hofmann et al.:73

![[1 with combining macron]](https://www.rsc.org/images/entities/char_0031_0304.gif) 0) calculated using Quantum Espresso 7.3100,101 with the SSSP PBEsol Precision v1.3.0 functional102 and visualised using FermiSurfer.103 Highlighted k-points: k2 = 0.64 Å−1, k3 = 1.33 Å−1, k4 = 1.75 Å−1. (b) Anisotropic Friedel oscillations due to steps on the surface visible only along the y axis. Reprinted with permission from the work of Hofmann et al.73
0) calculated using Quantum Espresso 7.3100,101 with the SSSP PBEsol Precision v1.3.0 functional102 and visualised using FermiSurfer.103 Highlighted k-points: k2 = 0.64 Å−1, k3 = 1.33 Å−1, k4 = 1.75 Å−1. (b) Anisotropic Friedel oscillations due to steps on the surface visible only along the y axis. Reprinted with permission from the work of Hofmann et al.73![[1 with combining macron]](https://www.rsc.org/images/entities/char_0031_0304.gif) 0] directions, and almost non-existent along [100] and [010] directions. Such a model, treating Friedel oscillations while a non-trivial Fermi surface is present, predicts the charge density shift at a large distance R from the impurity to be99,104
0] directions, and almost non-existent along [100] and [010] directions. Such a model, treating Friedel oscillations while a non-trivial Fermi surface is present, predicts the charge density shift at a large distance R from the impurity to be99,104
![[k with combining right harpoon above (vector)]](https://www.rsc.org/images/entities/i_char_006b_20d1.gif) 1 perpendicular to the Fermi surface, C1 is the curvature at the point
1 perpendicular to the Fermi surface, C1 is the curvature at the point ![[k with combining right harpoon above (vector)]](https://www.rsc.org/images/entities/i_char_006b_20d1.gif) 1 measuring the flatness of the Fermi surface, δ is the phase shift dependent on the scattering and the Fermi surface, and t
1 measuring the flatness of the Fermi surface, δ is the phase shift dependent on the scattering and the Fermi surface, and t![[k with combining right harpoon above (vector)]](https://www.rsc.org/images/entities/i_char_006b_20d1.gif) 1;−
1;−![[k with combining right harpoon above (vector)]](https://www.rsc.org/images/entities/i_char_006b_20d1.gif) 1 is the scattering strength. The momentum vector
1 is the scattering strength. The momentum vector ![[k with combining right harpoon above (vector)]](https://www.rsc.org/images/entities/i_char_006b_20d1.gif) 1 from the Fermi surface is chosen in such a way that its respective group velocity points in the same direction as the position vector
1 from the Fermi surface is chosen in such a way that its respective group velocity points in the same direction as the position vector ![[v with combining right harpoon above (vector)]](https://www.rsc.org/images/entities/i_char_0076_20d1.gif)
![[k with combining right harpoon above (vector)]](https://www.rsc.org/images/entities/i_char_006b_20d1.gif) ‖
‖![[R with combining right harpoon above (vector)]](https://www.rsc.org/images/entities/i_char_0052_20d1.gif) .
.

![[k with combining right harpoon above (vector)]](https://www.rsc.org/images/entities/i_char_006b_20d1.gif) : ψ
: ψ![[k with combining right harpoon above (vector)]](https://www.rsc.org/images/entities/i_char_006b_20d1.gif) (
(![[r with combining right harpoon above (vector)]](https://www.rsc.org/images/entities/i_char_0072_20d1.gif) ) = exp(i
) = exp(i![[k with combining right harpoon above (vector)]](https://www.rsc.org/images/entities/i_char_006b_20d1.gif) ·
·![[r with combining right harpoon above (vector)]](https://www.rsc.org/images/entities/i_char_0072_20d1.gif) ). However, in the case of the spherically symmetric scattering potential, we may expand the scattered wave into the Legendre series,111 which results in the following equation:
). However, in the case of the spherically symmetric scattering potential, we may expand the scattered wave into the Legendre series,111 which results in the following equation:
 thus
thus

![[thin space (1/6-em)]](https://www.rsc.org/images/entities/char_2009.gif) kr/(kr). In order to calculate the total impurity-induced electron density change at position
kr/(kr). In order to calculate the total impurity-induced electron density change at position ![[r with combining right harpoon above (vector)]](https://www.rsc.org/images/entities/i_char_0072_20d1.gif) from the impurity, one has to account for all possible states within the energy region E ∈ [0, EF] (at the temperature T = 0 up to the Fermi energy EF; it starts from 0 due to the lack of other external potentials), thus arriving at eqn (13),
from the impurity, one has to account for all possible states within the energy region E ∈ [0, EF] (at the temperature T = 0 up to the Fermi energy EF; it starts from 0 due to the lack of other external potentials), thus arriving at eqn (13),


 . In other words, we retrieved all essential information about the hydrogen atom just from the total energy operator Ĥ.
![[x with combining right harpoon above (vector)]](https://www.rsc.org/images/entities/i_char_0078_20d1.gif) ,
, ![[y with combining right harpoon above (vector)]](https://www.rsc.org/images/entities/i_char_0079_20d1.gif) ) = −δ(d)(
) = −δ(d)(![[x with combining right harpoon above (vector)]](https://www.rsc.org/images/entities/i_char_0078_20d1.gif) −
− ![[y with combining right harpoon above (vector)]](https://www.rsc.org/images/entities/i_char_0079_20d1.gif) ),
),![[r with combining right harpoon above (vector)]](https://www.rsc.org/images/entities/i_char_0072_20d1.gif) ) is a generalised d-dimensional Dirac delta.120 We derived the general d-dimensional form of Green's function to be
) is a generalised d-dimensional Dirac delta.120 We derived the general d-dimensional form of Green's function to be


![[z with combining right harpoon above (vector)]](https://www.rsc.org/images/entities/b_char_007a_20d1.gif) ′) is the perturbing potential at point
′) is the perturbing potential at point ![[z with combining right harpoon above (vector)]](https://www.rsc.org/images/entities/b_char_007a_20d1.gif) ′. In other words, the Lindhard function χ0(
′. In other words, the Lindhard function χ0(![[x with combining right harpoon above (vector)]](https://www.rsc.org/images/entities/b_char_0078_20d1.gif) ,
, ![[z with combining right harpoon above (vector)]](https://www.rsc.org/images/entities/b_char_007a_20d1.gif) ′) tells us how perturbation at point
′) tells us how perturbation at point ![[z with combining right harpoon above (vector)]](https://www.rsc.org/images/entities/b_char_007a_20d1.gif) ′ affects the electrons at point
′ affects the electrons at point ![[x with combining right harpoon above (vector)]](https://www.rsc.org/images/entities/b_char_0078_20d1.gif) (and vice versa). Then we sum over all possible points
(and vice versa). Then we sum over all possible points ![[z with combining right harpoon above (vector)]](https://www.rsc.org/images/entities/b_char_007a_20d1.gif) ′, and we obtain the total contribution towards charge density at point
′, and we obtain the total contribution towards charge density at point ![[x with combining right harpoon above (vector)]](https://www.rsc.org/images/entities/b_char_0078_20d1.gif) .
.


![[R with combining right harpoon above (vector)]](https://www.rsc.org/images/entities/i_char_0052_20d1.gif) −
− ![[R with combining right harpoon above (vector)]](https://www.rsc.org/images/entities/i_char_0052_20d1.gif) ′—we get7
′—we get7
![[k with combining right harpoon above (vector)]](https://www.rsc.org/images/entities/i_char_006b_20d1.gif) ) = E(k) function, then we obtain
) = E(k) function, then we obtain


 .
.


 is an auxiliary variable introduced to simplify the expression. The above Green's function describes the propagation between 0 ≤ x0 ≤ a and r points in a crystal of the lattice constant a,
  is the integer index, and P = λa/2 is the renormalized crystal-potential strength. Except for this very formula, to the best of our knowledge, there is no other analytical description of the Kronig–Penney models in d ≥ 2-dimensions.


 is the associated Fermi wavevector, m* is the effective mass of the considered band and δF is the standard Fermi-level phase shift. They derived the above equation in the following way: for an interference-related density of states (DOS) difference, we obtain
 denotes
  and Ti(E) functions denote the T-matrices characterizing the scattering from the i-th adatom, whereas G0(E) is a one-electron Green's function for the bare surface. Fortunately, we can approximate the above integral as below:


 as a shape-dependent dimensionless ratio and d123 = d12 + d23 + d31 is the traversed distance by electrons scattered by all three adsorbates (which is a leading-order factor in this interaction).

![[S with combining right harpoon above (vector)]](https://www.rsc.org/images/entities/i_char_0053_20d1.gif) i,
i, ![[S with combining right harpoon above (vector)]](https://www.rsc.org/images/entities/i_char_0053_20d1.gif) j are the relevant interacting spins, |Δ|2 is the strength of the hyperfine interaction, m* is the effective electron mass inside the crystal and kF is the Fermi momentum. The quantity
j are the relevant interacting spins, |Δ|2 is the strength of the hyperfine interaction, m* is the effective electron mass inside the crystal and kF is the Fermi momentum. The quantity  is introduced to generalize the problem for any quantum system, but for the above case it is


 is the average value of the auxiliary quantity
  over the considered regions. The z-axis is defined as being along the
 ![[r with combining right harpoon above (vector)]](https://www.rsc.org/images/entities/i_char_0072_20d1.gif) direction, and points
direction, and points ![[k with combining right harpoon above (vector)]](https://www.rsc.org/images/entities/i_char_006b_20d1.gif) 1,
1, ![[k with combining right harpoon above (vector)]](https://www.rsc.org/images/entities/i_char_006b_20d1.gif) 2 are respectively the lowest and highest points of the considered Fermi surface. Vectors
2 are respectively the lowest and highest points of the considered Fermi surface. Vectors ![[v with combining right harpoon above (vector)]](https://www.rsc.org/images/entities/i_char_0076_20d1.gif) 1,
1, ![[v with combining right harpoon above (vector)]](https://www.rsc.org/images/entities/i_char_0076_20d1.gif) 2 are their respective z-axis-projected normal vectors (see Fig. 20). Roth et al.127 demonstrated that, contrary to expectations based on the d-dimensional case of Friedel oscillations, in certain three-dimensional quantum systems, if the Fermi surface contains lower-dimensional components (such as flat or cylindrical sections), the decay of the RKKY interaction—and by analogy, the Friedel oscillations—is slowed or dampened, leading to “slower” decay and persistence over longer distances.
2 are their respective z-axis-projected normal vectors (see Fig. 20). Roth et al.127 demonstrated that, contrary to expectations based on the d-dimensional case of Friedel oscillations, in certain three-dimensional quantum systems, if the Fermi surface contains lower-dimensional components (such as flat or cylindrical sections), the decay of the RKKY interaction—and by analogy, the Friedel oscillations—is slowed or dampened, leading to “slower” decay and persistence over longer distances.


 then both roots lie exactly on a unit circle |z−| = |z+| = 1. However, if we consider a limit ω → ω + i0, then we can notice that z− always lies within the unit circle, whereas z+ is placed outside. Therefore

![[thin space (1/6-em)]](https://www.rsc.org/images/entities/char_2009.gif) cos
cos![[thin space (1/6-em)]](https://www.rsc.org/images/entities/char_2009.gif) θ. Then we can rewrite Green's function in the following way:
θ. Then we can rewrite Green's function in the following way:


 we obtain in the long-distance regime kFr ≫ 1


![[K with combining right harpoon above (vector)]](https://www.rsc.org/images/entities/i_char_004b_20d1.gif) denotes the wavevector of graphene's K-point, δ is the energy of adatom resonance (in other words describing the detuning of resonance from the Dirac point), v0 is the electron Fermi velocity, W is the electron half-bandwidth, and K0 and K1 are the modified Bessel functions of the second kind.94 The above integral may be significantly simplified if we notice that the Bessel functions might be approximated by their asymptotic, leading to the following expression for the same-sublattice repulsive interaction (AA case)
denotes the wavevector of graphene's K-point, δ is the energy of adatom resonance (in other words describing the detuning of resonance from the Dirac point), v0 is the electron Fermi velocity, W is the electron half-bandwidth, and K0 and K1 are the modified Bessel functions of the second kind.94 The above integral may be significantly simplified if we notice that the Bessel functions might be approximated by their asymptotic, leading to the following expression for the same-sublattice repulsive interaction (AA case)


![[r with combining right harpoon above (vector)]](https://www.rsc.org/images/entities/i_char_0072_20d1.gif) is the position we probe for the charge density,
is the position we probe for the charge density,  is any point from which the electron propagates to
 ![[r with combining right harpoon above (vector)]](https://www.rsc.org/images/entities/i_char_0072_20d1.gif) ,
,  is the Lindhard response function describing how the potential at
  contributes to the charge density at
 ![[r with combining right harpoon above (vector)]](https://www.rsc.org/images/entities/i_char_0072_20d1.gif) , and finally
, and finally  is the external potential (here caused by an external impurity). The Lindhard response function is expressed in the following way:
![[k with combining right harpoon above (vector)]](https://www.rsc.org/images/entities/i_char_006b_20d1.gif) ‖ is just a 2D-surface wavevector, fi(
‖ is just a 2D-surface wavevector, fi(![[k with combining right harpoon above (vector)]](https://www.rsc.org/images/entities/i_char_006b_20d1.gif) ‖ +
‖ + ![[q with combining right harpoon above (vector)]](https://www.rsc.org/images/entities/i_char_0071_20d1.gif) ‖) is the Fermi function describing the probability of an electron being in a state i and with the wavevector
‖) is the Fermi function describing the probability of an electron being in a state i and with the wavevector ![[k with combining right harpoon above (vector)]](https://www.rsc.org/images/entities/i_char_006b_20d1.gif) ‖ +
‖ + ![[q with combining right harpoon above (vector)]](https://www.rsc.org/images/entities/i_char_0071_20d1.gif) ‖, ω is the probing energy, and
‖, ω is the probing energy, and ![[q with combining right harpoon above (vector)]](https://www.rsc.org/images/entities/i_char_0071_20d1.gif) ‖ is the particular wavevector. The meaning of the above formula is to measure how much an electron would scatter from a given potential with the wavevector change
‖ is the particular wavevector. The meaning of the above formula is to measure how much an electron would scatter from a given potential with the wavevector change ![[q with combining right harpoon above (vector)]](https://www.rsc.org/images/entities/i_char_0071_20d1.gif) ‖ at a probing energy ω.
‖ at a probing energy ω.
 ) with two 2D Fermi liquids (i.e. 2D interacting electron gases describing the typical state of the majority of metals at low enough temperatures)48 on both sides. They obtained two interesting things (in terms of this review): (1) when the dipole oscillates close to the TI (i.e. at a distance of 5 nm), then the charge density oscillations (of wavelength ≈100 nm) on those two sides are in counter phase; however when the dipole is instead far from the TI (i.e. at about 150 nm), then we can notice the oscillations (of wavelength ≈1000 nm) to be in phase instead, and (2) they also obtained the charge- and spin-density 3D plots, showing the oscillatory decaying patterns, which are also presented in Fig. 22. Plots of surface charge density distributions are shown in Fig. 22 for both cases. Moreover, we may notice that in the former case (i.e. of the dipole close by), we obtain almost zero average charge density, but the spin-density oscillations do not vanish, whereas in the latter case (i.e. of the dipole far away), we get the reverse situation – the average spin-density is almost non-existent, while the average charge-density is quite apparent. Furthermore, we may relate those quantities by the following simple formula:


 profiles (see blue and red lines in Fig. 25). However, EDR shows that electrons delocalize slightly more in cumulene over large distances than in polyyne. Owing to the success of free-electron gas approximation in describing FOs in both systems, it is not surprising that the EDR profile for the 3D free electron gas has a very similar shape as the EDRs for actual molecules (see the black line in Fig. 25).
![[1 with combining macron]](https://www.rsc.org/images/entities/char_0031_0304.gif) n) series, the structures with low Miller indices show less stability than their higher-index counterparts. Interestingly, they have found that FOs may be responsible for local relaxation in such low-index surfaces (see Fig. 30).
n) series, the structures with low Miller indices show less stability than their higher-index counterparts. Interestingly, they have found that FOs may be responsible for local relaxation in such low-index surfaces (see Fig. 30).


![[1 with combining macron]](https://www.rsc.org/images/entities/char_0031_0304.gif) 0), (c1) Mg(10
0), (c1) Mg(10![[1 with combining macron]](https://www.rsc.org/images/entities/char_0031_0304.gif) 1), (d1) Mg(10
1), (d1) Mg(10![[1 with combining macron]](https://www.rsc.org/images/entities/char_0031_0304.gif) 3) and (e1) Mg(10
3) and (e1) Mg(10![[1 with combining macron]](https://www.rsc.org/images/entities/char_0031_0304.gif) 8). Subsequent top-down views of charge transfer are presented for (a2) Mg(0001), (b2) Mg(10
8). Subsequent top-down views of charge transfer are presented for (a2) Mg(0001), (b2) Mg(10![[1 with combining macron]](https://www.rsc.org/images/entities/char_0031_0304.gif) 0), (c2) Mg(10
0), (c2) Mg(10![[1 with combining macron]](https://www.rsc.org/images/entities/char_0031_0304.gif) 1), (d2) Mg(10
1), (d2) Mg(10![[1 with combining macron]](https://www.rsc.org/images/entities/char_0031_0304.gif) 3) and (e2) Mg(10
3) and (e2) Mg(10![[1 with combining macron]](https://www.rsc.org/images/entities/char_0031_0304.gif) 8). Cross-sectional views of charge densities are displayed for (a3) Mg(0001), (b3) Mg(10
8). Cross-sectional views of charge densities are displayed for (a3) Mg(0001), (b3) Mg(10![[1 with combining macron]](https://www.rsc.org/images/entities/char_0031_0304.gif) 0), (c3) Mg(10
0), (c3) Mg(10![[1 with combining macron]](https://www.rsc.org/images/entities/char_0031_0304.gif) 1), (d3) Mg(10
1), (d3) Mg(10![[1 with combining macron]](https://www.rsc.org/images/entities/char_0031_0304.gif) 3) and (e3) Mg(10
3) and (e3) Mg(10![[1 with combining macron]](https://www.rsc.org/images/entities/char_0031_0304.gif) 8). The topmost surface layer is indicated with an underline. In the charge transfer sections specifically in graphs (a2), (b2), (c2), (d2), and (e2) light blue and yellow squares represent charge depletion and accumulation in the surface region. The color bar illustrates the logarithmic range of charge densities from low (blue 1) to high (red 30), and the charge density value for a specific line can be obtained by the formula ρ = 0.001 × 2n/2. Reprinted with permission from the work of Tang et al.154
8). The topmost surface layer is indicated with an underline. In the charge transfer sections specifically in graphs (a2), (b2), (c2), (d2), and (e2) light blue and yellow squares represent charge depletion and accumulation in the surface region. The color bar illustrates the logarithmic range of charge densities from low (blue 1) to high (red 30), and the charge density value for a specific line can be obtained by the formula ρ = 0.001 × 2n/2. Reprinted with permission from the work of Tang et al.154


![[x with combining right harpoon above (vector)]](https://www.rsc.org/images/entities/i_char_0078_20d1.gif) −
− ![[y with combining right harpoon above (vector)]](https://www.rsc.org/images/entities/i_char_0079_20d1.gif) |. This approach allows to deliver the following:
|. This approach allows to deliver the following:
![[r with combining right harpoon above (vector)]](https://www.rsc.org/images/entities/i_char_0072_20d1.gif) ) = Ωdrd−1δ(r), and we use the radial term for the Laplacian in d dimensions. In the region where r > 0 and the Dirac delta is zero, we obtain instead
) = Ωdrd−1δ(r), and we use the radial term for the Laplacian in d dimensions. In the region where r > 0 and the Dirac delta is zero, we obtain instead


 94 and the second kind
  .94 The asymptotic series associated with the above function is given below (for large enough r → ∞):
 is satisfied as long as d ≥ 1. However, we also require the analytic continuation118 (in our case defined by replacing
  with
with  ) to satisfy the boundary condition, meaning

![[c with combining tilde]](https://www.rsc.org/images/entities/i_char_0063_0303.gif) 1 = −i
1 = −i![[c with combining tilde]](https://www.rsc.org/images/entities/i_char_0063_0303.gif) 2 ⇒ c1 = −ic2 and Green's function takes the form
2 ⇒ c1 = −ic2 and Green's function takes the form
 is the Hankel function of the first kind.94 Let us now consider the short-distance asymptotic instead for d = 2


 is a finite constant defined as


 . Therefore it appears that both of the abovementioned cases can be incorporated into the general formula:

![[r with combining right harpoon above (vector)]](https://www.rsc.org/images/entities/i_char_0072_20d1.gif) ,
, ![[r with combining right harpoon above (vector)]](https://www.rsc.org/images/entities/i_char_0072_20d1.gif) 2,…,
2,…, ![[r with combining right harpoon above (vector)]](https://www.rsc.org/images/entities/i_char_0072_20d1.gif) N) we can introduce non-local one-electron density matrix defined as
N) we can introduce non-local one-electron density matrix defined as
![[r with combining right harpoon above (vector)]](https://www.rsc.org/images/entities/i_char_0072_20d1.gif) ) ≡ ϱ1(
) ≡ ϱ1(![[r with combining right harpoon above (vector)]](https://www.rsc.org/images/entities/i_char_0072_20d1.gif) ;
;![[r with combining right harpoon above (vector)]](https://www.rsc.org/images/entities/i_char_0072_20d1.gif) ) and pair density. The last appears as
) and pair density. The last appears as
![[r with combining right harpoon above (vector)]](https://www.rsc.org/images/entities/i_char_0072_20d1.gif) 1,
1, ![[r with combining right harpoon above (vector)]](https://www.rsc.org/images/entities/i_char_0072_20d1.gif) 2) ≡ ϱ(
2) ≡ ϱ(![[r with combining right harpoon above (vector)]](https://www.rsc.org/images/entities/i_char_0072_20d1.gif) 1)ϱ(
1)ϱ(![[r with combining right harpoon above (vector)]](https://www.rsc.org/images/entities/i_char_0072_20d1.gif) 2) − ϱ2(
2) − ϱ2(![[r with combining right harpoon above (vector)]](https://www.rsc.org/images/entities/i_char_0072_20d1.gif) 1,
1, ![[r with combining right harpoon above (vector)]](https://www.rsc.org/images/entities/i_char_0072_20d1.gif) 2).
2). into disjoint (non-overlapping) atomic basins or quantum atoms Ωi (containing only the i-th atom) in such a way that the so-called zero-flux condition holds (meaning that the electron density ϱ(
![[r with combining right harpoon above (vector)]](https://www.rsc.org/images/entities/i_char_0072_20d1.gif) ) stays almost constant while crossing the boundary surface ∂Ωi)
) stays almost constant while crossing the boundary surface ∂Ωi)


![[r with combining right harpoon above (vector)]](https://www.rsc.org/images/entities/i_char_0072_20d1.gif) ′;
′; ![[r with combining right harpoon above (vector)]](https://www.rsc.org/images/entities/i_char_0072_20d1.gif) ) and it describes how much an electron at point
) and it describes how much an electron at point ![[r with combining right harpoon above (vector)]](https://www.rsc.org/images/entities/i_char_0072_20d1.gif) delocalizes over a distance l
delocalizes over a distance l
![[r with combining right harpoon above (vector)]](https://www.rsc.org/images/entities/i_char_0072_20d1.gif) ,
, ![[r with combining right harpoon above (vector)]](https://www.rsc.org/images/entities/i_char_0072_20d1.gif) ′; l) is given in the following way
′; l) is given in the following way
![[r with combining right harpoon above (vector)]](https://www.rsc.org/images/entities/i_char_0072_20d1.gif) , u) ≤ 1 is always bounded. Using EDR we can easily investigate the various delocalization degrees of electrons in a given molecule. For instance, let us take a look at naphthalene (Fig. 34).
, u) ≤ 1 is always bounded. Using EDR we can easily investigate the various delocalization degrees of electrons in a given molecule. For instance, let us take a look at naphthalene (Fig. 34).

 weighted over the electron distribution density ϱ(
![[r with combining right harpoon above (vector)]](https://www.rsc.org/images/entities/i_char_0072_20d1.gif) )
)
![[n with combining breve]](https://www.rsc.org/images/entities/char_006e_0306.gif) , I. A. Nechaev, A. Y. Nikitin, P. M. Echenique, V. M. Silkin, J. Aizpurua and R. Esteban, Controlling surface charge and spin density oscillations by Dirac plasmon interaction in thin topological insulators, Phys. Rev. B, 2018, 97, 115420 CrossRef CAS.
, I. A. Nechaev, A. Y. Nikitin, P. M. Echenique, V. M. Silkin, J. Aizpurua and R. Esteban, Controlling surface charge and spin density oscillations by Dirac plasmon interaction in thin topological insulators, Phys. Rev. B, 2018, 97, 115420 CrossRef CAS.


