 Open Access Article
Deep-learning-enhanced modeling of electrosprayed particle assembly on non-spherical droplet surfaces†
Nasir
Amiri
a,
Joseph M.
Prisaznuk
b,
Peter
Huang
b,
Paul R.
Chiarot
 *b and
Xin
Yong
 *a
*a
aDepartment of Mechanical and Aerospace Engineering, University at Buffalo, Buffalo, NY 14260, USA. E-mail: xinyong@buffalo.edu
bDepartment of Mechanical Engineering, Binghamton University, Binghamton, NY 13902, USA. E-mail: pchiarot@binghamton.edu
First published on 23rd December 2024
Abstract
Monolayer assembly of charged colloidal particles at liquid interfaces opens a new avenue for advancing the additive manufacturing of thin film materials and devices with tailored properties. In this study, we investigated the dynamics of electrosprayed colloidal particles at curved droplet interfaces through a combination of physics-based computational simulations and machine learning. We employed a novel mesh-constrained Brownian dynamics (BD) algorithm coupled with Ansys® electric field simulations to model the transport and assembly of charged particles on a non-spherical droplet surface. We demonstrated that the electrostatic repulsion between particles, electrophoretic forces induced by substrate surface charge, and Brownian motion are the key factors influencing the compactness and ordering of the assembly structure. We further trained a deep neural network surrogate model using the data generated from the BD simulations to predict radial distribution functions (RDF) of particle assembly. By coupling the surrogate model with Bayesian optimization, we identified the optimal particle and substrate charge densities that yield the best match between the simulation and experimental assembly. Using the optimal charge densities, the RDF profile of the simulated assembly accurately matches the experiment with a similarity of 96.4%, and the corresponding average bond order parameter differs by less than 5% from the experimental one. This deep-learning-based approach significantly reduces computational time while maintaining high accuracy in predicting the important features of the assembly structures. The charge densities inferred from the modeling provide critical insights into the surface charge accumulation in the electrospray process.
Introduction
Colloidal particles at liquid–air interfaces have garnered significant interest due to their ability to enrich an interface with unique physicochemical properties, enabling broad applications across various fields. When colloidal particles are adsorbed onto a fluid interface, the interfacial energy of the system is reduced, making the adsorption process thermodynamically favorable. Subsequently, the particles can experience complex interparticle forces and/or be exposed to external fields, which drive the particles to arrange into ordered structures,1 a phenomenon referred to as self-assembly or directed self-assembly. Depending on the particle size, shape, density, and surface properties, they organize into diverse structures ranging from hexagonally packed crystal arrays and linear strings to disordered and fractal patterns.2–6 The curvature of the underlying interface also plays a crucial role in determining the assembly structure.3,7–9 Confinement and geometrical effects are also important factors in shaping the assembly.10–13 This interfacial assembly process offers new opportunities to develop novel techniques for fabricating functional colloidal materials.6,14–16An essential step of interfacial colloidal assembly is introducing particles to the liquid interface. Conventional methods rely on the spontaneous adsorption of particles from the bulk or mechanically dispensing a film (as in the Langmuir–Blodgett approach) or a droplet of particle suspensions to the interface.17–20 In the latter, the particles are deposited onto the interface as the solvent evaporates or spreads. However, these methods have a few notable drawbacks, including low throughput and materials waste, and can significantly disturb the interface. Our team previously implemented electrospray, widely used in mass spectrometry for analyzing large biomolecules, as a non-intrusive targeting method for delivering charged colloidal particles directly to liquid interfaces with minimal disturbance.21,22 In this process, high voltage is applied to a spray manifold with a fluid emitter to generate an aerosol plume of highly charged, micrometer-sized droplets from a dilute colloidal suspension. The strong electric field directs these particle–laden droplets toward the target liquid interface that is connected to ground. Upon rapid evaporation of the solvent in flight, dry particles can be gently deposited onto the target interface.21,22 The application of electrospray to deliver colloidal particles to liquid droplet surfaces has opened new avenues for fundamental research and technological innovation.
There are two fundamental differences between electrospray particle delivery and more traditional methods. First, electrospray imparts a significant electric charge to the particles,23 which subsequently influences their behavior and interactions at the liquid interface. Our previous study showed that electrosprayed particles formed non-closed-packed clusters on the droplet surface. Even with the addition of salt in the droplet, the interfacial particles remained well separated over tens of minutes.22 This result suggests significant surface charges on the air side of the particles and their slow dissipation. Second, when targeting a sessile droplet, there is concomitant charge transfer to the surrounding substrate. Previous studies on electrospray deposition demonstrated a thickness-limited coating regime, indicating that accumulated charge in the deposit can repel newly arriving spray and self-limit the film growth.24–26 We have shown that the residual charge on the substrate can result in a global electric field affecting the assembly dynamics and the spatial organization of charged particles at the droplet surface.22 Our study suggests a complex interplay among various electrostatic interactions and Brownian motion in the interfacial assembly of electrosprayed particles. These interactions include not only those between the particles themselves but also between the particles and the substrate-charge-induced field. Parameters like particle surface charge density and substrate surface charge density significantly impact the assembly structure. However, accurately probing post-spray particle and substrate charge in experiments remains daunting.
Machine learning approaches are particularly valuable in scenarios where conducting experiments or simulations are resource extensive, time consuming, or practically challenging. These approaches enable efficient exploration and prediction of complex systems with high accuracy. In colloidal systems, machine learning can be employed to predict or analyze particle assembly behaviors. For instance, deep learning has been implemented to characterize the self-assembly structures of 3D colloidal systems by reducing the dimensionality of neighborhood graphs.27 It has also been integrated into hybrid approaches, such as through combining with molecular modeling and simulations, to improve the prediction of material properties and the design of colloidal materials.28 Furthermore, neural networks have been trained for applications like identifying local crystalline order in various colloidal particle systems using diverse inputs, including symmetry functions, bond order parameters, particle positions, and image data. These trained networks can subsequently serve as order parameters for analyzing local structures.29–32
The present study aims to integrate physics-based modeling and machine learning to elucidate the dynamics of electrosprayed particles on a geometrically controlled droplet surface and infer surface charge accumulation in electrospray. The detailed electric field induced by the surrounding substrate and the behavior of electrosprayed particles on curved droplet surfaces has not been studied extensively before, stressing the need to probe and understand the physics behind their dynamics and assembly. We combined a novel mesh-constrained Brownian dynamics (BD) algorithm with Ansys® electric field simulations to investigate how the competition between various electrostatic interactions influences particle assembly. This BD algorithm represents an advanced and recently introduced method, offering enhanced capabilities for accurately simulating colloidal interactions and dynamics on arbitrary manifolds. We then employed an artificial neural network (ANN) surrogate model and Bayesian optimization (BO) to infer particle and substrate charges that are challenging to probe with experiments. To the extent of our knowledge, this study represents the first attempt to explore the complex behavior of electrosprayed colloidal particles at curved liquid interfaces through machine-learning-assisted computational simulations. The findings from this research could potentially lead to new strategies for manipulating and controlling the interfacial assembly of colloidal particles, thereby advancing the design of novel materials and devices with tailored properties.
Results and discussion
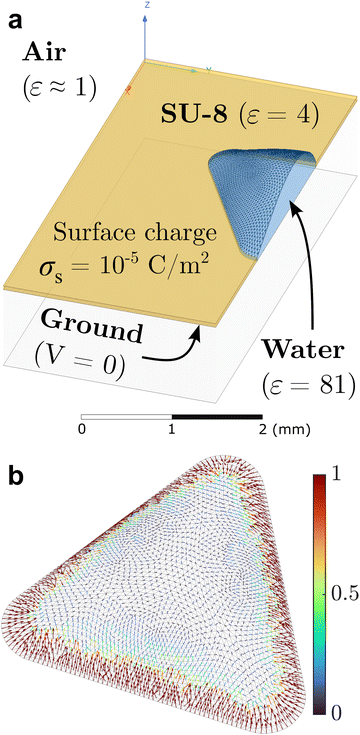
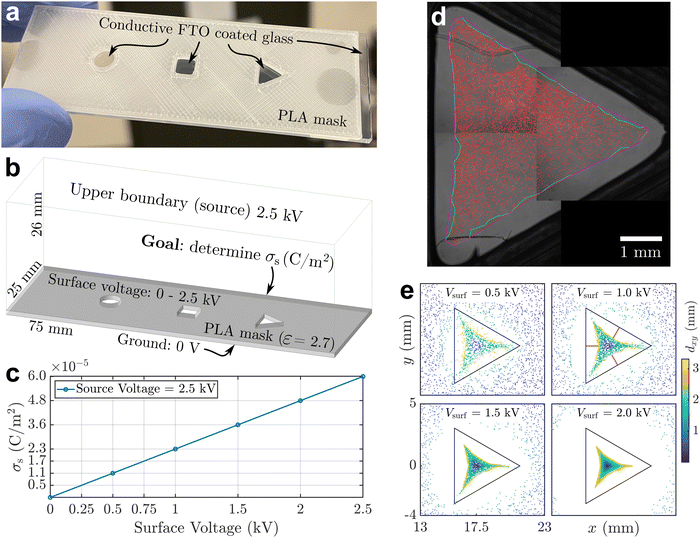
To quantitatively understand the assembly dynamics and structure evolution of electrosprayed particles, we employed a new BD algorithm to simulate the interaction and motion of charged particles on the sessile droplet with a triangular contact line footprint as in our previous experimental study (Fig. 1). This study explores the interplay between interparticle electrical repulsions and electrophoretic forces attributed to an external electric field. We first determined the electrostatic field induced by the substrate surface charge accumulated during electrospray. Using Ansys®, we modeled the droplet and surrounding substrate with geometries and materials properties according to the experimental setup (Fig. 2a) and conducted electrostatic analysis to solve the field, assuming a uniform substrate surface charge density σs as the input. The results indicate that the tangential component dominates the air-side field near the water–air interface. Fig. 2b shows that the tangential electric field at the interface generally points toward the droplet center, with its strength being the highest near the contact line and gradually diminishing toward the center. This electric field contributes to the formation of the depletion region by applying electrophoretic forces that drive charged particles away from the contact line and toward the center of the interface. Our Ansys® simulations also show that varying σs proportionally varies the magnitude of the local electric field without changing its direction. The electric field data from Ansys® at each vertex of the mesh was then interpolated to each particle position on the mesh using a linear shape function to obtain the electrophoretic force. Due to the linear interpolation, the strength of the electrophoretic force acting on a particle scales linearly with σs for a given particle charge density σp while the direction remains unchanged.Despite not affecting the electric field distribution, the absolute value of σs inevitably influences the competition between particle–particle and particle–field interactions. We conducted an independent experiment, summarized in Fig. 3, to obtain a first-order approximation for σs. Fig. 3a shows a 3D printed mask made of PLA (polylactic acid) attached to an FTO (fluorine-doped tin oxide) coated glass slide with cutouts, similar to the substrate used in our interfacial targeting experiments.22 When this substrate is targeted with electrospray, surface charge accumulates on the insulative mask and the deposited material is primarily guided to the grounded FTO surface at the bottom of the circle, square, and triangle cutouts. As shown in Fig. 3b and c, we created a simplified model of the mask and found the expected surface charge density, σs, which matches the theoretical result based on an ideal capacitor σs = ε0εrV/d. This calculation already provides us with an upper bound for the surface charge density of 6 × 10⁻⁵ C m−2, since the potential at the mask surface cannot exceed the spray voltage. To narrow the expected range for σs, we compare the experimental deposition of particles in the triangular cutout to the expected deposition pattern from the electrostatic model as shown in Fig. 3d and e. The numerical results for Vsurf ≥ 1 kV show a significantly wider “depletion region” than the experiment, so based on Fig. 3c we estimate that the surface charge density lies between 5 × 10⁻⁶ and 1.7 × 10⁻⁵ C m−2 given 0.25 kV ≤ Vsurf ≤ 0.75 kV. In the following BD simulations, we consider 1 × 10⁻⁵ C m−2 as the reference value of σs.
The BD simulation considers two electrostatic forces governing the dynamics of particles: interparticle repulsion, proportional to σp2, and the substrate-induced phoretic force, proportional to σp·σs. Thus, the competition between these forces is dictated by the magnitudes of the free parameters σp and σs. Tang and Gomez demonstrated that dry nanoparticles retain charges of the carrier droplets immediately before complete solvent evaporation.23 Thus, we consider that σp is bounded by the Rayleigh limit charge of the liquid droplet of the same size as the particles.33 Assuming constant σp for all particles, we introduce the ratio of the particle to substrate charge densities κ = σp/σs to tune the relative strength of the two forces.
Integrating the electrostatic field from our Ansys® simulations into the BD algorithm, we simulated 9000 particles of a radius of 1 μm randomly placed on the triangular droplet surface. The total number of particles, their size, and droplet dimensions are consistent with our experiments. Starting with a random distribution, the particles first move toward the center part of the droplet surface under the dominant electrophoretic forces. As the particles pack together while moving away from the contact line, the decreasing electrophoretic forces are gradually balanced by increasing electrostatic repulsions (see Fig. S1a for the time evolution of the assembly, ESI†). We quantitatively monitor the structural evolution by calculating the variations in local particle density between consecutive time frames, as shown in Fig. S1b (ESI†). The fully developed configuration is a non-closed-packed cluster at the droplet center with a particle-free zone near the contact line, which agrees well with the experimental observation.22 Below, we analyze the fully developed particle assembly in detail.
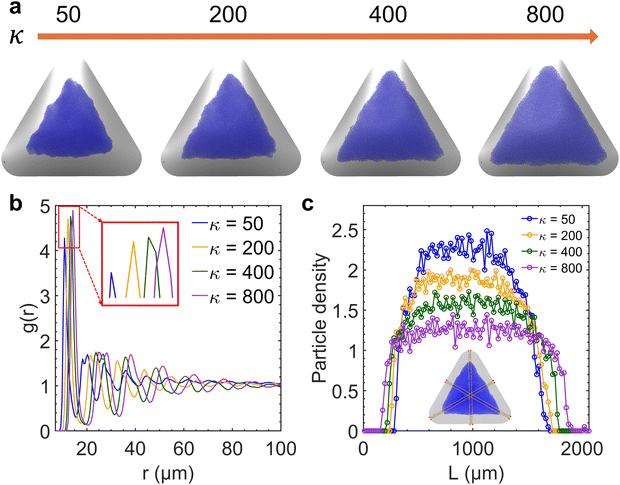
We performed a series of preliminary simulations with different combinations of σp and σs in an extensive range of values (σp changes between 1 × 10⁻³ and 8 × 10⁻³ C m−2 and σs changes between 2 × 10⁻⁶ and 3 × 10⁻⁴ C m−2). The results show that the final particle density in the fully developed assembly is determined solely by κ and not the absolute values of σp and σs, given that electrostatic forces are strong enough to overpower Brownian motion driven by thermal fluctuations (e.g., at the reference value σs = 1 × 10⁻⁵ C m−2). In this regime, varying κ effectively adjusts the relative strength between the electrophoretic forces and interparticle repulsions, thereby controlling the compactness of the assembly structure. As shown in Fig. 4a, the overall particle assembly enlarges with larger interparticle distances as κ increases, implying that particles are moved apart due to enhanced electrostatic repulsion. Fig. 4b provides quantitative evidence of the structural changes by presenting the radial distribution function (RDF) for each κ value, which characterizes the packing and ordering of the particle assembly. The position of the first peak in the RDF reflects the average distance between a reference particle and its nearest neighbors. The presence of multiple peaks at specific distances indicates local ordering. The first peak in the RDF corresponds to the nearest-neighbor distance, while the second peak arises due to the second-nearest neighbors. These two distances are geometrically related in a hexagonal lattice, with the second peak located at approximately  times the distance of the first peak. Therefore, the emergence of this specific proportional relationship between the first and second peaks is a clear indicator of local hexagonal ordering in our system. We observe that the first peak position shifts to the right as κ increases, confirming that the particles are increasingly separated from their neighbors at higher κ values. The wider distribution of particle density for higher κ values in Fig. 4c also indicates the expansion of the overall assembly, attributed to increasing interparticle distances.
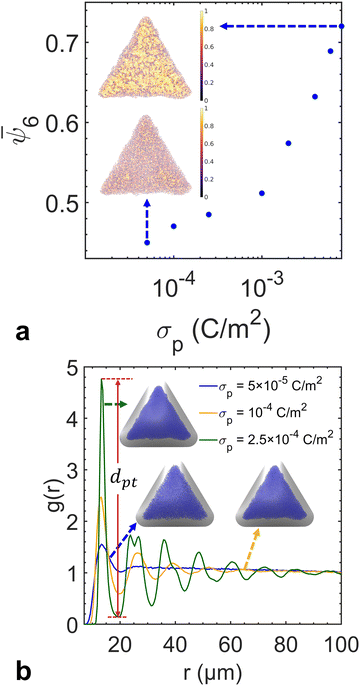
So far, we have simulated the assembly in a regime with large values of σp and σs, in which Brownian motion is negligible compared to electrostatic forces. To assess the influence of Brownian motion on the degree of particle ordering, we reduce charge densities to a level where Brownian motion becomes comparable to the electrostatic forces. Based on each particle position, we triangulate the particle assembly following the Delaunay criterion to define the nearest neighbors for each particle (Fig. S2, ESI†). The cutoff distance is selected to be the first trough position in the RDF to define its coordination number Nc. The sixfold orientation order parameter  is calculated to quantify the systems with hexagonal or near-hexagonal packing, where θj is the angle between a vector connecting the reference particle and its j-th neighbor and an arbitrary reference axis. A value of ψ6 = 1 corresponds to that the nearest neighbors of a reference particle form perfect hexagonal ordering, while ψ6 = 0 indicates a completely disordered state. As shown in Fig. 5a, the ensemble-averaged
 ![[small psi, Greek, macron]](https://www.rsc.org/images/entities/i_char_e0d9.gif) 6 decreases monotonically by reducing σp for a fixed κ (i.e., both particle and substrate charge densities decrease proportionally). This confirms that when Brownian force becomes comparable to electrostatic forces, the assembly order is disrupted due to thermal fluctuations. The RDF profiles in Fig. 5b show that σp does not affect the first peak position of the RDF when the κ value remains constant. This consistency implies that the relative strength of Brownian motion against electrostatic interactions does not influence the average interparticle distance. However, decreasing σp (and σs) reduces the difference between the first peak and the first trough values in the RDF, which can be correlated to the decrease in the orientational order parameter (Fig. S3, ESI†). Therefore, the first peak-to-trough distances of the RDF can also serve as a metric for particle ordering, with a greater distance signifying a higher level of ordering within the assembly. In summary, the RDF profile provides information on both particle density and local ordering in the assembly.
6 decreases monotonically by reducing σp for a fixed κ (i.e., both particle and substrate charge densities decrease proportionally). This confirms that when Brownian force becomes comparable to electrostatic forces, the assembly order is disrupted due to thermal fluctuations. The RDF profiles in Fig. 5b show that σp does not affect the first peak position of the RDF when the κ value remains constant. This consistency implies that the relative strength of Brownian motion against electrostatic interactions does not influence the average interparticle distance. However, decreasing σp (and σs) reduces the difference between the first peak and the first trough values in the RDF, which can be correlated to the decrease in the orientational order parameter (Fig. S3, ESI†). Therefore, the first peak-to-trough distances of the RDF can also serve as a metric for particle ordering, with a greater distance signifying a higher level of ordering within the assembly. In summary, the RDF profile provides information on both particle density and local ordering in the assembly.
Throughout our study, we have identified two critical factors influencing the interfacial assembly structure: the ratio of particle-to-substrate charge density κ and the relative strength of Brownian motion compared to electrostatic forces dictated by the magnitude of σp (or σs). Our next objective is to find a pair of κ and σp that yields a simulation assembly structure that best matches with experiments. We note that deviations from hexagonal ordering in experiments can be ascribed to thermal fluctuations and weak nonuniformity in particle charge density due to variations in particle size and the charge dissipation process. In contrast, the optimization of the simulation only accounts for the disruption of particle ordering by thermal fluctuations. Nevertheless, the optimization of these values could provide critical insights into the surface charge accumulation in the electrospray process.
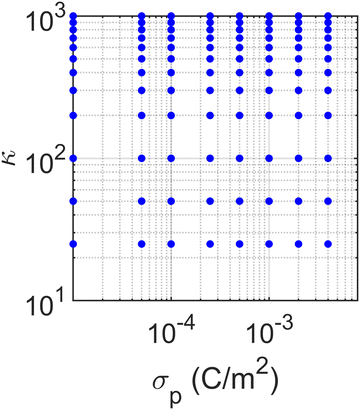
Notably, our BD simulation was implemented in serial code, with a typical run time of 10–14 days per simulation. Directly applying iterative optimization algorithms to the BD simulation that requires sequential execution of simulations is computationally prohibitive. To address this, we conducted 96 BD simulations in an embarrassingly parallel manner to sample κ and σp in a large parameter space spanning two orders of magnitude (Fig. 6). We trained a surrogate model for predicting the RDF with charge densities as the inputs using the simulation data set. Given the high dimensional and nonlinear relationship between the input and output, we implemented ANN as the surrogate for its proven capacity to approximate complex functions.34 This model establishes a high-fidelity predictive link between κ and σp (effectively σs and σp), and the output RDF vector within the training space, which can be used later for parameter optimization.
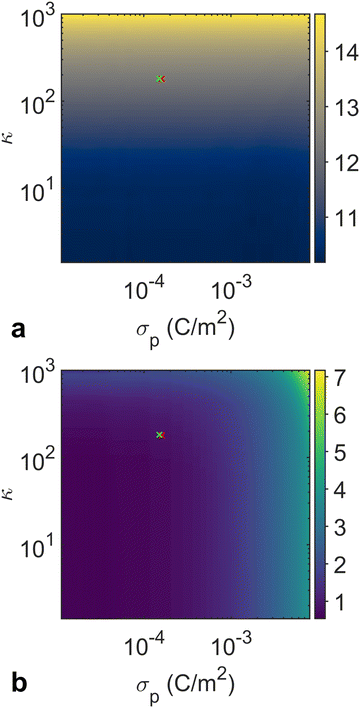
For the initial training phase, we utilized the Ray Tune library in Python to optimize the hyperparameters of the ANN model. Using the optimized hyperparameters presented in Table S2 (ESI†), we subsequently trained an ANN-based surrogate model. Our ANN surrogate model was designed as a fully connected feedforward network. The input layer accepts κ and σp as features, while the output layer constructs the RDF, which encodes the structural properties of the particle assembly. Hidden layers, equipped with a nonlinear activation function, capture the intricate dependencies between the input parameters and the output. The ANN was trained using a backpropagation algorithm with the loss function to quantify the difference between the predicted and simulated RDFs. More details of the ANN architecture and training procedure are provided in the Materials and methods section. The ANN training learning curve is presented in Fig. S4 (ESI†). The heat maps in Fig. 7 show the behaviors of two RDF characteristics generated by the surrogate model, corroborating our findings in Fig. 4 and 5. The first peak position of the RDF reflecting the average interparticle distance is solely governed by the charge density ratio. Meanwhile, the relative strength of Brownian motion determined by the absolute values of σp and σs affects the degree of local ordering, which is evident in the variations in the first peak-to-trough distance.
Using the trained surrogate model, we then employed BO to identify κ and σp values that best match the simulated RDF to the experimental RDF. BO is a derivative-free optimization method that can iteratively refine our parameter estimates by evaluating the objective function without relying on gradient information. The surrogate model significantly accelerates the search process by replacing the time-consuming physics-based simulations. In the optimization process, our objective is the RDF vector and we utilized two different loss functions to evaluate the similarity between the predicted RDF and the experimental RDF. The first is the earth mover's distance (EMD), and the second is the mean squared error (MSE), as described in the Methods section. These two loss functions are selected because they offer different comparison approaches: the MSE provides a bin-by-bin comparison, while the EMD offers a cross-bin comparison. This allows us to validate the robustness of the optimization. By integrating these loss functions into the BO framework, we efficiently explored the parameter space with the surrogate model, guiding the search toward the κ and σp pair that yields the closest match to experimental observations. Fig. S5 (ESI†) shows the convergence plot of the optimization.
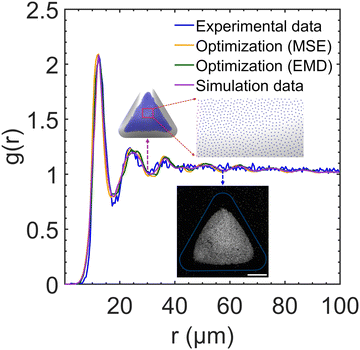
After determining the optimal values of κ and σp, we performed a testing BD simulation with the optimized parameters to evaluate whether the result of the physical simulation is indeed consistent with the experiments. Fig. 8 plots a comparison among the RDF profiles obtained in the experiment, ANN surrogate models with different loss functions, and the optimized BD simulation. The collapse of all four curves confirms the accuracy of the surrogate model in predicting the quantitative features of particle assembly in the physical simulation and the excellent agreement in the interparticle distances between the experiment and simulation. To define the similarity between simulation and experimental RDFs as a percentage, we calculated the normalized mean of the bin-by-bin MSE as a metric, which indicates a 96.4% similarity between the two RDFs. To further analyze the structural ordering, we calculated ψ6 in both experiment and optimized simulation. Fig. 9 shows the comparison of the local ordering and overall pattern of the assemblies between the experimental and simulated systems, highlighting regions of high and low hexagonal order. Despite discrepancies in the spatial distribution of ψ6 and overall assembly shape, the average bond order parameters agree well with a relative difference of less than 5%. These results underscore the capability of BD simulations to capture the experimental structural characteristics. We applied the optimal charge density values to simulate a dumbbell-shaped droplet, as shown in Fig. S8 (ESI†). The particle assembly structure is consistent to that observed in our previous experiments.22 The nearest-neighbor distance of 15.3 μm on the dumbbell-shaped droplet is slightly larger than that on the triangular droplet 12.3 μm, which could be attributed to increased surface area and reduced particle density given the same spray time.
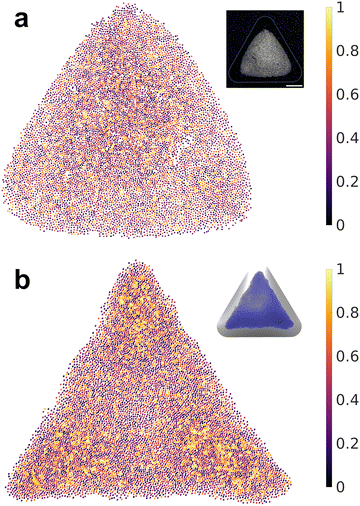 | ||
| Fig. 9 Spatial distributions of sixfold orientational order parameter for (a) experimental assembly and (b) simulation assembly using the optimized κ and σp with the EMD loss function. | ||
One possible reason for different overall assembly patterns between simulations and experiments could be the normal component of the electric field acting on the particles, whose effect is ignored in the present model. Danov and Kralchevsky theoretically showed that the normal electric field perturbs the capillary meniscus of dielectric particles, which can lead to an attractive force between particles under specific conditions.35,36 The interparticle attraction may translate to an effective line tension that smoothens the assembly boundary, resulting in a more circular assembly like those observed in experiments. To explore this idea, we conducted a series of BD simulations and found that, within the interparticle distance range of interest, this attraction is not strong enough to significantly alter the assembly structure. Another possible reason for the observed discrepancy may stem from the assumptions made in the simulations. We assumed a uniform charge distribution on the substrate in the electrostatic Ansys® simulations. However, this may not be the case in the actual experiments. During the electrospray process, the accumulated charge on the substrate may be distributed non-uniformly.24,37,38 A non-uniform charge distribution on the substrate would alter the electric field and revise the shape of the overall particle assembly. The detailed investigation of this discrepancy is beyond the scope of this work.
Conclusions
The results of this study demonstrate the successful integration of physics-based modeling with machine learning to explore the complex dynamics of electrosprayed colloidal particles at liquid interfaces. By combining Brownian dynamics simulations with Ansys® electric field analysis, we gain insight into how electrostatic interactions control particle assembly on a non-spherical droplet surface. The findings reveal that the competition between the electrophoretic forces and interparticle repulsions, which can be characterized by the ratio of particle-to-substrate charge density. This charge density ratio is the key factor in determining the compactness of the assembly structure, while Brownian motion plays a crucial role in dictating the degree of ordering in the assembly. When the strength of Brownian motion is comparable to that of electrostatic forces, the assembly becomes more disordered despite the presence of electrophoretic forces.An ANN surrogate model trained by the BD simulation data enables a comprehensive investigation of the effects of two key factors, charge density ratio and relative strength of thermal fluctuations, on the assembly structure. It accurately predicts the particle RDF, enabling an efficient search for optimal charge density values that yield the best match between the simulated and experimental assemblies. The results show excellent agreement among the data-driven surrogate model, optimized BD simulation, and experiments. Additionally, the optimized substrate surface charge density agrees with the experimental approximation. This consistency highlights the reliability of the physics-based model and the utility of machine learning techniques in enhancing the computational exploration of the system. The first-order approximation of particle and substrate charges accumulated in electrospray also lays the foundation for future work on manipulating the interfacial assembly of electrosprayed particles.
Materials and methods
Electrostatic model and electrospray experiments for charge estimation
A 3D printed mask made of PLA was fixed to an FTO coated glass slide to provide a conductive grounding surface as shown in Fig. 3a. The mask had three cutouts with different shapes, and the goal was to collect electrosprayed material in the open, grounded regions. Before collecting any data, we created a model of the experimental domain in Ansys® as shown in Fig. 3b and used the electrostatic solver to get an upper bound for the surface charge density, σs. Several assumptions were made to simplify the boundary conditions, e.g. the entire top surface was set to the same potential used in the electrospray experiments. We found that this did not significantly change the result for σs, compared to using a point source to represent the electrospray emitter. The side wall boundaries were specified to have the electric flux tangential, which was the most logical choice given the size of the domain and the expectation that the electric field would be nearly uniform away from the cutout regions. Finally, it is assumed that the electrospray generates a uniform surface voltage, and therefore a uniform surface charge density, on the mask surface. The actual surface charge density will likely be higher at the center of the mask directly under the emitter, compared to the edge of the mask;37 therefore, we can only estimate an average surface charge density. As shown in Fig. 3c, the solution was found at multiple values for the surface voltage, varying from 0 to 2.5 kV in increments of 0.5 kV. This resulted in a maximum value of σs = 6 × 10⁻⁵ C m−2, since the surface voltage cannot exceed the electrospray source voltage, i.e., it could at most be 2.5 kV to match the source.With this upper bound, the 3D printed mask was used to refine the estimate for σs. We deposited fluorescent polystyrene particles with a diameter of 2 μm via electrospray deposition. The particles were suspended in methanol and sprayed at a dilute concentration of 0.1 v/v%. The distance from the glass capillary emitter to the mask surface was 25 mm, and a potential of 2.5 kV was used during the 30 second spray to match the simulation parameters. As shown in Fig. 3d, we collected particles in the open, grounded region as expected. Only the triangle is shown for clarity, but the circle and square had similar deposits, with particles in the center and a “depletion region” near the edges. The expected deposition from the electrostatic model is plotted in Fig. 3e, which shows the termination points of streamlines originating from the “source” at the boundary, i.e. the top surface of the model. The color represents the displacement of the point in the x and y direction from the start to the end of the streamline. The experimental data most closely matches the Vsurf = 0.5 kV result. Considering the relationship shown in Fig. 3c, we conclude that the surface charge density is approximately 1.1 ± 0.6 × 10⁻⁵ C m−2, given an average surface voltage of 0.5 ± 0.25 kV.
We note that an uncertainty of ±0.6 × 10⁻⁵ C m−2 is reasonable for this estimation method by comparing the average width of the depletion region in the experiment and the simulation. The depletion region width was measured as the distance from the cutout border midpoint to the primary particle deposit, indicated by the light red lines in Fig. 3e for Vsurf = 1.0 kV. From the experimental deposition image, we obtained an average width of 0.5 mm, whereas the simulation had a width of ≈0 mm for Vsurf = 0.25 kV, and 0.95 mm for Vsurf = 0.75 kV. Therefore, our final estimated range for the surface charge allows for nearly 100% variation in the depletion region width. Even with the potential sources of error, such as a non-uniform surface charge density, we have at least approximated the order of magnitude of the surface charge density.
Two-dimensional Brownian dynamics on nonanalytical surfaces
The surface geometry of geometrically controlled sessile droplets cannot be easily parameterized analytically. To enable Brownian dynamics simulations of interacting colloidal particles on these complex surfaces, we represent a two-dimensional (2D) manifold using a triangulated mesh. The triangle mesh provides a discrete approximation of the continuous surface of arbitrary geometry, in which vertices, edges, and faces collectively define the surface. Considering the particles are constrained to the mesh, with their positions in global coordinates in the three-dimensional (3D) Euclidean space denoted by ri, the governing equation for overdamped particle motion is given by39 | (1) |
 accounts for pairwise interaction forces acting on particle i from neighbor particle j. For polymer particles delivered by electrospray, our previous experimental studies indicate that a significant residual surface charge exists at the particle/air interface, which dominates the electrostatic interaction between the particles.22 These like-charged particles of radius a with a contact angle of 90° at the air/water interface experience electrostatic repulsion attributed to the usual Coulombic force and the image force due to the existence of the interface40
 | (2) |
| FEi = qpEs(ri) | (3) |
| 〈FBi〉 = 0 | (4) |
| 〈FBi(t)FBi(t′)〉 = 2(kBT)2Di−1δ(t − t′)I | (5) |
![[n with combining circumflex]](https://www.rsc.org/images/entities/b_char_006e_0302.gif) i, the unit normal of the triangle face containing particle i, and the magnitude canceling the normal component of unconstrained forces FPi + FEi + FBi(t). The constrained equation of motion can be rewritten as39
i, the unit normal of the triangle face containing particle i, and the magnitude canceling the normal component of unconstrained forces FPi + FEi + FBi(t). The constrained equation of motion can be rewritten as39 | (6) |
![[n with combining circumflex]](https://www.rsc.org/images/entities/b_char_006e_0302.gif) i
i![[n with combining circumflex]](https://www.rsc.org/images/entities/b_char_006e_0302.gif) Ti being the orthogonal projector onto the local tangent plane of mesh and v0 = (Di/kBT)[FPi + FEi + FBi(t)] being the unconstrained particle velocity.
Ti being the orthogonal projector onto the local tangent plane of mesh and v0 = (Di/kBT)[FPi + FEi + FBi(t)] being the unconstrained particle velocity.
To account for the long-range nature of the Coulomb force, we calculated this pairwise interaction with a specific cutoff distance, beyond which the interactions were neglected. It is worth mentioning that the simulation domain has no periodicity in either of the three directions, so the pairwise interactions were computed directly. The cutoff distance was chosen to be sufficiently large (200 times of particle radius) to ensure that all the necessary particle–particle interactions were accurately captured. All simulations involved 9000 particles, matching the number used in the experiments.
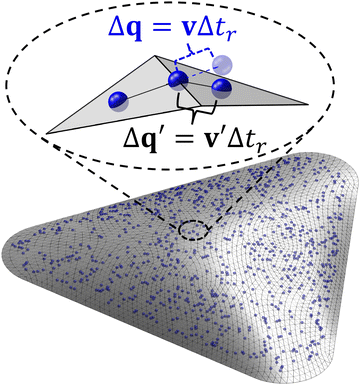
The constraint of moving on a triangle mesh is implemented using a four-step algorithm involving the use of two sets of coordinates: global (3D) coordinates for interparticle force calculation and local (2D) coordinates for particle motion.39 First, the unconstrained velocity of each particle is calculated in global coordinates. Then, this velocity is projected onto the triangle face containing the particle and represented in the corresponding local coordinates. The position of the particle in local coordinates is updated for each timestep using the tangential velocity. Finally, the updated particle position is transformed back to global coordinates for force calculations in the next timestep. A crucial step in updating the particle position involves treating particles traverse across different triangle faces. Velocity folding is employed to enable consecutive transits of the particle to adjacent faces within one timestep. Briefly, this method transforms the original local velocity v into a new local velocity v′ using a rotation matrix based on the angle between the two adjacent triangle faces. The new velocity retains its magnitude but changes the direction to be tangential to the new triangle face, allowing the particle to move on the mesh for the remainder of the timestep (see Fig. 1). This technique ensures that the particles always remain bound to the surface. A flowchart of this algorithm is presented in Fig. S6 (ESI†).
Electric field calculation using Ansys®
To define the computational domain for numerical modeling of the electrostatic field, we generate the target droplet geometry as a triangulated mesh via Surface Evolver.41 The droplet size, shape, and volume are selected to match our previous experiments as closely as possible. The triangular droplet has a fixed perimeter of 7 mm, and a corner radius of 0.3 mm to avoid singularities in the Laplace pressure. The resulting mesh was imported into Autodesk Fusion, which was used to add the photoresist geometry and a sub-domain near the droplet surface for better control over the mesh parameters near the water–air interface. A schematic of the model is shown in Fig. 2.With a well-defined steady-state electrostatic problem, we used the Ansys® Electronics Desktop package for the computation. The governing equation is thus
| ∇·(ε∇φ) = ρ | (7) |
| Eti = (I − ninTi)Ei | (8) |
Artificial neural network surrogate model and hyperparameter tuning
An artificial neural network (ANN) is used to model the nonlinear relationship present in our dataset between charge densities as input and radial distribution function (RDF) as output. It is designed to capture complex patterns by using interconnected layers of neurons. The ANN architecture is comprised of the input layers, hidden layers, and the output layer. We approximate the RDF distribution using a discrete Fourier transform to reduce the dimensionality of our ANN training and improve accuracy. Using only the first 25 Fourier coefficients, the reconstructed distribution matches the original RDF one well, which consists of 100 points. These Fourier transform coefficients are selected as the output layer of the network, while the input layer contains charge density information. Before training our ANN model with a specific architecture, we perform hyperparameter tuning using the Ray Tune library in Python, an efficient and scalable tool for optimizing machine learning model parameters.42The number of hidden layers, the number of neurons per hidden layer, the maximum number of iterations, the activation function, the solver algorithm, the initial learning rate, and the learning rate are tuned using Ray Tune. The search space for hyperparameters was systematically defined. The number of layers was sampled from a range to explore architectures with varying depths. The number of neurons per hidden layer was sampled from a wide range to evaluate models with different capacities. The maximum number of iterations was sampled to balance training time and performance. The activation function was chosen from a diverse set of common functions, including sigmoid, tanh, and rectified linear unit (ReLU), to assess their influences on model learning. The solver algorithm was selected from widely used optimizers, such as Limited-memory Broyden–Fletcher–Goldfarb–Shanno (LBFGS), Adam, etc. to compare their efficiency. The initial learning rate was sampled from a range of small values to determine an optimal starting point for model training. The learning rate was chosen from different strategies, including constant, invscaling, and adaptive, to optimize the learning dynamics. The training process involves multiple iterations with different hyperparameter configurations to evaluate their performance. Ray Tune's implementation facilitates the automated and systematic exploration and exploitation of different configurations, ensuring a thorough evaluation of potential hyperparameters and enhancing the robustness and accuracy of the ANN in our study. The best hyperparameter configuration obtained from Ray Tune presented in Table S2 (ESI†) is subsequently used to train the ANN model for optimal performance.
In the ANN model training process, each neuron in the hidden layers applied the sigmoid activation function, which is defined as:
 | (9) |
Bayesian optimization with surrogate model
The Bayesian optimization (BO) process for charge density estimation involves several key steps. First, the trained ANN model is used to predict the RDFs for different combinations of charge densities during the optimization iterations. This surrogate model enables quick evaluations of the objective function, significantly reducing computational cost. The objective function is defined as either the MSE or the earth mover's distance (EMD) between the ANN-predicted and experimental RDF. MSE is a bin-by-bin comparison method, where the difference is given by | (10) |
 | (11) |
Data availability
Data for this article are available at the following GitHub repository: https://github.com/SaIL-Yong/BD_Electrosprayed_particles.Conflicts of interest
There are no conflicts to declare.Acknowledgements
X. Y. and P. R. C. gratefully acknowledge funding from the National Science Foundation for supporting this work through Award 1939362. We would also like to acknowledge Dr Dehao Liu at Binghamton University for insightful discussions on neural network training and hyperparameter tuning.References
- I. B. Liu, N. Sharifi-Mood and K. J. Stebe, Capillary assembly of colloids: interactions on planar and curved interfaces, Annu. Rev. Condens. Matter Phys., 2018, 9, 283–305 CrossRef CAS.
- J. L. Eatson, J. R. Gordon, P. Cegielski, A. L. Giesecke, S. Suckow, A. Rao, O. F. Silvestre, L. M. Liz-Marzán, T. S. Horozov and D. M. A. Buzza, Capillary Assembly of Anisotropic Particles at Cylindrical Fluid–Fluid Interfaces, Langmuir, 2023, 39, 6006–6017 CrossRef CAS PubMed.
- D. Ershov, J. Sprakel, J. Appel, M. A. Cohen Stuart and J. van der Gucht, Capillarity-induced ordering of spherical colloids on an interface with anisotropic curvature, Proc. Natl. Acad. Sci. U. S. A., 2013, 110, 9220–9224 CrossRef CAS.
- J. C. Loudet, A. M. Alsayed, J. Zhang and A. G. Yodh, Capillary interactions between anisotropic colloidal particles, Phys. Rev. Lett., 2005, 94, 018301 CrossRef CAS PubMed.
- R. McGorty, J. Fung, D. Kaz and V. N. Manoharan, Colloidal self-assembly at an interface, Mater. Today, 2010, 13, 34–42 CrossRef CAS.
- S. Trevenen, M. A. Rahman, H. S. C. Hamilton, A. E. Ribbe, L. C. Bradley and P. J. Beltramo, Nanoscale Porosity in Microellipsoids Cloaks Interparticle Capillary Attraction at Fluid Interfaces, ACS Nano, 2023, 17, 11892–11904 CrossRef CAS PubMed.
- A. Würger, Curvature-induced capillary interaction of spherical particles at a liquid interface, Phys. Rev. E: Stat., Nonlinear, Soft Matter Phys., 2006, 74, 041402 CrossRef.
- M. Cavallaro Jr, L. Botto, E. P. Lewandowski, M. Wang and K. J. Stebe, Curvature-driven capillary migration and assembly of rod-like particles, Proc. Natl. Acad. Sci. U. S. A., 2011, 108, 20923–20928 CrossRef.
- M. Lee, M. Xia and B. J. Park, Transition behaviors of configurations of colloidal particles at a curved oil-water interface, Materials, 2016, 9, 138 CrossRef PubMed.
- W. T. Irvine, V. Vitelli and P. M. Chaikin, Pleats in crystals on curved surfaces, Nature, 2010, 468, 947–951 CrossRef CAS.
- N. Vogel, S. Utech, G. T. England, T. Shirman, K. R. Phillips, N. Koay, I. B. Burgess, M. Kolle, D. A. Weitz and J. Aizenberg, Color from hierarchy: diverse optical properties of micron-sized spherical colloidal assemblies, Proc. Natl. Acad. Sci. U. S. A., 2015, 112, 10845–10850 CrossRef CAS.
- N. Singh, A. K. Sood and R. Ganapathy, Cooperatively rearranging regions change shape near the mode-coupling crossover for colloidal liquids on a sphere, Nat. Commun., 2020, 11, 4967 CrossRef CAS PubMed.
- C. O. Solano-Cabrera, P. Castro-Villarreal, R. E. Moctezuma, F. Donado, J. C. Conrad and R. Castañeda-Priego, Self-Assembly and Transport Phenomena of Colloids: Confinement and Geometrical Effects, Annu. Rev. Condens. Matter Phys., 2024 DOI:10.1146/annurev-conmatphys-041124-120513.
- S. K. Ghosh and A. Böker, Self-Assembly of Nanoparticles in 2D and 3D: Recent Advances and Future Trends, Macromol. Chem. Phys., 2019, 220, 1900196 CrossRef.
- Z. Cai, Z. Li, S. Ravaine, M. He, Y. Song, Y. Yin, H. Zheng, J. Teng and A. O. Zhang, From colloidal particles to photonic crystals: advances in self-assembly and their emerging applications, Chem. Soc. Rev., 2021, 50, 5898–5951 RSC.
- L. Duan, C. Wang, W. Zhang, B. Ma, Y. Deng, W. Li and D. Zhao, Interfacial Assembly and Applications of Functional Mesoporous Materials, Chem. Rev., 2021, 121, 14349–14429 CrossRef CAS PubMed.
- T. P. Bigioni, X. M. Lin, T. T. Nguyen, E. I. Corwin, T. A. Witten and H. M. Jaeger, Kinetically driven self assembly of highly ordered nanoparticle monolayers, Nat. Mater., 2006, 5, 265–270 CrossRef CAS PubMed.
- Y. Li, Q. Yang, M. Li and Y. Song, Rate-dependent interface capture beyond the coffee-ring effect, Sci. Rep., 2016, 6, 24628 CrossRef CAS.
- V. Lotito and T. Zambelli, Approaches to self-assembly of colloidal monolayers: a guide for nanotechnologists, Adv. Colloid Interface Sci., 2017, 246, 217–274 CrossRef CAS PubMed.
- K. N. Al-Milaji, R. R. Secondo, T. N. Ng, N. Kinsey and H. Zhao, Interfacial Self-Assembly of Colloidal Nanoparticles in Dual-Droplet Inkjet Printing, Adv. Mater. Interfaces, 2018, 5, 1701561 CrossRef.
- A. Ghafouri, M. Zhao, T. J. Singler, X. Yong and P. R. Chiarot, Interfacial Targeting of Sessile Droplets Using Electrospray, Langmuir, 2018, 34, 7445–7454 CrossRef CAS PubMed.
- J. M. Prisaznuk, P. Huang, X. Yong and P. R. Chiarot, Probing colloidal assembly on non-axisymmetric droplet surfaces via electrospray, Langmuir, 2022, 39, 469–477 CrossRef PubMed.
- J. Tang and A. Gomez, Controlled mesoporous film formation from the deposition of electrosprayed nanoparticles, Aerosol Sci. Technol., 2017, 51, 755–765 CrossRef CAS.
- L. Lei, D. A. Kovacevich, M. P. Nitzsche, J. Ryu, K. Al-Marzoki, G. Rodriguez, L. C. Klein, A. Jitianu and J. P. Singer, Obtaining Thickness-Limited Electrospray Deposition for 3D Coating, ACS Appl. Mater. Interfaces, 2018, 10, 11175–11188 CrossRef CAS PubMed.
- L. Lei, A. R. Gamboa, C. Kuznetsova, S. Littlecreek, J. Wang, Q. Zou, J. D. Zahn and J. P. Singer, Self-limiting electrospray deposition on polymer templates, Sci. Rep., 2020, 10, 17290 CrossRef CAS PubMed.
- B. J. Kingsley, E. E. Pawliczak, T. R. Hurley and P. R. Chiarot, Electrospray Printing of Polyimide Films Using Passive Material Focusing, ACS Appl. Polym. Mater., 2021, 3, 6274–6284 CrossRef CAS.
- J. O'Leary, R. Mao, E. J. Pretti, J. A. Paulson, J. Mittal and A. Mesbah, Deep learning for characterizing the self-assembly of three-dimensional colloidal systems, Soft Matter, 2021, 17, 989–999 RSC.
- A. Abbasi Moud, Recent advances in utility of artificial intelligence towards multiscale colloidal based materials design, Colloid Interface Sci. Commun., 2022, 47, 100595 CrossRef CAS.
- E. Boattini, M. Ram, F. Smallenburg and L. Filion, Neural-network-based order parameters for classification of binary hard-sphere crystal structures, Mol. Phys., 2018, 116, 3066–3075 CrossRef CAS.
- R. S. DeFever, C. Targonski, S. W. Hall, M. C. Smith and S. Sarupria, A generalized deep learning approach for local structure identification in molecular simulations, Chem. Sci., 2019, 10, 7503–7515 RSC.
- M. Dijkstra and E. Luijten, From predictive modelling to machine learning and reverse engineering of colloidal self-assembly, Nat. Mater., 2021, 20, 762–773 CrossRef CAS PubMed.
- S. Chen and X. Yong, Janus Nanoparticles Enable Entropy-Driven Mixing of Bicomponent Hydrogels, Langmuir, 2019, 35, 14840–14848 CrossRef CAS PubMed.
- L. Rayleigh and X. X. On, the equilibrium of liquid conducting masses charged with electricity, London, Edinburgh Dublin Philos. Mag. J. Sci., 1882, 14, 184–186 CrossRef.
- I. A. Basheer and M. Hajmeer, Artificial neural networks: fundamentals, computing, design, and application, J. Microbiol. Methods, 2000, 43, 3–31 CrossRef CAS PubMed.
- K. D. Danov and P. A. Kralchevsky, Interaction between like-charged particles at a liquid interface: electrostatic repulsion vs. electrocapillary attraction, J. Colloid Interface Sci., 2010, 345, 505–514 CrossRef CAS PubMed.
- K. D. Danov and P. A. Kralchevsky, Forces acting on dielectric colloidal spheres at a water/nonpolar fluid interface in an external electric field. 2. Charged particles, J. Colloid Interface Sci., 2013, 405, 269–277 CrossRef CAS.
- E. Bodnar and J. Rosell-Llompart, Growth dynamics of granular films produced by electrospray, J. Colloid Interface Sci., 2013, 407, 536–545 CrossRef CAS PubMed.
- Y. Zhu and P. R. Chiarot, Surface charge accumulation and decay in electrospray printing, J. Phys. D: Appl. Phys., 2021, 54, 075301 CrossRef CAS.
- Y. Yang and B. Li, A simulation algorithm for Brownian dynamics on complex curved surfaces, J. Chem. Phys., 2019, 151, 164901 CrossRef.
- R. Aveyard, J. H. Clint, D. Nees and V. N. Paunov, Compression and structure of monolayers of charged latex particles at air/water and octane/water interfaces, Langmuir, 2000, 16, 1969–1979 CrossRef CAS.
- K. A. Brakke, The surface evolver, Exper. Math., 1992, 1, 141–165 CrossRef.
- M. Pumperla, E. Oakes and R. Liaw, Learning Ray, O'Reilly Media, Inc., 2023 Search PubMed.
- T. Sakai, presented in part at the The 41st International ACM SIGIR Conference on Research & Development in Information Retrieval, Ann Arbor, MI, USA, 2018 Search PubMed.
Footnote |
| † Electronic supplementary information (ESI) available. See DOI: https://doi.org/10.1039/d4sm01160k |
| This journal is © The Royal Society of Chemistry 2025 |

