 Open Access Article
Multiscale characterization, modeling and simulation of packed bed reactor for direct conversion of syngas to dimethyl ether†
Ginu R.
George
 a,
Adam
Yonge
 b,
Meagan F.
Crowley
 b,
Anh T.
To
 c,
Peter N.
Ciesielski
 *b and
Canan
Karakaya
 *a
*a
aManufacturing Science Division, Oak Ridge National Laboratory, Oak Ridge, TN 37830, USA. E-mail: karakayac@ornl.gov
bRenewable Resources and Enabling Sciences Center, National Renewable Energy Laboratory, Golden, CO 80401, USA
cCatalytic Carbon Transformation and Scale-up Center, National Renewable Energy Laboratory, Golden, CO 80401, USA
First published on 2nd January 2025
Abstract
This work presents a multiscale Computational Fluid Dynamics (CFD) analysis of direct DME synthesis in a packed bed reactor with physically mixed Cu/ZnO/Al2O3 and γ-Al2O3 catalysts. The model accounts for hierarchical transport behavior by coupling a one-dimensional intraparticle subgrid model to a two-dimensional (axial and radial) model for heat and mass transport along the catalyst bed, with fully integrated chemical reaction kinetics. To enhance the predictive accuracy, the model incorporates directly measured critical bed properties. X-ray computed tomography was performed at the scale of the packed bed reactor and the scale of individual catalyst particles to obtain bed properties such as bed porosity, particle diameter and permeability, as well as catalyst characteristics including intraparticle porosity and pore size. Experiments were conducted in a lab-scale reactor to validate the model, and the model predictions show good agreement with experimental data for the investigated process conditions. The validated model is further exercised to study the influence of process variables such as feed temperature, feed rate, and wall temperature. The results indicate that the pattern of hot spot formation and magnitude of hot spot temperature are sensitive to processing conditions, mainly the feed rate and reactor wall temperature. It has also been found that internal mass transport limitations exist even in smaller particles (∼215 μm), particularly in the hot spot region.
Sustainability spotlightThis study addresses the growing need for sustainable energy solutions by investigating direct dimethyl ether (DME) synthesis, a potential low-carbon energy carrier. Using a multiscale computational approach, it explores the role of catalyst design and processing conditions in optimizing the efficiency of DME production. The integration of advanced X-ray computed tomography provides detailed insights into reactor and catalyst properties, enabling enhanced accuracy in model predictions. By reducing carbon emissions and improving the energy efficiency of chemical processes, this work contributes to the development of scalable, sustainable alternatives to traditional fossil fuel-based energy systems. |
1 Introduction
Dimethyl ether (DME) is a commodity chemical used as an intermediate in the production of dimethyl sulfate, methyl acetate, methyl formate, and dimethoxymethane.1 In recent years, there has been increasing interest in developing eco-friendly synthetic fuels to accelerate decarbonization, particularly in the transport sector.2 Among them, dimethyl ether (DME) has gained special attention, as it has a high cetane number (∼55–60), is noncorrosive and biodegradable, and emits minimal to zero soot, making it a promising alternative to diesel fuel.3 DME can also be an intermediate to create long-chain diesel or gasoline range hydrocarbons.4–10The synthesis of DME from syngas involves several exothermic reaction steps, aided by multiple catalysts. Syngas (a mixture of carbon monoxide, hydrogen) and variable amounts of carbon dioxide is first converted to methanol (MeOH), which is then dehydrated to produce DME (see Sec. 2.4).11 Syngas to MeOH typically involves Cu-based catalysts like Cu/ZnO/Al2O3 (CZA), with the ZnO and Al2O3 helping to control the size and dispersion of the Cu particles, as well as providing beneficial metal–support interactions.12 MeOH is dehydrated to DME over solid acid catalysts, such as γ-Al2O3, H-ZSM-5, or H-ZSM-22.13 Various catalysts for the application of DME synthesis have been discussed in literature.14 At industrially relevant scales, DME may be produced using either indirect or direct processing methods. The indirect process is commercially well-established, while the direct process is considered as a novel method.14 In the indirect process, DME production involves two sequential steps – production of MeOH and subsequent dehydration to DME. This method provides the advantage of selecting the optimal reactor type and processing conditions for each step, as well as enabling the intermediate purification of unreacted gas and water.15,16 Achieving high purity DME is crucial for fuel applications.17 On the other hand, the direct process, where the entire procedure is conducted in a single reactor, offers process intensification and potentially higher syngas conversion.14 This advantage arises from the increase in equilibrium conversion by the continuous removal of MeOH from the reaction medium, thereby shifting the equilibrium towards the DME production.15,18 Moreover, in terms of design and implementation, moving from two reactors to one can also lower the capital cost of the process and enable more facile commissioning.16 The latest developments on the direct synthesis of DME were recently reviewed by Peinado et al. (2023).14 They discussed improvements in reactor designs, the effect of heat and mass transport phenomena, and the techno-economic evaluation on the feasibility of different renewable DME production process. The authors also noted that a major challenge in the reactor design for direct DME synthesis is related to efficient heat transfer.
As is common for exothermic reactions, DME synthesis also requires precise bed temperature control due to the high reaction exotherm, which can be challenging to achieve in practice. Furthermore, integrating MeOH generation and dehydration into a single reactor, i.e., direct DME synthesis, can substantially increase the overall reaction enthalpy.14 Therefore, it is crucial to regulate the bed temperature within the required envelope. Relatively low reaction temperatures are thermodynamically favourable for achieving high CO conversions, but the process becomes kinetically limited for temperatures ∼ <250 °C. The current state-of-the-art catalysts operate around 240–260 °C to achieve optimum DME yield. However, as the reaction proceeds, the exothermic heat generation causes a sudden rise in bed temperature near the reactor inlet. This temperature may even exceed 300 °C, leading to hot spot formation.19 If not properly regulated, the temperature could rise uncontrollably and potentially lead to thermal runaway.20 Another undesirable effect of hot spot formation is the loss of catalytic activity. Copper containing catalysts are prone to coke formation as well as irreversible loss of catalytic activity due to sintering, oxidation, and migration of copper into acidic surfaces.21 Besides the thermal management, intraparticle transport limitations pose another challenge in reactor design.14 Previous studies have highlighted the significant influence of intraparticle diffusion limitation on the reactor performance, as it affects the overall product yield, which in turn influences the amount of heat released and the hot spot temperature.19,22 The evolution of hot spots in packed bed reactors during exothermic reactions and the associated transport limitations are complex and sensitive to process variables such as inlet temperature, concentration, and wall temperature.20 Experimental studies in the literature have reported the dynamic nature of the hot zone evolution and indicated that these hot spots can be larger than the size of typical catalytic pellets used in commercial reactors.23 It should be noted that conducting experiments of this kind are challenging, time-consuming and expensive. Therefore, reliable modeling tools that provide detailed insights into reactor behavior are necessary for analyzing and optimizing the reactor performance.
In practice, accurate modeling of the transport processes and reactions occurring in a packed bed reactor is challenging due to the varying scales involved, from macroscale along the interstitial spaces to microscale in the internal pores of the catalyst particles. To address complexities, multiscale methods are typically used. Previously, our team developed a multiscale modeling framework for hierarchical transport in a packed bed with SBA16 porous silica catalyst particles, wherein transport models at several length scales were integrated to investigate the impact of intraparticle transport phenomena on product yields and catalyst activity lifetime.24 Additionally, a multiscale modeling framework has been presented to scale-up packed bed reactors from lab-scale to pilot-scale operations for gas-phase dehydration of tetrahydrofurfuryl alcohol to dihydropyran over commercial Al2O3 catalysts.25 Similar multiscale simulations of packed bed reactors can be found in literature. Park (2018)26 has presented a multiscale modeling of packed bed reactors, in which the macroscale concentration and temperature fields are calculated from a hypothetical continuum model composed of particles and fluid. The macroscale differential elements are assumed to contain several catalyst pellets, each of which is a microscale continuum. The boundary conditions, heat and mass transfer, as well as chemical reactions are coupled across the two scales. The author investigated the synthesis of propene oxide by oxidizing propene with hydrogen oxide using titanium silicalite-1 catalysts. Sujeesh et al. (2022)27 have adopted multiscale analysis using COMSOL Multiphysics to investigate the decomposition of sulphuric acid in a packed bed reactor with Cr–Fe2O3 catalysts. They investigated the pore diffusion and film resistances at various locations in the reactor and reported that intraparticle diffusion limitation is predominant compared with film resistance. Pelaez et al. (2018)28 have presented a multiscale study on the direct synthesis of DME in a packed bed reactor composed of mechanical mixtures of Cu/ZnO/Al2O3 and γ-Al2O3 catalysts. They also used COMSOL Multiphysics, and investigated intraparticle heat and mass transfer limitations, as well as conducted parametric studies on feed rate, feed temperature, pressure, wall temperature, catalyst ratio, and tube diameter. Based on the insights gained, an optimized reactor design that provides 80% CO conversion was proposed.
It is important to note that the accuracy of continuum-based modeling methods strongly relies on the reliability of the correlations used, which in turn are dependent on the defined bed properties (e.g. bed porosity, particle diameter, pellet porosity, pore diameter, etc.). For instance, the Ergun equation,29 which is commonly used to define the pressure loss in a packed bed, is related to bed porosity and particle diameter with a power of 3 and 2, respectively. The microscopic properties such as pellet porosity and pore diameter are important to define the intraparticle diffusion and effective pellet thermal conductivity, see eqn (6) and (19). Hence, robust methods for characterizing the bed structural properties are important to ensure the accuracy of the models. X-ray computed tomography (XCT) and Transmission Electron Microscopy (TEM) have already been used to address a broad range of scientific problems, from battery interfaces and corrosion to biomass undergoing pyrolysis.30–32 XCT and TEM are also beneficial to characterize the structural properties of a packed bed mainly due to its non-invasive nature (these methods do not alter the sample being characterized). Micro-CT can be used to scan experimental packed bed reactors, while nano-CT can scan the individual catalyst particles that make up the packed bed.33,34 Although several model-based reactor optimization studies can be found in the literature (reactor configurations,35–37 inlet feed composition,38–43 catalyst mixing ratio,44 effect of reactor temperature, and pressure45,46), studies that have included proper material characterisation, thorough analysis of the evolution of hot spots and the associated transport limitations in direct synthesis of DME are scarce.
This study employs a multiscale Computational Fluid Dynamics (CFD) based modeling approach to analyse the direct synthesis of DME from syngas in a packed bed reactor, with physically mixed CZA and Al2O3 catalysts. The model is capable to account for the transport processes and chemical reactions occurring at the reactor and pellet scales, i.e., from macroscale to microscale. The macroscale representing the catalyst bed (interstitial region) is resolved for two-dimensions (axially and radially), while the interior of catalyst particles is examined in one-dimension (radially). The internal transport phenomena, including species diffusion, reactions, and heat conduction within the particles are investigated using an advanced feature called Reactive Pellet Bed, integrated into COMSOL Multiphysics.47,48 Although heat and mass transfer limitations during DME synthesis are generally well-studied,28,49,50 the properties of catalyst bed are often approximated. These properties play a crucial role in heat and mass transfer analyses, as well as chemical kinetics. In this study, we utilize direct measurements of catalyst and bed properties, along with 3D imaging, to examine process dynamics and gain a deeper understanding of heat and mass transfer in the catalytic process. The critical bed properties at both the packed bed and individual catalyst scales (particle size, bed and particle porosities, and pore diameters) are measured using XCT and TEM. To compute the effective bed permeability, hydrodynamic simulations are conducted using a system geometry directly measured from the experimental packed bed by XCT using an in-house developed open-source code Mesoflow.51 To validate simulations, experiments were conducted in a lab-scale reactor for direct DME synthesis under isothermal conditions, and for a limited range of pressure and flow rates. The validated reactor model is used to explore the influence of process variables, such as feed temperature, pressure, wall temperature, and feed rates, with a particular focus on non-isothermal operating conditions and the occurrence of hot spots. Furthermore, temperature and concentration drop within the particles are analysed to evaluate the intraparticle transfer limitations. The applicability of the proposed model for reactor scale-up is also demonstrated.
2 Methods
2.1 3-D characterization of the reactor packing structure
2.2 Experimental reactor setup
The experimental data used in this work are part of dataset from multiple experimental campaigns focusing on synthesis of higher hydrocarbons from syngas/CO2. Detailed information on the corresponding reactor setup has been presented elsewhere.9,55 Cu/ZnO/Al2O3 (CZA, MegaMax 800, Clariant), a commercial MeOH synthesis catalyst, and γ-Al2O3 (NorPro SA6173, Saint-Gobain) for MeOH dehydration were used. These catalysts were compressed, crushed, and sieved to 212–300 μm (50–70 mesh) size for reaction testing. 3.06 g CZA and 0.51 g Al2O3 were physically mixed, then diluted with 1.49 g low surface area silicon carbide (SiC) to minimize channeling, temperature gradients and to improve axial dispersion in the catalytic bed. The catalyst mixture was loaded into a 7.9 mm ID stainless-steel tubular reactor placed within a 3-zone furnace operating in downflow configuration with a four-point thermocouple to monitor reaction temperature (typical variation in temperature of ±0.25 °C). The catalyst bed was positioned within the isothermal zone in the reactor using quartz chips and quartz wool. Mass flow controllers (Brooks Instrument) were used to control gas flow rates to the reactor and were calibrated for the specific gas streams prior to use.Prior to the reaction, the catalyst bed was pre-treated with H2. Details of the pre-treatment procedure can be found elsewhere.9 Then, the syngas mixture containing H2, CO, CO2 and Ar was fed to the reactor with desired feed composition, H2/CO ratio, and pressure (2.54 ≤ p ≤ 7.37 bar). Reactor inlet and outlet gases were sampled through heated (170 – 200 °C) lines using Agilent 7890 gas chromatograph (GC) system. The GC was equipped with flame ionization detector (FID) to analyse hydrocarbons and oxygenates (MeOH, DME), and thermal conductivity detector (TCDs) to quantify the inert and permanent gases. GC responses for reactants and products were calibrated using traceable gravimetric gas standards.
2.3 Modeling packed bed reactor
The transport mechanisms and reactions occurring in a packed bed reactor are of different orders of magnitude – macroscale in interstitial spaces between the catalyst particles and micro-scale within internal pores of the pellets. This multi-scale problem was solved using COMSOL Multiphysics56 with Reactive Pellet Bed feature. A detailed description on the modeling approach can be found elsewhere.25,48,57 Herein, the governing equations under steady state are briefly presented.| ∇·(ρu) = 0 | (1) |
| ρ(u·∇)u = ∇·[−pI + K] + F | (2) |
 | (3) |
Coupled with mass continuity equation, the species transport equation is given by:
| ∇·ji + u·∇ci = Ri | (4) |
| ji = −De,i∇ci | (5) |
The effective diffusion coefficient De,i is calculated by accounting the bed porosity and the diffusion coefficients for the species diluted in the fluid DF,j through Millington and Quirk model58 as per eqn (6), where Maxwell Stefan diffusivity model59 was used to determine DF,j.
| De,i = DF,jε4/3b | (6) |
The energy transport was modeled using local thermal non-equilibrium approach, which considers the difference in temperature between fluid and solid phases. Accordingly, two temperature fields, Ts for solid phase and Tf for fluid phase, were explicitly solved as per eqn (7) and (8).
| ∇·qs = Sbhpe,f(Tf − Ts) + (1 − εb)Qs; qs = −(1 − εb)ks∇Ts | (7) |
| ρCp,fu·∇Tf + ∇·qf = Sbhpe,f(Ts − Tf) + εbQf; qf = −εbkf∇Tf | (8) |
 | (9) |
The Nusselt number (Nu) for the spherical particle in a fully developed laminar regime is given by:
| Nu = 2.0 + 1.1Pr1/3Re0.6p, | (10) |
The equations inside the spherical pellet are solved as spherical transport equations on nondimensional radial coordinate defined as r = rdim/rpe. Here rdim is the radial dimension inside the particle with radius rpe. Hence, r = 0 denotes particle center, while r = 1 represents particle surface. Accordingly, the species transport within each pellet is given by:
 | (11) |
 | (12) |
Here: cpe,i is the concentration of species i inside the pellet; Rpe,i is the production or consumption of species; Dpe,i is the effective pellet diffusion coefficient. Ni,inward represents the molar flux from the free fluid into a pellet. According to film resistance formulation, it can be defined as:
| Ni,inward = kc,i(ci − cpe,i) | (13) |
With this film resistance formulation, the species transport in the interstitial space eqn (4) is modified as:
| ∇·ji + u·∇ci = Ri − Ni,inwardSb | (14) |
The mass transfer coefficient kc,i in eqn (13) is defined based on Sherwood number (Sh) as:
 | (15) |
 | (16) |
The main diffusion mechanism inside the pellet is Knudsen diffusion. Hence, the effective diffusion coefficient in the pellet domain Dpe,i, is calculated using the Knudsen diffusion Di,k and the effect of pellet porosity following the Millington-Quirk model58 as:
 | (17) |
Heat transport within the pellet was modeled based on thermal equilibrium approach, i.e., temperature of fluid within the micro-pores and solid temperature are assumed to be same. Accordingly, a single energy equation was solved using effective pellet conductivity kpe,eff as:
 | (18) |
| kpe,eff = εpekf + (1 − εpe)kpe | (19) |
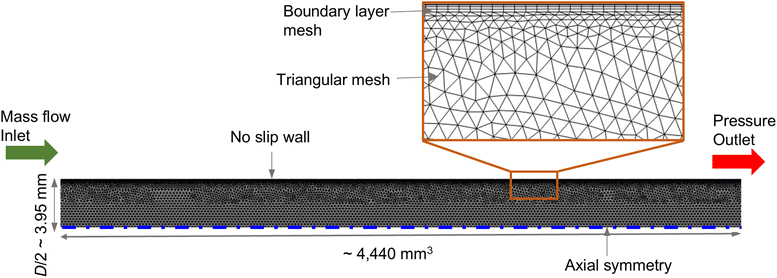
![[thin space (1/6-em)]](https://www.rsc.org/images/entities/char_2009.gif) 760, identified as mesh independent, and the average mesh quality in terms of skewness was 0.85. At the inlet, constant mass flow and flat-profile temperature boundary conditions were used. No-slip boundary condition was assigned at the reactor wall. Axial-symmetry boundary condition was assigned at the symmetry edge. The outlet pressure boundary condition was set at the outlet.
760, identified as mesh independent, and the average mesh quality in terms of skewness was 0.85. At the inlet, constant mass flow and flat-profile temperature boundary conditions were used. No-slip boundary condition was assigned at the reactor wall. Axial-symmetry boundary condition was assigned at the symmetry edge. The outlet pressure boundary condition was set at the outlet.
The simulation inputs of bed and catalyst properties, such as mean bed voidage (εb), equivalent pellet diameter (dpe), pellet porosity (εpe), pore diameter (dpore), were obtained from CT analysis (see Secs. 2.1 and 3.1). The properties of gaseous species were computed based on the thermodynamic database provided by COMSOL Multiphysics 6.2, in which Soave–Redlich–Kwong model60 was used to determine equation of states. The thermal conductivity was estimated by kinetic theory, diffusivity by Wilke–Lee correlation, and viscosity by Brokaw mixture rule.47
The conservation equations presented in Sec. 2.3 were solved by the Finite Element method (FEM) using COMSOL Multiphysics 6.2. Steady-state simulations were carried out using PARDISO solver for linear systems, with the fully-coupled approach, see57 for solver details. The convergence was monitored by relative tolerance as well as solution parameters such as pressure, temperature, and species mole fractions at varied locations in the simulation domain.
2.4 Reaction kinetics of DME synthesis
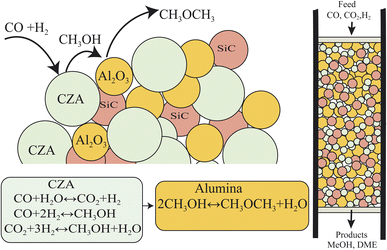
The direct conversion of syngas to DME follows a two-step process in a mixed bed reactor configuration. Fig. 2 shows a schematic representation of the process. The reaction starts with the methanol formation over CZA catalyst and follows dehydration step over Al2O3 catalyst, eqn (20)–(23).The kinetic model for the DME formation, eqn (24)–(27), was taken from the literature.61–63 These kinetic expressions are of Langmuir–Hinshelwood–Hougan–Wattson type, which are formulated based on fugacity of reactants and products (fi), and equilibrium constants (K1, K2, K3, K4). The initial rate expressions and rate constants for direct methanol formation of CO and CO2 was taken from Portha et al.;61 originally presented by Graaf et al.,64 and water–gas shift reaction was adopted from Choi and Stenger.62 DME kinetics was taken from Mollavali et al.63 The rate constants were then fine-tuned adjusted to fit the experimental data.
 | (20) |
 | (21) |
 | (22) |
 | (23) |
 | (24) |
 | (25) |
 | (26) |
 | (27) |
The reaction rate constant kj (j = 1–4) was written in the form of temperature dependent Arrhenius expression and has the unit of mol (gcat s−1)
 | (28) |
Accordingly, the rate of conversion of species Ri in eqn (4) was formulated as:
 | (29) |
 | (30) |
3 Results and discussion
3.1 Direct calculation of bed properties from XCT and TEM
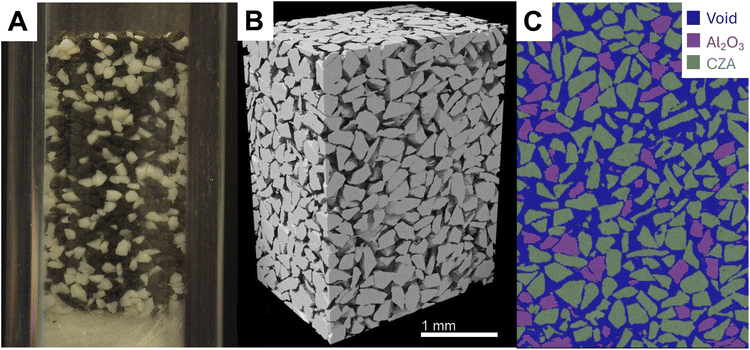
Experiments were performed on packed beds filled with crushed CZA, Al2O3, and mixtures of both. Some transport-relevant properties of these beds can be approximated with commonly used relationships, like the Kozeny–Carman equations.65 However, these equations require assumptions about the shape and distribution of the particles in the bed, which can lead to inaccurate valuations. To reduce errors associated with these approximations, explicit material properties are directly determined using MicroCT, NanoCT, and TEM. These values include, but are not limited to, the average porosities of bed and particles (εb, εpe), tortuosity (τ), diameter of the particles and pores (dpe, dpore) and the permeability (κ). Output from the analyses performed by MATBOX associated with the quantification of these properties for the studied reactor beds is provided in the ESI.†The computed geometric properties and permeabilities for the isolated CZA, Al2O3, and mixed packed bed reactors are presented in Table 2. As an example, an image of the experimental mixed bed reactor, the 3D structure generated using MicroCT, and a slice of the reactor segmented using AI in Dragonfly are presented in Fig. 3A–C. The porosity of the CZA, Al2O3, and mixed packed beds were found to be 0.45, 0.37, and 0.40, respectively. The packed beds composed of crushed CZA pellets had the highest void fraction and the lowest tortuosity (with a value of 1.91 in the axial direction, along which the reactive gas would be flowed). Although similar, the Al2O3 was found to have a higher tortuosity of 2.01 along the same direction. The approximate diameters of the CZA and Al2O3 particle, calculated using the EDMF algorithm in MATBOX, were 2.26 × 10⁵ and 2.15 × 10⁵ nm.53 The larger size of the CZA particles results in less ideal packing, with more void space and lower tortuosity as compared to the smaller Al2O3 particles. The structural properties of the mixed bed were also found to fall between the two isolated materials. The values were closer to those of Al2O3, which is due to the higher packing of the smaller Al2O3 particles. The permeability of the mixed bed in the main flow direction is 2.10 × 10⁻¹² m2, while the associated permeabilities of the CZA and Al2O3 beds were 2.11 × 10⁻¹² m2 and 1.46 × 10⁻¹² m2, respectively. A visualization of the steady-state velocity field from the mesoflow permeability simulation of the mixed bed is also shown in Fig. 4.
| Method | Parameter | CZA | Al2O3 | Mixed |
|---|---|---|---|---|
| MicroCT | ε b[−] | 0.45 | 0.37 | 0.40 |
| τ[−] | 1.91 | 2.01 | 2.02 | |
| d pe[nm] | 2.26 × 10⁵ | 2.15 × 10⁵ | — | |
| κ[m2] | 2.11 × 10⁻¹² | 1.46 × 10⁻¹² | 2.10 × 10⁻¹² | |
| NanoCT | ε pe[−] | 0.29 | 0.38 | — |
| τ pe[−] | 3.70 | 3.36 | — | |
| d pore[nm] | 2.87 × 10³ | 2.10 × 10³ | — | |
| TEM | ε pe[−] | 0.147 | 0.055 | — |
| d pore[nm] | 2.07 × 101 | 8.38 × 100 | — |
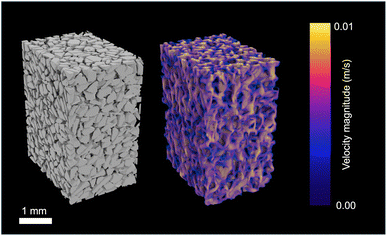 | ||
| Fig. 4 The velocity profile of gas through the mixed bed reactor. Mesoflow simulations were used to determine permeability values. | ||
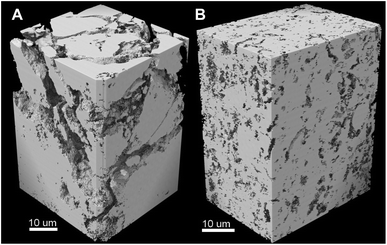
Although microCT is a powerful tool, it does not have the resolution to image the nanometer-scale pore structure inside the CZA and Al2O3 particles. For this reason, nanoCT is used to image small sections of the CZA and Al2O3 particles. The 3D reconstructed nanoCT sub-volumes of each particle is presented in Fig. 5. Inside the particles, CZA has the lower porosity and higher tortuosity compared to Al2O3. The pore diameter between the two materials also varies by a factor of two, with the CZA pores having an EDMF-fitted diameter of 2.87 × 10³ nm compared to 2.10 × 10³ nm Al2O3 pores.
Further, the pore structure can not be entirely resolved through the inclusion of nanoCT. To characterize features below this detection limit, TEM was used, with example micrographs of CZA and Al2O3 shown in the ESI.† Al2O3 was found to have a very uniform distribution of pores with an average diameter of 8.38 × 100 nm. CZA was more heterogeneous in its porosity and had larger pore widths of 2.07 × 101 nm. Similar to the packed bed analysis with microCT, the TEM images reveal the Al2O3 particle had a lower porosity of 0.06 at this scale, while CZA had a porosity of 0.15. Transport through the pores at the nanoCT and TEM scale were assumed to be diffusion-limited, thus permeability simulations were not performed on the geometries from nanoCT. Having characterized the packing and particle porosity at several scales, the calculated values are utilized in CFD simulations.
3.2 Model validation
The CFD model is validated based on experimental data, presented in Sec. 2.2, for different combinations of feed rate, feed pressure (2.54, 4.27, 7.37 bar), and H2/CO ratio (0.95, 2.21). The temperature of feed stream and bed was maintained at 220 °C for all cases, satisfying isothermal condition. The bed properties were obtained from XCT and TEM analysis, see Sec. 3.1. It should be noted that the experimental reactor bed consists of 3.06 g CZA, 0.51 g Al2O3, and 1.49 g SiC, with the latter is used as a diluent. The effective bed porosity of this mixed bed is estimated using the volume fractions of the catalyst types and the isolated porosity values obtained from XCT analysis. Thus, an effective bed porosity of 0.42 is considered. For the purpose of parameterizing the Extra Dimension subgrid model in COMSOL, the particle shape for all catalyst types is assumed to be spherical and uniformly sized with effective intraparticle transport parameters as determined from XCT and TEM analyses.For the ease of comparing simulation and experiment, the conversion  and selectivity
  of species are computed as per eqn (31) and (32).66,67 The conversion of
  is given by:
 | (31) |
 of a carbon containing species i is defined as:
 | (32) |
![[thin space (1/6-em)]](https://www.rsc.org/images/entities/char_2009.gif) C is the sum of molar flow rates of all carbon containing species. By using eqn (31) and (32), the carbon yield
C is the sum of molar flow rates of all carbon containing species. By using eqn (31) and (32), the carbon yield  of species i can be calculated as
  .
.
Fig. 6A–C shows the comparison of simulation and experiment for different operating conditions. Overall, the model predictions are in good agreement with experimental data. The peak CO conversion is 26% and it is achieved for the high feed pressure of 7.37 bar (Feed F3), where the model underpredicts by about 15%. The average deviation in selectivity of CO2 and DME is about 6% and 3.5%, respectively. The observed DME selectivity of 60–65% is in good agreement with literature.50 The discrepancies between the simulation and experiment might be due to differences in the actual particle structure, which although using accurate estimates of intraparticle transport properties, is assumed spherical in the COMSOL subgrid model, while the experimental bed contains crushed particles which exhibit variability in shape and size (see Fig. 3B). Furthermore, differences in the used kinetic model and its associated parameters could also contribute to these deviations. It is worthwhile to emphasize that the primary goal of this validation is to demonstrate the reliability of the proposed multiscale model framework for simulating the direct DME synthesis from syngas using multiple catalysts. This model is primarily developed for studying pilot-scale reactors where the pellets have relatively uniform shape and size, compared with the lab-scale reactor used for experiments. When considering also the inherent errors associated with experiment and numerical methods, the observed deviations are within an acceptable range. It should also be noted that the proposed model is reliable in predicting the reactor behavior with significantly lower computational costs and efforts compared with other high-fidelity modeling approaches.68,69
3.3 Isothermal parametric analysis
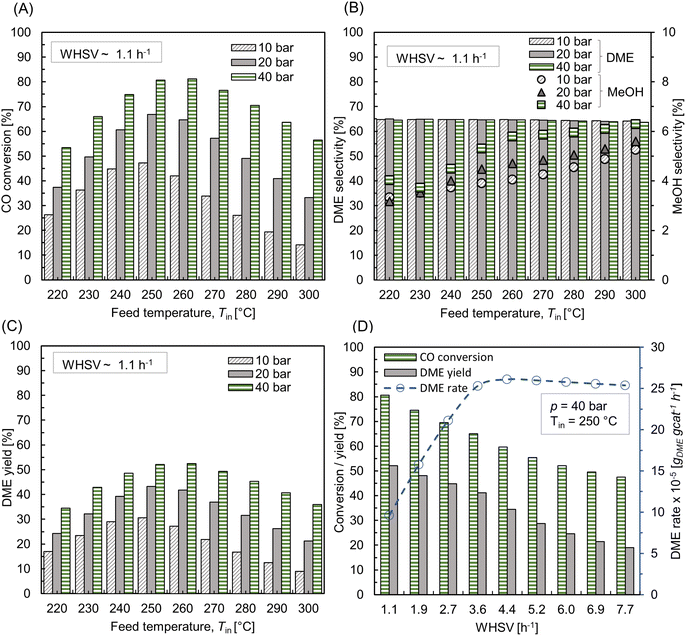
The operating conditions for DME synthesis typically consisted of a wide range of elevated temperatures and pressures, along with varying feed and catalyst compositions, mainly in industrial settings.14 In this study, the validated CFD model is used to investigate the influence of critical processing parameters such as feed temperature, pressure, and flow rate. Although the model is validated for the limited pressures and temperatures (2.54–7.37 bar, 220 °C), its applicability at higher pressures and temperatures is supported by capturing the pressure and temperature dependencies of the reaction through comprehensive rate equations and the equation of state (see Sec. 2.3.3). These formulations ensure that the model accurately accounts for the effect of pressure and temperature on the process dynamics. As the first step, parametric studies were conducted for the isothermal bed condition, i.e., constant bed temperature. For the parametric study, the inlet feed composition corresponding to Feed F1, with H2/CO ratio ∼2.21 (see Sec. 3.2, Fig. 6), is used.Fig. 7 A shows CO conversion for different feed temperatures (Tin = 220–300 °C) and pressure (p = 10–40 bar) at weight hour space velocity (WHSV) ∼ 1.1 h−1 (equivalent standard litre per minute (SLPM) ∼ 0.13, with standard temperature 293 K and pressure 1 bar). Here, WHSV (h−1) is defined as the ratio of total mass flow rate (kg h−1) to total catalyst weight (kg). Since SiC is used as a diluent, it is not taken into account when calculating the catalyst mass. It is inferred that the conversion steadily increases with the rise in feed temperature until 260 °C and thereafter declining. The highly exothermic CO hydrogenation reaction, eqn (20), is subjected to thermodynamic equilibrium limitation at high temperatures (>260 °C), whereas it is kinetically limited at low temperatures. The effect of feed pressure is such that, an increase in pressure leads to higher CO conversion, following the Le Chatelier's principle. The maximum conversion of ∼81% is found at p = 40 bar, Tin = 260 °C. Fig. 7 B depicts the selectivity of DME and MeOH. The feed temperature and pressure have little influence on DME selectivity, while the variation in MeOH selectivity is within 3–6%. The competing species CO2 selectivity remains almost constant around 30%. As shown in Fig. 7C, DME yield proceeds with the trend of CO conversion.
Fig. 7D shows the influence of feed rate (WHSV) on CO conversion and DME yield at Tin = 250 °C, p = 40 bar. The corresponding SLPM is in the range of ∼0.14–1. It should be noted that WHSV is varied by changing the inlet flow rate by keeping the total catalyst mass and bed volume constant. As the feed rate increases, the net conversion decreases and, thereby lowering the DME yield. Fig. 7D also shows the rate of DME production with respect to WHSV. The reaction rate increases as the feed rate increases to a certain level, WHSV ≤ ∼3.6 h−1, and thereafter feed rate has little influence on net DME production. At this regime, the process is kinetically limited. At lower flow rates, the external mass transfer resistance might be higher due to the thickened boundary layer or higher concentration gradient at the particle-fluid interface. As the flow velocity increases, the boundary layer thickness reduces, and the mass transport gets controlled by the reaction rate and intraparticle diffusion.25
3.4 Non-isothermal parametric analysis
Highly exothermic heterogeneous catalytic reactions are typically conducted in wall-cooled tubular reactors to convey the heat of reaction from the bed.70 In large-scale settings, either the catalyst pellets are stacked in several tubes and a heat transfer medium circulates around these tubes, or a catalyst bed is formed around the tubes through which heat transfer medium flows.71 In a packed bed reactor with an exothermic reaction and wall cooling, the axial temperature profile typically exhibits a local maximum, termed as hot spot. Although the occurrence of hot spots are practically unavoidable, it is imperative to maintain the rise in bed temperature within an acceptable envelope. If the bed temperature is significantly lower than the optimum reaction temperature, the reaction rate can slow down. Conversely, an excess temperature may affect thermodynamic equilibrium, process selectivity, and causes undesirable effects like hot spot formation and catalyst deactivation, as well as risk to operational safety.20 In fact, the hot spot temperature is sensitive to the changes in process variables, such as feed temperature, concentration, and wall temperature. Therefore, a thorough analysis on the influence of processing conditions in the formation of hot spot and related mechanisms is required for identifying the optimal operating conditions. In this study, the CFD model is further used to explore the influence of processing parameters while operating under non-isothermal condition.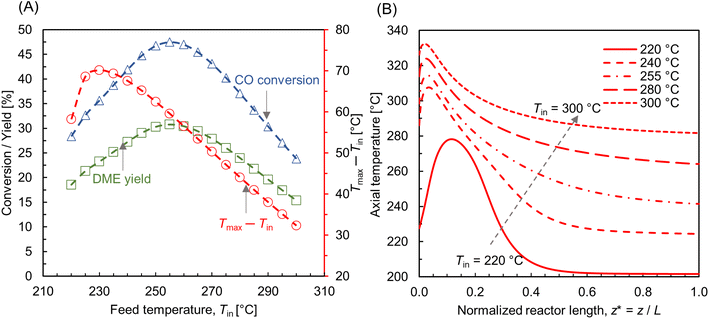 | ||
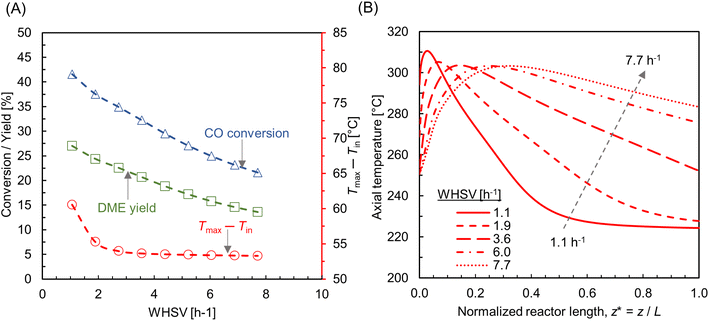
| Fig. 8 (A) Effect of feed temperature on CO conversion, DME yield, and the net rise in maximum bed temperature (Tmax – Tin, right y-axis); (B) centerline temperature profile for different feed temperatures along normalized reactor length z* = z/L, L ∼ 91 mm. For all cases, p = 10 bar, WHSV ∼ 1.1 h−1, Tin − Tw = 20 °C, and inlet feed composition corresponding to Feed F1 (see Fig. 6). | ||
Fig. 8B depicts the axial temperature profile along the bed centerline. At Tin = 220 °C, the hot spot occurs at normalized reactor length z* ∼ 0.12, just beneath the reactor inlet. Moreover, the temperature curve is bell-shaped in the region 0 < z* ≤ 0.3, and the bed temperature remains almost steady after z* ∼ 0.4. By increasing the feed temperature, the hot spot moves closer towards the reactor inlet, causing relatively sudden temperature jumps. This indicates that the hot spot temperature can be accumulated at a specific bed area for high feed temperatures. When catalysts are exposed to such extreme temperatures for an extended period of time, they may undergo deactivation, as well as stress the catalyst material beyond its thermal stability.72
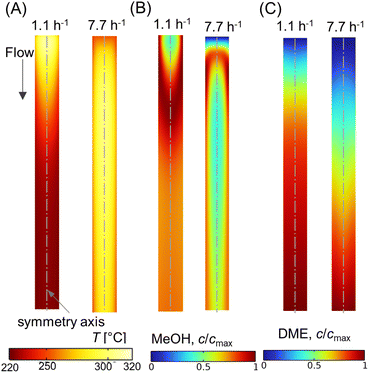
While operating under a wall-cooled configuration, a strong variation in temperature and concentration can occur, both axially and radially. Fig. 9A–C shows scalar plots of temperature, MeOH, and DME concentrations, respectively, along a vertical plane. At Tin = 220 °C, an oval-shaped hot zone is observed at the reactor centre and downstream of the inlet. This hot zone is surrounded by a colder zone near the reactor wall (see Fig. 9A). However, this high temperature gradient zone disappears when the feed temperature is increased. At Tin = 255 °C, the hot zone appears as high temperature across the top of the bed and extending towards the wall. This condition might risk the mechanical strength of the wall material and could potentially lead to thermal runaway.23 In order to prevent such unfavorable impacts and ensure safe operations, the processing conditions should be carefully selected. From Fig. 9B and C, it is evident that the concentration profile is well correlated with the temperature distribution, particularly CO hydrogenation. At lower feed temperature, Tin = 220 °C, MeOH production is maximum in the buffer region created by the hot zone (see Fig. 9B), where the temperature distribution is close to the optimum level, subsequently enhancing the reaction rate. The profile of MeOH concentration changes at Tin = 255 °C, in which higher concentration is observed outside the hot spot. This highlights the importance of regulating the bed temperature level according to the production and removal of heat flux.
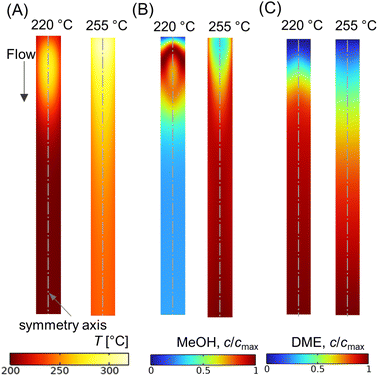 | ||
| Fig. 9 Scalar plots of (A) temperature distribution, (B and C) specific MeOH, and DME concentrations, respectively, for Tin = 220, 255 °C, p = 10 bar, WHSV ∼ 1.1 h−1, Tin − Tw = 20 °C, and inlet feed composition corresponding to Feed F1 (see Fig. 6). | ||
Fig. 10A shows the CO conversion and DME yield for different wall temperatures. It is observed that the CO conversion and DME yield decrease with an increase in difference between the feed and wall temperatures. Similar findings have been reported elsewhere.28,73 DME yield decreases from ∼28% to ∼18% while reducing the wall temperature from 220 °C to 200 °C. Since the feed temperature Tin = 220 °C is lower than the optimum reaction temperature (250 °C), the majority of the bed section exhibits a lower temperature due to the higher gradient between the feed and wall temperatures. This lower bed temperature may not be adequate for the desired reaction kinetics, potentially leading to a reduced DME production and overall conversion. In contrast, a higher cooling rate is found to be beneficial in limiting the rise in hot spot temperature. As shown in Fig. 10A, the maximum rise in bed temperature dips from 80 °C to 58 °C as the wall cooling rate increases. Fig. 10B illustrates the change in axial temperature profile along the bed centerline for different wall temperatures. The hot spot occurs around z* ∼ 0.12, and migrates slightly towards the inlet when the wall temperature is increased. It is also observed that the outlet temperature increases with the decrease in wall temperature, which is due to the reduction in overall radial heat transfer rate. Fig. 11A–C shows scalar plots of temperature, MeOH, and DME concentrations, respectively, along a vertical plane for Tw = 200 °C and 220 °C. The pattern of hot spot formation and species concentration distribution, particularly MeOH, vary significantly with different wall temperatures. For Tin = Tw = 220 °C, the temperature increases at the very inlet and spreads towards the wall due to the reduced heat removal rate.
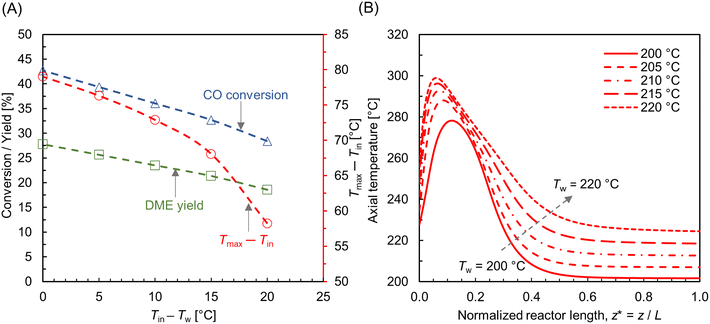 | ||
| Fig. 10 (A) Effect of wall temperature on CO conversion, DME yield, and the net rise in maximum bed temperature (Tmax − Tin, right y-axis); (B) centerline temperature profile along normalized reactor length (z* = z/L, L ∼ 91 mm), for different wall temperatures. For all cases, Tin = 220 °C, p = 10 bar, WHSV ∼ 1.1 h−1, and inlet feed composition corresponding to Feed F1 (see Fig. 6). | ||
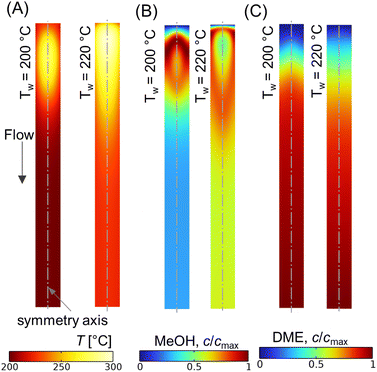 | ||
| Fig. 11 Scalar plots of (A) temperature distribution, (B and C) specific MeOH, and DME concentrations, respectively, for Tw = 200, 220 °C, Tin = 220 °C, p = 10 bar, WHSV ∼ 1.1 h−1, and inlet feed composition corresponding to Feed F1 (see Fig. 6). | ||
The parametric study of wall temperature has shown that desirable design requirements like high product yield and improved bed temperature control are mutually contrasting. In the case examined, lowering the wall temperature helps to limit the maximum bed temperature but also reduces the overall yield. Therefore, it is crucial to find an optimal combination of feed and wall temperatures, along with feed composition, to achieve a suitable trade-off between product yield and effective thermal management. It is also worthwhile to highlight that maintaining a constant wall temperature across the reactor tubes can be challenging, especially in commercial setups with lengthy reactor tubes. Additionally, in a typical shell and tube reactor arrangement, the wall heat flux can vary between individual tubes depending on their position within the shell.74
Fig. 13A–C shows scalar plots of temperature, MeOH, and DME concentrations, respectively, along a vertical plane for WHSV ∼ 1.1 h−1 and 7.7 h−1. At WHSV ∼ 7.7 h−1, the temperature profile looks more even compared with WHSV ∼ 1.1 h−1. Furthermore, an annular-like low temperature region is observed very near the reactor for high WHSV, see Fig. 13A. This is due to the sudden drop in temperature close to the wall, caused by high heat transfer resistance at the immediate vicinity of the reactor wall, which is a typical characteristic of packed bed reactors.82 These results highlight the complex and interconnected nature of the transport and reaction mechanisms occurring in packed bed reactors.
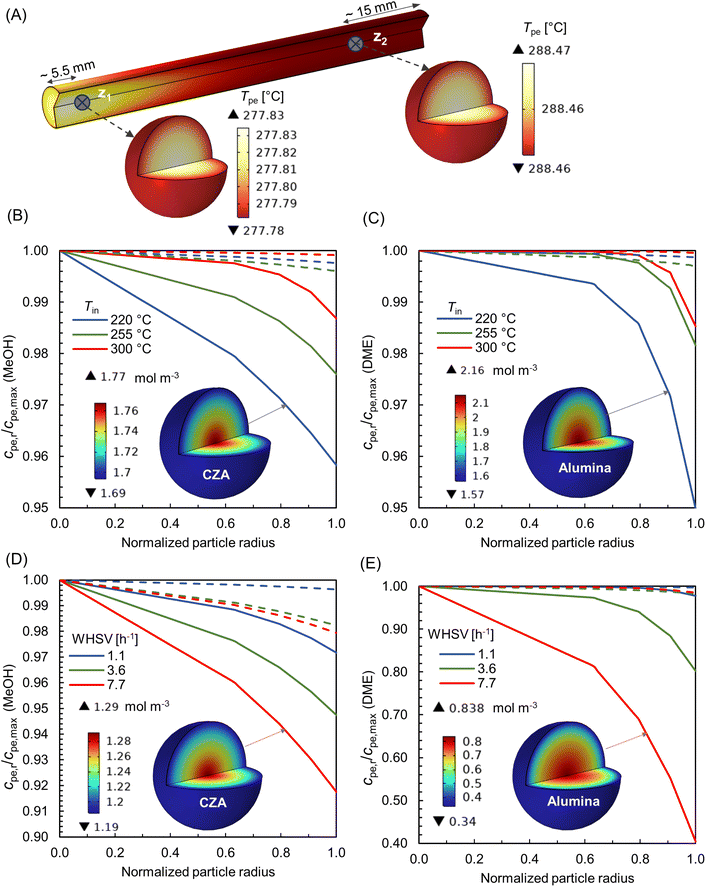
In this multiscale study, to evaluate the significance of intra-particle transport phenomena, the temperature and concentration within the particles are analysed using the reactive pellet bed feature provided by COMSOL Multiphysics 6.2 (see Sec. 2.3). Since a non-isothermal bed exhibits significant variation in transport quantities both axially and radially, representing the entire behavior with a single pellet at a particular location in the bed is challenging. For the sake of analysis, two axial positions are selected at the reactor centre core. As represented in Fig. 14 A – z1 very near the inlet, where the main reaction zone and hot spot are located, and a second position z2 further downstream the bed that represents a relative calm bed section. Fig. 14A depicts the 3-D visualization of temperature distribution within the particles at locations z1 and z2, for the processing conditions – Tin = 250 °C, Tw = 220 °C, p = 10 bar, and WHSV ∼ 7.7 h−1. Note that the color bar of temperature scale is magnified just for the visualization purpose. The difference in temperature between the particle exterior and inner core is 0.05 °C and 0.01 °C at the locations z1 and z2, respectively. Hence, it can be confirmed that the heat transport limitations within these smaller particles (∼215 μm) are negligible. The absence of heat transport limitations in similar cases has been reported in literature,85 even for the particle size (∼10 mm) relevant to industrial applications.
Fig. 14B and C depicts the concentration gradient of MeOH and DME within CZA and Al2O3 particles, respectively, for varying feed temperatures, at WHSV ∼ 1.1 h−1, Tin − Tw = 20 °C, p = 10 bar. The bold lines correspond to location z1 and dotted lines for z2. It is inferred that the concentration gradient within the particles is relatively higher at z1, as it is in the hot spot region. At Tin = 220 °C, z1, and for the particular operating conditions, the rate of MeOH production seems to be high (see Fig. 9B), and therefore mass transport is diffusion limited. The concentration gradient decreases as the feed temperature increases. As the temperature increases, the Knudsen diffusion coefficient may increase as per eqn (17), subsequently enhancing the diffusion of species into the particles. Fig. 14B and C, also contains 3-D visualization of concentration distribution within CZA and Al2O3 particles at z1, for Tin = 220 °C.
Fig. 14D and E represents the concentration gradient of MeOH and DME within CZA and Al2O3 particles, respectively, for varying feed rates (WHSV), at Tin = 250 °C, Tw = 220 °C, p = 10 bar. As the feed rate increases, the concentration gradient within the particles also increases. A higher space velocity (interstitial velocity) limits the time available for the surface species to diffuse into the particles. Fig. 14D and E, also shows 3-D visualization of concentration distribution within CZA and Al2O3 particles at z1, for WHSV 7.7 h−1. It is interesting to note that the gradient within Al2O3 particle is predominant, especially at WHSV 7.7 h−1. The MeOH dehydration reaction, eqn (23), is relatively a faster reaction compared to methanol synthesis. This causes the effective rate to become increasingly diffusion-limited, resulting in steeper concentration gradient in Al2O3 catalysts for the DME production. Additionally, the Al2O3 particles have relatively smaller pore size (see Table 2), which may also lead to an increased resistance to species diffusion.
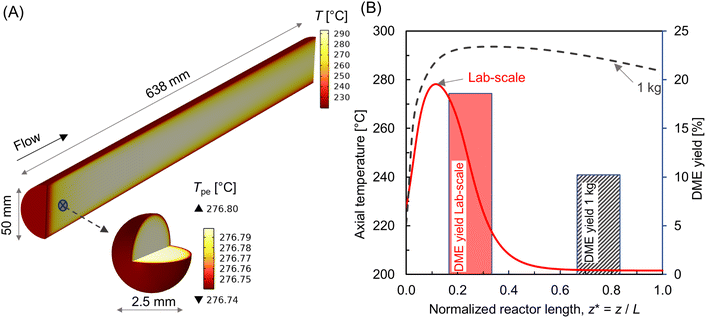
The transport resistances including rate limiting steps would change significantly while increasing the reactor size, which may in turn affect the overall conversion and product yield. As an initial analysis, the proposed reactor model is used to examine a relatively larger reactor containing 1 kg of catalyst (0.86 kg CZA and 0.14 kg Al2O3). As illustrated in Fig. 15A, the scaled-up reactor has a tube diameter of 50 mm and bed length of about 638 mm. A particle size of 2.5 mm was considered for both CZA and Al2O3 catalysts. Thus, the main design requirements of L/D > 10 and D/dp > 10 are satisfied. Fig. 15A also depicts the temperature distribution within the reactor at Tin = 220 °C, Tin − Tw = 20 °C, p = 10 bar, WHSV ∼ 1.1 h−1. The comparison of centerline temperature profiles between lab-scale and 1 kg reactor is shown in Fig. 15B. The results indicate that hot spot formation in the lab-scale reactor is no longer observed at scale-up (see also Fig. 8 and 9). This is attributed to the relatively slower reaction rates and internal mass transfer limitations associated with larger pellet sizes. However, the reactor temperature continues to rise along the length of the reactor tube. Increased mass flow rates and higher production rates contribute to greater net heat generation in the 1 kg-scale reactor. As the reactor size (tube diameter) increases, the ratio of tube wall surface area to bed volume decreases, thereby limiting the overall radial heat transfer. Thus, ensuring proper bed temperature control is the primary challenge when scaling up the reactor for exothermic reactions.14Fig. 15B also shows the comparison of DME yield. The yield in the larger reactor is reduced by almost half compared with lab-scale reactor. This is attributed to inefficient bed temperature control and increased internal transport limitation associated with comparatively bigger catalyst particles (2.5 mm). Therefore, the process variables and pellet properties should be optimized to achieve the desired yield while scaling up the reactor. A detailed study focusing on reactor scale-up for direct DME synthesis will be addressed in future work.
The model presented here is scalable to study reactor behaviors from lab-scale to pilot + scale. A recent study has highlighted the scale-up methodology and applicability of this type of model for scale-up purposes.25
4 Conclusion
A unique multiscale CFD-based modeling approach was used to simulate the direct synthesis of DME in a packed bed composed of physically mixed Cu/ZnO/Al2O3 (CZA) and γ-Al2O3 catalysts. The proposed model explicitly considers the transport processes and chemical reactions occurring on scales ranging from reactor to pellet level. The internal transport phenomena, including species diffusion, reactions, and heat transport, as well as transport limitations within the pellets were evaluated using the Reactive Pellet Bed feature integrated into COMSOL Multiphysics 6.2. Thus, the model is capable to accurately predict the reactor performance by also considering the influence of process variables, as well as heat and mass transfer phenomena.Experiments were conducted in a lab-scale reactor for direct DME synthesis under isothermal condition, for a limited range of pressures (2.54 ≤ p ≤ 7.37 bar) and flow rates. To accurately characterize the structural properties of the bed structure (particle size, bed permeability bed and particle porosities) X-ray Computed Tomography (XCT) and Transmission Electron Microscopy (TEM) techniques were employed. These measurements were then used as input for the developed multiscale model. The simulation results and experiments show good agreement for the investigated operating conditions.
The validated CFD model was further used to investigate the influence of process variables. The optimum feed temperature is found to be 250–260 °C. At this condition, the hot spot temperature may rise by about 60 °C. The CO conversion and DME yield decrease as the difference between the feed temperature and wall temperature increases, particularly when the feed temperature is lower than the optimal level (∼255 °C). However, a lower wall temperature than the feed temperature is beneficial in limiting the rise in hot spot temperature. Similarly, increasing the feed rate leads to a decrease in CO conversion and DME yield. It is also noticed that a sharp hot spot formation can be avoided with high feed rates, though this comes at the cost of a lower DME yield. The choice of operating range depends on balancing the reaction rate, yield, and key cost drivers. The pattern of hot spot formation is found to be strongly dependent on process variables. The evaluation of intra-particle transport phenomena reveals that heat transport limitations are negligible for the smaller sized particles examined. However, internal mass transport limitations can arise in the reaction zone or hot spot region due to the strong interplay between reaction kinetics and thermodynamic limitations.
Preliminary analysis of scale-up has shown that heat and mass transport limitations play a dominant role in the performance of larger reactor systems. It is therefore important to identify a set of reliable process parameters and pellet properties (e.g., particle size, porosity) which provide a reasonable trade-off between product yield and effective temperature control. This should be supported by a comprehensive techno-economic analysis for the commercial reactor configuration. In future work, this multiscale model will be employed to explore reactor scale-up, focusing on optimizing process variables and pellet properties.
Data availability
The original experimental data supporting the findings of this study are presented in the figures and graphics within the manuscript and ESI.† The open-source software tool used for part of the analysis is available at [https://github.com/NREL/mesoflow]. Due to licensing restrictions, the commercial software COMSOL, used in the modeling portion of the study, cannot be shared. For further inquiries or access to additional data, please contact the corresponding author at [E-mail: karakayac@ornl.gov].Author contributions
Ginu R. George: formal analysis of reactor model; investigation; validation; visualization; writing – original draft. Adam Yonge: formal analysis of 3D imaging; investigation; software; visualization; writing – original draft. Meagan F. Crowley: formal analysis of 3D imaging; investigation; software; visualization; writing – original draft. Anh T. To: carry out experiments; investigation; resources. Peter N. Ciesielski: conceptualization of 3D imaging; supervision; project administration; writing – review & editing. Canan Karakaya: conceptualization of reactor model; methodology; supervision; project administration; funding acquisition; writing – review & editing.Conflicts of interest
There are no conflicts to declare.Notes
This manuscript has been authored by UT-Battelle, LLC, under contract DE-AC05-00OR22725 with the US Department of Energy (DOE). The US government retains and the publisher, by accepting the work for publication, acknowledges that the US government retains a non-exclusive, paid-up, irrevocable, world-wide license to publish or reproduce the submitted manuscript version of this work, or allow others to do so, for US government purposes. DOE will provide public access to these results of federally sponsored research in accordance with the DOE Public Access Plan (https://energy.gov/doe-public-access-plan).Acknowledgements
This material is based upon work supported by the U.S. Department of Energy's Bioenergy Technologies Office under contract number DE-AC05-00OR22725. The research was conducted in collaboration with the Consortium for Computational Physics and Chemistry (CCPC) and the Chemical Catalysis for Bioenergy Consortium (ChemCatBio). The authors thank Technology Managers Sonia Hammache and Trevor Smith for their support and guidance. The author G. R. George thanks Dr Aditya Kashi (Computer Scientist, scalable numerical methods, Oak Ridge National Laboratory, USA) for the valuable discussion on the numerical schemes adopted in this work.References
- M. Müller and U. Hübsch, in Dimethyl Ether, John Wiley & Sons, Ltd, 2000 Search PubMed.
- Alternative Fuels data center, https://afdc.energy.gov/fuels/emerging-dme, accessed: 2024-06-10.
- T. A. Semelsberger, R. L. Borup and H. L. Greene, J. Power Sources, 2006, 156, 497–511 CrossRef CAS.
- S. Chang and A. Silvestri, J. Catal., 1977, 47, 249–259 CrossRef.
- S. Ilias and A. Bhan, ACS Catal., 2013, 3, 18–31 CrossRef CAS.
- S. Müller, Y. Liu, F. Kirchberger, M. Tonigold, M. Sanchez-Sanchez and J. J. A. Lercher, J. Am. Chem. Soc., 2016, 138, 15994–16003 CrossRef PubMed.
- M. Stoeker, Microporous Mesoporous Mater., 1999, 29, 3–48 CrossRef.
- D. Simonetti, J. Ahn and E. Iglesia, ChemCatChem, 2011, 3, 704–718 CrossRef CAS.
- A. To, M. Arellano-Treviño, C. Nash and D. Ruddy, J. CO2 Util., 2022, 66, 102261 CrossRef CAS.
- M. LaFollette and R. Lobo, Appl. Catal., A, 2022, 641, 118645 CrossRef CAS.
- V. Dieterich, A. Buttler, A. Hanel, H. Spliethoff and S. Fendt, Energy Environ. Sci., 2020, 13, 3207–3252 RSC.
- M. Smyrnioti, C. Tampaxis, T. Steriotis and T. Ioannides, Catal. Today, 2020, 357, 495–502 CrossRef CAS.
- A. A. Al-Rabiah, A. S. Alshehri, A. Ibn Idriss and O. Y. Abdelaziz, Chem. Eng. Technol., 2022, 45, 319–328 CrossRef CAS.
- C. Peinado, D. Liuzzi, S. N. Sluijter, G. Skorikova, J. Boon, S. Guffanti, G. Groppi and S. Rojas, Chem. Eng. J., 2023, 147494 Search PubMed.
- S. Banivaheb, S. Pitter, K. H. Delgado, M. Rubin, J. Sauer and R. Dittmeyer, Chem. Ing. Tech., 2022, 94, 240–255 CrossRef CAS.
- C. Mevawala, Y. Jiang and D. Bhattacharyya, Appl. Energy, 2019, 238, 119–134 CrossRef CAS.
- F. Bollon, 7th Asian DME Conference, International DME Association, Niigata, 2011, pp. 1–27 Search PubMed.
- A. Ateka, P. Pérez-Uriarte, M. Gamero, J. Ereña, A. T. Aguayo and J. Bilbao, Energy, 2017, 120, 796–804 CrossRef CAS.
- D. Song, W. Cho, G. Lee, D. K. Park and E. S. Yoon, Ind. Eng. Chem. Res., 2008, 47, 4553–4559 CrossRef CAS.
- R. van Welsenaere and G. Froment, Chem. Eng. Sci., 1970, 25, 1503–1516 CrossRef CAS.
- M. Sánchez-Contador, A. Ateka, M. Ibáñez, J. Bilbao and A. Aguayo, Renew. Energy, 2019, 138, 585–597 CrossRef.
- S. B. Lee, W. Cho, D. K. Park and E. S. Yoon, Korean J. Chem. Eng., 2006, 23, 522–530 CrossRef CAS.
- B. Marwaha and D. Luss, Chem. Eng. Sci., 2003, 58, 733–738 CrossRef CAS.
- V. S. Bharadwaj, M. B. Pecha, L. Bu, V. L. Dagle, R. A. Dagle and P. N. Ciesielski, Catal. Today, 2019, 338, 141–151 CrossRef CAS.
- C. Karakaya, B. D. Adkins, D. McClelland, N. Victor, K. Barnett and G. W. Huber, Ind. Eng. Chem. Res., 2024, 63, 12961–12976 CrossRef CAS.
- H. Park, Int. J. Heat Mass Transfer, 2018, 116, 520–531 CrossRef CAS.
- S. Sujeesh, V. N. Ahmed, A. S. Rao and S. Mukhopadhyay, Int. J. Hydrogen Energy, 2022, 47, 11750–11763 CrossRef CAS.
- R. Peláez, P. Marín, F. V. Díez and S. Ordóñez, Fuel Process. Technol., 2018, 174, 149–157 CrossRef.
- S. Ergun and A. Orning, Ind. Eng. Chem., 1949, 41, 1179–1184 CrossRef CAS.
- M. F. Crowley, H. Sitaraman, J. Klinger, F. Usseglio-Viretta, N. E. Thornburg, N. Brunhart-Lupo, M. B. Pecha, J. H. Dooley, Y. Xia and P. N. Ciesielski, Front. Energy Res., 2022, 10, 850630 CrossRef.
- S. Dayani, H. Markötter, A. Schmidt, M. P. Widjaja and G. Bruno, J. Energy Storage, 2023, 66, 107453 CrossRef.
- D. Su, Green Energy Environ., 2017, 2, 70–83 CrossRef.
- Y.-J. Huang, F.-Q. Guo, H. Zhang and Z.-J. Yang, Cement Concr. Compos., 2022, 126, 104347 CrossRef CAS.
- I. D. Gonzalez-Jimenez, K. Cats, T. Davidian, M. Ruitenbeek, F. Meirer, Y. Liu, J. Nelson, J. C. Andrews, P. Pianetta and F. M. de Groot, et al. , Angew. Chem., 2012, 124, 12152–12156 CrossRef.
- H.-Y. Chen, J. Pihl, T. J. Toops and S. Sinha Majumdar, Appl. Catal., A, 2023, 656, 119140 CrossRef CAS.
- Z. Azizi, M. Rezaeimanesh, T. Tohidian and M. R. Rahimpour, Chem. Eng. Process.: Process Intensif., 2014, 82, 150–172 CrossRef CAS.
- X. Wang, S. Y. Jeong, H. S. Jung, D. Shen, M. Ali, F. Zafar, C.-H. Chung and J. W. Bae, Appl. Catal., B, 2023, 327, 122456 CrossRef CAS.
- F. Ramos, A. D. de Farias, L. Borges, J. Monteiro, M. Fraga, E. Sousa-Aguiar and L. Appel, Catal. Today, 2005, 101, 39–44 CrossRef CAS.
- R. Ahmad, M. Hellinger, M. Buchholz, H. Sezen, L. Gharnati, C. Wöll, J. Sauer, M. Döring, J.-D. Grunwaldt and U. Arnold, Catal. Commun., 2014, 43, 52–56 CrossRef CAS.
- A. García-Trenco and A. Martínez, Appl. Catal., A, 2015, 493, 40–49 CrossRef.
- G. Baracchini, M. Klumpp, P. Arnold and R. Dittmeyer, Chem. Eng. J., 2020, 396, 125155 CrossRef CAS.
- Y. Wang, W. Wang, Y. Chen, J. Ma and R. Li, Chem. Eng. J., 2014, 250, 248–256 CrossRef CAS.
- R. Phienluphon, K. Pinkaew, G. Yang, J. Li, Q. Wei, Y. Yoneyama, T. Vitidsant and N. Tsubaki, Chem. Eng. J., 2015, 270, 605–611 CrossRef CAS.
- S. Wild, B. Lacerda de Oliveira Campos, T. A. Zevaco, D. Guse, M. Kind, S. Pitter, K. Herrera Delgado and J. Sauer, React. Chem. Eng., 2022, 7, 943–956 RSC.
- C. Hill and T. Root, Introduction to Chemical Engineering Kinetics and Reactor Design, John Wiley & Sons, 2014 Search PubMed.
- S. Elnashaie, Modelling, Simulation and Optimization of Industrial Fixed Bed Catalytic Reactors, Routledge, 2022 Search PubMed.
- COMSOL Multiphysics 6.2, Chemical Reaction Engineering Module User's Guide, https://doc.comsol.com/.
- B. Adkins, Z. Mills, J. Parks II, M. Pecha, P. Ciesielski, K. Iisa, C. Mukarakate, D. Robichaud, K. Smith, K. Gaston, M. Griffin and J. Schaidle, React. Chem. Eng., 2021, 6, 888–904 RSC.
- S. Guffanti, C. G. Visconti and G. Groppi, Ind. Eng. Chem. Res., 2020, 59, 14252–14266 CrossRef CAS.
- D. Song, S. Y. Cho, T. T. Vu, Y. H. P. Duong and E. Kim, Catalysts, 2021, 11(12), 1522 CrossRef CAS.
- H. Sitaraman, P. Ciesielski, M. Crowley, M. Pecha, N. Thornburg, M. Crowley, V. Bharadwaj, Mesoflow, U. L. D. Research and Development, SWR-22-56, 2022, https://www.osti.gov//servlets/purl/1873470 Search PubMed.
- Comet Technologies Canada Inc., Dragonfly, 2022, 2 Computer software, https://www.theobjects.com/dragonfly Search PubMed.
- F. L. Usseglio-Viretta, P. Patel, E. Bernhardt, A. Mistry, P. P. Mukherjee, J. Allen, S. J. Cooper, J. Laurencin and K. Smith, SoftwareX, 2022, 17, 100915 CrossRef.
- C. A. Schneider, W. S. Rasband and K. W. Eliceiri, Nat. Methods, 2012, 9, 671–675 CrossRef CAS PubMed.
- C. T. Nimlos, C. P. Nash, D. P. Dupuis, A. T. To, A. Kumar, J. E. Hensley and D. A. Ruddy, ACS Catal., 2022, 12, 9270–9280 CrossRef CAS.
- COMSOL Multiphysics V. 6.2, COMSOL AB, Stockholm, Sweden, https://www.comsol.com/ Search PubMed.
- COMSOL Multiphysics Reference manual, 2024.
- R. J. Millington and J. p. Quirk, Transp. Porous Media, 1960, 49, 377–378 Search PubMed.
- J. C. Maxwell, Philos. Trans. R. Soc. London, 1867, 157, 49–88 CrossRef.
- O. Redlich and J. N. S. Kwong, Chem. Rev., 1949, 44, 233–244 CrossRef CAS PubMed.
- J.-F. Portha, K. Parkhomenko, K. Kobl, A.-C. Roger, S. Arab, J.-M. Commenge and L. Falk, Ind. Eng. Chem. Res., 2017, 56, 13133–13145 CrossRef CAS.
- Y. Choi and H. Stenger, J. Power Sources, 2003, 124, 432–439 CrossRef CAS.
- M. Mollavali, F. Yaripour, H. Atashi and S. Sahebdelfar, Ind. Eng. Chem. Res., 2008, 47, 3265–3273 CrossRef CAS.
- G. Graaf, E. Stamhuis and A. Beenackers, Chem. Eng. Sci., 1988, 43, 3185–3195 CrossRef CAS.
- J. G. Berryman and S. C. Blair, J. Appl. Phys., 1987, 62, 2221–2228 CrossRef.
- C. Karakaya, E. White, D. Jennings, M. Kidder, O. Deutschmann and R. J. Kee, ChemCatChem, 2022, 14, e202200802 CrossRef CAS.
- C. Karakaya and H.-Y. Chen, Chem. Eng. J., 2025, 503, 157448 CrossRef.
- N. Jurtz, M. Kraume and G. D. Wehinger, Rev. Chem. Eng., 2019, 35, 139–190 CrossRef.
- A. G. Dixon and B. Partopour, Annu. Rev. Chem. Biomol. Eng., 2020, 11, 109–130 CrossRef CAS.
- D. O. Borio, J. E. Gatica and J. A. Porras, AIChE J., 1989, 35, 287–292 CrossRef CAS.
- G. Eigenberger and W. Ruppel, in Catalytic Fixed-Bed Reactors, John Wiley & Sons, Ltd, 2012 Search PubMed.
- E. J. Erekson, E. L. Sughrue and C. H. Bartholomew, Fuel Process. Technol., 1981, 5, 91–101 CrossRef CAS.
- N. Beltermann, S. Weiske, R. Becka, R. C. Samsun, R. Peters, D. Stolten and T. E. Müller, Int. J. Hydrogen Energy, 2023, 48, 39373–39388 CrossRef CAS.
- S. Spatenka, M. Matzopoulos, Z. Urban and A. Cano, Ind. Eng. Chem. Res., 2019, 58, 12571–12585 CrossRef CAS.
- W. C. Sung, H. S. Jung, J. W. Bae, J. Y. Kim and D. H. Lee, J. CO2 Util., 2023, 69, 102411 CrossRef CAS.
- J. Hu, Y. Wang, C. Cao, D. C. Elliott, D. J. Stevens and J. F. White, Ind. Eng. Chem. Res., 2005, 44, 1722–1727 CrossRef CAS.
- A. G. Dixon, Can. J. Chem. Eng., 2012, 90, 507–527 CrossRef CAS.
- E. Tsotsas and E.-U. Schlünder, Chem. Eng. Sci., 1990, 45, 819–837 CrossRef CAS.
- O. Sanz, I. Velasco, I. Reyero, I. Legorburu, G. Arzamendi, L. M. Gandía and M. Montes, Catal. Today, 2016, 273, 131–139 CrossRef CAS.
- R. Balzarotti, M. Ambrosetti, A. Beretta, G. Groppi and E. Tronconi, Chem. Eng. J., 2020, 391, 123494 CrossRef CAS.
- G. R. George, M. Bockelmann, L. Schmalhorst, D. Beton, A. Gerstle, A. Lindermeir and G. D. Wehinger, Chem. Eng. Process.: Process Intensif., 2023, 188, 109357 CrossRef CAS.
- H. Martin and M. Nilles, Chem. Ing. Tech., 1993, 65, 1468–1477 CrossRef CAS.
- A. W. Kleij, Angew. Chem., Int. Ed., 2018, 57, 7564–7565 CrossRef CAS.
- H. S. Fogler, Elements of Chemical Reaction Engineering, Prentice Hall PTR, Upper Saddle River, NJ, 4th edn, 2006 Search PubMed.
- S. Poto, H. van den Bogaard, F. Gallucci and M. Fernanda Neira d'Angelo, Fuel, 2023, 350, 128783 CrossRef CAS.
Footnote |
| † Electronic supplementary information (ESI) available. See DOI: https://doi.org/10.1039/d4su00602j |
| This journal is © The Royal Society of Chemistry 2025 |

