 Open Access Article
Creative Commons Attribution 3.0 Unported Licence
Rationalising catalytic performance using a unique correlation matrix†
Maciej G.
Walerowski
 a,
Stylianos
Kyrimis
 ab,
Victoria A.
Hewitt
 a,
Lindsay-Marie
Armstrong
 b and
Robert
Raja
 *a
*a
aSchool of Chemistry, University of Southampton, Southampton, SO17 1BJ, UK. E-mail: R.Raja@soton.ac.uk
bSchool of Engineering, University of Southampton, Southampton, SO17 1BJ, UK
First published on 14th August 2024
Abstract
Relationships between catalyst synthesis, structure and performance were investigated. Precise nanoparticle size control was achieved by tailoring solvent volume, drying temperature and solvent polarity. Catalyst performance was rationalised using a novel multidimensional correlation matrix, which considered synthetic, structural and catalytic data. This unique matrix can aid the design of improved catalysts.
The International Maritime Organization set an ambitious target of achieving net-zero for international shipping by 2050,1 necessitating the development of sustainable marine fuels. Dimethyl ether (DME) is a viable alternative for marine diesel as it is non-toxic, compatible with existing liquid petroleum gas infrastructure and potentially a carbon-neutral fuel, as it can be produced via a circular carbon economy.2,3 There are limited reports in the literature that outline the one-pot conversion of CO2 to DME. One-pot DME synthesis is possible using a bifunctional catalyst which possesses redox sites for the hydrogenation of CO2 into a methanol intermediate, and acidic sites for the subsequent dehydration of methanol to DME.2–4 We recently reported the design and fabrication of a bifunctional catalyst, wherein SAPO-34 solid acid crystals were decorated with Cu0–ZnO redox nanoparticles.5 Whilst this bifunctional catalyst demonstrates comparable catalytic activity, it rivals other reported heterogeneous catalysts with its exceptional DME selectivity, and more importantly, no observable toxic CO byproduct formation. Cu0–ZnO was chosen as a redox functionality as it shows good activity, is non-toxic, low-cost, widely studied, and is used in industrial applications.
The initial CO2 hydrogenation step is thermodynamically challenging compared to the subsequent methanol dehydration step, indicating that the overall DME yield is limited by the activity of the redox sites.2–4 Increasing redox site availability and accessibility is a potential method for improving the initial conversion of CO2. This is possible by decreasing the redox nanoparticle size, which boosts the number of exposed active surface sites per gram of metal, thus improving the turnover frequency and metal utilisation.6 Moreover, reducing nanoparticle size can further expose certain crystal facets which can influence product distribution.6–8 For instance, it has been found that smaller Cu nanoparticles display higher methanol selectivity during CO2 hydrogenation due to greater abundance of corner and edge sites.8 Various methods have been applied to create and control the size and/or shape of Cu-based nanoparticles such as tailoring metal loading,8–11 altering calcination procedures,8,12 use of colloidal solutions,13,14 specially designed reactors,15 varying supports10 and controlling reaction temperature.16,17
Although significant progress has been made in the synthesis of precisely-controlled nanoparticles,6,7,18 studies often focus predominantly on the determination of nanoparticle shape and size and rarely consider the impact of their approach on other catalytically-relevant characteristics such as oxidation state and local structure. Treating nanoparticle shape and size as a sole descriptor of catalytic performance can lead to misleading structure–property correlations, as properties such as coordination number can change with nanoparticle modification. This highlights the need of multidimensional investigations, which couple synthetic variables, structural properties and catalytic performance to provide a more comprehensive understanding of features that can be tailored to give highly active and/or selective catalysts.
In this work, a series of bifunctional CO2 to DME Cu0–ZnO/SAPO-34 catalysts were synthesised using an impregnation approach, as this method was found to yield highly selective catalysts compared to other synthesis techniques.5 Specifically, we investigated the impacts of changing solvent volume, drying temperature, solvent polarity and metal loading (Fig. S1, ESI†) on, firstly, the nanoparticle size and secondly on the overall catalyst structure & performance. Using the acquired data, we devised a unique and novel synthesis–structure–performance correlation (SSPC) matrix. Our SSPC matrix simultaneously showcases the impact of synthesis modification, not only on nanoparticle size, but also on oxidation state, local structure, coordination geometry and catalytic performance. This has not been achieved by previous studies, to the best of our knowledge. This facilitates the creation of robust structure–property correlations, which aids model-based engineering of precisely-controlled catalysts. Full synthetic, characterisation & catalytic protocols can be found in Sections S1, S2 and S3 of the ESI,† respectively. We used a previously developed multidimensional analytical model to obtain the SSPC matrix and a full description of this model can be found in Kyrimis et al.19
Solvent volume, solvent polarity and drying temperature have a pronounced influence on TEM-derived nanoparticle sizes (Fig. 1 and Fig. S2, S3, ESI†). Increasing solvent volume and solvent polarity (Fig. 1a and b, respectively) yields Cu0–ZnO/SAPO-34 bifunctional catalysts with smaller nanoparticles, which is likely due to more extensive dissolution of the Cu and Zn salts. This lowers localised precursor concentration, which reduces the likelihood of nuclei collisions and hence agglomeration.15 Higher drying temperatures were also found to yield smaller nanoparticles (Fig. 1c). This is due to an increase in the rate of drying and impregnation, which indicates that the rate of nucleation is higher than the rate of nanoparticle growth, thus resulting in smaller nanoparticles.20 To validate the TEM-derived nanoparticle sizes, the catalysts were characterised using XAS. Cu–Cu coordination numbers (CNs) can be obtained by fitting EXAFS results (Table S1, ESI†), which can signify nanoparticle size with lower Cu–Cu CNs, suggesting smaller nanoparticles.21 The XAS Cu–Cu CNs (Fig. 1 and Fig. S4, ESI†) follow the same trend as TEM nanoparticle sizes, with both showing highly linear correlations between the synthetic variable of interest and the observed results. Precise control of nanoparticle size is thus possible by simply tailoring the solvent volume, solvent polarity or drying temperature. Our methodology aligns with green chemistry principles, as nanoparticle size modification can be achieved at mild temperatures, using no toxic solvents or additional reagents. Modifying solvent volume gives the most accurate control of nanoparticle size, as highly linear correlations are obtained using both TEM and XAS results. Fig. 1d shows a lack of linear correlation between metal loading and either nanoparticle size or Cu–Cu CNs. An inverse trend to nanoparticle size is observed for Cu oxidation state (OS), with high solvent volume, polarity, drying temperature, and low metal loading yielding higher Cu OS and Cu–O CN (Fig. S5 and Table S1, ESI†). The Cu OS correlates to Cu–Cu CN and to nanoparticle size (Fig. S6, ESI†). Smaller nanoparticles possess a greater surface-to-bulk ratio with a larger fraction of undercoordinated surface atoms, which will be more prone to forming a surface oxide.6 This justifies the positive correlation between smaller nanoparticles and higher oxidation states. In contrast to the Cu centre, neither the Zn CN (Table S2, ESI†) nor Zn OS (Table S3, ESI†) is impacted significantly by the synthetic variables.
 | ||
| Fig. 1 Impact of (a) solvent volume (b) solvent polarity (c) drying temperature and (d) metal loading on TEM-derived nanoparticle size and XAS-derived Cu−Cu coordination number. | ||
Solvent volume, solvent polarity and drying temperature had no significant impact on metal loading with all catalysts exhibiting similar Cu (∼12 wt%) and Zn (∼6 wt%) loadings with the expected 2![[thin space (1/6-em)]](https://www.rsc.org/images/entities/char_2009.gif) :
:![[thin space (1/6-em)]](https://www.rsc.org/images/entities/char_2009.gif) 1 Cu/Zn mass ratio (Table S4, ESI†). Reducing intended loading lowers the actual metal loading as predicted. Cu(111) and Cu(200) XRD reflections were observed for all catalysts following the deposition of Cu and ZnO onto SAPO-34 crystals (Fig. S7, ESI†). ZnO reflections were not observed for any catalysts indicating the formation of either highly dispersed nanocrystallites or an amorphous ZnO phase. Only metal loading had a compelling impact on the XRD patterns, with weaker Cu(111) and Cu(200) reflections being observed for catalysts with lower loadings, which is expected. Solvent volume, drying temperature and solvent polarity had no significant influence on the total surface area of the Cu0–ZnO/SAPO-34 catalysts, with BET surface areas ranging between 292 and 335 m2 g−1 (Table S5, ESI†). In contrast, metal loading had a pronounced impact on surface area (303–397 m2 g−1, Fig. S8, ESI†).
1 Cu/Zn mass ratio (Table S4, ESI†). Reducing intended loading lowers the actual metal loading as predicted. Cu(111) and Cu(200) XRD reflections were observed for all catalysts following the deposition of Cu and ZnO onto SAPO-34 crystals (Fig. S7, ESI†). ZnO reflections were not observed for any catalysts indicating the formation of either highly dispersed nanocrystallites or an amorphous ZnO phase. Only metal loading had a compelling impact on the XRD patterns, with weaker Cu(111) and Cu(200) reflections being observed for catalysts with lower loadings, which is expected. Solvent volume, drying temperature and solvent polarity had no significant influence on the total surface area of the Cu0–ZnO/SAPO-34 catalysts, with BET surface areas ranging between 292 and 335 m2 g−1 (Table S5, ESI†). In contrast, metal loading had a pronounced impact on surface area (303–397 m2 g−1, Fig. S8, ESI†).
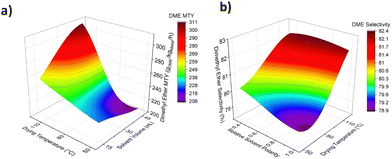
Kyrimis et al. investigated the correlation between reactor length & diameter, pressure drop, maximum temperature and methanol yield using a 3D response surface model.19 The 3D response surface showcased how changes in input parameters (i.e., reactor design) affected the output parameters (i.e., reactor behaviour). As a proof of concept, we utilised the same method to model the influence of synthetic variables on predicted catalyst performance. Fig. 2a and Fig. S9 (ESI†) demonstrate the correlation between solvent volume, drying temperature, solvent polarity, and predicted DME metal time yield (MTY). Catalysts prepared using high solvent volume and drying temperature are estimated to show the highest activity and can achieve yields of over 300 gDME kgMetal−1 h−1. In contrast, solvent polarity has a lesser impact on predicted yields. Experimental DME yields increased with metal loading as expected (Fig. S10, ESI†). Maximum DME selectivity is predicted by the model for catalysts synthesised using high volumes of low polarity solvents and high drying temperatures (Fig. 2b and Fig. S11, ESI†).
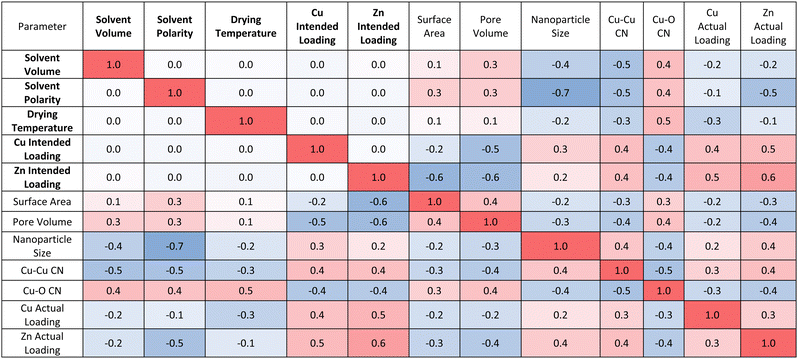
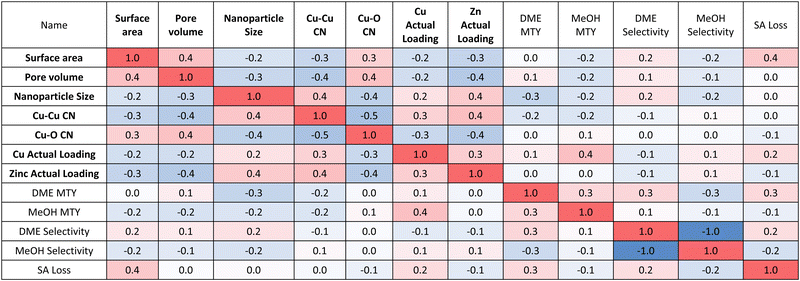
The developed model also allows us to establish multidimensional matrices to evaluate the association between investigated input and output parameters. Positive numbers (red) indicate that as an input parameter increases so does the output parameter, while negative numbers (blue) indicate the contrary. Magnitude shows the strength of correlation, with ±1 demonstrating strong correlation between an input and output parameter and smaller numbers indicating weak correlation. These correlations are presented in Tables 1 and 2, with Table 1 focusing on the correlation between experimental synthesis procedure and catalyst structure and Table 2 coupling experimental catalyst structure and performance. Table 1 confirms that increasing solvent volume, drying temperature or solvent polarity negatively influences, predominantly, the nanoparticle size and Cu–Cu CN, and positively influences the Cu–O CN and Cu OS. In other words, increasing these synthetic variables yields smaller, more oxidised nanoparticles. Solvent polarity impacts nanoparticle size most notably, with higher polarity solvents yielding smaller nanoparticles. Varying metal loading has a pronounced impact on all structural features once more highlighting that it is not a controlled method for tailoring nanoparticle size.
Focusing on the structure-performance correlation matrix (Table 2), it can be seen that increasing surface area and pore volume increases DME selectivity. Catalysts with higher surface areas will provide better access to internal acid sites of SAPO-34, which will increase the extent of methanol dehydration and hence DME selectivity. Decreasing nanoparticle size and Cu–Cu CN increases both the DME and methanol MTY, which can be rationalised by the fact that smaller nanoparticles will have more numerous surface active sites and hence more effectively catalyse the conversion of CO2. Increasing Cu loading favours the formation of more methanol over DME. Higher Cu loading increases the number of active sites for conversion of CO2 to methanol, but this increase comes at a cost of reducing acid site accessibility by the additional Cu0 nanoparticles, which reduces the subsequent methanol dehydration. As such, there exists a trade-off between selectivity and activity by increasing loading.
Aside from activity and selectivity, stability is another key metric used to assess the overall catalyst performance. Fig. S7 (ESI†) shows a marginal increase in the intensity of the Cu(111) and Cu(200) XRD peaks, which can be attributed to minor sintering of nanoparticles, which is expected due to the significant water production during the reaction.2 SAPO-34 contains some strong Brønsted acid sites, which can over dehydrate the intermediate methanol to coke, which can block the acid sites.22 Fig. S7 (ESI†) demonstrates that coking has no detrimental impact on the CHA topology of SAPO-34, but does lower the surface area due to coke-induced pore clogging (Table S6, ESI†). DME MTY and selectivity have the most significant impact on the loss of surface area and hence on SAPO-34 deactivation. This is rationalised by the fact that catalysts displaying higher DME MTY and selectivity must have catalysed the dehydration of methanol to a greater extent and, as such, there is more opportunity for coke formation and hence deactivation. Catalyst stability is therefore explicitly linked to activity, with more active catalysts deactivating faster.
The proof of concept model described herein replicates experimental trends satisfactorily (Fig. S12 and Table S7, ESI†), validating its applicability. Improvements in catalyst and material design have often been achieved via laborious and time consuming trial and error approaches.23 In the future, our model could be combined with datasets obtained using high throughput experimentation to provide a multidimensional perspective of the entire catalyst design space. This unique, multidimensional insight can help to uncover critical correlations, which can rationalise catalyst design strategies, resulting in rapid development of highly active and selective catalysts without the need for exhaustive testing.
To conclude, we have shown that precise control over nanoparticle size is possible by tailoring the solvent volume, solvent polarity, or drying temperature of the impregnation method. We have also developed a correlation matrix, as a proof of concept, which demonstrates that catalytic performance can be influenced by different structural factors at the same time, highlighting that, deriving structure–property correlations based on a narrow set of metrics can lead to erroneous insights.
We thank the University of Southampton and Southampton Marine and Maritime Institute for funding. We also thank the UK Catalysis Hub block allocation group for XAS beamtime (SP34632-1 and SP34632-2), Dr Matthew Cooper at the School of Ocean and Earth Science for help with ICP-MS analysis, and Regan Doherty at the University Hospital Southampton for help with TEM imaging.
Data availability
Data for this article, including raw characterisation and catalysis data are available from the University of Southampton repository at https://doi.org/10.5258/SOTON/D3181.Conflicts of interest
There are no conflicts to declare.Notes and references
- International Maritime Organization, 2023 IMO Strategy on Reduction of GHG Emissions from Ships, 2023.
- A. Ghosh, D. Nag, R. Chatterjee, A. Singha, P. S. Dash, B. Choudhury and A. Bhaumik, Catal. Sci. Technol., 2024, 14, 1387–1427 RSC.
- J. Sun, G. Yang, Y. Yoneyama and N. Tsubaki, ACS Catal., 2014, 4, 3346–3356 CrossRef CAS.
- A. Álvarez, A. Bansode, A. Urakawa, A. V. Bavykina, T. A. Wezendonk, M. Makkee, J. Gascon and F. Kapteijn, Chem. Rev., 2017, 117, 9804–9838 CrossRef PubMed.
- M. G. Walerowski, M. E. Potter, E. S. Burke, S. Kyrimis, L. M. Armstrong and R. Raja, Catal. Sci. Technol., 2024, 14, 3853–3863 RSC.
- B. Roldan Cuenya and F. Behafarid, Surf. Sci. Rep., 2015, 70, 135–187 CrossRef CAS.
- B. R. Cuenya, Acc. Chem. Res., 2013, 46, 1682–1691 CrossRef PubMed.
- L. Barberis, A. H. Hakimioun, P. N. Plessow, N. L. Visser, J. A. Stewart, B. D. Vandegehuchte, F. Studt and P. E. de Jongh, Nanoscale, 2022, 14, 13551–13560 RSC.
- A. Karelovic and P. Ruiz, Catal. Sci. Technol., 2015, 5, 869–881 RSC.
- R. Van Den Berg, G. Prieto, G. Korpershoek, L. I. Van Der Waals, A. J. Van Bunningen, S. Lægsgaard-Jørgensen, P. E. De Jongh and K. P. De Jong, Nat. Commun., 2016, 7, 13057 CrossRef CAS PubMed.
- J. Kim, B. B. Sarma, E. Andrés, N. Pfänder, P. Concepción and G. Prieto, ACS Catal., 2019, 9, 10409–10417 CrossRef CAS.
- G. Prieto, J. Zečević, H. Friedrich, K. P. De Jong and P. E. De Jongh, Nat. Mater., 2013, 12, 34–39 CrossRef CAS PubMed.
- D. Mott, J. Galkowski, L. Wang, J. Luo and C. J. Zhong, Langmuir, 2007, 23, 5740–5745 CrossRef CAS PubMed.
- M.-P. Pileni, Nat. Mater., 2003, 2, 145–150 CrossRef CAS PubMed.
- C. Ahoba-Sam, K. V. K. Boodhoo, U. Olsbye and K. J. Jens, Materials, 2018, 11(1), 154 CrossRef PubMed.
- M. A. Ben Aissa, B. Tremblay, A. Andrieux-Ledier, E. Maisonhaute, N. Raouafi and A. Courty, Nanoscale, 2015, 7, 3189–3195 RSC.
- H. Zhang, X. Ren, B. Zhang, A. Jia and Y. Wang, ACS Appl. Mater. Interfaces, 2023, 15, 53515–53525 CrossRef CAS PubMed.
- T. S. Rodrigues, A. G. M. Da Silva and P. H. C. Camargo, J. Mater. Chem. A, 2019, 7, 5857–5874 RSC.
- S. Kyrimis, R. Raja and L. M. Armstrong, Fuel, 2024, 368, 131511 CrossRef CAS.
- P. Munnik, P. E. De Jongh and K. P. De Jong, Chem. Rev., 2015, 115, 6687–6718 CrossRef CAS PubMed.
- A. M. Beale and B. M. Weckhuysen, Phys. Chem. Chem. Phys., 2010, 12, 5562–5574 RSC.
- W. Dai, G. Wu, L. Li, N. Guan and M. Hunger, ACS Catal., 2013, 3, 588–596 CrossRef CAS.
- J. Li, Y. Sun and Z. Zhang, SmartMat, 2023, 4, e1171 CrossRef.
Footnote |
| † Electronic supplementary information (ESI) available. See DOI: https://doi.org/10.1039/d4cc03193h |
| This journal is © The Royal Society of Chemistry 2024 |


