
The effect of lignin molecular weight on the formation and properties of carbon quantum dots†
Xiaoli
Liu‡
a,
Siyu
Zhao‡
a,
Xinrui
Chen
a,
Xing
Han
a,
Junhua
Zhang
 b,
Min
Wu
a,
Xueping
Song
*a and
Zhanying
Zhang
c
b,
Min
Wu
a,
Xueping
Song
*a and
Zhanying
Zhang
c
aGuangxi Key Laboratory of Clean Pulp & Papermaking and Pollution Control, College of Light Industry and Food Engineering, Guangxi University, Nanning 530004, PR China. E-mail: sx_ping@gxu.edu.cn
bJiangsu Co-Innovation Center of Efficient Processing and Utilization of Forest Resources, College of Chemical Engineering, Nanjing Forestry University, Nanjing 210037, China
cSchool of Mechanical, Medical and Process Engineering, Centre for Agriculture and the Bioeconomy, Queensland University of Technology, Brisbane, Queensland 4000, Australia
First published on 13th January 2024
Abstract
It is generally believed that the formation of lignin-based carbon quantum dots (L-CQDs) includes lignin depolymerization and repolymerization. However, the detailed mechanism has not been well understood. In this study, the effect of lignin molecular weight on the properties of L-CQDs is studied to elucidate the formation mechanism of L-CQDs. Firstly, alkaline lignin is sequentially fractionated into five lignin samples with a molecular weight range of 7100–2000 using a continuous organic solvent precipitation method. Then, the five lignin fractions are used to prepare five L-CQDs numbered from 1 to 5, corresponding to the lignin fractions from high to low, respectively. L-CQDs-3 that was prepared from the lignin fraction with an intermediate molecular weight of 5042 g mol−1 has a 1.86-fold increase in fluorescence intensity compared to the L-CQDs-0 prepared from pristine alkaline lignin. It is found that this lignin fraction with a molecular weight of 5042 g mol−1 can depolymerize into a large number of vanillin and benzaldehyde (2,4-dihydroxy-6-methyl) units. These low molecular weight units can easily form highly conjugated carbon core structures, thus improving the fluorescence performance of L-CQDs-3. In addition, the present study confirms the excellent imaging ability of L-CQDs-3 in the L02, HepG2 and Escherichia coli cells. This study not only supplements the existing L-CQD formation mechanism, but also provides a simple method for the preparation of L-CQDs with high fluorescence performance.
Introduction
Carbon quantum dots (CQDs) have unique photoluminescence properties, good biocompatibility and excellent photostability. Due to the abundant active sites on their surface, their physicochemical and photoluminescence properties are easy to be adjusted; CQDs have been widely used in fields such as photovoltaic energy devices,1,2 information encryption, anticounterfeiting,3,4 and sensor detection,5 and especially have great potential for application in the bio-imaging and medical fields.6–8 Generally, the formation pathway of CQDs from small organic molecules, such as citric acid, o-phenylenediamine and m-phenylenediamine, mainly involves dehydration, polymerization, aromatization, and condensation.9 These small organic molecules are structurally simple and can easily undergo the above reactions. CQDs can also be synthesized from large organic molecules, such as lignin. The use of lignin as a precursor for producing CQDs is attractive because lignin is an abundant low-cost biopolymer and has a high carbon content. Moreover, lignin is rich in aromatic rings and reactive sites, such as aliphatic and aromatic hydroxyl groups and carboxyl groups, which makes lignin prone to polycondensation and carbonization for the formation of CQDs.10 However, it is challenging to control the lignin properties for the synthesis of CQDs that have high fluorescence intensity due to the heterogenicity and complexity of the lignin structure.A hydrothermal method in the temperature range of 120–280 °C is often used for the synthesis of biomass-based CQDs.11–13 It is generally believed that the hydrothermal process of using lignin as a carbon source to synthesize lignin-based CQDs (L-CQDs) mainly involves two reactions: depolymerization of lignin macromolecules and repolymerization of small molecules.14–17 In the hydrothermal reaction, the hydrogen ions dissociated from water first attack the ether bonds of lignin,18 causing them to break and form a large number of lignin fragments. The hydrophobic aromatic structures and hydrophilic hydroxyl groups in the lignin fragments can condense to form primary clusters.15 With a prolonged reaction time, these primary clusters transform into primary aromatic clusters through dehydration, polymerization, and condensation reactions. Finally, under high temperature and long reaction time conditions, these primary aromatic clusters undergo rapid π–π bond accumulation, a sp2 hybridization increase, and aromatic polymerization to form L-CQDs.17 Through the formation mechanism described above, it can be found that the depolymerization of lignin macromolecules is a necessary factor for the formation of L-CQDs, and the degree of depolymerization is mainly closely related to the molecular weight of lignin. For lignin, which is a macromolecular compound with the molecular weight spanning from several hundreds to several hundred thousands, the molecular weight of lignin has an extremely great influence on the properties of the subsequent reaction products. Some researchers pre-treated lignin using catalysts such as strong and weak acids to obtain low molecular weight lignin fragments containing heteroatoms, and then utilized these lignin fragments to hydrothermally prepare L-CQDs with higher fluorescence intensities compared to L-CQDs prepared using untreated lignin.19,20 In our previous study, an ethanol supercritical/precious metal catalyst cleavage method was used to reduce the molecular weight of lignin, and the obtained low molecular weight lignin was utilized to prepare blue-green L-CQDs by a solvothermal method without the use of doping agents. The fluorescence intensity was significantly improved compared with that of the L-CQDs prepared by the conventional one-pot hydrothermal method.21 The above research studies demonstrate that the molecular weight of lignin has an important effect on the properties of L-CQDs. Although the use of lignin for the preparation of L-CQDs has been studied for nearly ten years, there is still no study that systematically elucidates the specific relationship between the molecular weight of lignin and the properties of L-CQDs.
Understanding the effect of lignin molecular weight and properties on the formation and properties of L-CQDs is crucial for the efficient synthesis and property regulation of L-CQDs. However, determination of the relationship between lignin molecular weight and L-CQD properties is challenging with the use of lignin fragments resulting from depolymerization or cracking under different reaction conditions. This is because some heteroatoms or other groups may be integrated into the lignin fragments, and these lignin fragments also undergo repolymerization during depolymerization and cracking,22,23 which will further increase the complexity of lignin fragments and introduce more factors that affect the properties of L-CQDs in addition to the lignin molecular weight. Moreover, the use of lignin fragments resulting from lignin depolymerization or cracking for producing L-CQDs with high fluorescence performance is also costly because of the harsh conditions required. Therefore, a simple and economically feasible approach that can fractionate lignin will not only enable the investigation of the effect of lignin molecular weight on the formation of L-CQDs, but also lead to the most cost-effective production of L-CQDs using lignin fractions with the preferred molecular weight range.
In this study, alkaline lignin was used as a raw material for generation of lignin fractions with different molecular weights using a solvent-based cost-effective sequential fractionation approach. For the first time, five lignin fractions that are recovered by this fractionation approach and have different molecular weights are used to produce five L-CQDs using a one-step hydrothermal carbonization approach. The use of these five lignin fractions minimizes the effects from other factors other than lignin molecular weight compared to the use of lignin fragments derived from lignin depolymerization or cracking. The effect of lignin molecular weight on the properties such as the topological, optical, and chemical properties of the resulting L-CQDs was investigated to understand the formation mechanism of L-CQDs. The similarities and differences in the formation of L-CQDs prepared from these lignin fractions are elucidated. The present study not only leads to the fundamental understanding of the formation of L-CQDs, but also provides a practical solution for the synthesis of L-CQDs with high fluorescence performance from lignin for bio-imaging application.
Results and discussion
Physicochemical properties of fractionated lignin
Five lignin samples with different molecular weights were obtained by solvent separation of AL, and the yields and molecular weight distributions of the resulting samples are shown in Table S1.† The weight average molecular weight (Mw) of AL was 3864 g mol−1 and the polydispersity index (PDI) was 6.9, indicating a wide molecular weight distribution. Fractionation yielded five lignin samples with decreasing molecular weights, named F1 (Mw = 7154 g mol−1), F2 (Mw = 5818 g mol−1), F3 (Mw = 5042 g mol−1), F4 (Mw = 3448 g mol−1), and F5 (Mw = 2096 g mol−1). Their PDIs were 2.8, 2.2, 2.1, 1.7, and 2.1 respectively, implying that the lignin samples obtained by fractionation were uniform, which suggests that the solvent fractionation method can be efficiently used for the separation of lignin of different molecular weights. The color difference of the lignin samples with different molecular weights is very obvious; the color of F1–F5 became lighter gradually (Fig. S1†).FTIR analysis (Fig. 1b) reveals that all lignin samples have some groups, including -OH at 3458 cm−1, C–H at 2933 cm−1, methoxy at 2850 cm−1, C![[double bond, length as m-dash]](https://www.rsc.org/images/entities/char_e001.gif) O at 1730 cm−1,24 aromatic rings at 1599 cm−1, 1512 cm−1 and 1419 cm−1, methoxy in guaiacol at 1271 cm−1, aromatic C–O at 1216 cm−1, and C–H in the aromatic nucleus at 1121 cm−1, 854 cm−1 and 812 cm−1.25 No additional absorption peaks were observed in the FTIR spectra of F1–F5 samples compared to those with AL, and these peaks at the same position are very similar in intensity, indicating that the fractionation method used in this study does not modify the chemical structure of the lignin fractions.
O at 1730 cm−1,24 aromatic rings at 1599 cm−1, 1512 cm−1 and 1419 cm−1, methoxy in guaiacol at 1271 cm−1, aromatic C–O at 1216 cm−1, and C–H in the aromatic nucleus at 1121 cm−1, 854 cm−1 and 812 cm−1.25 No additional absorption peaks were observed in the FTIR spectra of F1–F5 samples compared to those with AL, and these peaks at the same position are very similar in intensity, indicating that the fractionation method used in this study does not modify the chemical structure of the lignin fractions.
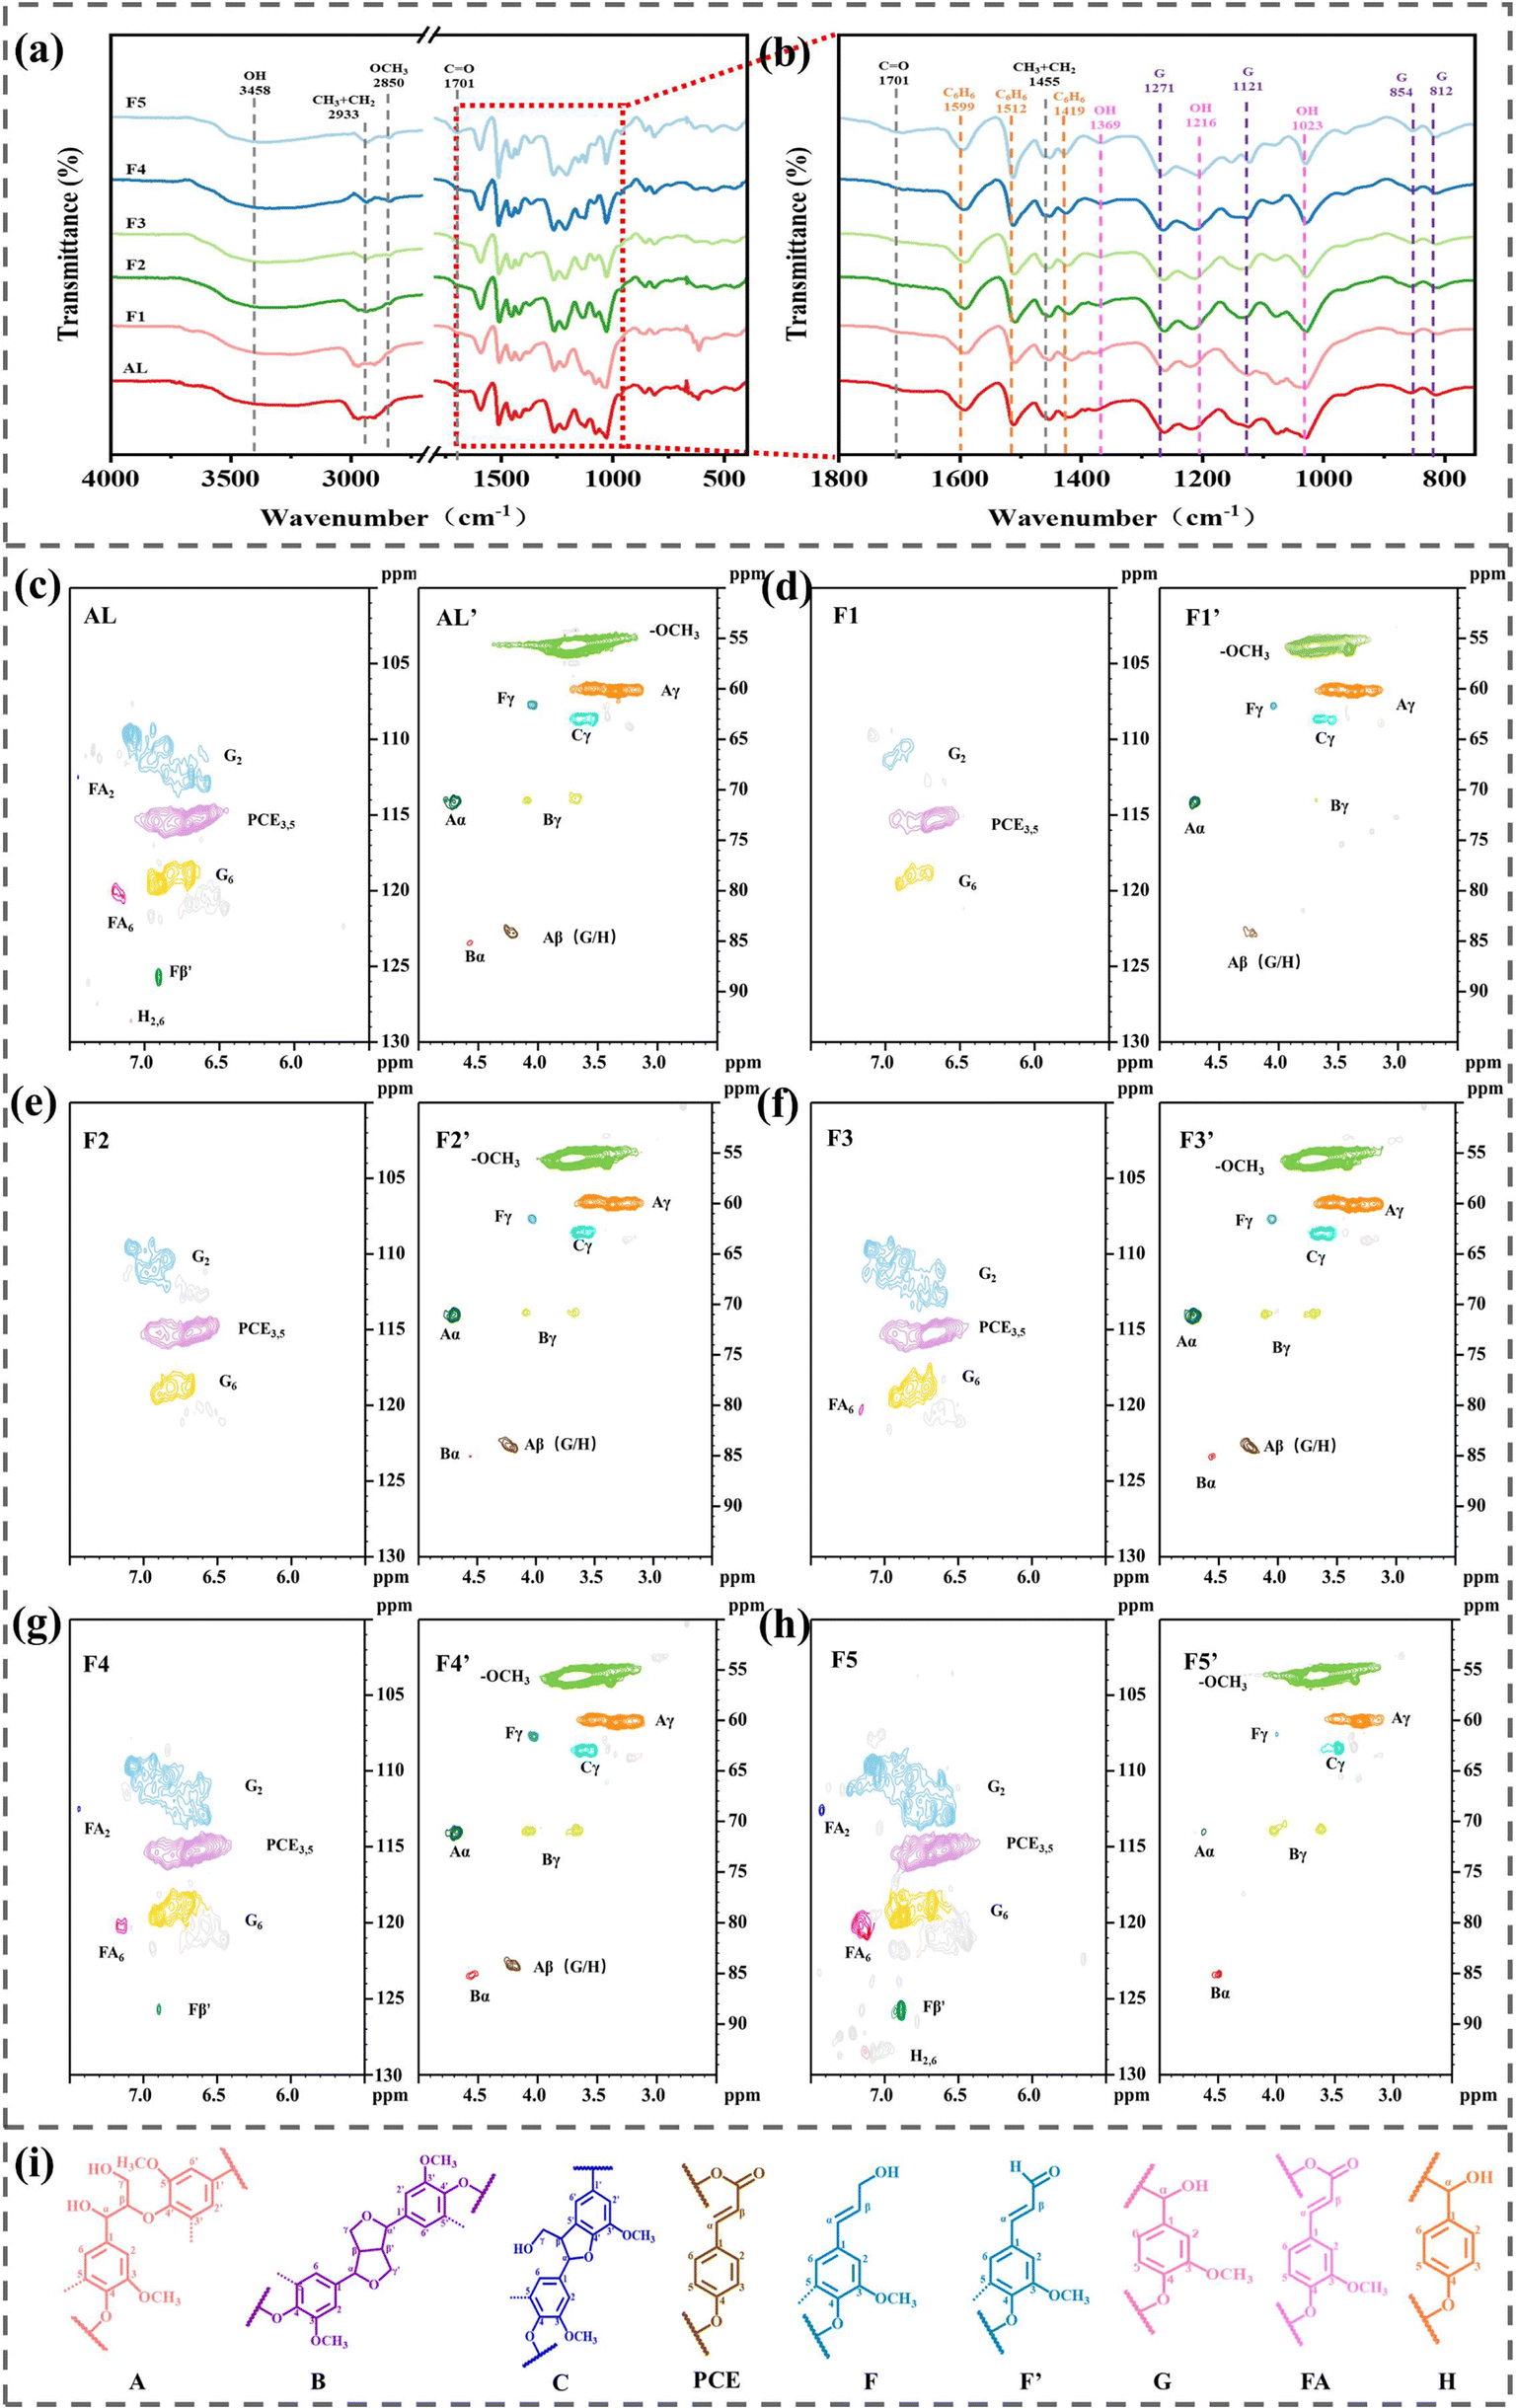 | ||
| Fig. 1 FTIR spectra of AL and F1-F5 (a); localized enlargement of the FTIR spectra (b). 2D-HSQC NMR spectra of AL and F1–F5 samples (c–h). Main substructures identified in lignin samples (i), A: β-O-4′ substructures; B: β–β′ resinol substructures; C: phenylcoumaran substructures; PCE: p-coumarate; F: p-hydroxycinnamyl alcohol end groups; F′: terminal group structure of hydroxycinnamaldehyde; G: guaiacyl units; FA: ferulate; H: p-hydroxyphenyl units. | ||
The various hydroxyl groups of lignin are observed using 31P NMR, mainly including five kinds of hydroxyl groups: aliphatic hydroxyl group, C5-substituted phenolic hydroxyl group, guaiacol hydroxyl group, p-hydroxyphenyl phenolic hydroxyl group, and carboxylic acid hydroxyl group.26 The content of hydroxyl groups can be calculated by peak area integration, and the results are shown in Table S2.† From F1 to F5, the content of aliphatic hydroxyl groups gradually decreases from 2.07 mmol g−1 to 1.14 mmol g−1, while the content of phenolic hydroxyl groups gradually increases from 1.42 mmol g−1 to 4.16 mmol g−1, and F5 contains a large number of phenolic hydroxyl reactive groups.
The chemical compositions as well as the bonding modes of the lignin samples are further elucidated using 2D-HSQC NMR, and the 2D-HSQC NMR signals of the side-chain region and aromatic region of the AL and F1–F5 samples are shown in Fig. 1(c)–(h). Information about the connecting bonds and substructures in lignin can be obtained by assigning signals in the 2D-HSQC NMR spectra of AL and F1–F5, the attribution of all the signals is shown in Table S3,† and the major substructures are shown in Fig. 1(i). The signals at δC/δH (50–95/2.5–5 ppm, 59.9/3.55 ppm, 71.16/4.70 ppm, and 84.2/4.20 ppm) in the aliphatic region are attributed to the β-O-4′ substructures (A) of Cγ–Hγ, Cα–Hα, and Cβ–Hβ.27,28 Compared with the other samples, the presence of a weak Aα signal and the absence of an Aβ (G/H) signal in F5 indicate that the β-O-4′ substructure (A) content in F5 is very low, which further confirms that the phenolic hydroxyl group in F5 mainly exists in the free state rather than in the condensed state, which is in agreement with the phenolic hydroxyl group-rich result obtained from 31P NMR for F5. In the aromatic region δC/δH (100–130/5.5–7.5 ppm), all five lignin samples are consistent with AL with guaiacyl units (G2, G6) and p-coumaric acid structures (PCE3, 5). The C2–H2 signal (δC/δH 112.46/7.41 ppm) and C6–H6 signal (δC/δH 120.2/7.15 ppm) of ferulic acid ester (FA) appear only in AL, F4, and F5; the C2,6–H2,6 signal (δC/δH 128.48/7.13 ppm) of p-hydroxyphenyl (H2,6) appears only in AL and F5, suggesting that FA and H2,6 are only retained in the small molecular weight lignins.
XPS analysis reveals (Fig. 2) that the two strong peaks located at 284.7 and 533.5 eV belong to C 1s and O 1s, respectively, suggesting that all lignin samples share the same elemental composition, which is mainly composed of C and O. The high-resolution spectra of C 1s of the six lignin samples show three different peaks, in which the peak at 284.65 eV can be attributed to CC/C–C in the guaiac-based structure; the peak at 286.20 eV is attributed to C–O; the peak at 288.68 eV is attributed to CO in the carboxylate group and ester.29 Compared to all samples, the least amount of CO was found in F5 and the highest amount of CC/C–C in the guaiacyl structure was found in F3. The high-resolution spectra of O 1s of the six lignin samples also show three different peaks, where the peak at 531.94 eV can be attributed to CO in the carboxyl group and ester; the peak at 532.83 eV can be attributed to C–O in the phenolic hydroxyl group and ether bonding; the peak at 533.57 eV can be attributed to C–O in the ether-bonding linkage between the guaiac-based structure.30 The XPS results indicate that there is no difference in the types of surface functional groups of these fractionated lignin samples, but there are some differences in their contents. The difference in functional group content is expected to have a significant effect on the properties of the L-CQDs formed.
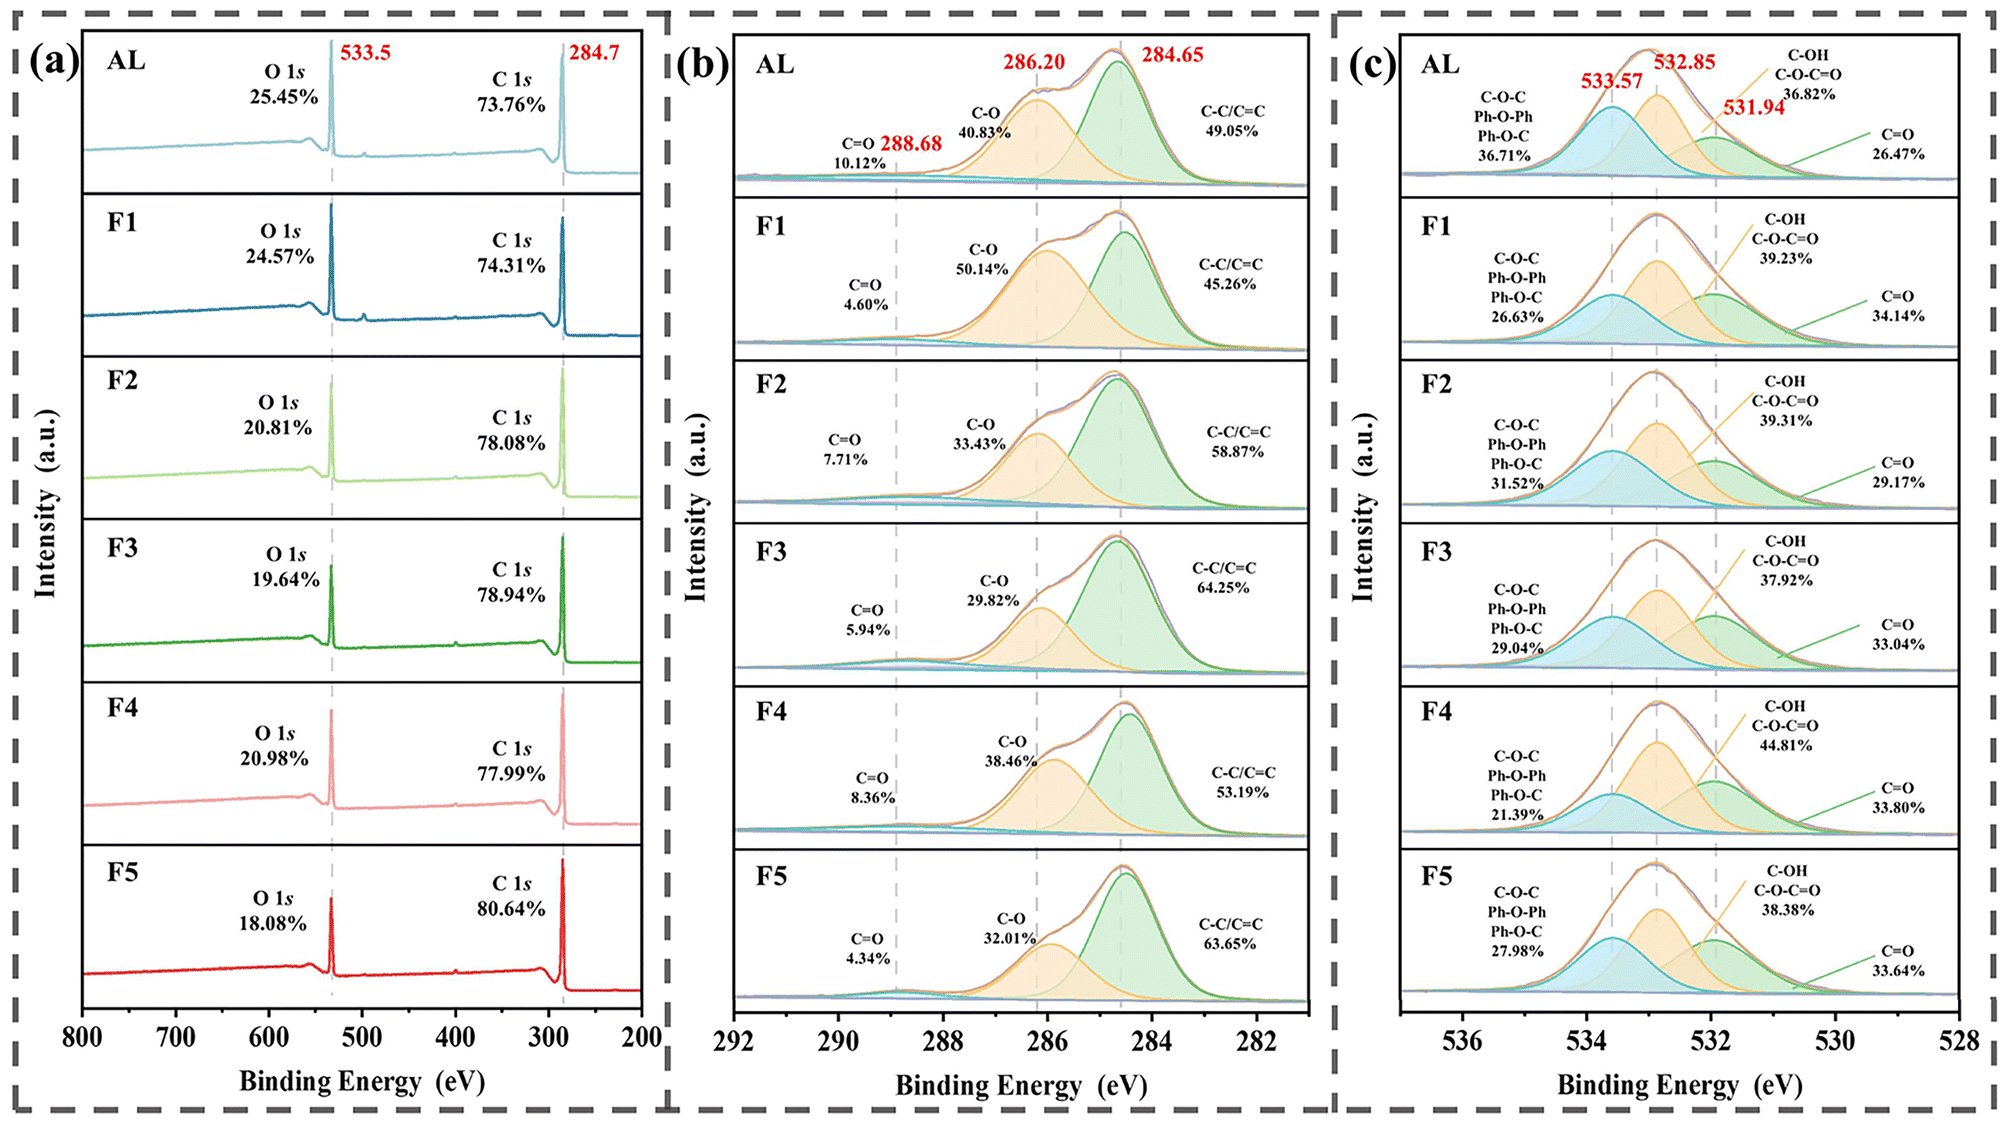 | ||
| Fig. 2 XPS full-spectral scan of lignin samples (a). C 1s high-resolution XPS fitting spectra (b) and O 1s high-resolution XPS fitting spectra (c) generated for AL, F1, F2, F3, F4, and F5. | ||
In summary, lignin of different molecular weights was successfully separated by the continuous organic solvent precipitation method. The molecular weights of the lignin samples obtained by grading are significantly different, but the bonding patterns and functional group types are similar. This suggests that solvent fractionation can be interpreted as a physical screening method for separating lignin samples with different molecular weights without affecting the basic structure of lignin.
Effect of lignin molecular weight on the properties of L-CQDs
C bond in L-CQDs.20,31 L-CQDs-3 has relatively strong UV-visible absorption in this range, and it can be inferred that it has an abundant conjugated structure. At a concentration of 1 mg mL−1, all L-CQDs except for L-CQDs-5 show light yellow colors under sunlight. Under the irradiation of 365 nm UV light, all L-CQDs emit bright blue or blue-green fluorescence, and the brightness tends to increase and then decrease. Among them, the brightness of L-CQDs-3 is the highest. Compared with that of L-CQDs prepared from AL, the fluorescence intensity of L-CQDs can be effectively improved by using lignin obtained by fractionation as the precursor. The above phenomena indicate that using lignin with different molecular weights as a carbon source has a significant effect on the fluorescence characteristics of the formed L-CQDs. Considering the concentration-dependent fluorescence intensity of the L-CQD solutions,32 in order to clarify the optimal concentration of the six L-CQDs, L-CQD solutions with different concentration gradients were prepared; the main results are shown in Fig. S2.† The optimal concentration of the L-CQDs-1–4 is 1 mg mL−1, while the optimal concentration of L-CQDs-5 is 0.25 mg mL−1.
Fig. 3d–o show the corresponding 2D fluorescence spectra and 3D fluorescence spectra of each L-CQD at the optimal concentration. The optimal excitation wavelengths of all L-CQDs are in the range of 400–420 nm, and the corresponding emission wavelengths are in the range of 500–510 nm. The fluorescence intensities of L-CQDs-0–5 are 52![[thin space (1/6-em)]](https://www.rsc.org/images/entities/char_2009.gif) 740, 59495, 83547, 97850, 83015 and 41146, respectively, and the fluorescence intensities show a tendency to increase and then decrease, among which the fluorescence intensity of L-CQDs-3 is the highest, which is in line with the result observed under UV irradiation at 365 nm. Its quantum yield also exhibits the same trend as the fluorescence intensity (Table S4†). From the 2D fluorescence spectra, it can be found that L-CQDs have “excitation wavelength dependence” like traditional CQDs. As the excitation wavelength increases, the emission wavelength of L-CQDs is red-shifted. This may be mainly due to the relaxation of the polar groups (hydroxyl and carboxyl groups) on the surface of L-CQDs in polar solvents such as water and ethanol, resulting in the “giant red-edge effect”;32 it may also be due to the inhomogeneity of the size of the L-CQDs, which makes different particles having different responses to the excitation light, with a gradual increase in the wavelength.33 Three-dimensional fluorescence spectroscopy shows that the emission centers of all L-CQDs are near 500 nm, which is consistent with the results of 2D fluorescence spectroscopy analysis. The optimal excitation wavelengths and emission centers of the six L-CQDs are similar, indicating that the molecular weight of lignin carbon precursors has little effect on the optimal excitation wavelengths and emission centers of L-CQDs. The hydrothermal method provides high-temperature and high-pressure reaction conditions, similar to the chemical reaction environment of the crusting reaction, which promotes the formation and growth of aromatic compounds.17 Based on the similar absorption characteristics of the UV spectra of L-CQDs and the similar optimal excitation wavelengths and emission wavelengths, it can be reasonably assumed that the L-CQDs formed from lignin with different molecular weights using the hydrothermal method have similar core–shell structures.34 The difference in the fluorescence intensity of L-CQDs is due to the different content of conjugated structures in their carbon cores.
740, 59495, 83547, 97850, 83015 and 41146, respectively, and the fluorescence intensities show a tendency to increase and then decrease, among which the fluorescence intensity of L-CQDs-3 is the highest, which is in line with the result observed under UV irradiation at 365 nm. Its quantum yield also exhibits the same trend as the fluorescence intensity (Table S4†). From the 2D fluorescence spectra, it can be found that L-CQDs have “excitation wavelength dependence” like traditional CQDs. As the excitation wavelength increases, the emission wavelength of L-CQDs is red-shifted. This may be mainly due to the relaxation of the polar groups (hydroxyl and carboxyl groups) on the surface of L-CQDs in polar solvents such as water and ethanol, resulting in the “giant red-edge effect”;32 it may also be due to the inhomogeneity of the size of the L-CQDs, which makes different particles having different responses to the excitation light, with a gradual increase in the wavelength.33 Three-dimensional fluorescence spectroscopy shows that the emission centers of all L-CQDs are near 500 nm, which is consistent with the results of 2D fluorescence spectroscopy analysis. The optimal excitation wavelengths and emission centers of the six L-CQDs are similar, indicating that the molecular weight of lignin carbon precursors has little effect on the optimal excitation wavelengths and emission centers of L-CQDs. The hydrothermal method provides high-temperature and high-pressure reaction conditions, similar to the chemical reaction environment of the crusting reaction, which promotes the formation and growth of aromatic compounds.17 Based on the similar absorption characteristics of the UV spectra of L-CQDs and the similar optimal excitation wavelengths and emission wavelengths, it can be reasonably assumed that the L-CQDs formed from lignin with different molecular weights using the hydrothermal method have similar core–shell structures.34 The difference in the fluorescence intensity of L-CQDs is due to the different content of conjugated structures in their carbon cores.
 | ||
| Fig. 3 UV-vis spectra of L-CQDs (a). Photographs of L-CQDs under sunlight (b) and 365 nm UV-light (c). PL spectra of L-CQDs-0 (d), L-CQDs-1 (e), L-CQDs-2 (f), L-CQDs-3 (j), L-CQDs-4 (k), and L-CQDs-5 (l). Three-dimensional fluorescence spectra of L-CQDs-0 (g), L-CQDs-1 (h), L-CQDs-2 (i), L-CQDs-3 (m), L-CQDs-4 (n), and L-CQDs-5 (o). | ||
Physicochemical characterization of L-CQDs
The solids of the six L-CQDs obtained after freeze-drying are in the form of brown powder, and their color differences are shown in Fig. 4a It is confirmed by XRD patterns (Fig. 4b) that all L-CQDs exhibit broad peaks at 23.66°, corresponding to the (002) crystallographic diffraction of the standard graphite structure, indicating that the carbon core of the L-CQDs has an amorphous graphite structure.35 | ||
| Fig. 4 Photograph of L-CQD samples (a). XRD spectra of L-CQDs-0–5 (b). TEM images of L-CQDs-0 (c), L-CQDs-1 (d), L-CQDs-2 (e), L-CQDs-3 (i), L-CQDs-4 (j), and L-CQDs-5 (k). Particle size distributions of L-CQDs-0 (f), L-CQDs-1 (g), L-CQDs-2 (h), L-CQDs-3 (l), L-CQDs-4 (m), and L-CQDs-5 (n). | ||
The microstructures of L-CQDs were observed using TEM, and the results are shown in Fig. 4. From the TEM results, it can be seen that all L-CQDs are almost uniformly monodisperse with a spherical structure, which may be related to the fact that L-CQDs have both hydrophilic (hydroxyl, carboxyl, etc.) and hydrophobic (alkyl, phenyl, etc.) groups.36 The insets in Fig. 4c–e and i–k show the high-resolution TEM (HR-TEM) results of the six L-CQDs, and it can be found that all L-CQDs have the same lattice stripe spacing of 0.21 nm, which is similar to that of the single-crystal graphitic carbon lattice structure, suggesting that there is a highly crystalline graphitic structure in the six L-CQDs.11 By randomly measuring 100 particles of each L-CQD sample using the Nano Measurer 1.2 software, a narrow range of particle size distributions from 1.44 to 3.73 nm for all L-CQDs can be seen in the statistical histograms (Fig. 4f–h and l–n). The average particle sizes of L-CQDs-0–5 are 2.47 nm, 2.20 nm, 2.58 nm, 2.60 nm, 2.57 nm, and 2.44 nm, respectively, with no major differences. The above results verify that the six L-CQDs have similar carbon core structures, which is consistent with the conclusions obtained from the optical properties of L-CQDs.
The surface functional groups, chemical compositions and elemental states of the CQDs were investigated using FTIR and XPS. As shown in Fig. 5a, the FTIR spectra of all L-CQDs are similar, indicating that they have the same functional groups, such as –OH at 3412 cm−1, C–H stretching of methyl or methylene groups at 2954 cm−1,37 CO at 1707 cm−1, CC at 1595 cm−1, aromatic C–O at 1392 cm−1, and C–H in the aromatic ring at 1119 cm−1.18 It can be found that the C–H signals of L-CQDs are weaker compared to the C–H signals in the corresponding lignin samples, which is due to the demethylation of lignin during the hydrothermal process.17 The intensity of the absorption peaks of L-CQDs-1–5 at 1595 cm−1 shows a trend of increasing and then decreasing, which is consistent with the fluorescence data (Fig. 3), suggesting that the CC group has a direct effect on the fluorescence performance of L-CQDs. Based on the above analysis, the FTIR spectra of the L-CQDs show many similar signals to those of the lignin carbon source (Fig. 1b), indicating that the L-CQDs retain the aromatic structure of the lignin samples.
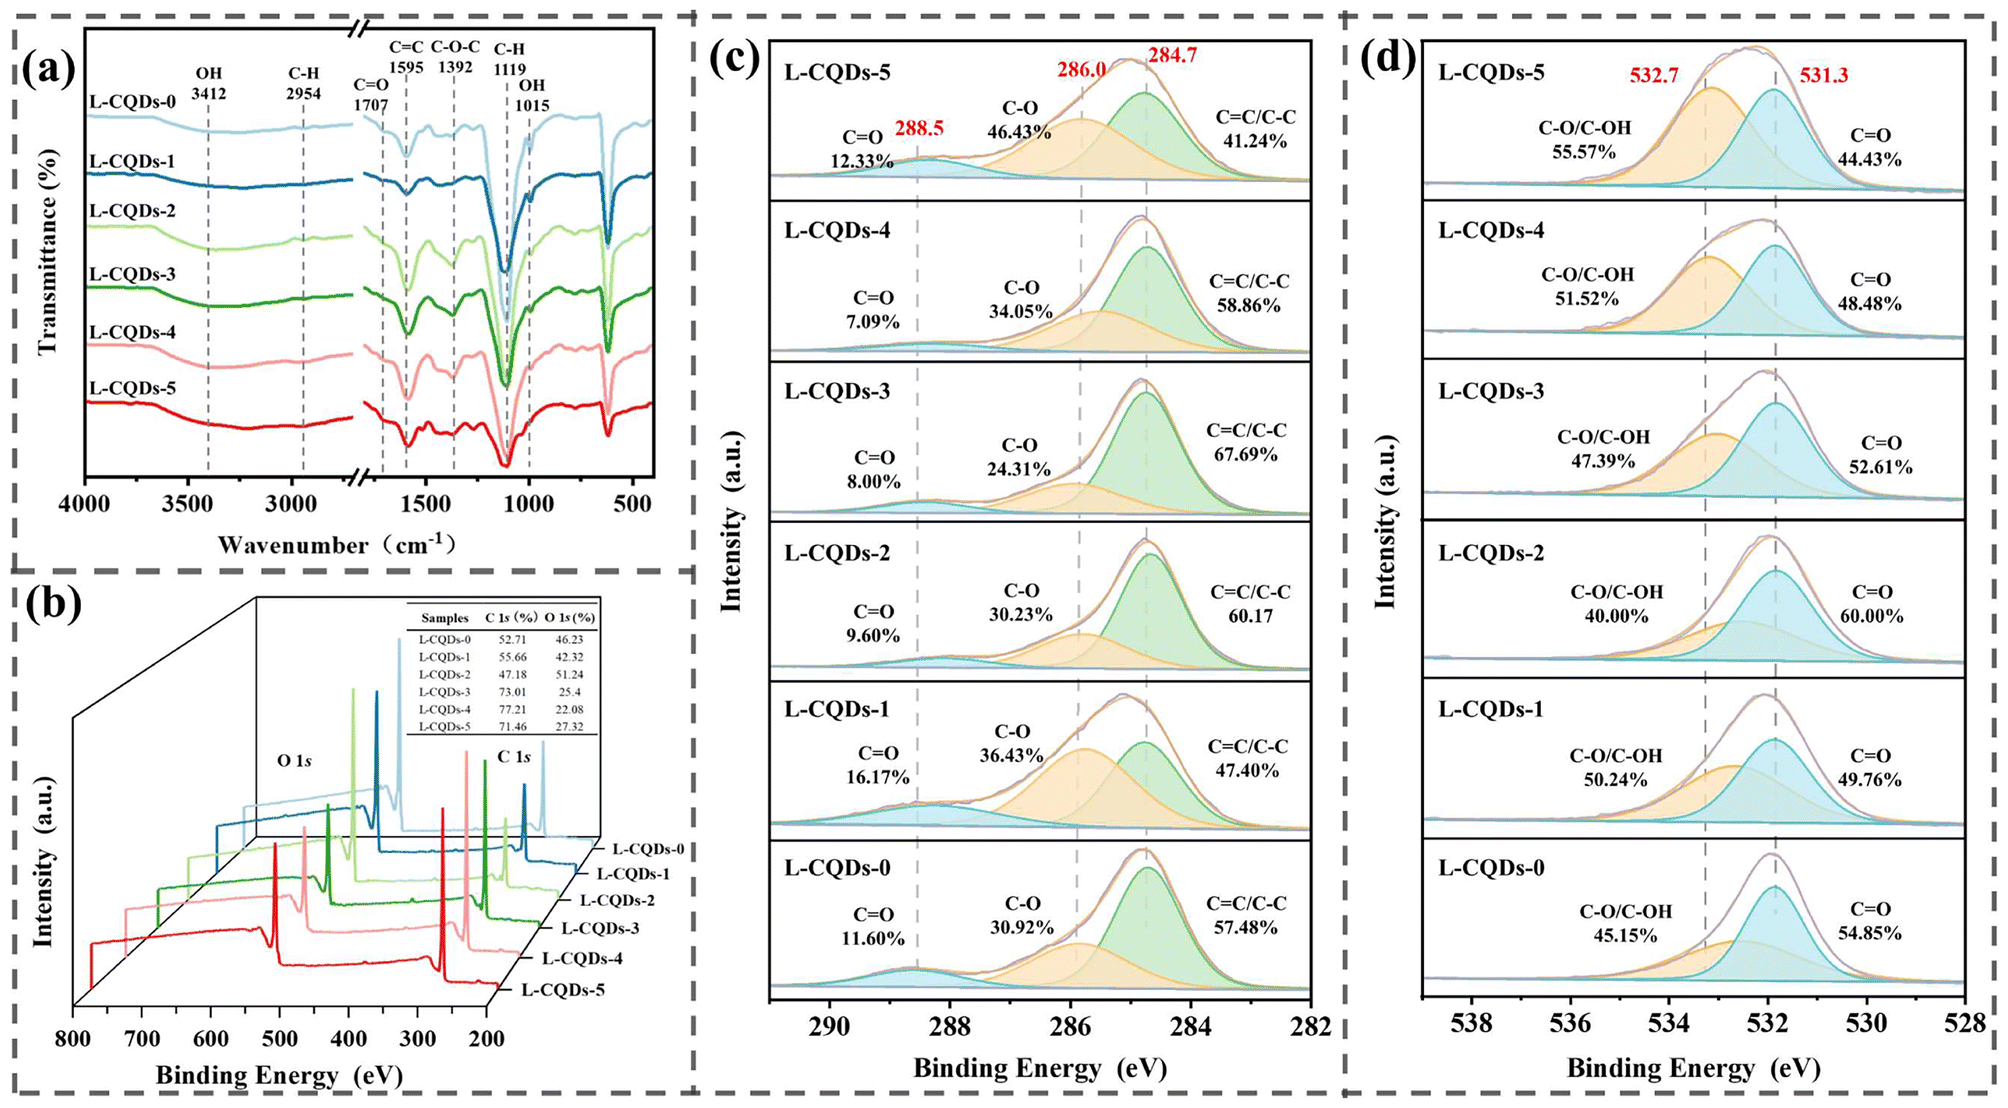 | ||
| Fig. 5 FTIR spectra (a) and XPS full-spectral scan (b) of L-CQDs. C 1s high-resolution XPS fitting spectra (c) and O 1s high-resolution XPS fitting spectra (d) generated for L-CQDs-0, L-CQDs-1, L-CQDs-2, L-CQDs-3, L-CQDs-4, and L-CQDs-5. | ||
As shown in Fig. 5b, the two strong peaks located at 284.77 and 533.5 eV in the XPS spectra of L-CQDs belong to C 1s and O 1s, respectively, suggesting that all of the obtained L-CQDs have the same elemental composition, which consists of C and O mainly. The high-resolution C 1s spectra of the six L-CQDs show three different peaks (Fig. 5c), of which the peak located at 284.77 eV can be attributed to the CC/C–C in graphitic carbon, the peak located at 285.76 eV is attributed to C–O, and the peak at 288.25 eV is attributed to the CO in carboxylates and esters. The graphitic carbon content of L-CQDs-3 is the highest among the six L-CQDs, indicating that it is more graphitized and possesses more conjugated π domains; therefore, it has the best fluorescence performance compared with others CQDs.38,39 As shown in Fig. 5d, the high-resolution spectra of O 1s can be deconvoluted into two peaks at 532.55 eV and 531.87 eV, where the peak at 532.55 eV can be attributed to C–O in carboxyl/ether groups, while the peak located at 531.87 eV can be attributed to CO in carbonyl/alcohols.40 Combining the results of high-resolution spectroscopy of C 1s and O 1s, the L-CQDs consist of various hydrophobic (alkyl, phenyl, etc.) and hydrophilic groups (aldehyde, carbonyl, hydroxyl, carboxyl). The results of the XPS analysis are in agreement with the results of FTIR.
In summary, the six L-CQDs have similar structures and compositions, and the most important reason for the variations in their fluorescence intensities is the difference in conjugated structures’ content. In addition, the high fluorescence performance of L-CQDs can be successfully obtained without doping reagents by pre-tuning the lignin into suitable molecular weight as the carbon source.
Speculation on the formation mechanism of L-CQDs from lignins with different molecular weights
Generally, the formation of L-CQDs mainly consists of two parts: the depolymerization of lignin macromolecules into small molecules, and the re-polymerization of small molecules into highly graphitized CQDs through aromatization reactions. In addition, based on our previous study,21,41 we speculate that under the same hydrothermal conditions, the degree of depolymerization and polymerization of lignins with different molecular weights may differ greatly during the preparation of L-CQDs, leading to the differences in the properties of L-CQDs. L-CQDs have good water solubility and are present in hydrothermal liquid products based on above results and previous research.35,42 In order to verify the formation mechanism of L-CQDs, the hydrothermal liquids of F1, F3, and F5 at different time intervals (2, 4, 6, 8, 10, and 12 h) were examined by GC-MS.Lignin is rich in ether bond linkages (β-O-4, α-O-4, 4-O-5), and its depolymerization process is mainly the breaking of these ether bonds.43–45 Table S5† shows the composition of low molecular weight compounds in fluids after the hydrothermal reaction of lignin. Fig. S3, S4, and S5† show the total ion current (TIC) spectra of the liquid products of the F1, F3, and F5 samples at different hydrothermal times detected by GC-MS. The GC-MS results show that the vanillin, 2,4′-dihydroxy-3′-methoxyacetophenone, benzenepropanol, 4-hydroxy-3-methoxy, and other phenolic monomers with the G-type structure are the main types of products in the hydrothermal liquids. There is no significant change in the type of products in the hydrothermal fluids of F1, F5 and F3 with different reaction times. The products in the hydrothermal liquids are mainly generated by the breaking of lignin ether bonds (β-O-4, α-O-4, 4-O-5) during the hydrothermal process, and different molecular weight lignins have a similar bonding mode based on the 2D-HSQC NMR results of F1, F5 and F3 lignin samples, thus obtaining similar hydrothermal products. But their relative contents are quite different, which is precisely due to the difference of depolymerization and polymerization caused by different molecular weight lignins under the same hydrothermal conditions.
The XPS results (Fig. 2 and 5) indicate that the C–O content of the high molecular weight lignin sample (F1, Mw = 7154 g mol−1) is 50.14%, while the C–O content of L-CQDs-1 derived from F1 decreases to 36.43%. This is due to the high content of ether bonds in the high molecular weight lignin. During the hydrothermal process, the hydrogen ions ionized from water act on the ether bonds of lignin, causing them to break and form C–H and C–OH structures. The broken lignin molecules then undergo hydroxyl condensation to form L-CQDs. The small amount of remaining ether bonds in L-CQDs mainly inherit from the lignin molecules that did not break. As a result, the C–O content in L-CQDs decreases compared to that in lignin.46 From the XPS results (Fig. 5), it is also found that in L-CQDs the content of CC/C–C located at around 284.77 eV corresponding to graphitic carbon is only 37.40%, which indicates that the graphitization degree is not high in L-CQDs-1.47 The reason is that during the preparation of L-CQDs-1, the ability of lignin with large molecular weight to depolymerize into small molecules is limited under the same hydrothermal conditions, so only a small number of small molecules, incompletely cleaved dimers, trimers or large molecules participate in the repolymerization reaction. From the TIC spectra of F1 (Fig. S3†), it can be also seen that the signals of low molecular weight compounds in the hydrothermal liquid products of F1 are weak overall, indicating that few small molecule products were produced during the hydrothermal process of F1. Therefore, the structural conjugation of the generated L-CQDs-1 is low, resulting in poor fluorescence properties.
There are relatively few ether bond connections in small molecular weight lignin (F5, Mw = 2096 g mol−1) under the same mass of lignin. The TIC spectrum of F5 (Fig. S4†) indicates that the hydrothermal liquid of F5 contains relatively high levels of benzenepropanol and 4-hydroxy-3-methoxy. However, it is difficult to form a highly conjugated carbon core in the polymerization process due to the existence of long branched chains in benzenepropanol and 4-hydroxy-3-methoxy. This is also illustrated by the XPS results (Fig. 5), which shows that the graphitic carbon in F5 has the lowest CC/C–C content of 41.24%. Therefore, we think that under the same hydrothermal conditions, lignin with a low molecular weight can be easily depolymerized to obtain small molecules with long branched chains, resulting in a lower proportion of benzene ring structures participating in the polymerization reaction to form L-CQDs-5, and fewer conjugated structures are generated, which leads to poor fluorescence properties of L-CQDs-5.
By observing the TIC spectra (Fig. S5†) of lignin (F3, Mw = 5042 g mol−1) with an appropriate molecular weight, the F3 hydrothermal liquid contains a large proportion of vanillin and benzaldehyde, 2,4-dihydroxy-6-methyl. Their signal intensity tends to increase and then decrease with the extension of reaction time. Because vanillin contains a phenolic hydroxyl group and an aldehyde group in its structure, benzaldehyde, 2,4-dihydroxy-6-methyl- has two phenolic hydroxyl groups and an aldehyde group in its structure, and both phenolic hydroxyl and aldehyde groups are susceptible to dehydration nucleation reactions,48 the formation of highly conjugated carbon cores is easy. The XPS results (Fig. 5) also confirm that the graphitic carbon content of L-CQDs-3 is the highest (67.69%) in all L-CQD samples. Therefore, we think that lignin with an appropriate molecular weight (Mw = 5042 g mol−1) can easily depolymerize into a large number of small molecular structure products with a high proportion of benzene rings, which are easy to polymerize and form a higher conjugated structure of L-CQDs-3 with excellent optical properties during the hydrothermal process, compared to other L-CQDs formed from high or low molecular weight lignins. The formation mechanisms of the L-CQDs-1, L-CQDs-3 and L-CQDs-5 are shown in Fig. 6.
 | ||
| Fig. 6 Formation mechanism of L-CQDs prepared from different molecular weight lignins. | ||
Cell imaging results
The cytotoxicity of L-CQDs-3 on L02 cells was tested to analyze the biocompatibility of L-CQDs-3 before cell imaging, and the results are shown in Fig. S6† The cell survival rate decreases with the increasing L-CQD-3 concentration, but even at a L-CQD-3 concentration of up to 2 mg mL−1, the cell survival rate is 83.97%, indicating L-CQDs-3 has good biocompatibility and low toxicity. After considering the fluorescence data and cytotoxicity of L-CQDs-3, L02 cells were co-cultured with L-CQDs-3 at a concentration of 0.5 mg mL−1 for 12 h with a survival rate of 94.44%.In order to demonstrate the general applicability of L-CQDs-3 in cellular imaging applications, we used three different types of cells, such as human normal hepatocytes (L02), human hepatocellular carcinoma cells (HepG2), and Escherichia coli (E. coli), to explore the imaging capability of L-CQDs-3. The excitation wavelengths of the laser confocal microscope were fixed at 405 nm, 488 nm and 559 nm, respectively. The results are shown in Fig. 7. By observing the bright field and the combined field, it can be found that L-CQDs-3 successfully enters into the interiors of L02, HepG2 and E. coli, and the outline state of these cells can be clearly observed under three passages, which indicates that the L-CQDs-3 can realize the labeling of three different types of cells. Therefore, L-CQDs-3 prepared in this study can be widely utilized for imaging different kinds of cells and can be used as a potential fluorescent probe for bioimaging and other related biomedical applications.
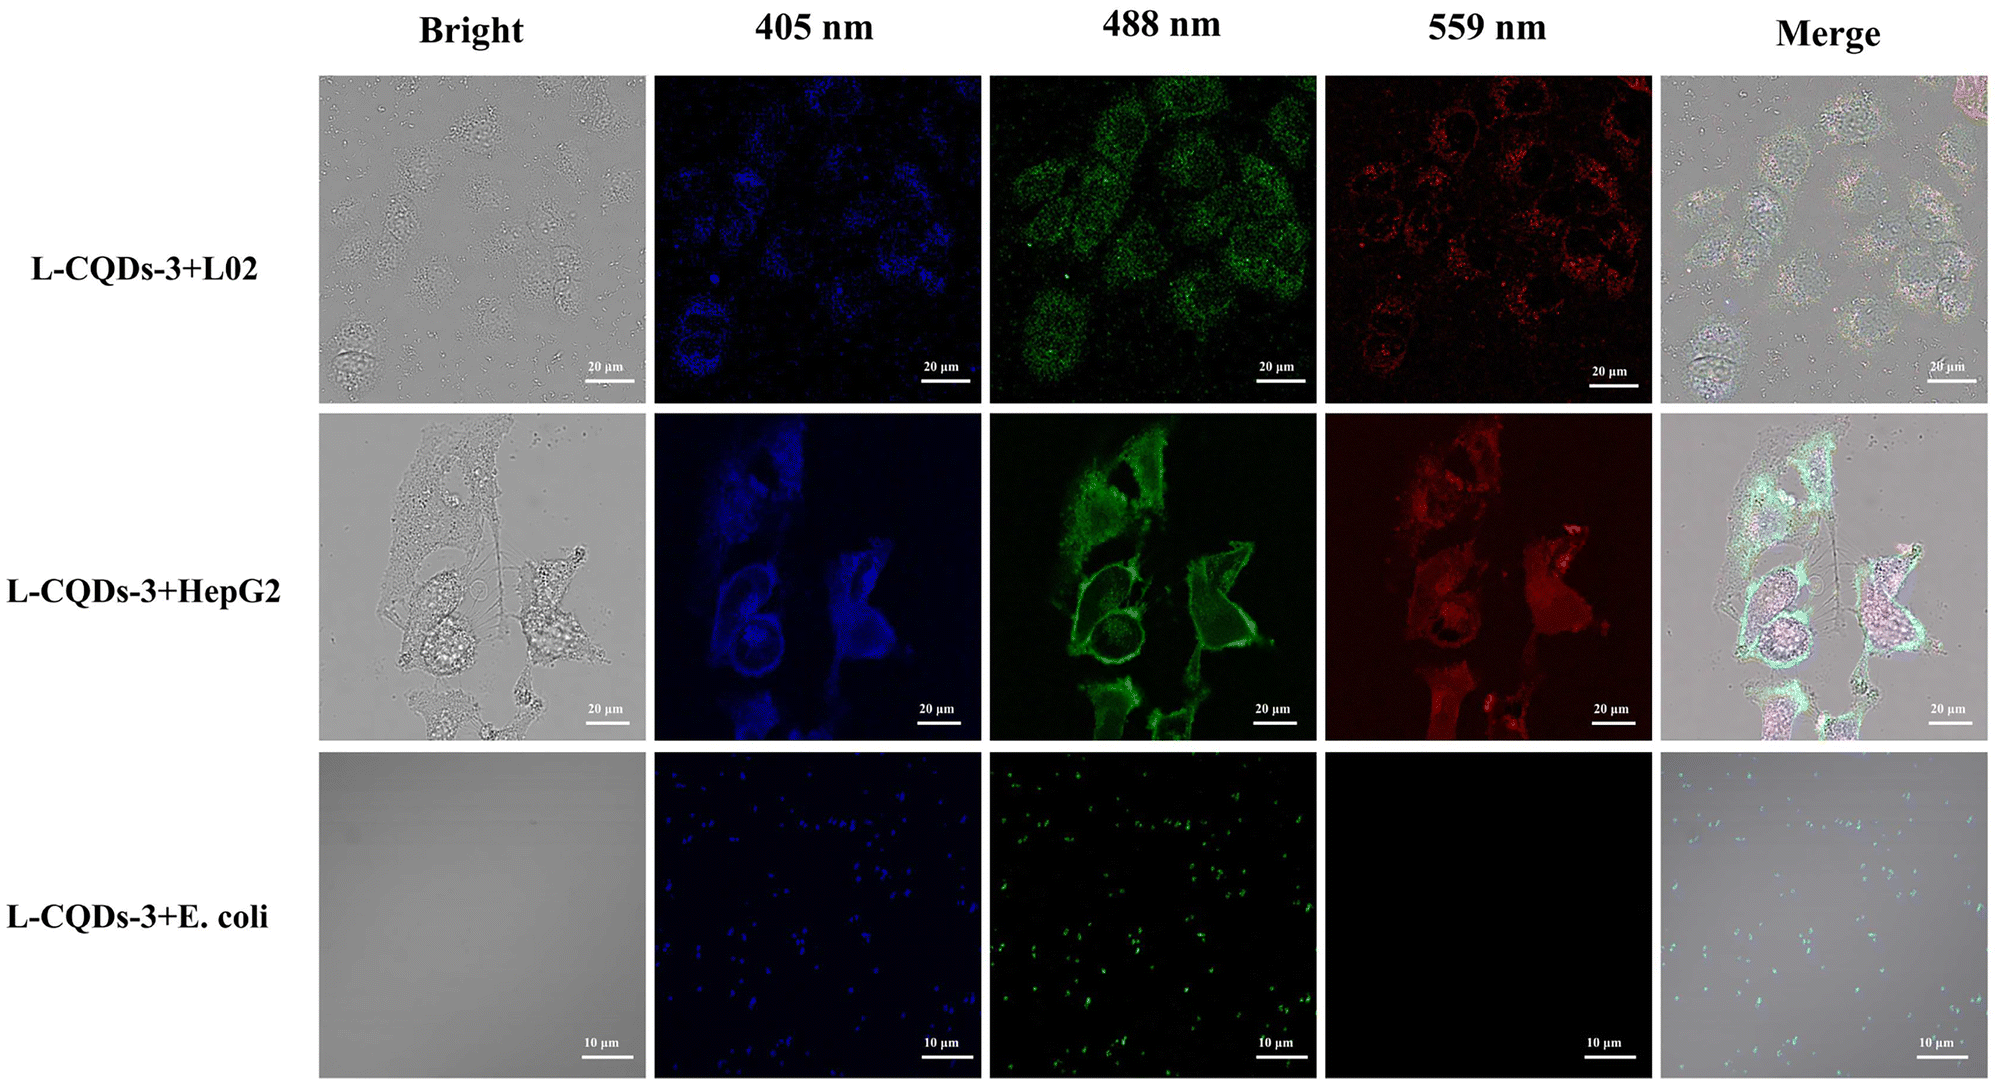 | ||
| Fig. 7 Imaging of L-CQDs-3 in L02, HepG2 and E. coli at excitation wavelengths of 405 nm, 488 nm, 559 nm, respectively. | ||
Conclusions
In this study, the effects of lignin molecular weight on the formation and performance of L-CQDs are systematically investigated with the use of lignin fractions recovered by sequential fractionation of alkali lignin. The property relationship between lignin and L-CQDs and the formation mechanism of L-CQDs with different lignin fractions are elucidated. The use of lignin fraction with a molecular weight of 5042 g mol−1 leads to the synthesis of L-CQDs with a high fluorescence intensity that is 1.86-fold that of the L-CQDs derived from original alkaline lignin. It was found that the generation of vanillin and benzaldehyde (2,4-dihydroxy-6-methyl) small molecule structures in the hydrothermal method contributes to the formation of the highly conjugated carbon core structure of L-CQDs, thus improving the fluorescence performance. In addition, the L-CQDs that are derived from the lignin fraction with a molecular weight of 5042 g mol−1 also have a remarkable imaging ability for L02, HepG2 and E. coli cells, demonstrating their significant potential in bio-imaging applications. This study not only fundamentally elucidates the formation mechanism of L-CQDs using lignin fractions with different molecular weights, but also develops a simple method for generating L-CQDs with high fluorescence performance.Author contributions
L.X.L.: methodology, investigation, formal analysis, and writing – original draft. S.Y.Z.: investigation, formal analysis, and writing – review & editing. X.R.C. and X.H.: investigation and writing – review & editing. J.H.Z., Z.Y.Z. and M.W.: methodology, supervision, and writing – review & editing. X.P.S.: conceptualization, funding acquisition, supervision, and writing –review & editing.Conflicts of interest
The authors declared that they have no conflict of interest.Acknowledgements
The project was sponsored by the National Natural Science Foundation of China (Grant No. 22268007), the National Key Research and Development Program of China (Grant No. 2021YFE0114400), the Natural Science Foundation of Guangxi Province, China (Grant No. 2021GXNSFDA196006), and the Guangxi Science and Technology Major Program (Guike AA22117013).References
- W. Hui, Y. G. Yang, Q. Xu, H. Gu, S. L. Feng, Z. H. Su, M. R. Zhang, J. O. Wang, X. D. Li, J. F. Fang, F. Xia, Y. D. Xia, Y. H. Chen, X. Y. Gao and W. Huang, Adv. Mater., 2020, 32, 1906374 CrossRef CAS PubMed.
- C. Geng, Y. D. Shang, J. J. Qiu, Q. D. Wang, X. H. Chen, S. Y. Li, W. H. Ma, H. J. Fan, A. A. A. Omer and R. Chen, J. Alloys Compd., 2020, 835, 155268 CrossRef CAS.
- H. Li, T. T. Xu, Z. Zhang, J. Chen, M. Y. She, Y. L. Ji, B. Y. Zheng, Z. Yang, S. Y. Zhang and J. L. Li, Chem. Eng. J., 2023, 453, 139722 CrossRef CAS.
- A. A. A. Ansari, K. M. M. Aldajani, A. N. N. AlHazaa and H. A. A. Albrithen, Coord. Chem. Rev., 2022, 462, 214523 CrossRef CAS.
- S. Zhao, X. Song, X. Chai, P. Zhao, H. He and Z. Liu, J. Cleaner Prod., 2020, 263, 121561 CrossRef CAS.
- J. Li, S. Yang, Z. Liu, G. Wang, P. He, W. Wei, M. Yang, Y. Deng, P. Gu, X. Xie, Z. Kang, G. Ding, H. Zhou and X. Fan, Adv. Mater., 2020, 33, 202005096 Search PubMed.
- C. Yan, C. Wang, X. Shao, Y. Teng, P. Chen, X. Hu, P. Guan and H. Wu, ACS Appl. Mater. Interfaces, 2022, 14, 47432–47444 CrossRef CAS PubMed.
- J. Shi, J. Ning, G. Hu, W. Guo and Y. Zhou, Appl. Surf. Sci., 2023, 618, 156564 CrossRef CAS.
- X. Yang, L. Ai, J. K. Yu, G. I. N. Waterhouse, L. Z. Sui, J. Ding, B. W. Zhang, X. Yong and S. Y. Lu, Sci. Bull., 2022, 67, 1450–1457 CrossRef CAS PubMed.
- Y. Zhao, S. Jing, X. Peng, Z. Chen, Y. Hu, H. Zhuo, R. Sun and L. Zhong, Cellulose, 2019, 27, 415–428 CrossRef.
- H. Ren, Y. Yuan, A. Labidi, Q. Dong, K. Zhang, E. Lichtfouse, A. A. Allam, J. S. Ajarem and C. Wang, Chin. Chem. Lett., 2023, 34, 107998 CrossRef.
- V. Manikandan and N. Y. Lee, Environ. Res., 2022, 212, 113283 CrossRef CAS PubMed.
- X. Gao, X. Zhou, Y. Ma, T. Qian, C. Wang and F. Chu, Appl. Surf. Sci., 2019, 469, 911–916 CrossRef CAS.
- Z. Pang, Y. Fu, H. Yu, S. Liu, S. Yu, Y. Liu, Q. Wu, Y. Liu, G. Nie, H. Xu, S. Nie and S. Yao, Ind. Crops Prod., 2022, 183, 114957 CrossRef CAS.
- L. Zhu, D. Shen and K. Luo, J. Colloid Interface Sci., 2022, 617, 557–567 CrossRef CAS PubMed.
- S. Y. Tao, C. J. Zhou, C. Y. Kang, S. J. Zhu, T. L. Feng, S. T. Zhang, Z. Y. Ding, C. Y. Zheng, C. L. Xia and B. Yang, Light-Sci. Appl., 2022, 11, 56–65 CrossRef CAS PubMed.
- T. Gao, S. N. Guo, J. J. Zhang, J. T. Chen, S. R. Yin, N. Peng, Q. Cai, H. Xu and Y. Liu, Green Chem., 2023, 25, 8869–8884 RSC.
- R. Wang, G. Xia, W. Zhong, L. Chen, L. Chen, Y. Wang, Y. Min and K. Li, Green Chem., 2019, 21, 3343–3352 RSC.
- Z. Ding, F. Li, J. Wen, X. Wang and R. Sun, Green Chem., 2018, 20, 1383–1390 RSC.
- L. Zhu, D. Shen, Q. Wang and K. H. Luo, ACS Appl. Mater. Interfaces, 2021, 13, 56465–56475 CrossRef CAS PubMed.
- S. Zhao, G. Yue, X. Liu, S. Qin, B. Wang, P. Zhao, A. J. Ragauskas, M. Wu and X. Song, Adv. Compos. Hybrid Mater., 2023, 6, 73–85 CrossRef CAS.
- L. L. Zhu, D. K. Shen, Q. Liu, K. H. Luo and C. Li, ACS Sustainable Chem. Eng., 2022, 10, 9888–9898 CrossRef CAS.
- Y. Shi, X. Liu, M. Wang, J. Huang, X. Jiang, J. Pang, F. Xu and X. Zhang, Int. J. Biol. Macromol., 2019, 128, 537–545 CrossRef CAS PubMed.
- E. Fumoto, S. Sato, Y. Kawamata, Y. Koyama, T. Yoshikawa, Y. Nakasaka, T. Tago and T. Masuda, Fuel, 2022, 318, 123530 CrossRef CAS.
- S. Dhara, N. S. Samanta, R. Uppaluri and M. K. Purkait, Int. J. Biol. Macromol., 2023, 234, 123594 CrossRef CAS PubMed.
- X.-J. Shen, T. Chen, H.-M. Wang, Q. Mei, F. Yue, S. Sun, J.-L. Wen, T.-Q. Yuan and R.-C. Sun, ACS Sustainable Chem. Eng., 2019, 8, 2130–2137 CrossRef.
- X. Jiang, Z. Tian, X. Ji, H. Ma, G. Yang, M. He, L. Dai, T. Xu and C. Si, Int. J. Biol. Macromol., 2022, 201, 400–410 CrossRef CAS PubMed.
- H. Jin, H. Shi, W. Jia, Y. Sun, X. Sheng, Y. Guo, H. Li and H. Sun, Int. J. Biol. Macromol., 2022, 207, 531–540 CrossRef CAS PubMed.
- Y. Lin, H. Lou, Y. Pang, M. Zhou, D. Yang and X. Qiu, Ind. Crops Prod., 2023, 193, 116172 CrossRef CAS.
- H. Zhang, S. Fu and Y. Chen, Int. J. Biol. Macromol., 2020, 147, 607–615 CrossRef CAS PubMed.
- B. Zhang, Y. Liu, M. Ren, W. Li, X. Zhang, R. Vajtai, P. M. Ajayan, J. M. Tour and L. Wang, ChemSusChem, 2019, 12, 4202–4210 CrossRef CAS PubMed.
- S. Zhao, X. Chen, C. Zhang, P. Zhao, A. J. Ragauskas and X. Song, ACS Appl. Mater. Interfaces, 2021, 13, 61565–61577 CrossRef CAS PubMed.
- T. Zhang, S. Hou, X. Huo, H. Li, H. Shi, X. Wang, C. Liu and Y. Guo, ACS Appl. Mater. Interfaces, 2023, 15, 42823–42835 CrossRef CAS PubMed.
- S. Zhao, X. Chen, J. Su, P. Zhao, C. Si, T. Xu, C. Huang and X. Song, Int. J. Biol. Macromol., 2022, 222, 1876–1887 CrossRef CAS PubMed.
- X. Chen, S. Zhao, X. Kang, C. He, P. Zhao, X. Meng, A. J. Ragauskas, J. Pang and X. Song, Adv. Compos. Hybrid Mater., 2023, 6, 131–144 CrossRef CAS.
- A. B. Siddique, S. M. Hossain, A. K. Pramanick and M. Ray, Nanoscale, 2021, 13, 16662–16671 RSC.
- N. Ziaee, N. Farhadian, K. Abnous, M. M. Matin, A. Khoshnood and E. Yaghoobi, Biomed. Pharmacother., 2023, 164, 114971 CrossRef CAS PubMed.
- H. J. Yoo, B. E. Kwak and D. H. Kim, Carbon, 2021, 183, 560–570 CrossRef CAS.
- S. Tao, C. Zhou, C. Kang, S. Zhu, T. Feng, S.-T. Zhang, Z. Ding, C. Zheng, C. Xia and B. Yang, Light-Sci. Appl., 2022, 11, 11–56 CrossRef PubMed.
- Q. Ci, Y. Wang, B. Wu, E. Coy, J. j. Li, D. Jiang, P. Zhang and G. Wang, Adv. Sci., 2023, 10, 2206271 CrossRef CAS PubMed.
- X. Song, S. Zhao, Y. Xu, X. Chen, S. Wang, P. Zhao, Y. Pu and A. J. Ragauskas, ChemSusChem, 2022, 15, e202102486 CrossRef CAS PubMed.
- B. Xue, Y. Yang, Y. Sun, J. Fan, X. Li and Z. Zhang, Int. J. Biol. Macromol., 2019, 122, 954–961 CrossRef CAS PubMed.
- C. Zhang and F. Wang, Acc. Chem. Res., 2020, 53, 470–484 CrossRef CAS PubMed.
- G. E. Klinger, Y. Zhou, J. A. Foote, A. M. Wester, Y. Cui, M. Alherech, S. S. Stahl, J. E. Jackson and E. L. Hegg, ChemSusChem, 2020, 13, 4394–4399 CrossRef CAS PubMed.
- E. Subbotina, T. Rukkijakan, M. D. Marquez-Medina, X. Yu, M. Johnsson and J. S. M. Samec, Nat. Chem., 2021, 13, 1118–1125 CrossRef CAS PubMed.
- L. Zhu, D. Shen, Q. Liu, C. Wu and S. Gu, Appl. Surf. Sci., 2021, 565, 150526 CrossRef CAS.
- H. Ding, J. S. Wei, P. Zhang, Z. Y. Zhou, Q. Y. Gao and H. M. Xiong, Small, 2018, 14, 1800612 CrossRef PubMed.
- F. Yuan, T. Yuan, L. Sui, Z. Wang, Z. Xi, Y. Li, X. Li, L. Fan, Z. a. Tan, A. Chen, M. Jin and S. Yang, Nat. Commun., 2018, 9, 2249 CrossRef PubMed.
Footnotes |
| † Electronic supplementary information (ESI) available. See DOI: https://doi.org/10.1039/d3gc04694j |
| ‡ These authors contributed equally to this work. |
| This journal is © The Royal Society of Chemistry 2024 |