
Phase-dependent electronic structure modulation of nickel selenides by Fe doping for enhanced bifunctional oxygen electrocatalysis†
Vigneshraaj
A. S.
ab,
Siva Kumar
Ramesh
 c,
Jinkwon
Kim
c and
Kavita
Pandey
*ab
c,
Jinkwon
Kim
c and
Kavita
Pandey
*ab
aCentre for Nano and Soft Matter Sciences (CeNS), Shivanapura, Bengaluru 562162, India
bAcademy of Scientific and Innovative Research (AcSIR), Ghaziabad, 201002, India. E-mail: kavitapandey@cens.res.in
cDepartment of Chemistry, Kongju National University, 56 Gongjudaehak-ro, Gongju-si, Chungnam-do 32588, South Korea
First published on 3rd January 2025
Abstract
Bifunctional oxygen electrocatalysis is a pivotal process that underpins a diverse array of sustainable energy technologies, including electrolyzers and fuel cells. Metal selenides have been identified as highly promising candidates for oxygen electrocatalysts with electronic structure engineering that lies at the heart of catalyst design. Two-phase Fe-doped nitrogen carbon (NC)-supported nickel selenides were synthesized using a coordination polymer template. Fe doping offers significant advantages as it enhances electronic interactions, resulting in higher availability of active sites than nickel selenides and optimizing the adsorption energy for reaction intermediates. Owing to the intriguing compositional and structural features, the obtained NixFe1−xSe2–NC@400 electrocatalyst displays better catalytic activity with an overpotential (η10) of 253 mV and a lower Tafel slope of 57.1 mV dec−1 for the Oxygen Evolution Reaction (OER) in 1 M KOH. Likewise, the catalyst demonstrated remarkable efficiency in Oxygen Reduction Reaction (ORR) catalysis, achieving a limiting current density comparable to that of the standard Pt/C catalyst and exhibiting an improved Tafel slope of 35.4 mV dec−1 in 0.1 M KOH. This work reveals the influence of Fe dopants in oxygen electrocatalysis and presents an effective approach to tuning the electronic structure for the development of highly active electrocatalysts in alkaline media.
Introduction
With the increasing environmental pollution and energy crisis owing to the use of fossil fuels, electrochemical reduction, and oxidation reactions form the cornerstone of a diverse range of energy conversion and storage devices.1,2 Redox reactions that includes oxygen, hydrogen, and water include the oxygen evolution reaction (OER), hydrogen evolution reaction (HER), and oxygen reduction reaction (ORR).3,4 These reactions have garnered heightened attention in recent years due to their essential functions in various energy-related applications, such as water electrolysis, fuel cells, metal–air batteries, and the production of valuable oxidants such as hydrogen peroxide (H2O2), which is extensively used in the chemical and medical industries.5–7 Oxygen electrocatalysis, encompassing the ORR and OER, is essential for a range of energy conversion and storage technologies and is often hampered by higher overpotentials than the HER.8 The OER and ORR involve multiple electron transfer mechanisms with multiple reaction intermediates, making the reaction pathways complex, energetically demanding, exhibiting slow kinetics and high overpotential.1 The main drawbacks of promising electrocatalysts for OER (Ru/Ir-based oxides) and ORR (Pt/C) are their limited reserves, selective to particular half-cell applications, and high cost, as developed in the past several decades. At high potentials, RuO2 becomes highly unstable and converts into RuO4, dissolving in the electrolyte, leading to deactivation.9 Similarly, Pt-based catalysts are ineffective for the OER, as Pt readily oxidizes to form Pt oxides on the surface at elevated potentials.10,11 These challenges pose significant obstacles to the large-scale commercialization of oxygen electrocatalysis, highlighting the urgent need for the development of cost-effective, earth-abundant bifunctional electrocatalysts for both the OER and ORR.12,13The gas involved in the tri-phase electrocatalytic reaction must facilitate rapid electron and mass transport during the catalytic reaction.14 Materials with non-precious metals, high electrical conductivities, surface areas, and adjustable porous structures have emerged as promising candidates for developing highly active oxygen electrocatalysis.15–17 Consequently, substantial efforts have been dedicated to discovering low-cost earth-abundant materials. This has led to the extensive development of various materials for OER, including hydroxides, transition metal oxides (TMOs), selenides (TMSes), and sulfides (TMSs). TMSes have garnered particular attention owing to their high electrical conductivity and enhanced electrocatalytic activity.18 The 3d orbital of selenium (Se) with an electronic configuration of 4s24p4 can engage in bonding with metal atoms due to its energy level being similar to that of the 3s and 3p orbitals. This unique electronic configuration enhances the metallic nature of transition metal selenides, promoting efficient electron transport and facilitating chemical reactions and remarkable electrocatalytic properties compared to transition metal sulfides and oxides. Additionally, selenium readily accepts two electrons from elements with lower electronegativity to form Se2− ions or interacts with highly electronegative elements by sharing electrons, resulting in the formation of TMSes.19
Metal–organic frameworks (MOFs) are a category of materials constructed by linking metal ions with organic ligands, and they possess a crystalline structure, adjustable functionality, structural flexibility, and exceptional porosity.20–22 Pristine MOFs are primarily hindered by their poor conductivity. To address this issue, pyrolysis has become a widely adopted method, transforming MOFs into carbon-based materials with diverse morphologies and enabling the synthesis of heteroatom-doped carbon materials with varied compositions.23,24 Heteroatom-doped carbon materials have acquired considerable interest because of their ability to act as conductive scaffolds, and easily constructed porous structures provide numerous accessible active sites for oxygen electrocatalysis. Incorporating heteroatoms into carbon-based materials derived from MOFs enhances the exposure of active sites and improves the charge and mass transfer from these sites to the electrode surface.25,26 NC-doped metal selenides derived from MOF are considered to be highly promising electrocatalysts owing to their unique combination of metal ions, heteroatom doping from ligands, MOF template morphology, and tunable derivatives suitable for application. 2D–2D MOF derived Ni0.85Se/NiTe2,27 microscale assembly of MOF derived iron/nickel selenide,28 Prussian blue analogue (PBA)-derived bimetallic NiFe selenide,29 Fe doped Ni3Se4/NiSe2 heterostructure,30 Fe–Ni3Se4@NC31 have been utilized for OER. NiSe2–Vse,32 Co7Se8,33 and Co(S, Se)@GNF34 have been exploited for ORR.
Doping elements can reduce the binding energy of OER intermediates such as *O, *OH, and *OOH, improve conductivity, alter the electronic structure, and enhance the stability of OER electrocatalysts at specific current densities.35,36 Specifically, the electronic structure of Fe sites, which is flexible in redox reactions, promotes beneficial interactions with nearby metals like Ni and Co by facilitating the rapid formation of M–O–Fe bonds. This stabilization of oxyhydroxide intermediates significantly improves the OER activity.37 The strong Lewis acidity of Fe ions plays a pivotal role in electrophilic substitution reactions, significantly influencing the electronic properties of other cations in the host material they are incorporated. With a pKa of 2.2, Fe3+ ions significantly enhance the acidity of hydroxyl protons coordinated to Ni sites, inducing polarization that lowers the activation energy barrier and facilitates their oxidation. Consequently, a greater concentration of Ni4+ cations is generated, directly contributing to the improved catalytic performance for the oxygen evolution reaction (OER).38 Sengeni Anantharaj et al. presented an in-depth review emphasizing the pivotal influence of iron on nickel/cobalt-based oxygen evolution catalysis.39 Selenium (Se), despite its chemical similarity to oxygen and sulfur, has demonstrated exceptional performance in oxygen reduction when incorporated into two-phase or polymetallic heterostructures. This enhanced performance is likely attributed to selenium's unique metalloid properties and its inherent tolerance to diverse conditions. Jun Wang et al. presented Fe doping induced Se vacancy in CoSe for H2O2 production.40 Adopting these strategies, we explored electronic structure modulation through iron doping in nickel selenides to enhance their electrocatalytic performance for both oxygen evolution (OER) and oxygen reduction reactions (ORR).
This paper presents Fe-doped NC-supported nickel selenides with engineered electronic structures and improved conductivity, resulting in significantly enhanced oxygen electrocatalysis. The NiFe coordination polymer synthesized by the hydrothermal method served as a template for developing NixFe1−xSe2–NC@400 and Ni3−xFexSe4–NC@550, which was achieved by varying the selenization temperature after carbonization. The resulting materials demonstrate exceptional electrocatalytic performance for bifunctional OER and ORR in an alkaline environment. The incorporation of N-doped carbon in conjunction with Fe dopants in nickel selenides facilitates efficient oxygen electrocatalysis for both reactions. This approach can pave the path for the design of advanced engineering techniques for monometallic catalysts for energy-related applications.
Experimental section
Materials
NiCl2·6H2O, FeSO4·7H2O, nitrilotriacetic acid (NTA), Se powder, and Isopropanol (IPA) were purchased from Sigma-Aldrich Chemicals. Doubly deionized (D.I) water was purified from a Sartorius ultrapure water system. All chemicals were utilized as received, without purification.Synthesis of NiFe–NTA
A one-dimensional NiFe–NTA coordination polymer (CP) was synthesized by facile hydrothermal method.41 In a standard synthesis procedure, NiCl2·6H2O (0.75 mmol), FeSO4·7H2O (0.25 mmol), and NTA (1 mmol) were added to 50 mL IPA and 20 mL deionized (DI) water with rapid stirring for 20 minutes. The thoroughly dispersed solution was placed into a 100 mL Teflon-lined autoclave and heated at 180 °C for 6 hours. The final product, NiFe–NTA, was obtained by washing three times with water and ethanol via centrifugation and dried in a vacuum oven at 60 °C for 8 hours. In the same way, the Ni–NTA synthetic procedure was similar, except for the addition of FeSO4·7H2O. The NiFe–NTA and Ni–NTA coordination polymers were denoted as NF–NTA and N–NTA, respectively.Synthesis of NixFe1−x–NC@800
NF–NTA was carbonized at 800 °C in an N2 atmosphere at a rate of 5 °C min−1. The temperature was maintained for 2 h, and then lowered to obtain NixFe1−x–NC@800, which is represented as NF–NC@800. N–NC@800 was obtained from N–NTA using the same procedure.Synthesis of NixFe1−xSe2–NC@400 and Ni3−xFexSe4–NC@550
The NiFe–NC and selenium powders in a 1![[thin space (1/6-em)]](https://www.rsc.org/images/entities/char_2009.gif) :5 ratio were loaded into a ceramic boat. The boat was then positioned in a tube furnace, with selenium powder in the upstream zone. Selenization was conducted at two distinct temperatures, 400 °C and 550 °C, with a heating rate of 5 °C min−1 in a nitrogen environment for a duration of 2 hours. At 400 °C, the process yielded NixFe1−xSe2–NC@400, while at 550 °C, the product was Ni3−xFexSe4–NC@550. NiSe2–NC-400 and Ni3Se4–NC@550 were obtained from Ni–NC@800 using the same procedure. NixFe1−xSe2–NC@400, Ni3−xFexSe4–NC@550, NiSe2–NC-400, and Ni3Se4–NC@550 are denoted as NFSe–NC@400, NFSe–NC@550, NSe–NC@400, and NSe–NC@550, respectively.
:5 ratio were loaded into a ceramic boat. The boat was then positioned in a tube furnace, with selenium powder in the upstream zone. Selenization was conducted at two distinct temperatures, 400 °C and 550 °C, with a heating rate of 5 °C min−1 in a nitrogen environment for a duration of 2 hours. At 400 °C, the process yielded NixFe1−xSe2–NC@400, while at 550 °C, the product was Ni3−xFexSe4–NC@550. NiSe2–NC-400 and Ni3Se4–NC@550 were obtained from Ni–NC@800 using the same procedure. NixFe1−xSe2–NC@400, Ni3−xFexSe4–NC@550, NiSe2–NC-400, and Ni3Se4–NC@550 are denoted as NFSe–NC@400, NFSe–NC@550, NSe–NC@400, and NSe–NC@550, respectively.
Characterization
Powder X-ray diffraction (XRD) analysis was conducted using a Panalytical X'Pert Pro diffractometer equipped with Cu Kα radiation (λ = 0.154 nm) to identify the crystal phases of the samples. Field emission scanning electron microscope (FESEM, Hitachi HF-4800) were used to analyze the morphologies of all samples. High-resolution transmission electron microscopy (HR-TEM) and Elemental Mapping were conducted using a Thermo Fisher Talos F200 S. The chemical composition of the samples were assessed by X-ray Photoelectron Spectroscopy (XPS) using a Thermo Fisher K-alpha instrument. The valence band spectrum (VBS) was also analyzed by XPS for calculating the d-band center. The d-band center is calculated using the equation: , where E represents the binding energy, and I(E) denotes the intensity of the valence band (VB) spectrum corresponds to the density of states of the occupied d states. A Horiba Xplora plus spectrometer with a 532 nm excitation laser was used to record Raman spectra.
Electrochemical characterization
The electrocatalytic activities of the catalysts were assessed by a three-electrode system (Autolab Metrohm instrument) in 1 M KOH. A carbon cloth (CC) (1 × 1 cm2) was employed as the working electrode (OER), and a Rotating Disk Electrode (RDE) as the working electrode for ORR. The platinum coil functioned as the counter electrode, and a Hg/HgO (1 M NaOH) electrode was used as the reference. 2 mg of the catalyst were dispersed in 200 μL solution containing (95 μL of D.I water, 100 μL ethanol, and 5 μL of 5 weight percent Nafion) and used as the catalyst ink. This ink was drop-cast to the working electrode via drop-casting (0.3 mg cm−2). All potentials were converted to the Reversible Hydrogen Electrode (RHE) scale. Electrochemical Impedance Spectroscopy (EIS) was performed over a frequency range of 105 to 0.1 Hz, using an amplitude of 10 mV. A 95% iR compensation was applied to account for the solution resistance across all polarization curves. Details of the turnover frequency (TOF), electrochemical surface area (ECSA), Koutecky–Levich (K–L) plot, number of electrons transferred, and faradaic efficiency calculations are provided in the ESI.†Results and discussion
The systematic synthetic routes to NFSe–NC@400 and NFSe–NC@550 are illustrated in Fig. 1. The rod-shaped NF–NTA coordination polymer was prepared by a one-pot synthesis. During this process, Ni2+ ions coordinate with the oxygen atoms in the carboxyl groups, whereas Fe2+ ions coordinate with the nitrogen atoms in the NTA ligand, forming a one-dimensional nanorod-like coordination polymer.42 As shown in Fig. S1,† the PXRD pattern of NF–NTA is consistent with a previously reported result (CCDC number 1981698).43 The FESEM images of NF–NTA (Fig. 3a) show a fiber-like rod-shaped morphology. The NF–NTA was subjected to carbonization at 800 °C under an inert atmosphere via pyrolysis to form NF–NC@800. During pyrolysis, the coordination bonds between the metal ion and NTA ligand were broken, which led to the conversion of metal ions and NTA ligands into porous N-doped carbon-supported metal nanoparticles. The XRD pattern of NF–NC@800 (Fig. S2†) shows the FeNi3 phase (JCPDS no. 38419), implying the complete disappearance of NF–NTA during the carbonization process. Moreover, the FESEM image of NF–NC@800 presented in Fig. 3b shows that the fiber-like rod-shaped structure without structural collapse was maintained, similar to that of NF–NTA, whereas the smooth surface became rough. TEM images of NF–NC@800 (Fig. S3†) exhibit a hollow porous structure with abundant pores and metal nanoparticles randomly distributed in the porous nanorods. The corresponding HAADF-STEM elemental mapping showed a homogenous distribution of Ni, Fe, N, and C.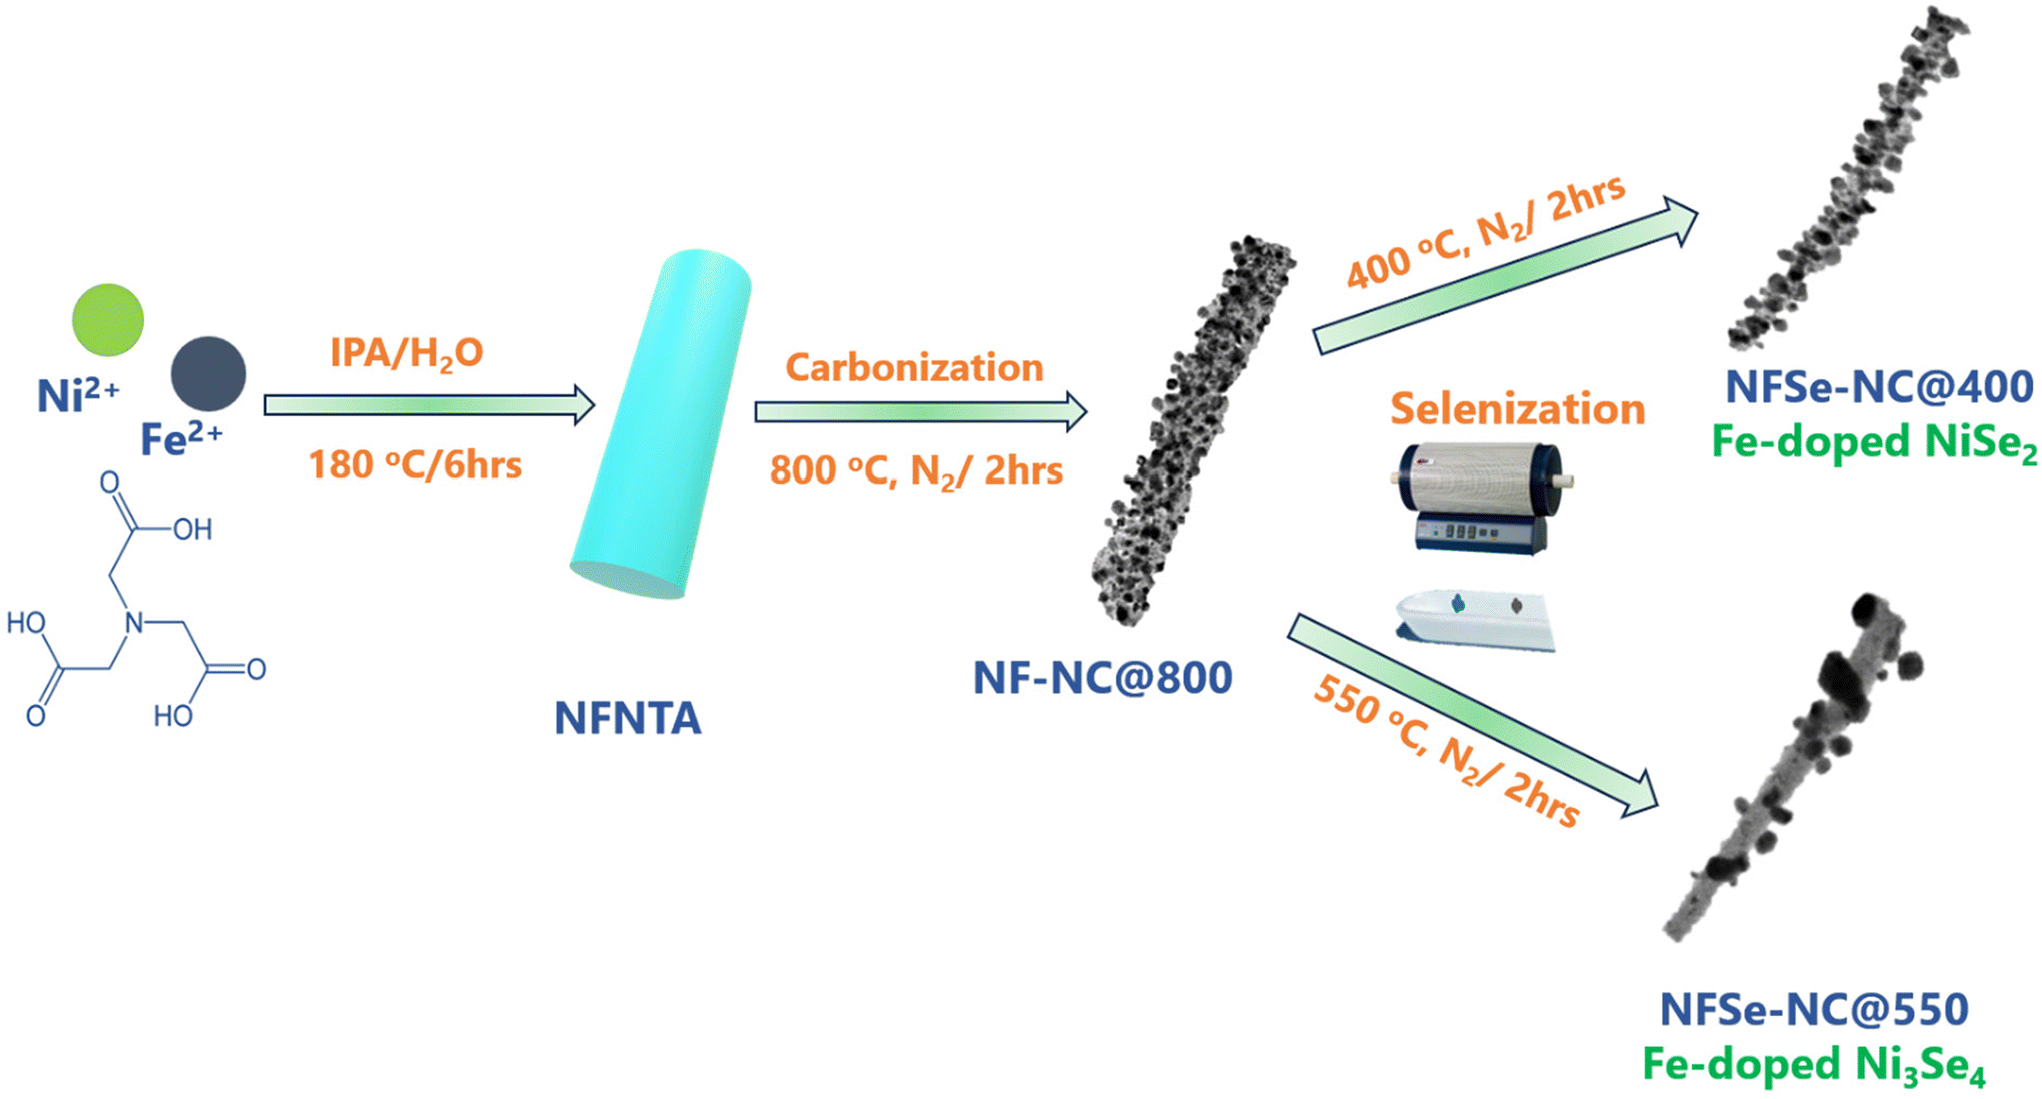 | ||
| Fig. 1 Schematic representation of the synthesis of NixFe1−xSe2–NC@400 and Ni3−xFexSe4–NC@550. | ||
Finally, after pyrolysis, subsequent selenization was carried out at temperatures of 400 and 550 °C to obtain different nickel selenide phases of NFSe–NC@400 and NFSe–NC@550. The Powder XRD pattern revealed the different crystallographic structures and phase information of NFSe–NC@400 and NFSe–NC@550. The diffraction peaks at 29.9°, 33.5°, 36.9°, 42.9°, 50.8°, and 55.5° in Fig. 2a, can be indexed to the (200), (210), (211), (220), (331), and (023) planes of cubic NiSe2 (JCPDS card no. 88-1711) with space group Pa![[3 with combining macron]](https://www.rsc.org/images/entities/char_0033_0304.gif) and the diffraction peaks at 33.15°, 44.5°, 50.3°, 59.8°, 61.7°, and 69.8° in Fig. 2b, corresponding to the (−112), (−114), (020), (−116), (−402), and (−125) planes of the monoclinic Ni3Se4 phase (JCPDS card no. 18-0890) with space group I2/m. The crystal structures of NixFe1−xSe2 and Ni3−xFexSe4 are illustrated in Fig. 2c and d. No additional characteristic peaks of Ni- or Fe-based materials were detected, implying that the obtained products were of high purity and Fe ions were doped into the lattice of NiSe2 and Ni3Se4. The inclusion of Fe did not notably alter the crystal structures of the NiSe2 and Ni3Se4 phases, as demonstrated in Fig. S4a and c.†44,45 Furthermore, the Fe-doped NFSe–NC@400 and NFSe–NC@550 share a similar charge balance of NiSe2 (Ni2+ and Se22−) and Ni3Se4 (Ni2+/Ni3+ and Se2−), respectively.
and the diffraction peaks at 33.15°, 44.5°, 50.3°, 59.8°, 61.7°, and 69.8° in Fig. 2b, corresponding to the (−112), (−114), (020), (−116), (−402), and (−125) planes of the monoclinic Ni3Se4 phase (JCPDS card no. 18-0890) with space group I2/m. The crystal structures of NixFe1−xSe2 and Ni3−xFexSe4 are illustrated in Fig. 2c and d. No additional characteristic peaks of Ni- or Fe-based materials were detected, implying that the obtained products were of high purity and Fe ions were doped into the lattice of NiSe2 and Ni3Se4. The inclusion of Fe did not notably alter the crystal structures of the NiSe2 and Ni3Se4 phases, as demonstrated in Fig. S4a and c.†44,45 Furthermore, the Fe-doped NFSe–NC@400 and NFSe–NC@550 share a similar charge balance of NiSe2 (Ni2+ and Se22−) and Ni3Se4 (Ni2+/Ni3+ and Se2−), respectively.
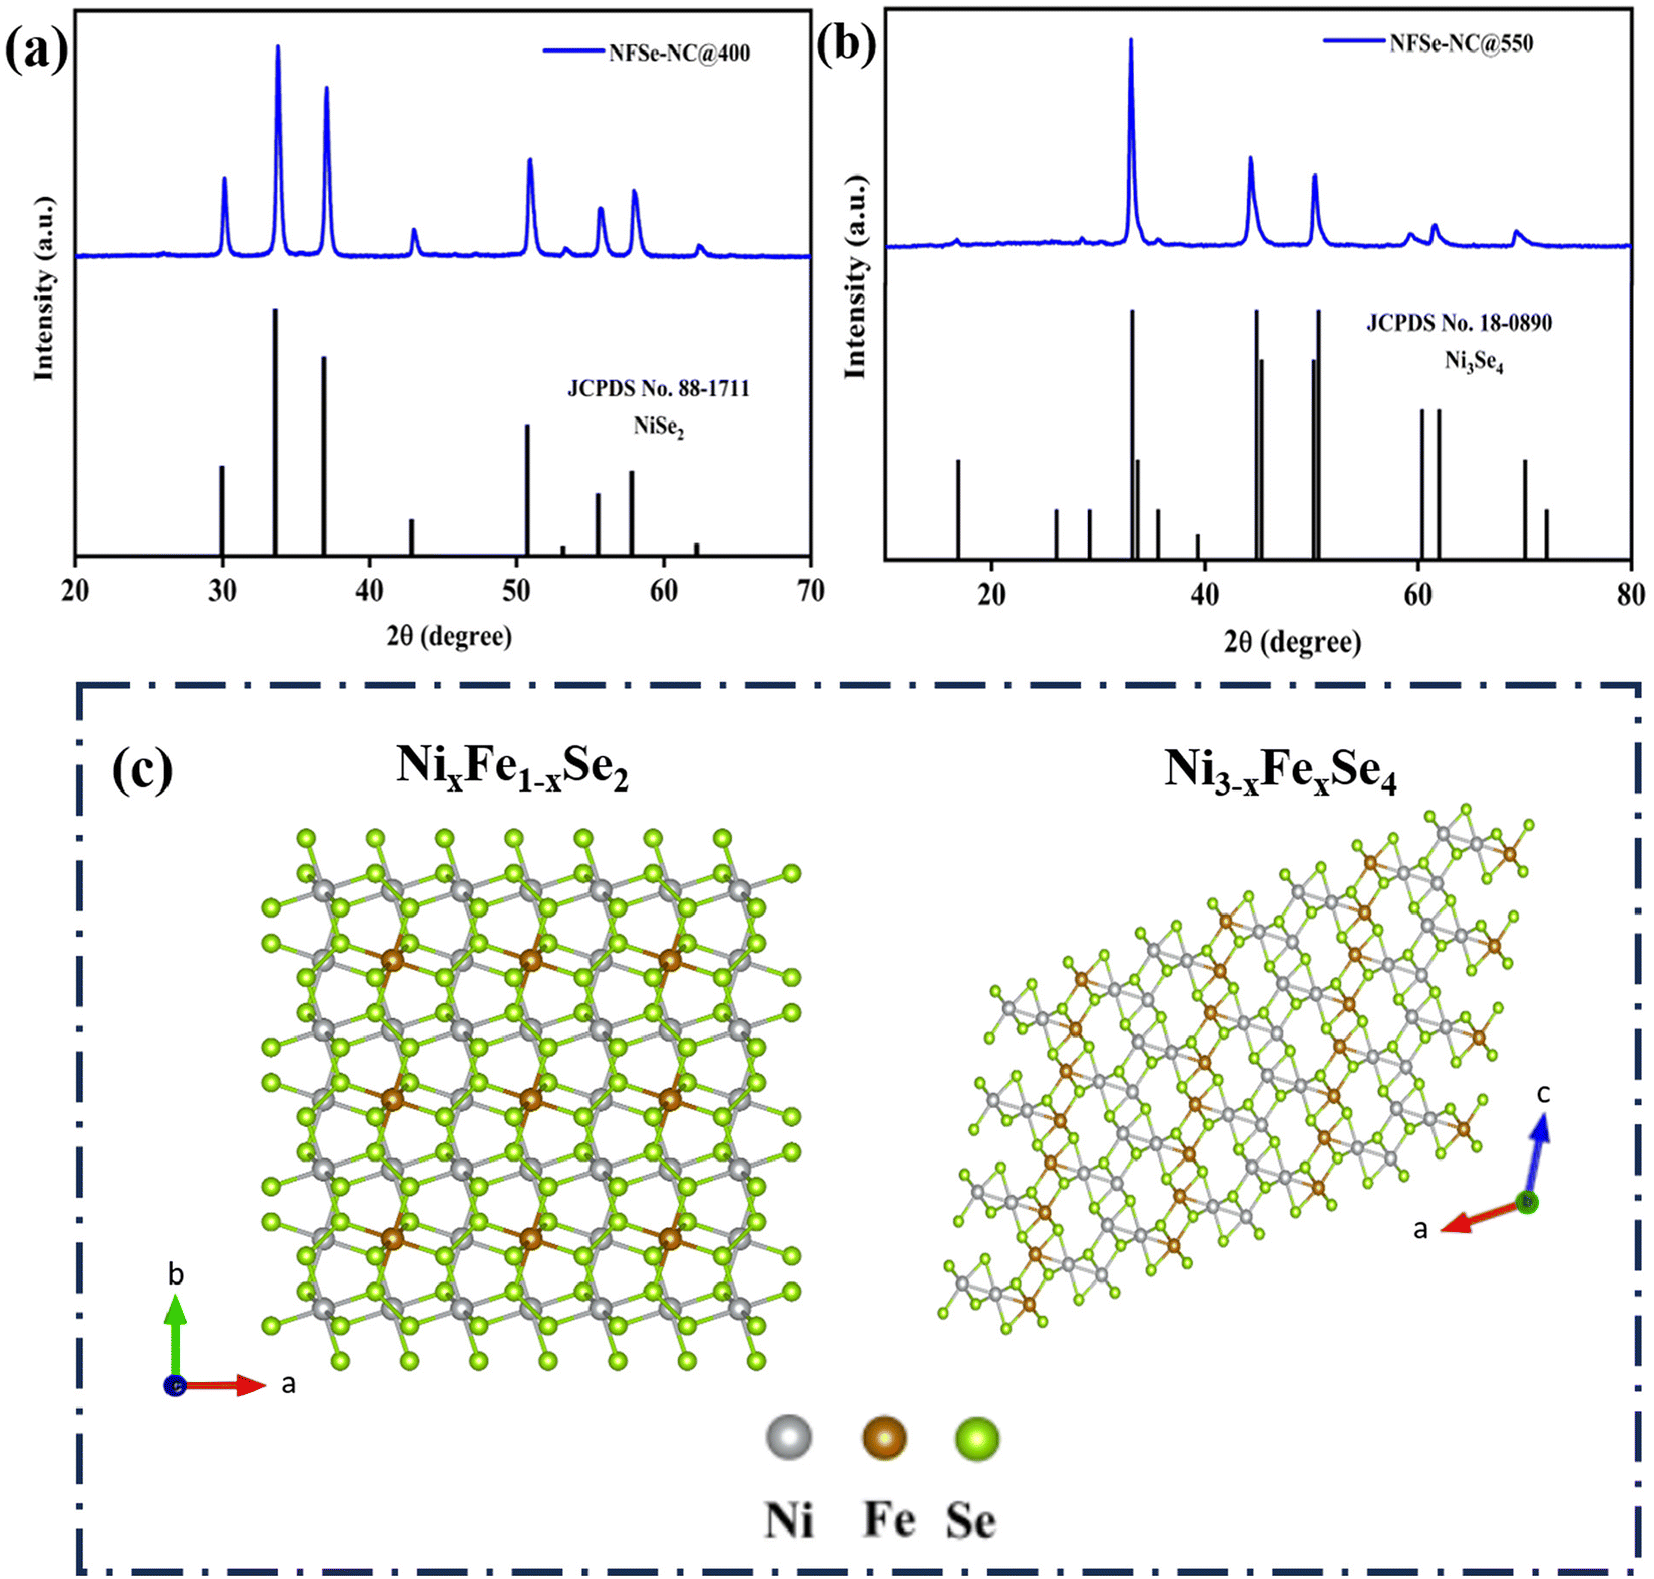 | ||
| Fig. 2 XRD patterns of (a) NixFe1−xSe2–NC@400 and (b) Ni3−xFexSe4–NC@550 (c) crystal structure of NixFe1−xSe2 and Ni3−xFexSe4. | ||
FESEM and TEM images of NFSe–NC@400 and NFSe–NC@550 (Fig. 3c and 4a, & Fig. 3d and 4g) indicate that the rod-shape with an average width of 500 nm was preserved even after selenization, confirming its structural robustness. Moreover, numerous metal selenides have been embedded in an N-doped carbon skeleton with a highly porous structure. After thermal selenization, compared to NF–NC@800, the growth of metal nanoparticles in the carbon skeleton was enhanced because the metal nanoparticles reacted with selenide atoms to form metal selenide nanoparticles. To further examine the porous structure and lattice fringes of NFSe–NC@400 and NFSe–NC@550, high-resolution TEM is performed (Fig. 4b–e and h–k). As illustrated in Fig. 4b, the HRTEM images reveal that the Fe-doped nanocrystals are surrounded by carbon species, and the nanocrystalline features of the images taken from an arbitrary region are shown in Fig. 4b–e. The lattice fringes of nanocrystals and corresponding resolved inverse FFT shows the interplanar spacing of 0.17 nm, 0.24 nm, and 0.26 nm, which corresponds to [311], [211], and [210] planes of NiSe2, respectively. Similarly, the HRTEM images NFSe–NC@550 are provided in Fig. 4h–k, and corresponding lattice fringes display the interplanar spacing of 0.52 nm, and 0.26 nm are ascribed to the [002] and [202] planes of Ni3Se4 phase, respectively. These results are consistent with the XRD results and demonstrate a regular atomic arrangement in the crystal structure. Furthermore, the HAADF-STEM elemental mapping of both NFSe–NC@400 (Fig. 4f) and NFSe–NC@550 (Fig. 4l) samples confirmed that Ni, Fe, Se, N, and C were homogeneously distributed throughout the material. In addition, the elemental composition of NFSe–NC@400 and NFSe–NC@550 were analyzed using the EDX pattern, which revealed Ni, Fe, and Se, with the ratio of 1:0.13:1.4 and 1:0.12:1.05 respectively (Fig. S5†).
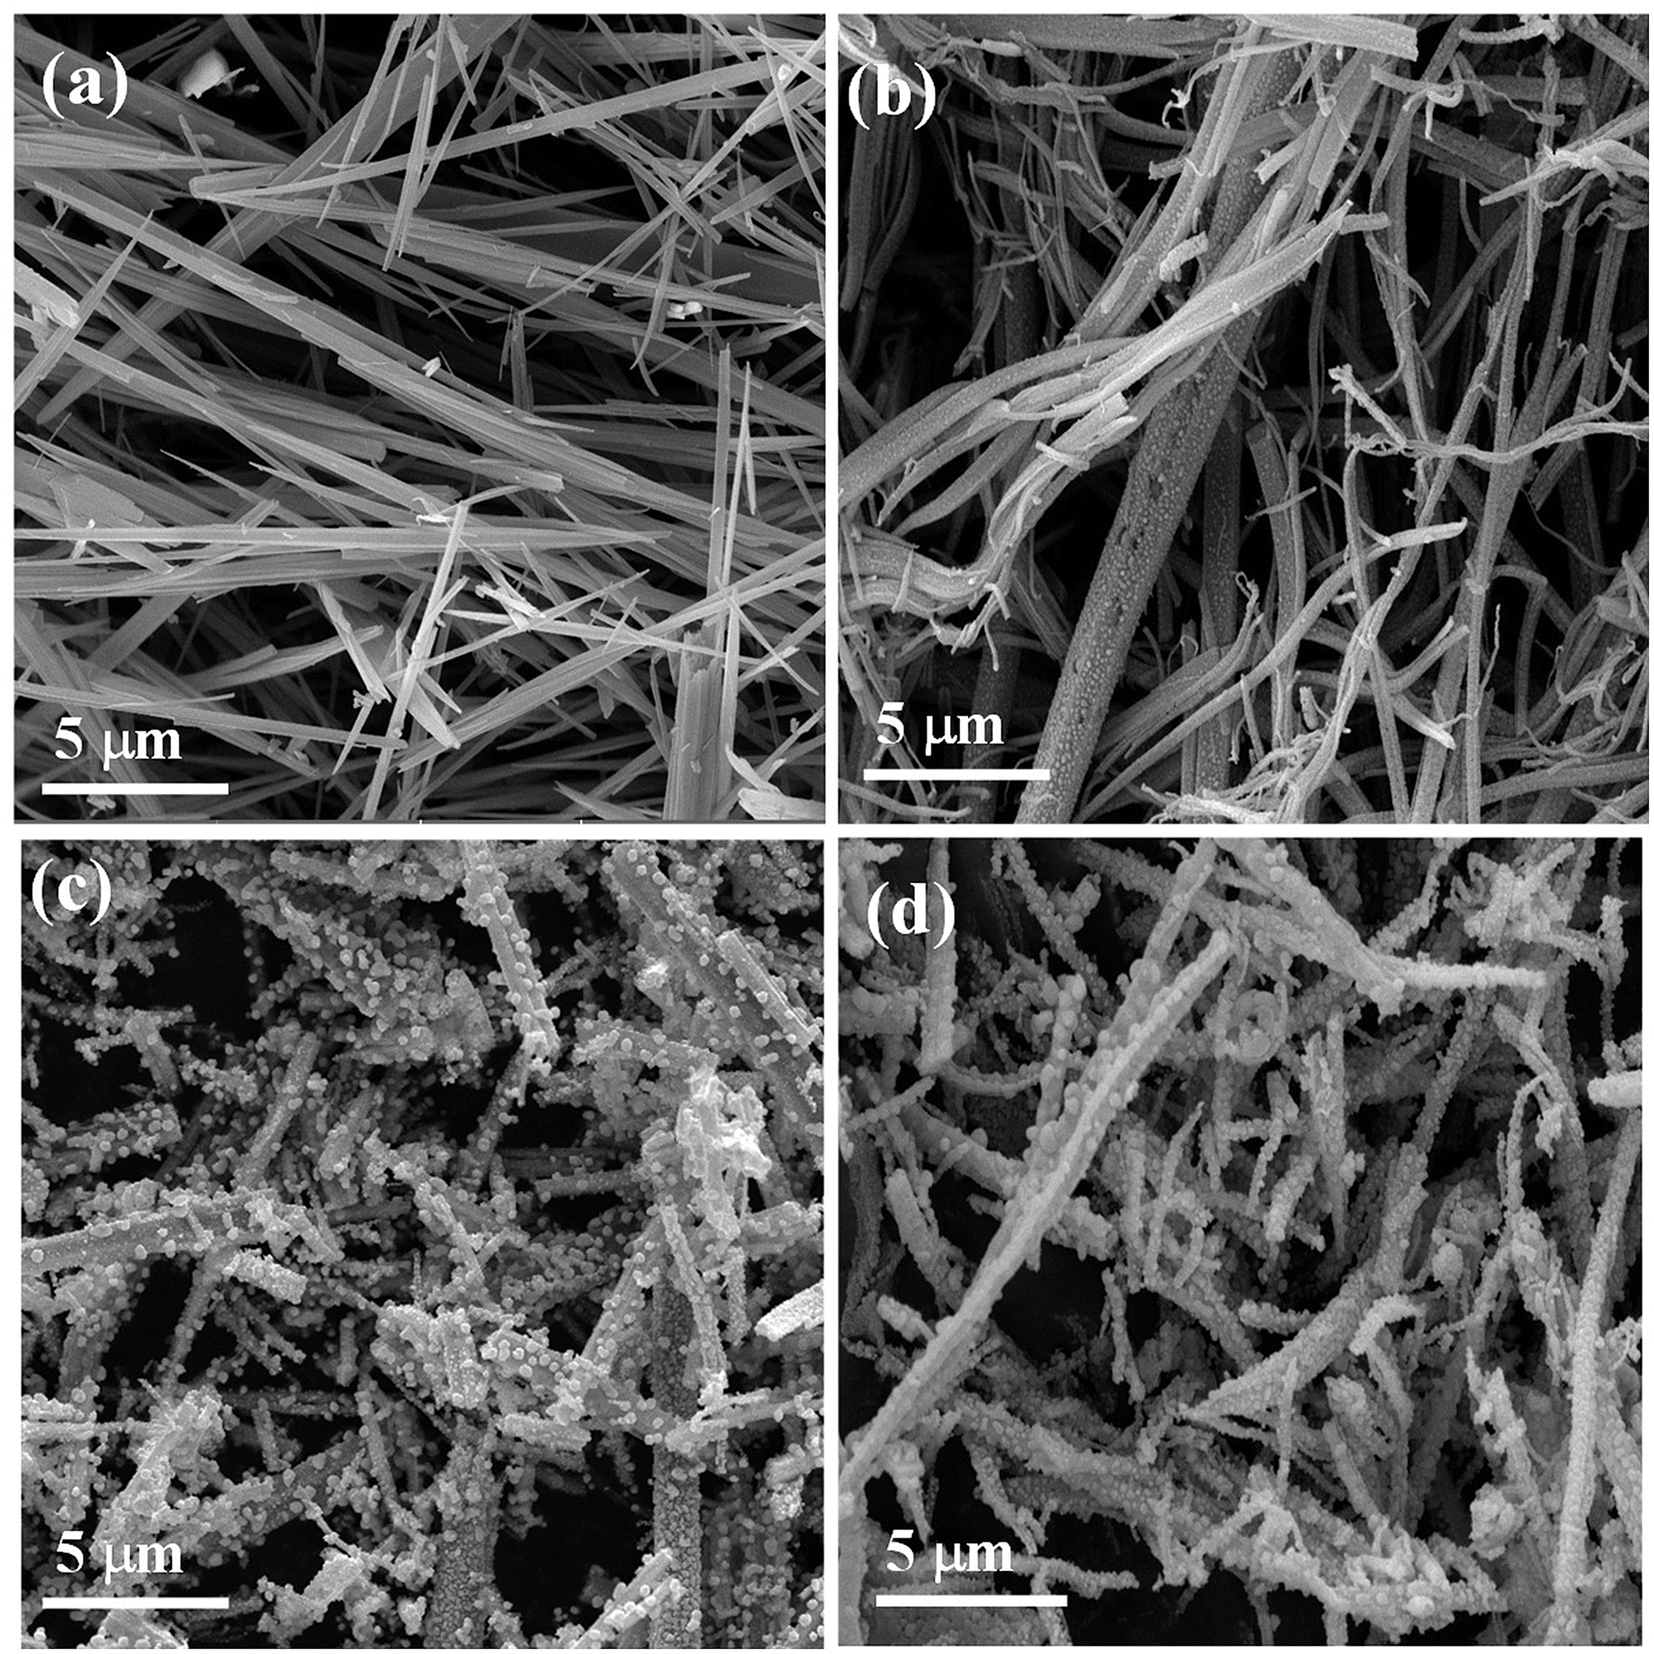 | ||
| Fig. 3 FESEM images of (a) NiFe–NTA, (b) NiFe–NC@800, (c) NixFe1−xSe2–NC@400, and (d) Ni3−xFexSe4–NC@550. | ||
 | ||
| Fig. 4 (a) TEM, (b–e) HRTEM and inverse FFT of corresponding images, and (f) HAADF-elemental mapping images of NixFe1−xSe2–NC@400, (g) TEM images, (h–k) HRTEM images and inverse FFT of corresponding images, and (l) HAADF-elemental mapping of Ni3−xFexSe4–NC@550. | ||
To gain insight into the elemental composition and valence state of NFSe–NC@400 and NFSe–NC@550 were investigated by XPS. The XPS survey spectra of NFSe–NC@400 and NFSe–NC@550 confirm the existence of Ni, Fe, Se, C, and N, shown in Fig. 5a and g. High-resolution Ni 2p (Fig. 5b) core level spectra of NFSe–NC@400 were deconvoluted into two pairs of spin–orbit doublets, Ni 2p1/2 and Ni 2p3/2. The peaks around 853.08 (Ni 2p3/2) and 870.59 eV (Ni 2p1/2) correspond to Ni2+, and peaks at 854.33 and 873.38 eV are attributed to oxidized Ni peaks. The ratio of Ni2+ to oxidized Ni peak is 0.68%. Two accompanying satellite peaks around 879.4 and 858.47 eV, indicating the coexistence of mixed valence species in both samples. The Ni 2p spectra of NFSe–NC@550 exhibit four prominent peaks with two satellite peak. The peaks at 856.1 and 873.7 eV are associated with Ni3+ 2p3/2 and 2p1/2, respectively, while those at 853.1 and 870.4 eV are associated to Ni2+ 2p3/2 and 2p1/2 which signifies the formation of Ni–Se bond. The ratio of Ni3+ to Ni2+ is 7.8%.46–48 Similarly, in the Fe 2p spectra (Fig. 5c and i), the peak at binding energies of 711.9–712.9 eV and 724.3–724.6 eV should be assigned to Fe 2p3/2 and Fe 2p1/2 of both NFSe–NC@400 and NFSe–NC@550.49,50 Notably, the apparent peak ratio difference in M2+ and M3+ in both the Ni regions and Fe 2p spectra indicates the successful formation of different nickel phases with Fe doping at various temperatures. As for the Se 3d spectra (Fig. 5d), two characteristics peak at 55.53 and 54.61 eV can be ascribed to M–Se in NFSe–NC@400 and different valence of Se 3d spectra (Se2− and Se4+) are deconvoluted for NFSe–NC@550 (Fig. 5j) along with oxidized species, suggesting the M–Se formation in Ni3Se4.51,52 In the N 1s region (Fig. 5e and k), the deconvoluted peaks at 398.5, 400.4, 401.03 and 403.2 eV are attributed to pyridinic–N, pyrrolic–N, graphitic–N and oxidized–N.53 Moreover, in the C 1s region (Fig. 5f and l), the binding energies at 284.69 and 285.6 eV for both samples correspond to graphitic sp2 carbon and C–N.54 Additionally, Raman spectroscopy was employed to further confirm the presence of carbon, as illustrated in Fig. S7.† The Raman characteristic peaks at 1356 cm−1 and 1576 cm−1 correspond to the disordered carbon (D-band) and graphitic carbon (G-band), respectively.43 Overall, these results indicate that Fe doping and the presence of N-doped carbon in nickel selenides implies a more significant electron transfer and a greater number of active sites. This improvement is crucial to further boost the efficiency of OER and ORR activities.
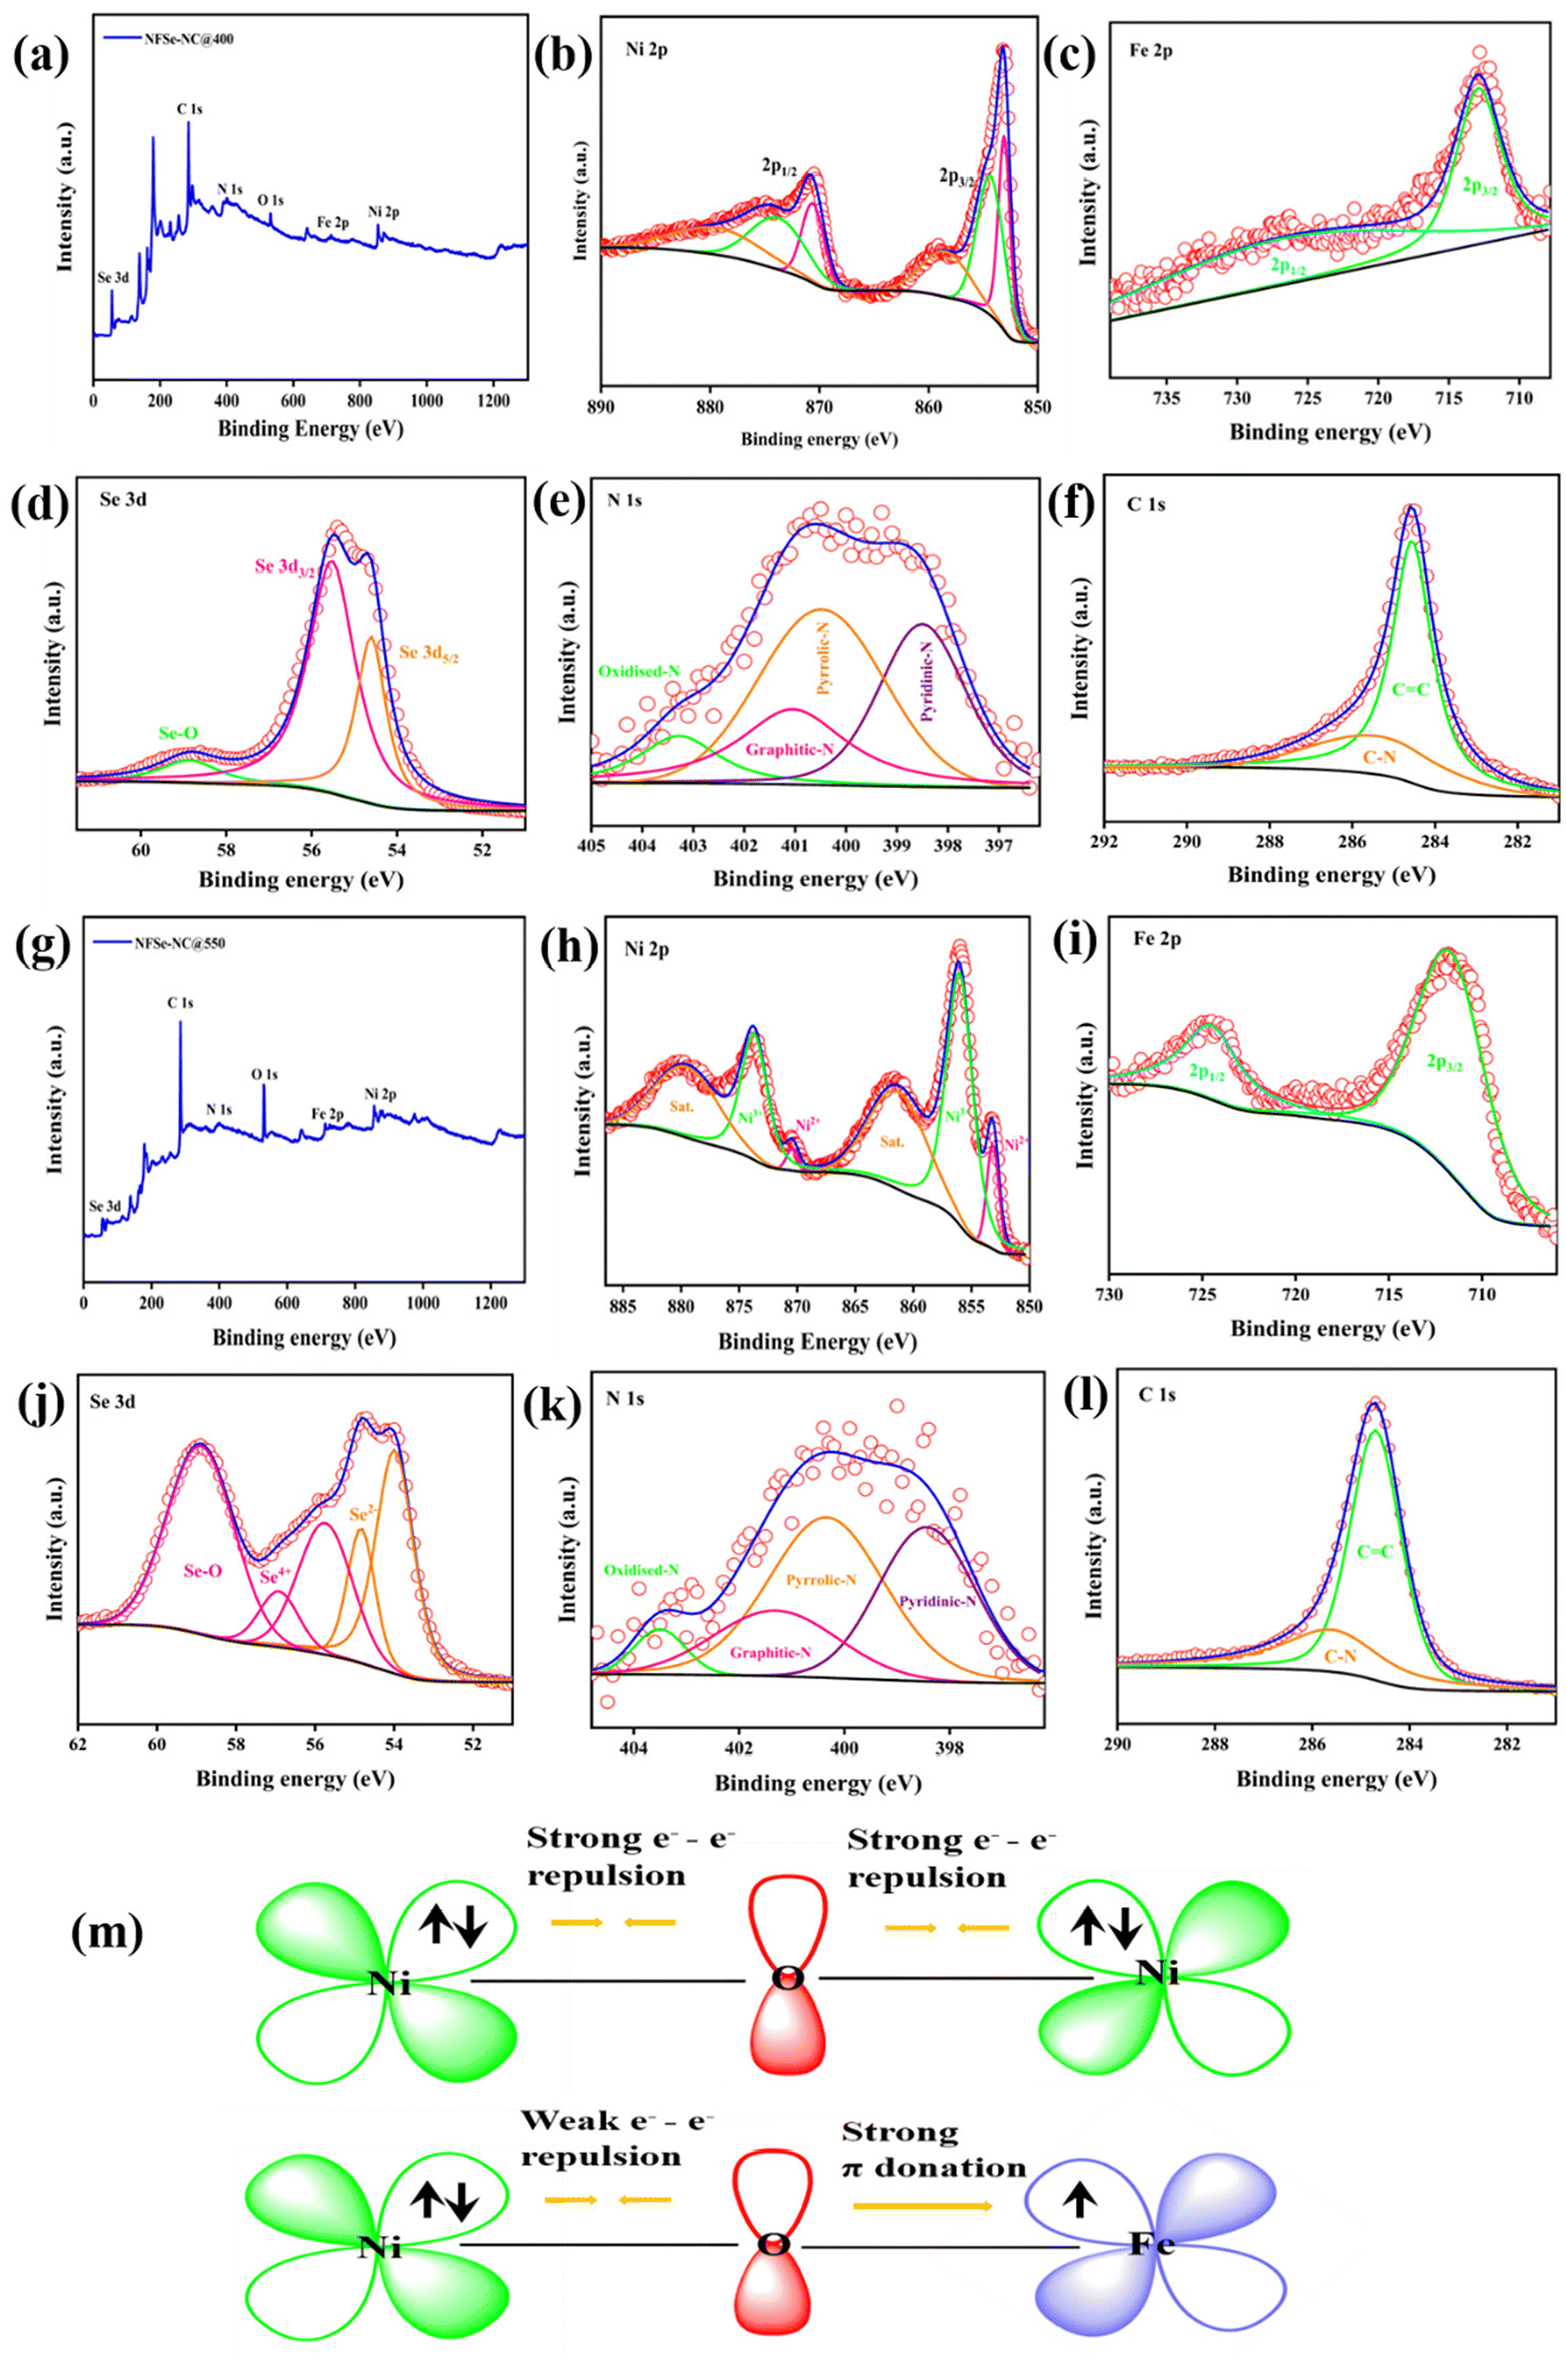 | ||
| Fig. 5 High-resolution XPS spectra of (a and g) survey scan (b and h) Ni 2p, (c and i) Fe 2p, (d and j) Se 3d, (e and k) N 1s, (f and l) C 1s of NixFe1−xSe2–NC@400 and Ni3−xFexSe4–NC@550, (m) schematic representation of electronic coupling of Ni–O–Fe in NixFe1−xSe2–NC@400. | ||
Compared to NSe–NC@400 and NSe–NC@550, the binding energies of NFSe–NC@400 and NFSe–NC@550 shifted owing to the electron-pulling effect, where Fe doping extracted a certain number of electrons from the Ni atom.55,56 The electronic interaction among Ni and Fe cations, based on the electronic configurations of Ni2+ (t2g6 eg2) and Fe3+ (t2g3 eg2), are supported by the literature.57,58 As depicted in Fig. 5m, Ni2+ has a fully occupied t2g6 eg2 configuration owing to its high-spin nature, which results in significant electron–electron repulsion within the fully filled π-symmetry (t2g) d orbital. On the other hand, Fe3+ (high-spin state) demonstrates strong π-donation due to the presence of three unpaired electrons in its (t2g3 eg2) d-orbital. As a result, Fe doping significantly impacts the electrocatalytic activity by facilitating electron transfer from Ni2+ to Fe3+ at the interface of Fe-doped NiSe2 and Ni3Se4, which is consistent with the XPS findings. This electron transfer alters the local electronic structure of the Ni species by modifying the eg orbital filling, which enhances the adsorption and desorption of oxygen species during electrocatalysis and adheres to Sabatier's principle. To confirm the role of Fe doping in NFSe–NC@400, and NFSe–NC@550, NSe–NC@400, and NSe–NC@550 were synthesized under the same conditions without the inclusion of Fe species using the NNTA coordination polymer. Therefore, we systematically analyzed the effect of Fe doping on the NiSe2 and Ni3Se4 phases to evaluate its impact on the catalytic activity. The XRD patterns, SEM images, and XPS data of the samples are shown in Fig. S4 and S6.†
To unveil the effects of doping on the catalytic activity of the samples, the electrocatalytic OER performance was evaluated in alkaline media (1 M KOH) using a three-electrode system at 5 mV s−1. Fig. 6a and b show the polarization curve with iR compensation and the corresponding overpotential plots of NFSe–NC@400, NFSe–NC@550, NSe–NC@400, NSe–NC@550, and commercial RuO2. The Fe-doped nickel selenide phases with N-doped carbon support had a significant impact on the OER activity, and NFSe–NC@400 displayed a low onset potential and high electrocatalytic activity. NFSe–NC@400 possesses a low overpotential of 253 mV at 10 mA cm−2 (η10), which demonstrates better activity than NFSe–NC@550 (η10 = 279 mV), NSe–NC@400 (η10 = 340 mV), NSe–NC@550 (η10 = 329 mV), and commercial RuO2 (η10 = 366 mV). In addition, NFSe–NC@400 required an overpotential of 283 mV to drive 50 mA cm−2 of electrocatalytic OER, which is much lower than that of the other catalysts. To determine the OER kinetics, Tafel plots were derived from the steady-state polarization curve using a static amperometric electrochemical technique at different potentials in the catalytic turnover region. The chronoamperometry (Fig. S9†) were conducted at different potentials at 0.002 V intervals for 120 s. This steady-state technique is a more reliable method for obtaining the Tafel slope than the usual Linear Sweep Voltammetry (LSV)-derived Tafel slope method.59 The steady-state OER current densities obtained at 120 s for each potential were plotted against the overpotentials (iR-corrected) to determine the Tafel slopes (Fig. 6c). NFSe–NC@400 (57.1 mV dec−1), and NFSe–NC@550 (63.3 mV dec−1) exhibit a lower Tafel slope than NSe–NC@400 (85.02 mV dec−1), NSe–NC@550 (71.6 mV dec−1), and RuO2 (82.3 mV dec−1), indicating better reaction kinetics. The low onset potential and accelerated kinetics enhanced the OER activity of NFSe–NC@400, which was achieved by fine-tuning the electronic structure and synergistic effect of Fe doping into the Ni site.
 | ||
| Fig. 6 (a) LSV curves, (b) required overpotential comparison at current densities 10 mA cm−2 and 50 mA cm−2, (c) Tafel plots derived from amperometry, (d) corresponding Nyquist plots at 1.58 V vs. RHE (inset EIS Circuit), (e) capacitive current against scan rates on different electrocatalysts, and (f) chronopotentiometry measurement at the OER current density of 20 mA cm−2 for NFSe–NC@400 electrode. | ||
Moreover, the resultant NFSe–NC@400 outperformed many other reported values for MOF-derived and selenide-based catalysts, as illustrated in Table S1.† Furthermore, electrochemical impedance spectroscopy determines the charge-transfer resistance (Rct) and solution resistance (Rs) to investigate the electrode kinetics during the electrocatalytic OER process. As presented in Fig. 6d, the Nyquist plot of the NFSe–NC@400 catalyst shows a low charge transfer resistance compared to those of the other catalysts, implying the fastest charge transfer and reaction kinetics. The equivalent circuit (inset in Fig. 6d) is fitted with the internal solution resistance, interfacial impedance between the catalyst and substrate, and interfacial resistance. Fe doping into the catalyst improves the conductivity of the catalyst and enhances the active sites, which indicates that the electrode–electrolyte interface interaction is feasible for the OER process. NFSe–NC@550 and NSe–NC@550 also followed a similar trend, whereas Fe doping decreased the charge transfer resistance.
The double-layer capacitance (Cdl) was evaluated using cyclic voltammetry at various sweep rates within the non-faradaic region (−0.05 to 0.15 V vs. Hg/HgO), with detailed CV curves in Fig. S10.†Fig. 6e shows that the capacitive current was plotted against scan rates for different samples to determine Cdl and subsequently estimate the electrochemical surface area (ECSA); detailed ECSA calculations are provided in the ESI.† NFSe–NC@550 demonstrated an enhanced ECSA value of 12.85 compared to 10.87 of NSe–NC@550. This improvement is assigned to the effective modulation of the electronic structure in the Ni3Se4 phase, which significantly increases the exposure of active sites, leading to enhanced OER activity. In the case of the NiSe2 phase, although NFSe–NC@400 has a smaller ECSA (12.13) compared to NSe–NC@400 (17.12), it still exhibits superior catalytic performance, indicating that a larger ECSA does not necessarily translate to better electrocatalytic efficiency. In addition to the activity and Tafel slope, durability tests are also critical for practical applications. The durability of the NFSe–NC@400 catalyst was assessed through chronopotentiometry at a constant current density of 20 mA cm−2, indicating that the potential remained stable for around 70 hours with minimal variation (Fig. 6f).
Furthermore, to unravel the intrinsic activity of the catalysts, their turnover frequency (TOF) was analyzed to compare the rate of oxygen evolution per site. TOF values (Fig. 7a) of NFSe–NC@400 and NFSe–NC@550 are 0.078 s−1 and 0.042 s−1 at a potential of 1.49 V, which outperforms the NSe–NC@400 (0.0074 s−1), NSe–NC@550 (0.0085 s−1) and RuO2 (0.0013 s−1). The exchange current density is a crucial parameter for assessing the intrinsic activity of a catalyst and can be determined from the intersection of the Tafel curve's tangent with the line representing E = E0 (where E0 for OER is 1.23 V vs. RHE). A higher exchange current density indicates a more effective electrocatalyst, and is obtained by extrapolating the linear fit from the Tafel slope to the intersection of the logarithmic current density scale at the equilibrium potential of the OER process. From Fig. 7b, NFSe–NC@400 demonstrates the highest exchange current density of 0.283 mA cm−2, surpassing other catalysts: NFSe–NC@550 (0.5 × 10⁻³ mA cm−2), NSe–NC@400 (0.035 mA cm−2), and NSe–NC@550 (0.3 × 10⁻⁵ mA cm−2). This exceptional intrinsic activity, reflected in both the turnover frequency (TOF) and exchange current density, highlights the superior performance of Fe-doped nickel selenides compared to monometallic catalysts, which is attributed to the favorable modifications in their electronic structure. To further corroborate the intrinsic activity of NFSe–NC@400, the current density was normalized to the ECSA values. As presented in Fig. 7c, the JECSA follows the same trend as the LSV curve shown in Fig. 6a, reflecting the intrinsic nature of NFSe–NC@400. For selective water oxidation for the OER, the selectivity of the catalyst was evaluated using a rotating ring-disk electrode (RRDE) to obtain the faradaic efficiency (FE). The FE (Fig. 7d) of NFSe–NC@400 is 96%, implying that the observed current is solely due to water oxidation.
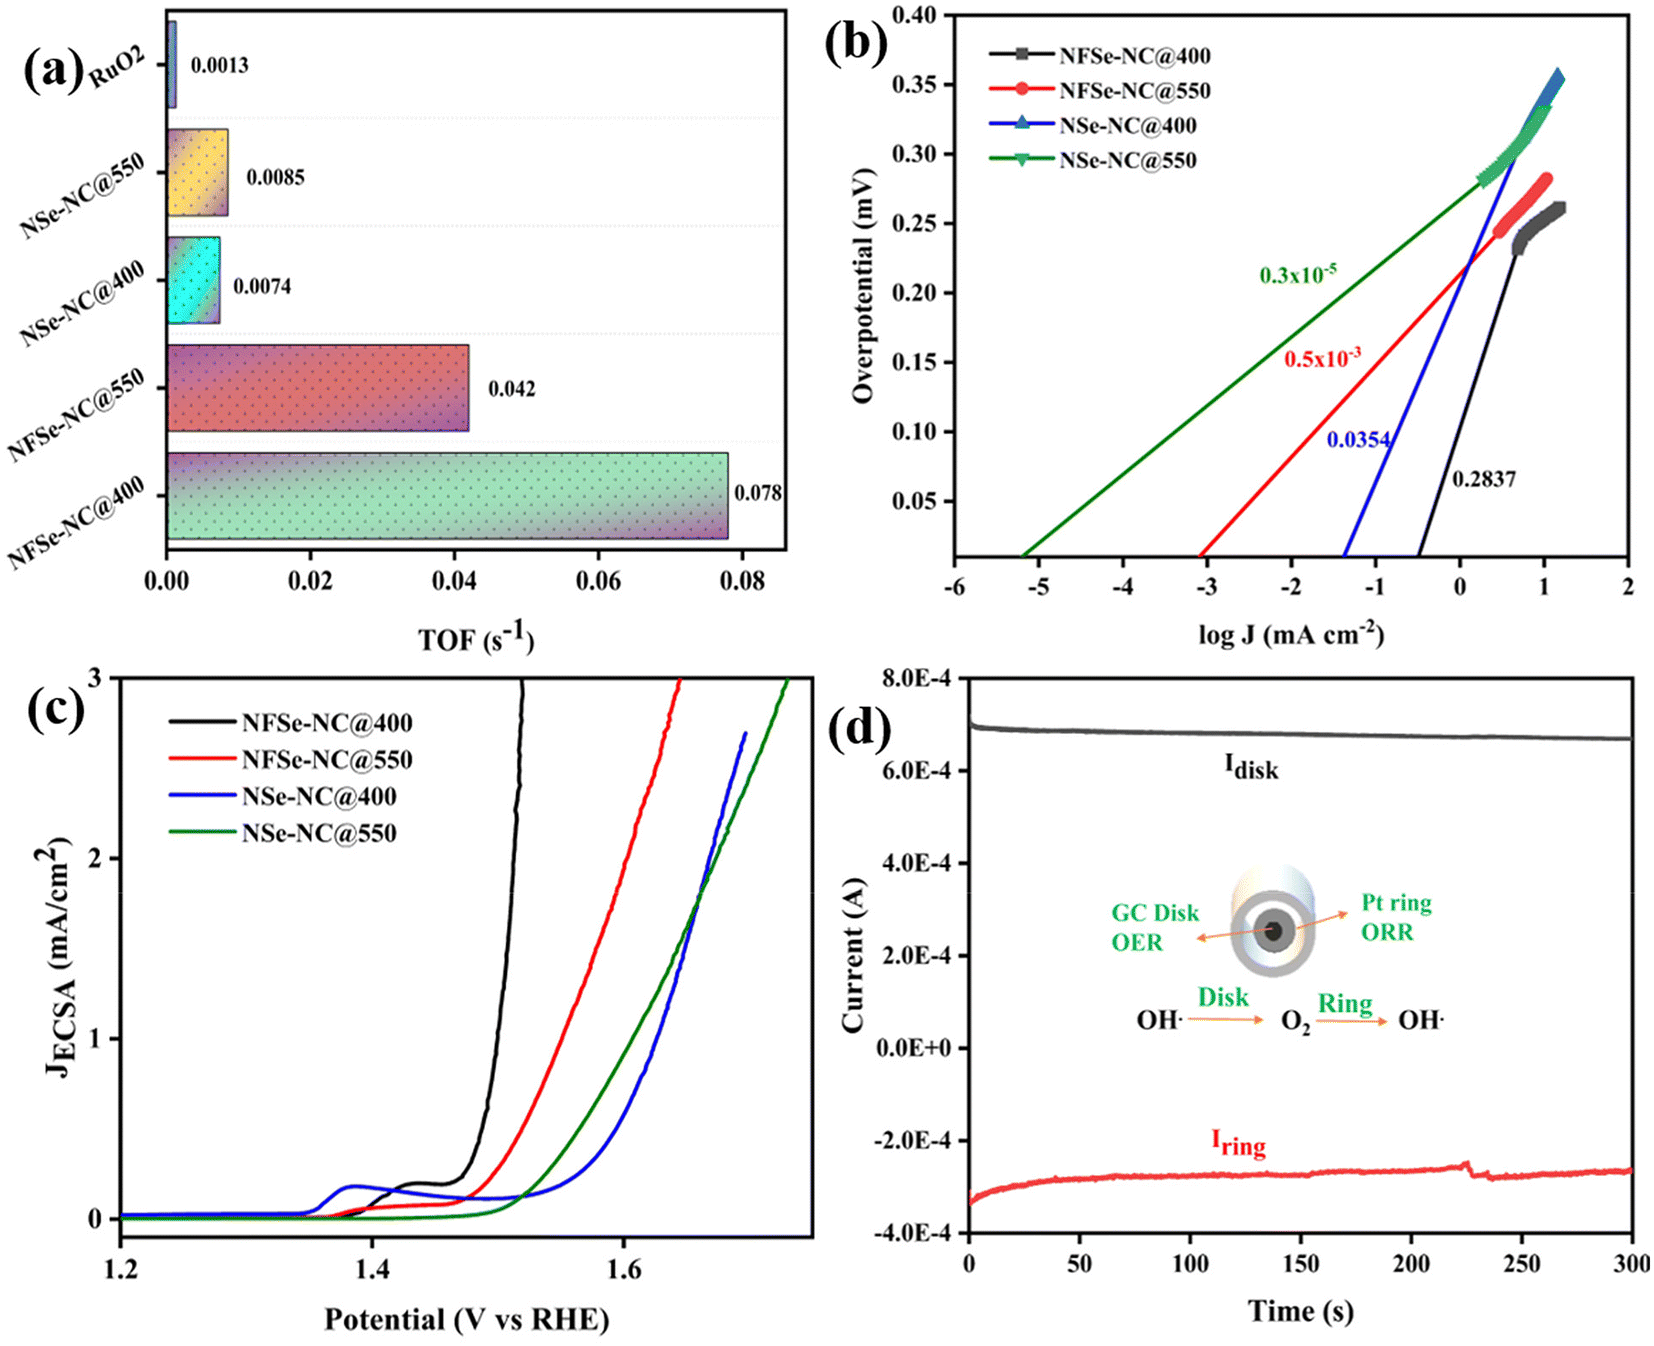 | ||
| Fig. 7 (a) TOF values at 1.49 V, (b) exchange current density, (c) ECSA derived LSV of different electrocatalysts, and (d) faradaic efficiency measurement using RRDE for NFSe–NC@400. | ||
In order to understand the durability and structural change of the NFSe–NC@400 sample, various spectroscopic techniques were employed to investigate the active sites in Fe-doped NiSe2–NC. The XRD results are shown in Fig. S12,† indicating that the metal selenide phase had completely disappeared. This loss is attributed to the dissolution of selenides and subsequent formation of oxygen. Furthermore, the morphology of the samples was examined using FESEM, as shown in Fig. S13.† A deeper investigation revealed that the nanorods aggregated owing to prolonged exposure of NFSe–NC@400 to a strongly alkaline medium, primarily influenced by the evolution of oxygen bubbles. After 70 h of OER testing, post-OER analysis of the NFSe–NC@400 sample revealed notable changes in its surface electronic structure. High-resolution XPS spectra of Ni 2p, Fe 2p, Se 3d, and O 1s were obtained after anodic polarization. The Ni 2p spectrum in Fig. S14a† indicates that the peak shifted to higher binding energies, with an increased intensity of the Ni oxide peak compared to that of the pristine NFSe–NC@400 and subsequent surface reconstruction, indicating the formation of oxyhydroxides that enhance the OER activity.30 The shifted Ni oxide peak indicates the presence of Ni–OOH or Ni–Fe–OOH intermediates, which serve as new catalytic sites for the OER.60,61 Concurrently, Fig. S14b† shows the Fe oxidation, reflecting the surface oxidation of both Ni and Fe to their oxidized phases. Furthermore, to verify the absence of the Ni–Se bond, Se 3d XPS spectra revealed no detectable signal (Fig. S14c†), indicating dissolution of selenides. Additionally, the O 1s spectrum (Fig. S14d†) revealed an increased intensity of oxygen after the 70 hour stability test.
To elucidate the bifunctional nature of the developed catalyst, its ORR electrokinetic activity was measured using a RDE to avoid mass transfer loss during the ORR. The polarization curve for ORR (Fig. 8a) was plotted in O2-saturated 0.1 M KOH at a rotating speed of 2000 rpm. NFSe–NC@400 could readily achieve a lesser onset potential of 0.85 V (vs. RHE) and a maximum limiting current density of 4.12 mA cm−2, comparable to Pt/C with a maximum current density of 4.9 mA cm−2. These nitrogen-doped carbon (NC-doped) catalysts possess enhanced ORR electrocatalytic activity in alkaline electrolytes because of the higher degree of graphitization, resulting in better electrical conductivity.53 Moreover, NFSe–NC@400 exhibited superior electrocatalytic ORR performance compared with NFSe–NC@550, achieving a peak current density of 3.38 mA cm−2. To highlight the benefits of Fe doping in oxygen electrocatalysis, the ORR performance of NSe–NC@400 and NSe–NC@550 was evaluated under identical conditions. Both NFSe–NC@400 and NFSe–NC@550 exhibited markedly improved ORR activity compared to NSe–NC@400 and NSe–NC@550, with the maximum limiting current densities of 2.53 mA cm−2 and 2.02 mA cm−2, respectively. To gain a deeper understanding of the electrocatalytic activity and kinetics of the ORR, Tafel plots derived from the polarization curves were analyzed (Fig. 8b). The NFSe–NC@400 catalyst exhibited the fastest kinetics, as indicated by its lower Tafel slope of −34.8 mV dec−1, outperforming all other catalysts, including NFSe–NC@550 (−129.6 mV dec−1), NSe–NC@400 (−35.4 mV dec−1), NSe–NC@550 (−103.9 mV dec−1), and Pt/C (−62.9 mV dec−1). The superior electrocatalytic activity and accelerated kinetics of NFSe–NC@400 were attributed to the enhanced conductivity provided by NC doping and the optimized electronic structure achieved through Fe doping. Furthermore, NFSe–NC@400 surpassed many of the reported Tafel slope values for metal selenides and various NC-doped metal-based catalysts, as shown in Table S2.†
 | ||
| Fig. 8 (a) ORR polarization curves at 2000 rpm, (b) corresponding tafel plots of different electrocatalysts, (c) Koutecky–Levich (K–L) plots of the NFSe–NC@400 at different applied potentials, and (d) electron transfer number (n) and selectivity of H2O2 within the potential sweep of NFSe–NC@400. | ||
LSV was conducted at different rotation speeds using Koutecky–Levich (K–L) plots at different potentials. The K–L plot of NFSe–NC@400 (Fig. 8c) manifests good linearity over the potential range of 0.6 V to 0.3 V (V vs. RHE) and implies the first-order kinetics. The electron transfer number n was determined to be two (n = 2), suggesting a two-electron transfer process responsible for the selective production of H2O2. Rotating ring-disk electrode (RRDE) measurements were further used to determine the electron transfer number (n) and selectivity towards H2O2 production. In Fig. 8d, n remains consistently around 2, with the selectivity towards H2O2 approximately 61% within the potential range of 0.1 V to 0.6 V. The enhanced H2O2 production observed in our carbon-incorporated nickel selenides suggests that the catalyst effectively prevents the breaking of the O–O bond, favoring the reduction to HO2− (O2 → HO2− → H2O2).62 The synergistic effect of Fe-doped NC within the nickel selenides and the shorter diffusion path for H2O2 from the catalyst layer to the bulk electrolyte likely contribute to the high H2O2 selectivity over a broad potential window. Detailed calculations of the electron transfer number and H2O2 selectivity are provided in the ESI.†
The position of the d-band center relative to the Fermi level is crucial in determining electrocatalytic activity, particularly in transition metals and their alloys. Hammer and Norskov pioneered the development of the d-band center model, which links the electronic structure of a transition metal to its reactivity by calculating the weighted average energy of its d-band (the “d-band center”). This model provides a clear explanation for the adsorption behavior of intermediate atoms.63 Subsequently, photoelectron spectroscopy (PES) has become a widely used technique for experimentally probing the electronic structure of the surface atoms of transition metals.64 The electrocatalytic activity of a catalyst is significantly influenced by the binding energy of the intermediates (e.g., *OH, *O, and *OOH), which must be optimized (neither too strong nor too weak) to achieve high catalytic efficiency.65 The valence band spectra of all the catalysts were acquired using XPS, and the background was subtracted from the spectra using a Shirley-type background (Fig. S15†) to determine the d-band center. The developed catalyst for the OER and ORR remains optimized relative to the Fermi level during metal–adsorbate interactions and thus exhibits enhanced electrocatalytic activity by maintaining an optimal adsorption strength. The probable mechanism for OER and ORR are shown in Fig. S16a and b.†
Conclusions
In summary, we successfully implemented a strategy for Fe doping in NC-supported nickel selenides (NiSe2 and Ni3Se4) using a single MOF precursor through a simple hydrothermal process followed by carbonization and selenization. XPS and HRTEM-EDS analyses confirmed the integration of Fe within the nickel selenide phase. More specifically, NFSe–NC@400 exhibited superior electrocatalytic OER activity, achieving a lower overpotential at 10 mA cm−2 and demonstrating 70 hours of stability. This is primarily attributed to electron transfer from Ni to Fe, which increases the Ni3+ content, thereby enhancing the OER activity. Similarly, NFSe–NC@400 outperformed the state-of-the-art Pt/C catalyst for H2O2 production in alkaline ORR, exhibiting a higher limiting current density and faster kinetics (Tafel slope). This enhanced performance results from the synergistic effects of NC incorporation and Fe doping in nickel selenides, which effectively inhibit the cleavage of the O–O bond and facilitate HO2− production. This study provides fundamental insights into the development of cost-effective, stable, and noble–metal-free bifunctional oxygen electrocatalysts through Fe doping, which modifies the electronic structure for enhanced performance.Author contributions
Vigneshraaj A. S.: data curation, data analysis, conceptualization, investigation, writing. Siva Kumar Ramesh: conceptualization, writing – review & editing. Jinkwon Kim: supervision. Kavita Pandey: supervision, funding acquisition, project administration, writing – review & editing.Data availability
The data that support the findings of this study are available from the corresponding author upon reasonable request. The data supporting this article have been included as part of the ESI.†Conflicts of interest
The authors declare no conflict of interest.Acknowledgements
The authors are grateful for financial support from the Department of Science and Technology. The authors also thank Central research facility, CeNS for the facilities, and Jawaharlal Nehru Centre For Advanced Scientific Research for the XPS facility. K. P. and V. A. S. thanks Science and Engineering Research Board for funding. V. A. S. thanks Dr Thulasi Radhakrishnan and Dr Muhammed Safeer N. K. for their support.References
- Y. Jiao, Y. Zheng, M. Jaroniec and S. Z. Qiao, Chem. Soc. Rev., 2015, 44, 2060–2086 RSC.
- M. Kuang and G. Zheng, Small, 2016, 12, 5656–5675 CrossRef CAS PubMed.
- T. A. Shifa, F. Wang, Z. Cheng, X. Zhan, Z. Wang, K. Liu, M. Safdar, L. Sun and J. He, Nanoscale, 2015, 7, 14760–14765 Search PubMed.
- A. K. Samantara and S. Ratha, Metal Oxides/Chalcogenides and Composites, 2019, Springer Cham, p. 83 Search PubMed.
- Y. Zhao, P. Zhang, Z. Yang, L. Li, J. Gao, S. Chen, T. Xie, C. Diao, S. Xi, B. Xiao, C. Hu and W. Choi, Nat. Commun., 2021, 12, 1–11 Search PubMed.
- F. Xue, Y. Si, M. Wang, M. Liu and L. Guo, Nano Energy, 2019, 62, 823–831 CrossRef CAS.
- H.-F. Wang, C. Tang, Q. Zhang, H. Wang, C. Tang and Q. Zhang, Adv. Funct. Mater., 2018, 28, 1803329 CrossRef.
- J. Ding, H. Yang, H. Zhang, Z. Wang, Q. Liu, L. Feng, G. Hu, J. Luo and X. Liu, Int. J. Hydrogen Energy, 2024, 53, 318–324 CrossRef CAS.
- R. Kötz, H. J. Lewerenz and S. Stucki, J. Electrochem. Soc., 1983, 130, 825–829 Search PubMed.
- Z. F. Huang, J. Wang, Y. Peng, C. Y. Jung, A. Fisher and X. Wang, Adv. Energy Mater, 2017, 7, 1700544 Search PubMed.
- A. Zadick, L. Dubau, N. Sergent, G. Berthomé and M. Chatenet, ACS Catal., 2015, 5, 4819–4824 CrossRef CAS.
- W. Liu, W. Liu, T. Hou, J. Ding, Z. Wang, R. Yin, X. San, L. Feng, J. Luo and X. Liu, Nano Res., 2024, 17, 4797–4806 CrossRef CAS.
- M. Chen, J. Ma, C. Chen, J. Ding, Y. Liu, H. He, Q. Liu, G. Hu, Y. Wu and X. Liu, Chem. Eng. J., 2024, 498, 155302 CrossRef CAS.
- C. Tang, H. F. Wang and Q. Zhang, Acc. Chem. Res., 2018, 51, 881–889 CrossRef CAS PubMed.
- B. Hinnemann, P. G. Moses, J. Bonde, K. P. Jørgensen, J. H. Nielsen, S. Horch, I. Chorkendorff and J. K. Nørskov, J. Am. Chem. Soc., 2005, 127, 5308–5309 CrossRef CAS PubMed.
- Y. Li, H. Wang, L. Xie, Y. Liang, G. Hong and H. Dai, J. Am. Chem. Soc., 2011, 133, 7296–7299 CrossRef CAS.
- Y. Gorlin and T. F. Jaramillo, J. Am. Chem. Soc., 2010, 132, 13612–13614 CrossRef CAS.
- J. Li, G. Liu, B. Liu, Z. Min, D. Qian, J. Jiang and J. Li, Electrochim. Acta, 2018, 265, 577–585 CrossRef CAS.
- K. Zhang, Y. Li, S. Deng, S. Shen, Y. Zhang, G. Pan, Q. Xiong, Q. Liu, X. Xia, X. Wang and J. Tu, ChemElectroChem, 2019, 6, 3530–3548 CrossRef CAS.
- H. Furukawa, K. E. Cordova, M. O’Keeffe and O. M. Yaghi, Science, 2013, 341, 1230444 CrossRef.
- L. Chen, R. Luque and Y. Li, Chem. Soc. Rev., 2017, 46, 4614–4630 RSC.
- D. Li, H. Q. Xu, L. Jiao and H. L. Jiang, EnergyChem, 2019, 1, 100005 CrossRef.
- Y. Valentino Kaneti, J. Tang, R. R. Salunkhe, X. Jiang, A. Yu, K. C.-W. Wu, Y. Yamauchi, Y. V. Kaneti, J. Tang, R. R. Salunkhe, Y. Yamauchi, X. C. Jiang, A. B. Yu and K. C.-W. Wu, Adv. Mater., 2017, 29, 1604898 CrossRef.
- S. Dang, Q. L. Zhu and Q. Xu, Nat. Rev. Mater., 2017, 3, 1–14 Search PubMed.
- J. Chen, H. Li, C. Fan, Q. Meng, Y. Tang, X. Qiu, G. Fu, T. Ma, J. Chen, C. Fan, Q. Meng, Y. Tang, X. Qiu, H. Li, G. Fu and T. Ma, Adv. Mater., 2020, 32, 2003134 CrossRef CAS.
- Y. Huang, Y. Wang, C. Tang, J. Wang, Q. Zhang, Y. Wang and J. Zhang, Adv. Mater., 2019, 31, 1803800 CrossRef.
- I. Pathak, S. Prabhakaran, D. Acharya, K. Chhetri, A. Muthurasu, Y. R. Rosyara, T. Kim, T. H. Ko, D. H. Kim and H. Y. Kim, Small, 2024, 20, 2406732 CrossRef CAS.
- W. Guo, H. Pang, X. Yang, L. Li, J. Peng, M. Zhao, C. Hou, Y. Zhu and F. Meng, J. Mater. Chem. A, 2024, 12, 15781–15791 RSC.
- Y. Guo, C. Zhang, J. Zhang, K. Dastafkan, K. Wang, C. Zhao and Z. Shi, ACS Sustainable Chem. Eng., 2021, 9, 2047–2056 CrossRef CAS.
- K. Srinivas, F. Ma, Y. Liu, Z. Zhang, Y. Wu and Y. Chen, ACS Appl. Mater. Interfaces, 2022, 14, 52927–52939 CrossRef CAS.
- Y. Kumon, S. Bolar, T. Fujita and Z. X. Cai, J. Alloys Compd., 2024, 1002, 175374 CrossRef CAS.
- Y. Wang, H. Huang, J. Wu, H. Yang, Z. Kang, Y. Liu, Z. Wang, P. W. Menezes and Z. Chen, Adv. Sci., 2023, 10, 2205347 CrossRef CAS.
- J. Masud, A. T. Swesi, W. P. R. Liyanage and M. Nath, ACS Appl. Mater. Interfaces, 2016, 8, 17292–17302 CrossRef CAS.
- C. Xie, Q. Wang, C. Xiao, L. Yang, M. Lan, S. Yang, J. Xiao, F. Xiao and S. Wang, Carbon, 2021, 178, 640–648 CrossRef CAS.
- G. Zhang, Y. S. Feng, W. T. Lu, D. He, C. Y. Wang, Y. K. Li, X. Y. Wang and F. F. Cao, ACS Catal., 2018, 8, 5431–5441 CrossRef CAS.
- Y. Sun, C. R. Wu, T. Y. Ding, J. Gu, J. W. Yan, J. Cheng and K. H. L. Zhang, Chem. Sci., 2023, 14, 5906–5911 RSC.
- F. Dionigi, Z. Zeng, I. Sinev, T. Merzdorf, S. Deshpande, M. B. Lopez, S. Kunze, I. Zegkinoglou, H. Sarodnik, D. Fan, A. Bergmann, J. Drnec, J. F. de Araujo, M. Gliech, D. Teschner, J. Zhu, W. X. Li, J. Greeley, B. Roldan Cuenya and P. Strasser, Nat. Commun., 2020, 11, 1–10 Search PubMed.
- N. Li, D. K. Bediako, R. G. Hadt, D. Hayes, T. J. Kempa, F. Von Cube, D. C. Bell, L. X. Chen and D. G. Nocera, Proc. Natl. Acad. Sci. U. S. A., 2017, 114, 1486–1491 CrossRef CAS.
- S. Anantharaj, S. Kundu and S. Noda, Nano Energy, 2021, 80, 105514 CrossRef CAS.
- J. Wang, X. Liu, T. Liao, C. Ma, B. Chen, Y. Li, X. Fan and W. Peng, Appl. Catal., B, 2024, 341, 123344 CrossRef CAS.
- G. Liu, K. Wang, X. Gao, D. He and J. Li, Electrochim. Acta, 2016, 211, 871–878 CrossRef CAS.
- G. Liu, R. Yao, Y. Zhao, M. Wang, N. Li, Y. Li, X. Bo, J. Li and C. Zhao, Nanoscale, 2018, 10, 3997–4003 RSC.
- H. Luo, C. Lin, H. Zhou, Y. Zhao, X. Wang, D. Zhang and Y. Yu, Adv. Mater. Interfaces, 2022, 9, 2102110 CrossRef CAS.
- L. Shi, H. Fang, X. Yang, J. Xue, C. Li, S. Hou and C. Hu, ChemSusChem, 2021, 14, 1710–1719 CrossRef CAS.
- Y. Kumon, S. Bolar, T. Fujita and Z. X. Cai, J. Alloys Compd., 2024, 1002, 175374 CrossRef CAS.
- X. Xu, F. Song and X. Hu, Nat. Commun., 2016, 7, 1–7 Search PubMed.
- L. Zhai, C. H. Mak, J. Qian, S. Lin and S. P. Lau, Electrochim. Acta, 2019, 305, 37–46 CrossRef CAS.
- Y. Du, G. Cheng and W. Luo, Nanoscale, 2017, 9, 6821–6825 RSC.
- G. Yang, J. Jiao, Y. Fu, Y. Lin, W. Wang, D. Gao and J. Li, J. Phys. Chem. Solids, 2023, 182, 111576 CrossRef CAS.
- Y. Sun, K. Xu, Z. Wei, H. Li, T. Zhang, X. Li, W. Cai, J. Ma, H. Jin Fan, Y. Li, Y. Q. Sun, H. L. Li, T. Zhang, X. Y. Li, W. P. Cai, Y. Li, K. Xu, H. J. Fan, Z. X. Wei and J. M. Ma, Adv. Mater., 2018, 30, 1802121 CrossRef PubMed.
- X. Chen, X. Wang, X. Zhang, D. Liu, K. Srinivas, F. Ma, B. Wang, B. Yu, Q. Wu and Y. Chen, Int. J. Hydrogen Energy, 2021, 46, 35198–35208 CrossRef CAS.
- S. Anantharaj, J. Kennedy and S. Kundu, ACS Appl. Mater. Interfaces, 2017, 9, 8714–8728 CrossRef CAS.
- H. Tang, S. Cai, S. Xie, Z. Wang, Y. Tong, M. Pan, X. Lu, H. Tang, S. Cai, M. Pan, S. Xie, Y. Tong, X. Lu and Z. Wang, Adv. Sci., 2016, 3, 1500265 CrossRef.
- S. Liu, Z. Wang, S. Zhou, F. Yu, M. Yu, C.-Y. Chiang, W. Zhou, J. Zhao, J. Qiu, S. H. Liu, Z. Y. Wang, M. Z. Yu, J. S. Qiu, S. Zhou, J. J. Zhao, F. J. Yu, C. Chiang and W. Z. Zhou, Adv. Mater., 2017, 29, 1700874 CrossRef PubMed.
- C. Mahala, M. Devi Sharma and M. Basu, ChemElectroChem, 2019, 6, 3488–3498 CrossRef CAS.
- Q. Zhao, J. Yang, M. Liu, R. Wang, G. Zhang, H. Wang, H. Tang, C. Liu, Z. Mei, H. Chen and F. Pan, ACS Catal., 2018, 8, 5621–5629 CrossRef CAS.
- X. Li, M. Chen, Y. Ye, C. Chen, Z. Li, Y. Zhou, J. Chen, F. Xie, Y. Jin, N. Wang and H. Meng, Small, 2023, 19, 2207086 CrossRef CAS.
- L. Lv, Y. Chang, X. Ao, Z. Li, J. G. Li, Y. Wu, X. Xue, Y. Cao, H. Guo and C. Wang, Mater. Today Energy, 2020, 17, 100462 CrossRef.
- S. Anantharaj and S. Noda, Mater. Today Energy, 2022, 29, 101123 CrossRef CAS.
- X. L. Yin and X. P. Dai, J. Fuel Chem. Technol., 2023, 51, 1470–1477 CrossRef CAS.
- M. Ghaemmaghami, Y. Yamini, E. Saievar-Iranizad and A. Bayat, Sustainable Energy Fuels, 2020, 4, 1150–1156 RSC.
- L. Roldán, L. Truong-Phuoc, A. Ansón-Casaos, C. Pham-Huu and E. García-Bordejé, Catal. Today, 2018, 301, 2–10 CrossRef.
- B. Hammer, J. K. Nørskov, B. Hammer and J. K. Nørskov, Surf. Sci., 1995, 343, 211–220 CrossRef CAS.
- B. J. Lindberg, K. Hamrin, G. Johansson, U. Gelius, A. Fahlman, C. Nordling and K. Siegbahn, Phys. Scr., 1970, 1, 286 CrossRef CAS.
- Z. W. She, J. Kibsgaard, C. F. Dickens, I. Chorkendorff, J. K. Nørskov and T. F. Jaramillo, Science, 2017, 355, 4998 CrossRef PubMed.
Footnote |
| † Electronic supplementary information (ESI) available. See DOI: https://doi.org/10.1039/d4nr04047c |
| This journal is © The Royal Society of Chemistry 2025 |