
How do pore sizes affect the oxygen reduction reaction kinetics of platinum electrodes?†
Kota
Nakahara‡
 a,
Atsunori
Ikezawa§
*a,
Junichi
Inamoto
b,
Takeyoshi
Okajima
a and
Hajime
Arai
a
a,
Atsunori
Ikezawa§
*a,
Junichi
Inamoto
b,
Takeyoshi
Okajima
a and
Hajime
Arai
a
aSchool of Materials and Chemical Technology, Institute of Science Tokyo, Yokohama 226-8501, Japan. E-mail: ikezawa@mct.isct.ac.jp
bGraduate School of Engineering, University of Hyogo, Himeji 671-2280, Japan
First published on 14th April 2025
Abstract
The high overpotential of the oxygen reduction reaction (ORR) must be reduced to meet its expected role in energy conversion. Due to its high catalytic activity and stability, the electrocatalyst material has been mostly limited to expensive Pt. Therefore, much research has been conducted to reduce its loading by increasing the specific surface area and specific activity. Each enhancement is achieved by employing a porous geometry and changing the electronic structure. However, the effect of the pore size on its specific activity has not been clarified. In this study, we elucidate the relationship between the pore size and the oxygen reduction reaction kinetics by fabricating platinum model electrodes with hexagonally aligned cylindrical pores with sizes of 1.3, 1.8, and 3.0 nm. Electrochemical measurements reveal the quasi-volcano relationship between the oxygen reduction reaction kinetics and the pore size. The origin behind it is investigated by out-of-plane X-ray diffraction, CO-stripping voltammetry, angle-resolved X-ray photoelectron spectroscopy, and density functional theory calculation. It is found that the lattice constant of Pt decreases with decreasing pore size, resulting in a downward shift of the d-band centre, which has a significant effect on adsorption energy.
Introduction
A detailed understanding of the electrochemical oxygen reduction reaction (ORR) is essential to decrease overpotential and achieve high efficiency in fuel cells and metal–air batteries.1,2 Despite the complex reaction mechanisms involving various reaction species,3 past research has established a reasonable guideline that leads to high-performance electrocatalysts based on the scaling relations: platinum or platinum-based electrocatalysts exhibit higher ORR activity than other novel metals because they have electronic structures that exhibit more optimal *OH binding energy.4–7 However, the overpotential needs to be further decreased to minimize the amount of the platinum loading. Therefore, reducing the amount of the platinum catalyst is crucial while increasing the ORR activity.It is worth mentioning that the reaction kinetics is determined by (i) the surface area and (ii) the specific activity of the electrocatalyst. Based on these two strategies, various studies have been conducted to improve ORR kinetics.
(i) Nanoparticle electrocatalysts have been employed with the expectation that the smaller the particle size, the larger the surface area that can be obtained. Even nanoparticles with selectively oriented facets have been synthesized because the ORR kinetics sensitively changes with the crystalline facet and the electrolyte.8–11 However, the decrease in particle size increases the number of under-coordinated sites,12–14 which have high adsorption energy for the reaction inhibitors and lower ORR kinetics.15 Instead, porous electrocatalysts have received much attention for their high surface area. Among various configurations, the fabrication of nanoframes,16,17 hollow nanotubes,18,19 and nanowires20,21 can increase the platinum utilization ratio.
(ii) The specific activities of Pt-based electrocatalysts have been successfully enhanced by applying the d-band theories.22 Pt alloyed electrocatalysts with transition metals (e.g., Ni, Co, Fe, and lanthanides) and core–shell electrocatalysts with Pt skin layers induce the downshift of the Pt d-band centre by the geometric and electronic effects.23–28 Moreover, these materials can reduce the amount of platinum. The electronic structure can also be tuned via catalyst–support interactions.29,30
Despite the two strategies mentioned above, little attention has been given to the combined effect of the porous structure and the electronic effect—how the specific activity changes when the catalyst geometry is modified from a planar to a porous structure. Several studies have reported the enhancement of specific activity with porous electrocatalysts. The enhancement has been attributed to, for example, the highly coordinated sites at grain boundaries,31–33 the increased residence time of the reactant,34 and the microstrain at the surface.35,36 However, the effect of pore size, one of the critical parameters in designing porous structures, has not been discussed enough. The plausible reason behind it is the difficulty of controlling the structural geometry, such as pore shape, length, and size. Moreover, the evaluation of intrinsic ORR kinetics is often enveloped by the concentration overpotential when using a porous electrode, especially with small pore sizes and long lengths.37
In our recent study, we fabricated a porous platinum model electrode with uniformly aligned cylindrical pores having diameters of 1.8 nm in a hexagonal pattern and evaluated ORR performance in an aqueous solution of 0.1 mol dm–3 (M) KOH.38 The reaction kinetics was enhanced compared to that of the planar electrode.38
Herein, to elucidate the effect of electrode pore size on the ORR kinetics under both acidic and alkaline conditions, we evaluated the ORR kinetics of porous platinum model electrodes with controlled pore diameters of 1.3 nm, 1.8 nm, and 3.0 nm in aqueous solutions of 0.1 M KOH and HClO4. The thickness of the electrode was less than 45 nm, where numerical simulations showed that the mass transfer effect in the pore can be minimized. We also performed density functional theory (DFT) calculations to theoretically investigate the influence of the pore size on platinum's crystal and electronic structures. This study demonstrates that ORR kinetics follows a volcano relationship in both electrolytes. The origin behind the observed kinetic trends was found to be a downshift of the d-band centre caused by the decrease in the lattice constant.
Experimental
Fabrication of porous platinum model electrodes
The porous platinum model electrodes were fabricated as reported previously.38–40 A gold disk electrode (φ = 4 mm, BAS) was polished with 0.05 μm alumina paste and followed by 200 cycles of cyclic voltammetry in an aqueous solution of 0.5 mol per dm3 H2SO4. The scan range and rate were −0.5–1.4 V vs. Hg|HgSO4|sat'd K2SO4 and 200 mV s−1. Then, microporous platinum films were electrodeposited on the gold disc electrode in the aqueous domains of a liquid crystalline phase at −0.055 V Ag|AgCl|sat'd KCl until the reduction capacity reached 0.637 or 6.37C cm−2. The larger reduction capacity was only applied to the samples for the XRD measurement. Mixtures of 29 wt% deionized water (18.2 MΩ cm, Merck Millipore), 29 wt% H2PtCl6, and 42 wt% surfactant (Table S1†) were used to fabricate the liquid crystalline phases. There is no other known surfactant that forms a desirable porous structure to our knowledge.Characterization of the porous model electrodes
The pore diameter and the electrode thickness were observed with transmission electron microscopy (TEM) (JEM-2100F, JEOL) and field emission scanning electron microscopy (FE-SEM) (S-5500, Hitachi High-Technologies), respectively. TEM images were observed from the top of the electrode. The procedure used to prepare the samples for TEM image observations using a focused ion beam is shown in Fig. S1.† The pore parameters were obtained by measuring multiple pores in the TEM images using the image analysis tool (Image J).41 Out-of-plane X-ray diffraction (XRD) measurement was conducted using an X-ray diffractometer (SmartLab, Rigaku) with Mo Kα radiation to analyse the crystalline structures of the porous electrodes. The scan rate, step, and range were 10° min−1, 0.01°, and 2θ = 15–40° respectively. The XRD patterns were analysed by Rietveld refinement using commercial software (SmartLab Studio II, Rigaku).Angle-resolved X-ray photoelectron spectroscopy (ARXPS) (PHI VersaProbe 3, ULVAC-PHI) with Al Kα radiation (15 kV, 25 W) was employed to characterize the electronic structure of the pore wall. The pass energy was 13.000 eV. The analyses of XPS spectra were conducted with commercial software (PHI MultiPak, ULVAC-PHI). The spectra were calibrated to the C 1s peak at 284.8 eV, and the background was subtracted. The obtained binding energy (BE) originates from the combined contributions of the pore wall (BEwall) and the topmost surface (BEtop). We estimated the BEwall using the fitting of the angle dependence of the BE. Assuming that photoelectrons can escape only from the outmost surfaces, and those blocked by the pore wall cannot reach the detector, we calculated the angular dependence of the BE by the following procedure. First, the analysed areas were calculated by considering the unit cell of the porous electrode, which consists of a cylindrical pore and a hexagonal cell (Fig. S2†). As shown in Fig. S2,† in a three-dimensional xyz space, the topmost surface of the unit cell is placed on the xy plane with the symmetrical centre at the origin. Herein, let the photoelectron emission plane make an angle θ with the xz plane. The deepest pore end, where the photoelectrons can be emitted to the detector at each y, is the cross-section between the pore wall and the emission line that goes through the rim of the pore:
 | (1) |
Therefore, the measured area of the pore wall can be calculated by integrating around the circumference of the rim of the pore:
 | (2) |
The measured area of the topmost surface is calculated as follows:
 | (3) |
Then the BE is calculated as the average of the BEs weighted with the measured area:
| BE = BEwall·fPW + BEtop·(1 − fPW) | (4) |
 | (5) |
The fitting parameters are the BEwall and the offset angle θin. The offset angle arises from the difference between the angle of the sample stand relative to the detector and that of the sample itself. Though the BEwall obtained with this fitting contains some error due to the sole consideration of the peak positions instead of the summation of the spectra, the BEwall can be used for qualitative comparison, which gives us the order of the shift in relation to the pore size.
Electrochemical measurements
Electrochemical measurements in the alkaline (0.1 M KOH) and acidic (0.1 M HClO4) solutions were conducted using poly(tetrafluoroethylene) and glass cells, respectively. H2SO4 is an important electrolyte from a practical standpoint. However, SO42− ions are easily adsorbed on Pt, resulting in a decrease in ORR activity.42,43 Therefore, HClO4, which is less likely to be adsorbed,42,43 was used in this study. The cells were cleaned in piranha solution, a 3/1 (v/v) mixture of 98 wt% H2SO4 and 30 wt% H2O2. The electrochemical three-electrode cells comprised the porous or planar platinum disc working electrodes, a platinum wire counter electrode, and a Hg|HgO or reversible hydrogen reference electrode (RHE). The potentials below are shown against the RHE scale (−0.926 V vs. Hg|HgO).Electrochemical measurements were performed with a rotating disk electrode system (RRDE-3A, BAS). First, cyclic voltammetry in the N2-saturated electrolyte solutions was performed for conditioning. The scan range and scan rate were 0.05–1.2 V and 50 mV s−1, respectively. Then, cyclic voltammetry between 0.05 and 1.05 V was carried out in N2-saturated electrolyte solutions for the background measurements at a scan rate of 20 mV s−1 and an electrode rotation speed of 0 rpm. Electrochemical surface area (ECSA) was calculated by using the average of hydrogen adsorption and desorption charges (210 μC cm−2) from the background voltammograms.44 Finally, linear sweep voltammetry from 0.05 to 1.05 V was performed in O2-saturated electrolyte solutions for the ORR measurements at a scan rate of 20 mV s−1 and an electrode rotation speed of 2000 rpm. ORR kinetics were evaluated with kinetic current densities ik normalized with ECSA:
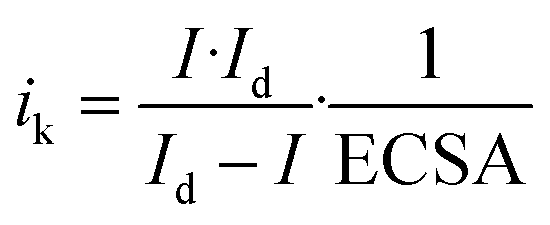 | (6) |
CO stripping voltammetry was conducted to estimate the electronic structure of the platinum electrodes. The platinum electrodes were immersed in CO-saturated 1 M KOH solution while the potential was kept at 0.1 V. Then, the solution was purged with N2 to remove the remaining CO. Finally, the potential was scanned from 0.1 V to 1.05 V at a scan rate of 50 mV s−1.
The redox reaction of adsorbed Bi in 0.5 M H2SO4 solution (eqn (7)) was used to quantify the (111) terrace sites.
| Pt3(111)-Bi + 2H2O ⇄ Pt3(111)-Bi(OH)2 + 2H+ + 2e− | (7) |
The platinum electrodes were covered with a Bi2O3-saturated 0.5 M H2SO4 solution droplet. Then, the electrodes were transferred to the electrochemical cell without washing off the droplet, and the potential was instantly set at 0.4 V. Finally, the potential was cycled between 0.05 V and 0.75 V at a scan rate of 50 mV s−1. The fraction of (111) terrace sites, f(111), was calculated from the electric charge of the redox peak, qBi:45
 | (8) |
Computational methods
DFT calculations of platinum were performed with Quantum ESPRESSO version 7.3.46–48 The calculations were performed using a small pore perforated model (Pore-S), a large pore perforated model (Pore-L), a slab model, and a bulk model. These models are illustrated in Fig. 8(a). To create the Pore-S and Pore-L models, supercells were first prepared with the FCC Pt [111] direction as their c axes. For the purpose of distinction, the c axes of these supercells are hereafter denoted as the c′ axes. The Pt atoms in the centre region of these supercells viewed from the c′ axes were then removed to form regular hexagonal holes parallel to the c′ axes. These hexagonal holes consisted of six equivalent planes of {1−10}, and two models were prepared with different sizes of the holes. The hexagonal sides of Pore-S and Pore-L viewed from the c′ axes have 5 and 8 Pt atoms, respectively. The number of Pt atoms between the apexes of the pores was 5 atoms in both cases. Other details of these models are given in Table 4. The slab model has surfaces equivalent to the pore walls of Pore-S and Pore-L and consists of 11 atomic layers. The bulk model consists of an FCC Pt crystal. The calculations used projector augmented wave (PAW) pseudopotentials obtained from Pseudo-Dojo49,50 with GGA PBEsol functionals. From the preliminary evaluation of convergence for the bulk model, the energy cut-off of wavefunctions and charge density were set to 40 Ry and 320 Ry, respectively, and k-points were set based on the product of each lattice length and a number of k-points greater than 30 points × angstrom in the standard calculation. The Methfessel–Paxton smearing method was used.51 First, the lattice parameters and atomic positions were optimized for these models. No surface reconstruction was performed to reduce computation time and ensure consistency among the models. After the optimization, non-self-consistent field and density of states calculations were performed for the fully relaxed models. In this non-self-consistent field calculation, the k-point density in each direction was double the value of the standard calculation, and the optimized tetrahedron method was used instead of smearing.Results
Pore structures
The hexagonal pore arrangements were observed in the TEM images taken from the top of the electrodes, as shown in Fig. 1(a, b, d and e). In our previous work, the porous electrode had a pore size of 1.8 ± 0.2 nm, a pore distance (distance between pore centres) of 4.9 ± 0.4 nm, and a thickness (pore length) of 45 nm.38 In this study, the use of different surfactants results in pore sizes of 1.3 ± 0.3 nm and 3.0 ± 0.4 nm and pore distances of 5.0 ± 0.5 nm and 6.6 ± 0.6 nm, respectively (Table 1). Cross-sectional SEM images show that each electrode has a thickness of 40 nm and 45 nm (Fig. 1(c), (f) and Table 1). Based on the pore diameter, the porous electrodes are now denoted as microporous 1.3 nm, microporous 1.8 nm, and mesoporous 3.0 nm, respectively.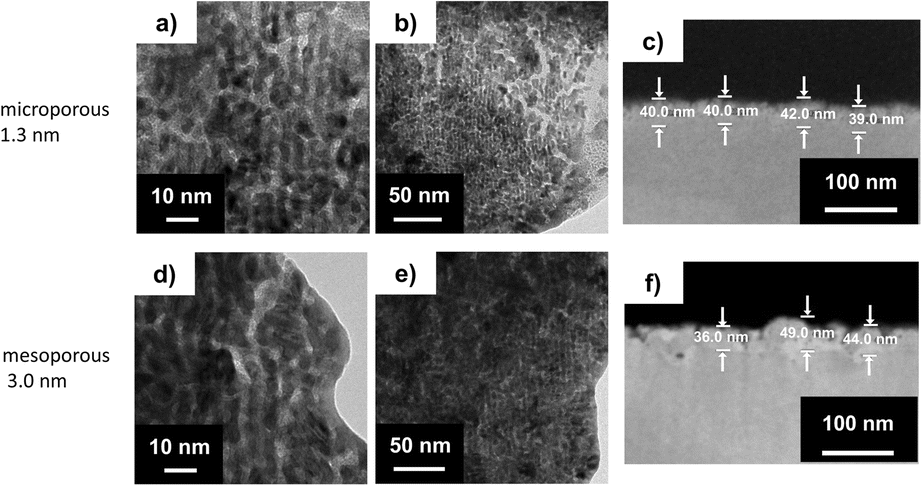 | ||
| Fig. 1 (a, b, d and e) TEM images observed from the top of the porous model electrodes and (c and f) cross-sectional SEM images of the porous model electrodes with the pore sizes of (a–c) 1.3 nm and (d–f) 3.0 nm. | ||
| Pore diameter/nm | Pore distance/nm | Inter-pore thickness/nm | Thickness/nm |
|---|---|---|---|
| 1.3 ± 0.3 | 5.0 ± 0.5 | 3.7 ± 0.8 | 40 |
| 1.8 ± 0.2 | 4.9 ± 0.4 | 3.1 ± 0.6 | 45 |
| 3.0 ± 0.4 | 6.6 ± 0.6 | 4 ± 1 | 45 |
Fig. 2 shows background voltammograms measured in N2-saturated KOH and HClO4 solutions. The electrodes exhibit the typical voltammograms for the platinum polycrystalline facets: hydrogen adsorption/desorption below 0.5 V and surface oxidation/reduction above 0.7 V.52 ECSAs were calculated from the average of hydrogen adsorption and desorption charges and normalized by the geometric area (0.1256 cm2) to obtain roughness factors Rf,KOH and Rf,HClO4 (Table 2). Each porous electrode possesses the same degree of roughness factor in both electrolytes. The larger roughness factors of the porous electrodes than those of the planar electrode are attributed to the cylindrical pore structure. The theoretical roughness factor Rf,cal was geometrically calculated assuming that pores are aligned hexagonally (Fig. S3† and eqn (1)):
 | (9) |
 | ||
| Fig. 2 Cyclic voltammograms of the porous model and the planar electrodes in N2-saturated (a) 0.1 M KOH and (b) 0.1 M HClO4. | ||
| Electrode | R f,KOH/— | R f,HClO4/— | R f,cal/— |
|---|---|---|---|
| Microporous 1.3 nm | 12 ± 1 | 11 ± 1 | 8.48 |
| Microporous 1.8 nm | 10 ± 1 | 12 ± 3 | 13.1 |
| Mesoporous 3.0 nm | 10 ± 2 | 13 ± 3 | 12.1 |
| Planar | 1.54 ± 0.06 | 1.6 ± 0.2 | 1.0 |
Crystal structures
We conducted the XRD measurement to analyse the crystal structure of the porous electrodes (Fig. 3). The porous electrodes exhibit diffraction patterns corresponding to Pt and Au, with the latter serving as the substrate. The planar electrode shows only the diffraction pattern of Pt. The change in the peak position was not observed for Au. In contrast, the shift of the Pt diffraction peaks to higher angles was observed compared to the planar electrode, which indicates smaller lattice constants for the porous electrodes. In addition, the broader Pt diffraction peaks for the model electrodes suggest that the porous electrodes possess smaller crystallite sizes and larger microstrain, where the atoms deviate from their ideal positions in the crystal structure.53 The X-ray source used in this study contains Mo Kα1 and Mo Kα2 radiations, which split the diffraction peaks into two, except for the broad diffraction peaks of Pt in the porous model electrodes.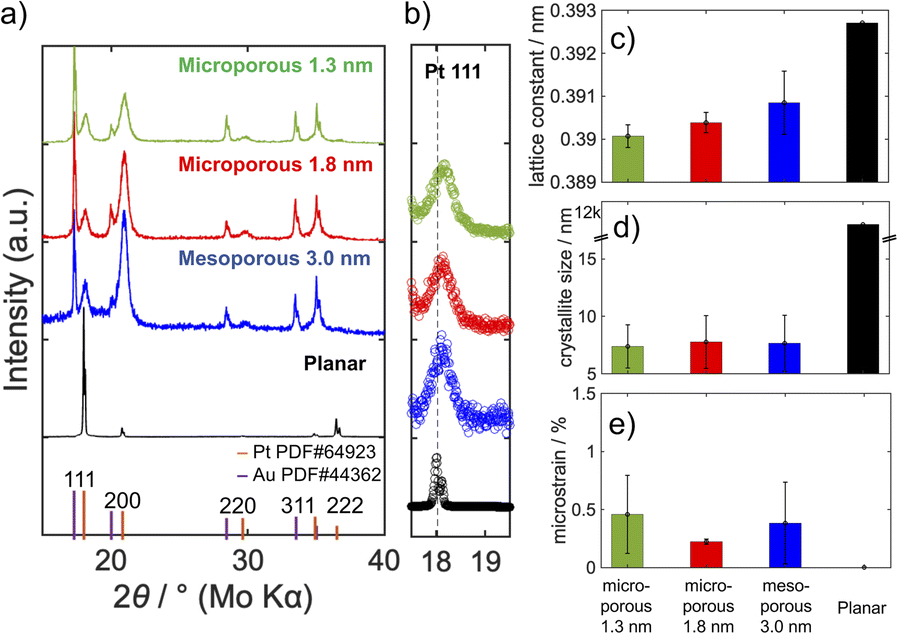 | ||
| Fig. 3 (a) Out-of-plane XRD patterns and enlarged views around (b) the Pt (111) diffraction peaks of the porous model and planar electrodes. (c–e) The lattice parameters obtained by Rietveld refinement. The model electrodes were deposited with a charge density of 6.37C cm−2 to increase the diffraction intensity. | ||
These parameters were quantitatively obtained by the Rietveld refinement (Fig. S4†). The porous platinum electrodes exhibit smaller lattice constants with decreased pore size (Fig. 3). The crystallite sizes are reasonably in the same order as the pore distances. The apparent microstrain was observed to be almost the same among the porous electrodes, but the value is larger than that of the planar electrode.
Electronic structures
The electronic structure, especially the d-band centre, of the Pt-based electrocatalysts significantly affects the ORR kinetics, as proposed by Norskov et al.23 We performed ARXPS to analyse the electronic structure of the pore wall.54Fig. 4(a)–(c) show the ARXPS spectra of Pt 4f7/2 for the porous electrodes. Fig. 4(b) is cited from our previous work.38 The lowest binding energy (BE) of each porous electrode (θ = 75°, 45°, and 30° for the microporous 1.3 nm, microporous 1.8 nm, and mesoporous 3.0 nm, respectively) is almost the same as that of the planar electrode, 71.2 eV, indicating that the electronic structures of the topmost surfaces are similar to that of the planar electrode. In contrast, all the porous electrodes show peak shifts towards a higher binding energy (BE) than the planar electrode (Fig. S5†) at the other takeoff angles, which indicates that the binding energy of the pore walls (BEwall) is higher than that of the topmost surfaces (BEtop). The possible formation of the surface oxide was negligible, based on the spectral deconvolution of the spectra using the platinum metal (Pt0) and oxide (Pt2+) peaks (Fig. S6†), which indicates that the change in BEwall is due to the change in the electronic structure of platinum. In order to analyse the BEwall more specifically, the fraction of the photoelectrons escaping from the pore wall out of the total detected photoelectrons, fPW, was calculated geometrically. The calculation results are shown in Fig. 4(d)–(f). The fitting results show that the BEwall increases in the following order: planar < mesoporous 3.0 nm < microporous 1.8 nm < microporous 1.3 nm. Considering that the core level shift is a good indicator of the shift of the d-band centre for the elements with almost filled d-bands,55,56 the magnitude of the d-band centre downshift should be of the same order. We also constructed a calculation model with a hexagonal pore (Fig. S2†), which results in almost the same BEwall as that of the model assuming a cylindrical pore (Fig. S7 and Table S2†). | ||
| Fig. 4 ARXPS spectra of Pt 4f7/2 for (a) microporous 1.3 nm, (b) microporous 1.8 nm, and (c) mesoporous 3.0 nm. The arrows indicate the difference in binding energies between the pore wall and the topmost surface of the electrode. Calculated fPW and calculated and measured binding energies of the pore wall for (d) microporous 1.3 nm, (e) microporous 1.8 nm, and (f) mesoporous 3.0 nm. | ||
CO stripping voltammetry was also conducted in 1 M KOH to corroborate the d-band centre downshift in the porous electrode (Fig. 5). The potential of the primary peak shifted towards a lower potential with a decrease in the pore size, indicating a weaker CO–Pt bond caused by the d-band centre downshift.57,58 The downshift of the d-band centre weakens the electron backdonation from the Pt-5d band to the CO2 π* orbital.59,60
 | ||
| Fig. 5 CO stripping (thick lines) and the subsequent (thin lines) voltammograms of the porous model and planar electrodes. The currents are normalized by ECSAs. The potentials of the primary peaks are also noted. | ||
Surface structures
ORR kinetics changes sensitively to the Pt surface structure. The studies with single crystalline platinum electrodes revealed the following kinetic order: Pt(111) > Pt(110) > Pt(100) in KOH solution11,61 and Pt(110) > Pt(111) > Pt(100) in HClO4 solution.9,62 Since the Pt(111) terrace sites exhibit relatively high catalytic activities in both electrolytes, Bi-adsorption measurement was employed to quantify the Pt(111) terrace sites. The adsorbed Bi species (Biad) prevent hydrogen adsorption below 0.4 V, and the redox peak of Biad on the Pt(111) terrace site was observed around 0.6 V (Fig. 6). Table 3 shows the percentage of (111) terrace sites for each electrode. There is no predominant difference in the percentage of (111) terrace sites between the porous electrodes. In contrast, the porous electrodes have about 5% fewer (111) terrace sites than the planar electrode. | ||
| Fig. 6 Bi-adsorbed (solid lines) and background (dashed lines) voltammograms of the model and planar electrodes in N2-saturated 0.5 M H2SO4. The currents are normalized by ECSA calculated from the background voltammograms. | ||
| Electrode | Pt(111) terrace site/% |
|---|---|
| Microporous 1.3 nm | 23.5 ± 0.8 |
| Microporous 1.8 nm | 21.3 ± 0.4 |
| Mesoporous 3.0 nm | 23 ± 1 |
| Planar | 28.3 ± 0.8 |
Oxygen reduction reaction activities
ORR measurements were performed in O2-saturated KOH and HClO4 solutions. The linear sweep voltammograms (insets in Fig. 7(a) and (c)) show that, in the low overpotential region, the larger specific surface areas of the porous electrodes result in relatively large ORR currents compared to the planar electrode. In the high overpotential region, the diffusion-limiting currents are comparable. This is because oxygen is transported only to the topmost surface of the porous electrodes at high current, and the electrochemically effective area is equivalent to the geometric surface area.63 The kinetic currents were obtained with eqn (6) to compare the intrinsic ORR activities of the pores. Fig. 7(a and b) display the Tafel plots and the kinetic current densities at 0.96 V in the KOH solution, respectively. The data for the microporous 1.8 nm were cited from our previous study.38 In contrast to microporous 1.8 nm, which shows higher specific ORR activity than the planar electrode, microporous 1.3 nm and mesoporous 3.0 nm exhibit ORR activities comparable to the planar electrode in the KOH solution. Fig. 7(c and d) show the Tafel plots and the kinetic current densities at 0.96 V in the HClO4 solution. Microporous 1.8 nm shows higher ORR activity than that of the planar electrode in HClO4 as in KOH. In addition, microporous 1.3 nm and mesoporous 3.0 nm also exhibit relatively higher ORR activities than the planar electrode in HClO4. A comparison of the ORR activity between the electrodes shows that the ORR kinetics follows a volcano relationship at a kinetic maximum of microporous 1.8 nm in both electrolytes. It should be noted that the kinetic current could be underestimated when the oxygen transport resistance in the pore is not negligible since eqn (6) does not consider oxygen transport resistance in the pore. Such a case likely occurs in electrodes with small pore sizes and long pore lengths. We simulated a concentration gradient in the pores of microporous 1.3 nm, as we did for microporous 1.8 nm in the previous study.38 The calculation result shows that the concentration gradient inside the pore is negligible above 0.9 V (Fig. S8 and 9†), indicating that the kinetic current is evaluated appropriately. It is obvious that mesoporous 3.0 nm with a larger pore size and almost the same thickness also shows a negligible concentration gradient in the pores. | ||
| Fig. 7 Tafel plots of the porous model and planar electrodes in (a) 0.1 M KOH and (c) 0.1 M HClO4. The currents are corrected for mass-transport and normalized by the ECSAs. The insets show the linear sweep voltammograms normalized by the geometrical area from which the Tafel plots are collected. Kinetic current densities at 0.96 V in (b) 0.1 M KOH and (d) 0.1 M HClO4. The kinetics current densities of microporous 1.8 nm and planar in 0.1 M KOH were previously reported.38 | ||
Insights from DFT calculation
DFT calculations were performed to theoretically clarify the effect of pores on the crystalline and electronic structures. The structural model was created by hollowing out hexagonal holes from [111] direction of FCC Pt (Fig. 8(a)). To reduce the computational cost, pore sizes and distances smaller than the experimentally fabricated electrodes were used in the unit cells, which can sufficiently show the trends in the lattice constant and d-band centre as a function of the pore size. Table 4 shows the pore size (diagonal length), pore distance (distance between pore centres), inter-pore thickness (nearest neighbor distance of Pt constituting the pore wall), and lattice constant a from a′ and b′ or c′ (the values corresponding to the lattice constant a of FCC Pt, which is calculated from the lattice constants a′ and b′ or c′ of the Pore-S or Pore-L models by axial transformation). The porous models exhibit relatively small lattice constants compared to the bulk model. In addition, the lattice constant tends to decrease with decreasing pore size. These results indicate that introducing pores reduces the lattice constant of Pt, and the degree of reduction increases with decreasing pore size. These models show different lattice constants in the direction along the pore and perpendicular to the pore, suggesting that introducing pores causes lattice distortion, which may be related to the microstrain indicated by the Rietveld analysis. To investigate the effect of the pore on the d-band centre, we calculated the partial density of states (pDOS) of the d-band using the porous models. For comparison, the pDOS of the slab model (Fig. 8 (a)), in which the {1−10} plane, the same plane as the pore wall, is exposed in a vacuum, was also calculated. Fig. 8 (b) shows the calculated d-band centres, and pDOSs themselves are shown in Fig. S10.† The porous models exhibit lower d-band centres than the slab model without pores. Furthermore, the Pore-S model with a smaller pore size exhibits a lower d-band centre. These results indicate that introducing pores lowers the d-band centre, and the degree of lowering increases with decreasing pore size. | ||
| Fig. 8 (a) Relaxed structures of the porous and slab models from the c′ axis direction together with the bulk model. The scale of the porous and slab models is aligned. (b) Calculated d-band centres of the porous and slab models. | ||
| Model | Pore size/nm | Pore distance/nm | Inter-pore thickness/nm | Lattice constant a from a′ and b′/nm | Lattice constant a from c′/nm |
|---|---|---|---|---|---|
| Bulk | — | — | — | 0.392 | 0.392 |
| Pore-L | 2.21 | 2.85 | 0.687 | 0.388 | 0.387 |
| Pore-S | 1.24 | 1.90 | 0.704 | 0.387 | 0.384 |
Discussion
Volcano relationship between ORR activity and pore size
DFT calculations showed that the d-band centre of the porous Pt shifts downward with decreasing pore size. In addition, the XPS measurement and CO stripping voltammetry results strongly suggest that the d-band centre of the porous model electrodes shifts downward with decreasing pore size. In contrast, Bi redox measurements revealed that the porous Pt electrodes have almost the same amount of the (111) terrace sites as each other, with the highest ORR active sites in alkaline electrolyte solutions. From these results, it can be concluded that the volcano relationship between ORR activity and pore size is due to the change in the electronic structure, downward shift of the d-band centre, rather than that of the surface structure. It has been reported that reaction intermediates, such as *OH, are bound on the Pt(111) terrace site more strongly than the optimal strength, resulting in lower kinetics.23,27 Introducing the d-band centre downshift, either by geometric or electronic effects, lowers the adsorption energy, increasing the reaction kinetics. However, when the d-band centre is downshifted too far from the Fermi level, the adsorption energy is too low to promote the reaction.23,27 In the case of this study, while the adsorption energy of the intermediate products is too strong for the Pt planar electrode and mesoporous 3.0 nm, the introduction of the pore and the decrease in the pore size shift the d-band centre downward, which enhances the desorption of the intermediate products and improves the ORR activity. However, decreasing the pore size from 1.8 nm to 1.3 nm reduced the ORR activity because the reactants were less adsorbed.The volcano relationship following the trend of the d-band centre was clearly observed in the HClO4 solution. In contrast, the kinetics of the porous model electrodes other than 1.8 nm was comparable to that of the planar electrode in the KOH solution. This could be attributed to the difference in active sites. Redox measurements of adsorbed Bi revealed that the porous electrodes had fewer (111) terrace sites than the planar electrode. The (111) terrace sites have the highest ORR activity in the KOH solutions, which probably results in the relatively lower ORR kinetics for the porous electrodes in the KOH solution.
Electronic structure change induced by pore size
It is known that the decrease in the lattice constant alters the way in which the neighboring atoms interact electronically, resulting in the d-band centre downshift.64 Considering that the DFT calculations and Rietveld refinements show a decrease in the lattice constant with a decrease in the pore size, the decrement in the lattice constant mainly affected the downshift of the d-band centre of the porous Pt electrodes. In addition, the microstrain observed in the Rietveld analysis might have also contributed to the shift of the d-band centre, as the slight deviation in the atomic position also changes the electronic structure and ORR kinetics.35,65,66Effect of inter-pore thickness
Finally, the effect of inter-pore thickness on the lattice constant and d-band centre was investigated using DFT calculations. We constructed a model called Pore-M, which has a pore size intermediate between Pore-S and Pore-L and a smaller inter-pore thickness. The hexagonal sides of Pore-M viewed from the c′ axes have 7 Pt atoms, and the number of Pt atoms between the apexes of the pores was 4 (Fig. S11†). The results of structural relaxation revealed that Pore-M exhibits almost the same lattice constant as Pore-S despite having a larger pore size than Pore-S (Table S4†). In addition, pDOS calculation revealed that the d-band centre of Pore-M (−3.22 eV) is higher than that of Pore-S (−3.25 eV) and Pore-L (−3.23 eV). These results indicate that the lattice constant decreases and the d-band center increases as the inter-pore thickness decreases. Further investigation is needed to clarify the reason for the higher d-band centers despite the smaller lattice constant.Among the porous model electrodes fabricated in this study, microporous 1.8 nm has an inter-pore thickness about 0.5 nm smaller than the other samples. However, the lattice constant and d-band center of microporous 1.8 nm were between those of microporous 1.3 nm and mesoporous 3.0 nm. These results strongly suggest that the effect of pore size is stronger than the effect of inter-pore thickness for the porous model electrodes fabricated in this study.
Conclusions
The effect of the platinum's pore size on ORR kinetics was investigated using the porous model electrodes with controlled cylindrical pore diameters of 1.3 nm, 1.8 nm, and 3.0 nm. In both aqueous solutions of 0.1 M KOH and 0.1 M HClO4, the ORR kinetics follows a volcano relationship. The catalytic trend is ascribed to the d-band centre downshift, mainly caused by the decrease in the lattice constant. This study demonstrates that it is possible to not only obtain a high surface area but also enhance ORR specific activity by tuning the pore sizes of porous Pt electrodes. Furthermore, since the electronic structure contributes to the activity of many electrocatalytic and catalytic reactions, tuning pore size should be a promising approach for improving the activity of various electrocatalysts and catalysts.Data availability
The data supporting this article have been included as part of the ESI.†Conflicts of interest
There are no conflicts to declare.Acknowledgements
This work was supported by JSPS KAKENHI Grant Number 23KJ0894 and JRP-LEAD with DFG Grant Number PJSJRP20221602. TEM, FE-SEM and XPS measurements and cell processing were supported by the Materials Analysis Division and Design and Manufacturing Division, Open Facility Centre, Institute of Science Tokyo.References
- S. Zaman, L. Huang, A. I. Douka, H. Yang, B. You and B. Y. Xia, Angew. Chem., Int. Ed., 2021, 60, 17832–17852 CrossRef CAS PubMed.
- Q. F. Liu, Z. F. Pan, E. D. Wang, L. An and G. Q. Sun, Energy Storage Mater., 2020, 27, 478–505 CrossRef.
- N. A. Anastasijevic, V. Vesovic and R. R. Adzic, J. Electroanal. Chem., 1987, 229, 305–316 CrossRef CAS.
- V. Colic and A. S. Bandarenka, ACS Catal., 2016, 6, 5378–5385 CrossRef CAS.
- I. E. L. Stephens, A. S. Bondarenko, U. Gronbjerg, J. Rossmeisl and I. Chorkendorff, Energy Environ. Sci., 2012, 5, 6744–6762 RSC.
- J. K. Norskov, J. Rossmeisl, A. Logadottir, L. Lindqvist, J. R. Kitchin, T. Bligaard and H. Jónsson, J. Phys. Chem. B, 2004, 108, 17886–17892 CrossRef CAS PubMed.
- F. Calle-Vallejo, M. T. M. Koper and A. S. Bandarenka, Chem. Soc. Rev., 2013, 42, 5210–5230 RSC.
- R. Devivaraprasad, R. Ramesh, N. Naresh, T. Kar, R. K. Singh and M. Neergat, Langmuir, 2014, 30, 8995–9006 CrossRef CAS PubMed.
- N. M. Markovic, R. R. Adzic, B. D. Cahan and E. B. Yeager, J. Electroanal. Chem., 1994, 377, 249–259 CrossRef CAS.
- N. M. Markovic, H. A. Gasteiger and P. N. Ross, J. Chem. Phys., 1995, 99, 3411–3415 CrossRef CAS.
- N. M. Markovic, H. A. Gasteiger and P. N. Ross, J. Phys. Chem., 1996, 100, 6715–6721 CrossRef.
- H. Erikson, R. M. Antoniassi, J. Solla-Gullón, R. M. Torresi, K. Tammeveski and J. M. Feliu, Electrochim. Acta, 2022, 403, 139631 CrossRef CAS.
- M. Shao, A. Peles and K. Shoemaker, Nano Lett., 2011, 11, 3714–3719 CrossRef CAS PubMed.
- L. Geniès, R. Faure and R. Durand, Electrochim. Acta, 1998, 44, 1317–1327 CrossRef.
- F. Calle-Vallejo, J. Tymoczko, V. Colic, Q. H. Vu, M. D. Pohl, K. Morgenstern, D. Loffreda, P. Sautet, W. Schuhmann and A. S. Bandarenka, Science, 2015, 350, 185–189 CrossRef CAS PubMed.
- C. Chen, Y. J. Kang, Z. Y. Huo, Z. W. Zhu, W. Y. Huang, H. L. L. Xin, J. D. Snyder, D. G. Li, J. A. Herron, M. Mavrikakis, M. F. Chi, K. L. More, Y. D. Li, N. M. Markovic, G. A. Somorjai, P. D. Yang and V. R. Stamenkovic, Science, 2014, 343, 1339–1343 CrossRef CAS PubMed.
- J. Park, H. L. Wang, M. Vara and Y. N. Xia, ChemSusChem, 2016, 9, 2855–2861 CrossRef CAS PubMed.
- L. Tao, D. Yu, J. S. Zhou, X. Lu, Y. X. Yang and F. M. Gao, Small, 2018, 14, 1704503 CrossRef PubMed.
- L. Su, S. Shrestha, Z. H. Zhang, W. Mustain and Y. Lei, J. Mater. Chem. A, 2013, 1, 12293–12301 RSC.
- K. Z. Jiang, D. D. Zhao, S. J. Guo, X. Zhang, X. Zhu, J. Guo, G. Lu and X. Q. Huang, Sci. Adv., 2017, 3, e1601705 CrossRef PubMed.
- M. F. Li, Z. P. Zhao, T. Cheng, A. Fortunelli, C. Y. Chen, R. Yu, Q. H. Zhang, L. Gu, B. V. Merinov, Z. Y. Lin, E. B. Zhu, T. Yu, Q. Y. Jia, J. H. Guo, L. Zhang, W. A. Goddard, Y. Huang and X. F. Duan, Science, 2016, 354, 1414–1419 CrossRef CAS PubMed.
- T. Bligaard and J. K. Norskov, Electrochim. Acta, 2007, 52, 5512–5516 CrossRef CAS.
- V. Stamenkovic, B. S. Mun, K. J. J. Mayrhofer, P. N. Ross, N. M. Markovic, J. Rossmeisl, J. Greeley and J. K. Norskov, Angew. Chem., Int. Ed., 2006, 45, 2897–2901 CrossRef CAS PubMed.
- V. R. Stamenkovic, B. S. Mun, M. Arenz, K. J. J. Mayrhofer, C. A. Lucas, G. F. Wang, P. N. Ross and N. M. Markovic, Nat. Mater., 2007, 6, 241–247 CrossRef CAS PubMed.
- M. Escudero-Escribano, P. Malacrida, M. H. Hansen, U. G. Vej-Hansen, A. Velázquez-Palenzuela, V. Tripkovic, J. Schiotz, J. Rossmeisl, I. E. L. Stephens and I. Chorkendorff, Science, 2016, 352, 73–76 CrossRef CAS PubMed.
- P. Strasser, S. Koh, T. Anniyev, J. Greeley, K. More, C. F. Yu, Z. C. Liu, S. Kaya, D. Nordlund, H. Ogasawara, M. F. Toney and A. Nilsson, Nat. Chem., 2010, 2, 454–460 CrossRef CAS PubMed.
- F. H. B. Lima, J. Zhang, M. H. Shao, K. Sasaki, M. B. Vukmirovic, E. A. Ticianelli and R. R. Adzic, J. Phys. Chem. C, 2007, 111, 404–410 CrossRef CAS.
- A. U. Nilekar, Y. Xu, J. L. Zhang, M. B. Vukmirovic, K. Sasaki, R. R. Adzic and M. Mavrikakis, Top. Catal., 2007, 46, 276–284 CrossRef CAS.
- F. Ando, T. Gunji, T. Tanabe, I. Fukano, H. D. Abruña, J. F. Wu, T. Ohsaka and F. Matsumoto, ACS Catal., 2021, 11, 9317–9332 CrossRef CAS.
- H. Y. W. Min, J. H. Choi, H. E. Kang, D. J. Kim and Y. S. Yoon, Small Struct., 2024, 5, 2300407 CrossRef CAS.
- H. Cheng, S. Liu, Z. Hao, J. Wang, B. Liu, G. Liu, X. Wu, W. Chu, C. Wu and Y. Xie, Chem. Sci., 2019, 10, 5589–5595 RSC.
- J. Kibsgaard, Y. Gorlin, Z. B. Chen and T. F. Jaramillo, J. Am. Chem. Soc., 2012, 134, 7758–7765 CrossRef CAS PubMed.
- F. Calle-Vallejo, M. D. Pohl, D. Reinisch, D. Loffreda, P. Sautet and A. S. Bandarenka, Chem. Sci., 2017, 8, 2283–2289 RSC.
- E. B. Zhu, W. Xue, S. Y. Wang, X. C. Yan, J. X. Zhou, Y. Liu, J. Cai, E. S. Liu, Q. Y. Jia, X. F. Duan, Y. J. Li, H. Heinz and Y. Huang, Nano Res., 2020, 13, 3310–3314 CrossRef CAS.
- Q. Hua, X. Y. Chen, J. F. Chen, N. M. Alghoraibi, Y. Lee, T. J. Woods, R. T. Haasch, S. C. Zimmerman and A. A. Gewirth, ACS Catal., 2024, 14, 7526–7535 CrossRef CAS.
- X. Zhao, S. Takao, Y. Yoshida, T. Kaneko, T. Gunji, K. Higashi, T. Uruga and Y. Iwasawa, Appl. Catal., B, 2023, 324, 122268 CrossRef CAS.
- S. Park, Y. J. Song, J. H. Han, H. Boo and T. D. Chung, Electrochim. Acta, 2010, 55, 2029–2035 CrossRef CAS.
- K. Nakahara, A. Ikezawa, T. Okajima and H. Arai, ChemElectroChem, 2024, 11, e202300654 CrossRef CAS.
- G. S. Attard, P. N. Bartlett, N. R. B. Coleman, J. M. Elliott, J. R. Owen and J. H. Wang, Science, 1997, 278, 838–840 CrossRef CAS.
- J. M. Elliott, G. S. Attard, P. N. Bartlett, N. R. B. Coleman, D. A. S. Merckel and J. R. Owen, Chem. Mater., 1999, 11, 3602–3609 CrossRef CAS.
- C. A. Schneider, W. S. Rasband and K. W. Eliceiri, Nat. Methods, 2012, 9, 671–675 CrossRef CAS PubMed.
- J. Wang, N. Markovic and R. Adzic, J. Phys. Chem. B, 2004, 108, 4127–4133 CrossRef CAS.
- U. Paulus, T. Schmidt, H. Gasteiger and R. Behm, J. Electroanal. Chem., 2001, 495, 134–145 CrossRef CAS.
- W. Sheng, M. Myint, J. G. Chen and Y. Yan, Energy Environ. Sci., 2013, 6, 1509–1512 RSC.
- P. Rodríguez, E. Herrero, J. Solla-Gullón, F. J. Vidal-Iglesias, A. Aldaz and J. M. Feliu, Electrochim. Acta, 2005, 50, 4308–4317 CrossRef.
- P. Giannozzi, S. Baroni, N. Bonini, M. Calandra, R. Car, C. Cavazzoni, D. Ceresoli, G. L. Chiarotti, M. Cococcioni, I. Dabo, A. Dal Corso, S. de Gironcoli, S. Fabris, G. Fratesi, R. Gebauer, U. Gerstmann, C. Gougoussis, A. Kokalj, M. Lazzeri, L. Martin-Samos, N. Marzari, F. Mauri, R. Mazzarello, S. Paolini, A. Pasquarello, L. Paulatto, C. Sbraccia, S. Scandolo, G. Sclauzero, A. P. Seitsonen, A. Smogunov, P. Umari and R. M. Wentzcovitch, J. Phys. Condens. Matter, 2009, 21, 395502 CrossRef PubMed.
- P. Giannozzi, O. Andreussi, T. Brumme, O. Bunau, M. B. Nardelli, M. Calandra, R. Car, C. Cavazzoni, D. Ceresoli, M. Cococcioni, N. Colonna, I. Carnimeo, A. Dal Corso, S. de Gironcoli, P. Delugas, R. A. DiStasio, A. Ferretti, A. Floris, G. Fratesi, G. Fugallo, R. Gebauer, U. Gerstmann, F. Giustino, T. Gorni, J. Jia, M. Kawamura, H. Y. Ko, A. Kokalj, E. Küçükbenli, M. Lazzeri, M. Marsili, N. Marzari, F. Mauri, N. L. Nguyen, H. V. Nguyen, A. Otero-de-la-Roza, L. Paulatto, S. Poncé, D. Rocca, R. Sabatini, B. Santra, M. Schlipf, A. P. Seitsonen, A. Smogunov, I. Timrov, T. Thonhauser, P. Umari, N. Vast, X. Wu and S. Baroni, J. Phys. Condens. Matter, 2017, 29, 465901 CrossRef CAS PubMed.
- P. Giannozzi, O. Baseggio, P. Bonfà, D. Brunato, R. Car, I. Carnimeo, C. Cavazzoni, S. de Gironcoli, P. Delugas, F. F. Ruffino, A. Ferretti, N. Marzari, I. Timrov, A. Urru and S. Baroni, J. Chem. Phys., 2020, 152, 154105 CrossRef CAS PubMed.
- M. J. van Setten, M. Giantomassi, E. Bousquet, M. J. Verstraete, D. R. Hamann, X. Gonze and G. M. Rignanese, Comput. Phys. Commun., 2018, 226, 39–54 CrossRef CAS.
- F. Jollet, M. Torrent and N. Holzwarth, Comput. Phys. Commun., 2014, 185, 1246–1254 CrossRef CAS.
- M. Methfessel and A. T. Paxton, Phys. Rev. B: Condens. Matter Mater. Phys., 1989, 40, 3616–3621 CrossRef CAS PubMed.
- F. J. Vidal-Iglesias, R. M. Arán-Ais, J. Solla-Gullón, E. Herrero and J. M. Feliu, ACS Catal., 2012, 2, 901–910 CrossRef CAS.
- R. Chattot, T. Asset, P. Bordet, J. Drnec, L. Dubau and F. Maillard, ACS Catal., 2017, 7, 398–408 CrossRef CAS.
- A. Lion, N. Laidani, P. Bettotti, C. Piotto, G. Pepponi, M. Barozzi and M. Scarpa, Appl. Surf. Sci., 2017, 406, 144–149 CrossRef CAS.
- M. Wakisaka, S. Mitsui, Y. Hirose, K. Kawashima, H. Uchida and M. Watanabe, J. Phys. Chem. B, 2006, 110, 23489–23496 CrossRef CAS PubMed.
- M. Weinert and R. E. Watson, Phys. Rev. B: Condens. Matter Mater. Phys., 1995, 51, 17168–17180 CrossRef CAS PubMed.
- D. F. van der Vliet, C. Wang, D. Li, A. P. Paulikas, J. Greeley, R. B. Rankin, D. Strmcnik, D. Tripkovic, N. M. Markovic and V. R. Stamenkovic, Angew. Chem., Int. Ed., 2012, 51, 3139–3142 CrossRef CAS PubMed.
- B. Y. Xia, H. B. Wu, N. Li, Y. Yan, X. W. Lou and X. Wang, Angew. Chem., Int. Ed., 2015, 54, 3797–3801 CrossRef CAS PubMed.
- G. F. Cabeza, P. Légaré and N. J. Castellani, Surf. Sci., 2000, 465, 286–300 CrossRef CAS.
- B. Hammer, O. H. Nielsen and J. K. Norskov, Catal. Lett., 1997, 46, 31–35 CrossRef CAS.
- R. Rizo, E. Herrero and J. M. Feliu, Phys. Chem. Chem. Phys., 2013, 15, 15416–15425 RSC.
- R. Suzuki, M. Nakamura and N. Hoshi, Electrochem. Commun., 2022, 140, 107337 CrossRef CAS.
- D. Menshykau and R. G. Compton, Electroanal, 2008, 20, 2387–2394 CrossRef.
- S. Maiti, K. Maiti, M. T. Curnan, K. Kim, K. J. Noh and J. W. Han, Energy Environ. Sci., 2021, 14, 3717–3756 RSC.
- R. Chattot, O. Le Bacq, V. Beermann, S. Kühl, J. Herranz, S. Henning, L. Kuhn, T. Asset, L. Guétaz, G. Renou, J. Drnec, P. Bordet, A. Pasturel, A. Eychmüller, T. J. Schmidt, P. Strasser, L. Dubau and F. Maillard, Nat. Mater., 2018, 17, 827–833 CrossRef CAS PubMed.
- S. Kühl, M. Gocyla, H. Heyen, S. Selve, M. Heggen, R. E. Dunin-Borkowski and P. Strasser, J. Mater. Chem. A, 2019, 7, 1149–1159 RSC.
Footnotes |
| † Electronic supplementary information (ESI) available. See DOI: https://doi.org/10.1039/d4ta08815h |
| ‡ Los Alamos National Laboratory, Los Alamos 87545, USA. |
| § Tokyo Metropolitan University, Hachioji 192-0397, Japan. |
| This journal is © The Royal Society of Chemistry 2025 |