
 Open Access Article
 This Open Access Article is licensed under a
 Creative Commons Attribution 3.0 Unported Licence
Designing molecular and two-dimensional metalloporphyrin catalysts for the electrochemical CO2 reduction reaction†
Amira Tasnima
Uddin
a,
Rachel
Crespo-Otero
 *b and
Devis
Di Tommaso
*ac
*b and
Devis
Di Tommaso
*ac
aDepartment of Chemistry, School of Physical and Chemical Sciences, Queen Mary University of London, Mile End Road, London, E1 4NS, UK
bDepartment of Chemistry, University College London, 20 Gordon St, London, WC1H 0AJ, UK. E-mail: r.crespo-otero@ucl.ac.uk
cDigital Environment Research Institute, Queen Mary University of London, Empire House, 67-75 New Road, London E1 1HH, UK. E-mail: d.ditommaso@qmul.ac.uk
First published on 21st March 2025
Abstract
The electrochemical CO2 reduction reaction (eCO2R) is an important route toward the sustainable conversion of CO2 to value-added chemicals. However, developing efficient catalysts with high selectivity and stability remains challenging. Metalloporphyrins (M–PORs) represent an attractive class of molecular catalysts because their structural framework offers a unique combination of tunability of the peripheral ligands, flexibility of the metal centre, and versatility of the oxidation state of the metal. These properties can be exploited to tailor the catalytic properties of M–PORs for the eCO2R. Here, we present a comprehensive computational study using density functional theory to systematically explore M–POR catalysts with varying metal centers (Ni, Fe, Cu, Co), oxidation states, and anchoring ligands, aimed at enhancing the selective production of the C1 products (carbon monoxide and formic acid). Thermodynamic and electrochemical stability analyses revealed neutral M–PORs to be significantly more stable than their charged counterparts, providing crucial guidelines for catalyst design. A mechanistic analysis of reaction pathways—proton-coupled electron transfer (PCET) versus sequential proton and electron transfer (PT–ET)—identified PCET as highly favourable, with predominant selectivity towards formic acid. This study identifies Fe–POR as the one showing superior catalytic performance. Importantly, integrating these optimal molecular catalysts into two-dimensional (2D) carbonaceous frameworks led to further enhancement of catalytic performance, identifying 2D Fe–POR as a highly promising material for selective C1 product formation, thus providing a rational framework for designing effective molecular-to-framework electrocatalysts for the eCO2R.
1. Introduction
Transforming carbon dioxide (CO2) into valuable chemicals, fuels, and materials holds substantial societal and scientific significance. This process has the potential to mitigate the effects of climate change and advance the use of sustainable energy.1,2 Electrochemical CO2 reduction (CO2R) is considered a promising method thanks to its technical sophistication, maturity, and economic viability, which is why it has gained significant attention from both academic and industrial sectors.3–5 CO2R can produce high-energy and high-value one-carbon (C1) products such as carbon monoxide (CO), methane (CH4), formic acid (HCOOH), and methanol (CH3OH), and multi-carbon (C2+) products like ethylene (CH2CH2), ethanol (CH3CH2OH), acetic acid (CH3COOH), and n-propanol (CH3CH2CH2OH).6–8 These molecules can then be used as feedstock for the synthesis of long-chain hydrocarbon fuels.9–11 CO2R into C2+ products stands as the pinnacle achievement in electrochemical synthesis.12,13 Still, the endeavour to develop efficient catalysts that are capable of high product selectivity remains one of the critical technological hurdles for effective CO2R.14Metalloporphyrin (M–POR) has attracted significant interest.15 The structure of this molecular catalyst consists of a central metal atom surrounded by a cyclic carbon–nitrogen ring composed of four modified pyrrole subunits. The M–POR structural framework offers a unique combination of tunability of the peripheral ligands, flexibility of the metal centre, and versatility of the oxidation state of the metal, which can be exploited to tailor the catalytic properties of M–PORs for CO2R16 and other electrocatalytic reactions such as the oxygen evolution reaction.17 The synthesis of M–PORs using Earth-abundant elements such as iron18,19 or nickel20 reduces the synthetic cost of M–PORs compared to rare and precious metals, such as gold21 and silver,22 and thus provides a more sustainable alternative to develop a long-term ecologically and economically sustainable process.23–25
In M–POR complexes, the metal centre can also adopt various oxidation states, specifically neutral [M–POR]0, single reduced [M–POR]−, or doubly reduced [M–POR]2−, which affects the competition between CO2R and the hydrogen evolution reaction (HER, H+ + e− → 1/2H2), at the cathode.26 A density functional theory (DFT) study by Masood et al. found that lowering the nucleophilicity of the metal centre enhances CO2 binding relative to proton binding, promoting selectivity for CO2R.27 Specifically, [Fe–POR]− and [Co–POR]− showed lower electron density at the metal centre, making them less nucleophilic and more selective for CO2 adsorption and CO formation. In contrast, nucleophilic centres, such as in [RhP]0 and [IrP]0, favour proton binding, leading to the HER. Fe–POR shows a strong potential in CO2R applications. In the literature, one of the early studies on the iron tetraphenyl porphyrin complex FeTPP was carried out in the absence of proton donors using NEt4ClO4/DMF electrolyte.28 These aprotic conditions showed a moderate yield for CO, which was attributed to the [Fe(TPP)]2− species. The catalyst experienced rapid deactivation during the reaction, primarily due to chemical changes in the ligand, such as carboxylation and hydrogenation. These transformations negatively impacted the catalytic performance, resulting in low FE for CO production. Additionally, the stability of the catalyst was significantly compromised, further limiting its effectiveness in the reaction. In the 1990s, it was discovered that adding mono- (Li+, Na+) or divalent Lewis acids (Mg2+, Ca2+, Ba2+) to the electrolyte improved the activity and stability of FeTPP catalysts.29,30 The enhancement followed the order Mg2+ ≈ Ca2+ > Ba2+ > Li+ > Na+. Long-term electrolysis revealed CO as the major product and formate as a by-product, with the product ratio dependent on the Lewis acid used.
Cyclic voltammetry studies showed that in the presence of CO2 and a Lewis acid like Mg2+, a significant catalytic current appeared at the potential of the [Fe(TPP)]2− species. This indicated that catalysis was initiated during the final electron transfer step. The metal center of [Fe(TPP)]2− underwent nucleophilic attack by CO2, forming an intermediate Fe(II)–CO2 adduct. Mg2+ facilitated the reaction by forming an ion pair with negatively charged oxygen atoms in the adduct, which pulled an electron pair from Fe(0) to CO2, weakening C–O bonds and promoting CO release. This demonstrates that Mg2+ acts as an efficient Lewis acid, with its ion-pairing ability accelerating the catalytic process. A more significant enhancement of catalytic performance was found with the addition of Brønsted acids (HA). CV performed under CO2 in the presence of Brønsted acids (HA), yielding an increased catalytic current at the potential of [Fe(TPP)]2− species like that observed when Lewis acid was present.
Additional DFT studies by Cove et al. and Corbin et al. emphasised the importance of oxidation state: reduced forms [M–POR]− and [M–POR]2− showed higher faradaic efficiency (FE) for CO formation compared to neutral [M–POR]0, which had weak CO2-to-formate conversion.31,32 This highlights that fine-tuning the oxidation state of M–POR catalysts is critical for enhancing CO2 selectivity and minimising undesired HER activity.32–35
Following on from our previous computational screening of 110 M–PORs for their ability to activate the CO2 molecule,36 this study now focuses on the most promising catalysts (Fig. 1) and considers their ability to electrochemically convert the CO2 molecule to CO and HCOOH. Two-dimensional (2D) models of carbonaceous frameworks made from M–POR were also considered to explore for CO2R. The objective is to determine what factors could enhance the selectivity towards these C1 products. This work focuses on C1 products, such as CO and HCOOH, because atomically dispersed electrocatalysts like M–POR lack the adsorption sites necessary for C–C coupling, which leads to C2 intermediates.34 Consequently, these catalysts are more likely to facilitate the formation of only C1 products. Moreover, low-temperature CO2 electrolysis is very effective in producing high yields of C1 products, making their production advantageous from a techno-economic evaluation perspective.32 Moreover, C1 products offer several advantages, including easy storage and transportation, and they serve as valuable chemical intermediates and renewable energy carriers. For example, HCOOH can be used as a fuel in direct formic acid fuel cells,32,35,37 or CO could be subsequently used as a feedstock for the synthesis of alkanes through the classic Fisher–Tropsch process.38 Moreover, recent advancements in “two-step” tandem electrolysis,39,40 where CO2 is initially converted to CO in a CO2 electrolyser and then CO is further converted to other products in a CO electrolyser, rely on the assumption that the first CO2 electrolysis cell can convert CO2 to CO with high selectivity. This necessitates the development of high-performing and sustainable CO2-to-CO electrocatalysts.
 | ||
| Fig. 1 The metalloporphyrins (M–PORs) with varying metal (M), porphyrin (POR), and oxidation states of the metal (+2, +1, 0). The M–PORs considered are [Ni–POR1]−, [Ni–POR3]−, [Fe–POR1]0, [Fe–POR1]2−, [Fe–POR2]0, [Fe–POR3]0, [Fe–POR4]0, [Fe–POR4]2−, [Fe–POR5]0, [Fe–POR8]0, [Cu–POR5]2−, [Co–POR2]2−, [Co–POR4]−, and [Co–POR5]−. | ||
2. Computational details
2.1 Density functional theory calculations
Depending on the purpose, several DFT codes were used in this study. For the molecular M–PORs, the NWChem software (version 6.6)37 was first used to conduct the full geometry optimisations of the M–PORs in Fig. 1 and the Gaussian16 code41 was then used to conduct frequency analysis and consider the effect of aqueous environment with the implicit solvation model conductor-like screening model (COSMO).42,43 The B3LYP functional44,45 combined with the LANL2DZ basis set46 was employed for calculations using both NWChem and Gaussian. This level of theory was selected based on the benchmarking done in our work on CO2 activation.36 For the 2D M–POR carbonaceous frameworks, the CrystalMaker software47 was used to generate 2D models from the optimized structures of the M–PORs. These models were initially subjected to a variable cell optimization at the PBE-D3 level of theory, where the c-axis (perpendicular to the 2D M–POR) was fixed at 20 Å to minimise the interaction between neighbouring cells, and the lengths of the a-axis and b-axis were allowed to relax. Once the unit cell was optimized, the internal coordinates were re-optimized using the hybrid PBE0 exchange correlation functional.48 These calculations were conducted using VASP (version 6.4.0).49,50 VASP was also used to compare the electron localisation function (ELF) of the 1D (molecular) and 2D M–POR systems. The cut-off energy of the plane waves was set to 500 eV, with a 3 × 3 × 3 k-point mesh used for geometry optimisations and a 15 × 15 × 1 k-point mesh used for the static calculation and for the analysis of the electrons and orbitals.51 Structural relaxations were performed until the maximum residual force on each atom was less than 0.05 eV Å−1. Bader charge analysis was carried out with the core charges included.52 The d band centre (e(d)) and projected density of states (PDOS) was calculated using VASPKIT.532.2 Thermodynamic and electrochemical stability
The thermodynamic stability of the M–POR and 2D-M–POR catalysts was estimated by computing the binding energy, cohesive energy, and formation energy.34,54 The binding energy (Eb) was determined using the following equation:| Eb = EM–POR − EM − EPOR | (1) |
 | (2) |
 | (3) |
The electrochemical stability of the M–POR catalysts was evaluated by computing the dissolution potential (Udiss) of the metal according to the following expression:55
 | (4) |
 is the standard dissolution potential of the bulk metal and n is the number of electrons involved in the dissolution process. In this work, the values of
  were taken from Guo et al. and n was set to 2.56
2.3 Free energies of reaction
The solution-phase Gibbs free energies (G) of the intermediates involved in the electrochemical CO2 reduction to CO and HCOOH were calculated according to the expression:| G = Ee + δGVRT + ΔGsolv | (5) |
| UL = −ΔGmax/ne | (6) |
| ΔG = ΔEe + ΔδGVRT + ΔΔGsolv + ΔGpH + ΔGU | (7) |
3. Results and discussion
3.1 Stability and structural features of M–PORs
As reported in Fig. 2 and Table S1 in the ESI,† the formation energies (Ef) of metal coordination in the M–PORs are all highly negative, indicating the thermodynamic stability of these complexes. However, the formation energies of the M–PORs vary with the metal centre and oxidation state, with the most stable system being [Fe–POR1]2− (−0.62 eV). Also, the neutral [M–POR]0 catalysts are thermodynamically more stable (lower Eb) than the doubly reduced [M–POR]2−. According to the values of the dissolution potential of the M–PORs (Table S2 in the ESI†), all of the catalysts have values of Udiss between −0.3 and 0.5 V, which are higher than the experimentally applied potentials for the CO2R to CO (E0 = −0.52 V) and CHCOOH (E0 = −0.61 V) and of most products of the CO2R.59 This suggests that these active sites are all generally stable against dissolution in the CO2R and have good electrochemical stability. Consequently, the reaction energetics of the CO2R on the M–POR catalysts can be examined.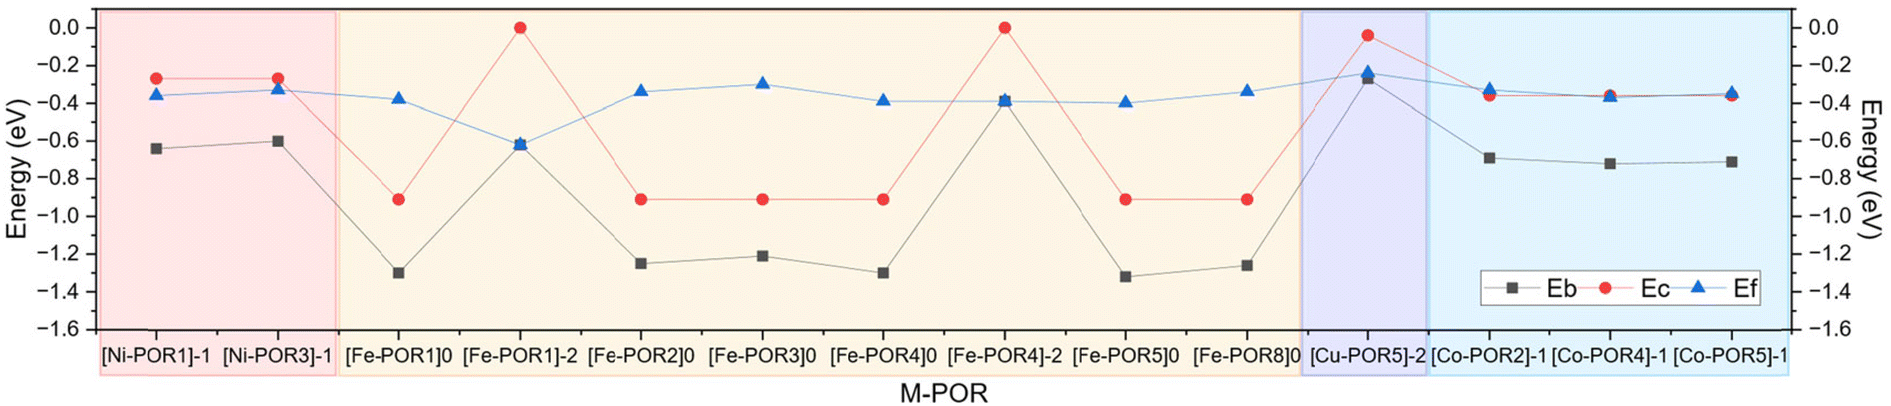 | ||
| Fig. 2 Thermodynamic stability of the M–PORs. Values of the cohesive energy (Ec) of the transition metal (M) bulk, binding energy between M and POR (Eb), and formation energy (Ef) of M–POR. Pink, yellow, purple, and blue zones correspond to the Ni–POR, Fe–POR, Cu–POR, and Co–POR catalysts, respectively. | ||
3.2 Mechanisms of reduction reactions on M–PORs
Proton-coupled electron transfer. The mechanism for PCET to generate CO and HCOOH is shown in Scheme 1.60 After the adsorption of CO2 to the catalyst (CO2 → *CO2), the first PCET step leads to two possible intermediates, *OCHO or *OCOH, depending on the atom coordinated to the catalyst, O or C, respectively. Depending on the intermediate, the second PCET will then generate HCOOH or CO. The free energy of reactions (ΔG) of the elementary steps leading to the formation of HCOOH and CO were computed using the CHE model. For HCOOH, these steps are the PCET to convert adsorbed
 to the O-coordinated intermediate (
 , ΔG*OCHO) and the next PCET converts adsorbed *OCHO to gas-phase formic acid (*OCHO + H+ + e− → HCOOH, ΔGHCOOH). For CO, the elementary steps are the PCET to convert adsorbed *CO2 to the C-coordinated intermediate (*CO2 + H+ + e− → *COOH, ΔG*COOH), and the next PCET converts adsorbed *OCOH to adsorbed carbon monoxide (*COOH + H+ + e− → *CO + H2O, ΔG*CO), which can then be released from the catalyst surface to form gas-phase CO (ΔGCO).
 | ||
| Scheme 1 Elementary steps for the two proton/two electron (2H+/2e−) electrochemical CO2 conversion to CO and HCOOH according to the PCET mechanism. The (*) is used to show adsorbed species. | ||
The Gibbs free energy diagrams of the CO2R for the PCET pathways leading to the formation of CO and HCOOH on Ni–POR ([Ni–POR1,3]−), Fe–POR ([Fe–POR1]0,2−, [Fe–POR2]0, [Fe–POR3]0, [Fe–POR4]0,2−, [Fe–POR5]0, [Fe–POR8]0), Cu–POR ([Cu–POR5]2−), and Co–POR ([Co–POR2,4,5]−) are reported in Fig. 3. The stability of the intermediates (*OCHO and *CO) controlling the formation of CO is significantly affected by the porphyrin ligands, metal centres, and oxidation state. The potential limiting step (ΔGPLS), identified as the step with the highest positive ΔG, serves as an indicator of the catalytic performance of an M–POR. Specifically, a high ΔGPLS signifies poor catalytic performance. The Gibbs free energy diagram for the CO2R pathways to CO and HCOOH on each M–POR is discussed in detail below.
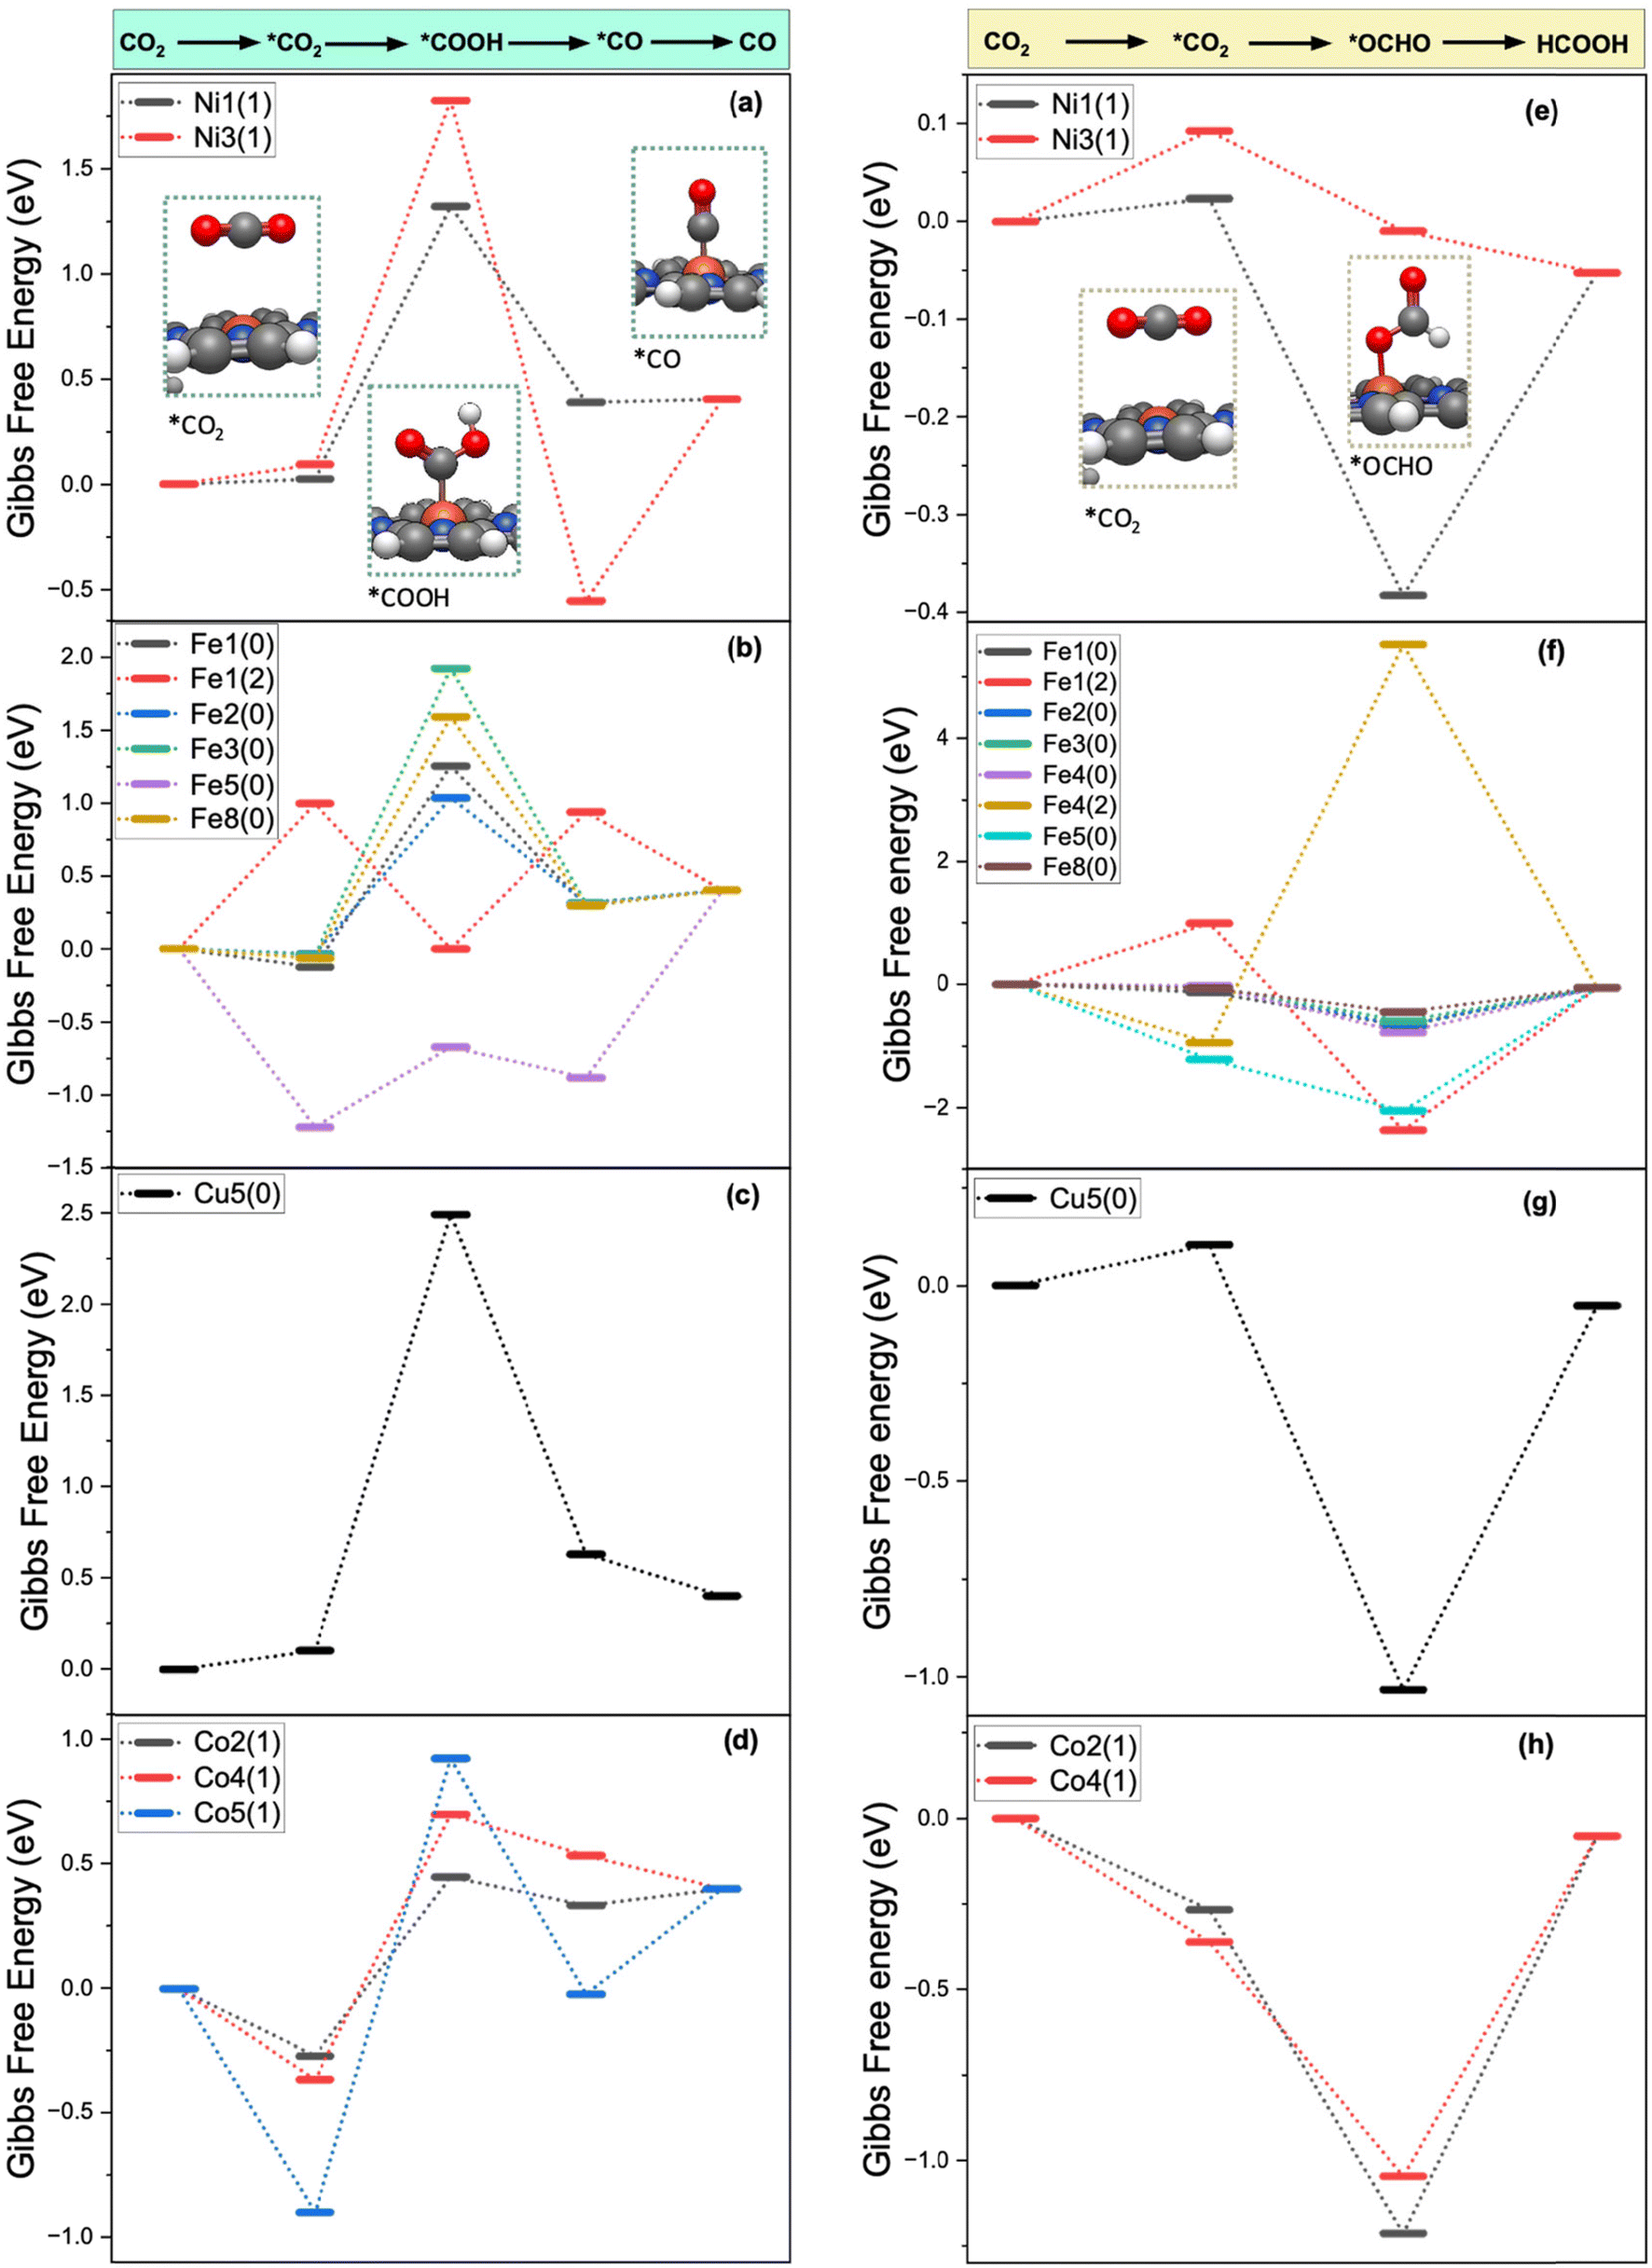 | ||
| Fig. 3 Gibbs free energy diagram for the CO2R to CO according to the PCET mechanism on (a) Ni–POR, (b) Fe–POR, (c) Cu–POR, and (d) Co–POR. Gibbs free energy diagram for the CO2R to HCOOH according to the PCET mechanism on (e) Ni–POR, (f) Fe–POR, (g) Cu–POR, and (h) Co–POR. Calculations conducted at the B3LYP/LANL2DZ/COSMO level of theory. Values in eV. | ||
Ni–POR. According to Fig. 3(a) and (e), the adsorption of CO2 is more favourable on [Ni–POR1]−
 than on [Ni–POR3]−
 . This can be justified by the larger orbital splitting on [Ni–POR1]− (11.1 eV) than on [Ni–POR3]− (2.32 eV), as a larger orbital splitting leads to a less favourable adsorption (see Fig. S3(a) and (c) in the ESI†), thus making it more difficult to activate CO2. The formation of *OCHO is most favourable on [Ni–POR1]− because of the lower free energy of the OCHO* intermediate (ΔG*OCHO = −0.41 eV), which suggests that the CO2R is more selective towards HCOOH on this system. Similarly, the formation of OCHO* is most favourable on [Ni–POR3]−1 (ΔG*OCHO = −0.10 eV). The formation of *CO is more favourable on [Ni–POR3]− with ΔG*CO = −0.55 eV than on [Ni–POR1]−. To summarise, Ni–POR systems favour the formation of HCOOH over the formation of CO.
Fe–POR. For the Fe–POR catalysts in Fig. 3(b) and (f), the most favourable system for the formation of *CO is [Fe–POR5]0 (DG*CO2 = −1.22 eV), while [Fe–POR1]2− has the least favourable CO2 adsorption (DG*CO2 = 1.0 eV). All Fe–POR systems favour the formation of *OCHO over *COOH except for [Fe–POR5]0, which favours *COOH by 0.04 eV. The overall trend from the most favourable to the least favourable Fe catalyst based on the DGPLS of the reaction for HCOOH formation is [Fe–POR4]2− > [Fe–POR8]0 > [Fe–POR3]0 > [Fe–POR2]0 > [Fe–POR1]0 > [Fe–POR4]0 > [Fe–POR5]0. This highlights the significance of the effect of moving from d8 to d6 electron configuration on the CO2R: [Fe–POR1]2− (d8) is more reactive than [Fe–POR1]0 (d6). These complexes are all high spin. Moreover, ligands with alkyl benzyl ([Fe–POR4]2− and [Fe–POR8]0 in Fig. 1) are more reactive than those with carboxyl benzyl groups ([Fe–POR2]0). However, the M–POR [Fe–POR5]0 is shown to be the least reactive despite the less steric hindrance, which indicates the importance of the ligands in M–POR catalysts in affecting their catalytic behaviour. Insights into the d-orbital splitting were obtained by computing the PDOS of the d-orbitals of the metal centre (Fig. S3 in the ESI†) to determine the energy difference between the d-orbitals with maximum PDOS (Fig. S4†). The orbitals presented for the PDOS of M–POR-CO and M–POR-HCOOH (Fig. S3†) show strong overlap and, thus, strong bonding. Based on the d-band values, Fe systems exhibit superior catalytic properties compared to other M–POR systems. The d-band centre is calculated in VASP by analysing the PDOS of the metal's d-orbitals in the system. The d-band centre is defined as the energy of the centre of mass of the d-states, often measured relative to the Fermi level.61 It correlates to catalytic performance because a d-band centre closer to the Fermi level typically enhances adsorption of reaction intermediates, thereby improving catalytic activity. If the d-band centre is too high or low, it may lead to too weak or too strong adsorption, respectively, which can reduce efficiency in catalytic reactions. The [Fe–POR3-CO]0 system has a d-band center value of −0.30 eV, positioned close to the Fermi level (Fig. S4(k)†). According to previous reports,62,63 the closer the d-band centre is to the Fermi level, the higher the electron occupation of the bonding state is, and the stronger the adsorption strength of the adsorbed molecules on the catalyst surface is because of the increase of orbital overlap and enhancement of electron donation and back-donation between the metal centre and the adsorbed CO2.64 This electronic effect stabilizes the CO2 adsorption intermediate by forming stronger chemical bonds and lowering the energy of the intermediate state. Consequently, the stabilization provided by the optimal d-band positioning directly contributes to facilitating the CO2 adsorption step, identified as the rate-determining step in our catalytic mechanism. The [Fe–POR4]2− system, with a d-band centre value of −0.32 eV (Fig. S4(p)†), demonstrates the best catalytic performance for HCOOH formation. Applying a potential of −1 V makes CO2R to CO on [Fe–POR1]0 more favourable than at 0 V, as ΔG decreases from −0.39 eV (at 0 V) to −1.39 eV (at −1 V; Fig. S8†). This is consistent with Lu's findings, which show that higher applied potentials increase the FE for CO formation.65 The applied potential also favours the HER (−0.39 eV), although it is not as favoured as CO formation.
Cu–POR. [Cu–POR5]0 in Fig. 3 was the only Cu–POR system that activates CO2 in our previous study.36 This seems feasible as all Cu–PORs are d10, making them very stable. However, in the neutral state, they are in d9 and can donate an electron to CO2 (Table S2 in the ESI†). In Fig. 3(c), the pathways to both HCOOH and CO formation have very stable intermediates which lead to high DGPLS. The [Cu–POR5]2− system shows to be consistent for CO and HCOOH formation with d-band centre values of −2.54 eV and −2.20 eV, respectively (Fig. S4(u) and (v)†), which suggests poor binding of substrates to the Cu centre. In a square planar d9 configuration, Cu(II) metal has fewer available low-energy empty orbitals to effectively participate in back-donation to CO2. In contrast, Fe(II) metals in a d6 square planar configuration can engage in stronger π-backbonding, where electron density from the metal is donated into the antibonding π* orbitals of CO2. This increased electron donation helps activate CO2 by weakening the C–O bonds and bending its linear structure, facilitating reduction. Because Cu(II) in a d9 state lacks a fully effective π-backbonding interaction, it forms weaker bonds with CO2, making its activation less favorable compared to a d6 metal. This could also suggest that the substrates can easily be desorbed from Cu–POR as there is less orbital overlap between the Cu centre and the substrate orbitals, meaning less electrons shared.
Co–POR. In Fig. 3(d) and (h), the CO2 adsorption is favourable on all Co-MORs, with free energies of adsorption being between DG*CO2 = −0.90 eV on [Co–POR5]0 and DG*CO2 = −0.27 eV and the least favourable is on [Co–POR2]0. The [Co–POR2]− and [Co–POR4]−1 catalysts favour the formation of the *OCHO intermediate (DGOCHO* = −0.95 eV and −0.68 eV, respectively) over *COOH (DG*COOH = 0.45 eV and 0.70 eV, respectively). However, [Co–POR5]− favours *COOH (DGCOOH* = 0.92 eV) and highly disfavours OCHO* formation. Overall, the most favourable CO2R pathways to CO and HCOOH occur on [Co–POR2]−1, where DG = 0.67 eV for CO formation and DG = 0.05 eV for HCOOH formation.
Proton transfer–electron transfer. Gottle and Koper proposed an alternative PT–ET mechanism for the electrochemical CO2 conversion to CO on M–POR,66 which includes the following elementary steps (Scheme 2): (i) CO2 adsorption onto the metal centre of M–POR; (ii) protonation of the [M–POR(CO2)] intermediate to form bound formate [M–POR(C(OH)O)]; (iii) protonation of the [M–POR(C(OH)O)] intermediate to form bound CO, [M–POR(CO)]; (iv) electron transfer to the [M–POR(CO)] intermediate to release CO; (v) electron transfer to reduce the metalloporphyrin to its initial oxidation state. In steps 2 and 3, H3O+ was used as the proton source. The reaction free energy diagrams for the PT–ET on Ni–POR ([Ni–POR1]−, [Ni–POR3]−), Fe–POR ([Fe–POR1]0, [Fe–POR1]2−, [Fe–POR2]0, [Fe–POR3]0, [Fe–POR4]0, [Fe–POR4]2−, [Fe–POR5]0, [Fe–POR8]0), Cu–POR ([Cu–POR5]2−), and Co–POR ([Co–POR2]2−, [Co–POR4]−, [Co–POR5]−) are reported in Fig. S3 of the ESI.† The reaction free energies for PT–ET are significantly higher than those of PCET, which makes PCET by far the most favourable pathway for the CO2R on M–POR.
 | ||
| Scheme 2 Elementary steps in the PT–ET mechanism of CO2-to-CO conversion with the initial CO2 adsorption taking place with the metal in the neutral [M–POR]0 oxidation state. | ||
 | ||
| Fig. 4 Gibbs free energy diagram for the HER on (a) Ni–POR, (b) Fe–POR, (c) Cu–POR, and (d) Co–POR. Calculations conducted at the B3LYP/LANL2DZ/COSMO level of theory. Values in eV. | ||
| η = Ueq. − UL | (8) |
 | ||
| Fig. 5 Overpotential for the electrocatalytic formation of (a) CO, (b) HCOOH, and (c) H2 on M–POR. Values in V. | ||
3.3 CO2R and the HER on two-dimensional M–PORs
The versatility of M–PORs, coming from the variety of available metal centres and organic linkers, makes them ideal building blocks for advanced porous frameworks with unique properties for diverse catalytic applications including CO2 reduction.16 2D M–PORs were thus designed using the most promising molecular M–POR catalysts to investigate their activity towards CO2R. Three Fe–PORs were selected as precursors for the generation of 2D frameworks, as shown in Fig. 6. These systems were chosen based on the efficiency of their 1D counterparts in the CO2-to-CO or CO2-to-HCOOH conversion process. Moreover, their potential suitability for forming stable 2D structures was evaluated by computing their cohesive energy, binding energy, formation energy, and dissolution potential (Fig. S6 in the ESI†). The 2D Fe–POR systems display good thermodynamic stability, attributed to the absence of heteroatoms in the peripheral ligands, which often introduces structural or electronic instabilities in similar complexes.70,71 | ||
| Fig. 6 1D and 2D Fe–POR systems considered for the carbonaceous framework analysis. Structures obtained at the PBE0 level of theory using VASP. | ||
The free energy pathways for the CO2R to CO and HCOOH and the HER to H2 on the 2D and 1D Fe–POR catalysts are compared in Fig. 7. The stability of the intermediates *OCHO and *COOH, which control the formation of HCOOH and CO, respectively, is significantly affected by the POR ligands. For CO formation (Fig. 7(a)) the adsorption of CO2 is more favourable on 2D Fe–POR5 than on 2D Fe–POR1 and 2D Fe–POR4 (
 and 0.36, eV respectively). As all systems have the same metal centre, the metal does not influence the stability of the intermediates. The adsorption of *COOH is also most favourable on 2D Fe–POR5 with DG*COOH = 0.30 eV, suggesting 2D Fe–POR5 as the most favourable system for CO formation and this is the GPLS. The strongest *CO adsorption is found with 2D Fe–POR4 at −0.86 eV, leading to unfavourable desorption of CO. For HCOOH formation (Fig. 7(b)), 2D Fe–POR5 shows the most favourable CO2 adsorption (DG*CO2 = 0.08 eV) and the most favourable *OCHO intermediate adsorption (DG*OCHO = 0.27 eV). This suggests that 2D Fe–POR5 is the most promising candidate for HCOOH formation. 2D Fe–POR1 and 2D Fe–POR4 show similar reaction thermodynamics, which suggests poor favourability to HCOOH formation. Therefore, from the free energy profiles, 2D Fe–POR5 is the most favourable for C1 product formation. However, when looking at the 1D Fe–POR, the order of reactivity is [Fe–POR1]0 > [Fe–POR4]0 > [Fe–POR5]0, with [Fe–POR5]0 being the least favourable.
 | ||
| Fig. 7 Reaction energetics for the CO2R to (a) CO and (b) HCOOH formation and (c) the HER to H2 formation on the 2D Fe–POR1,4,5 catalysts and reaction energetics for the CO2R to (d) CO and (e) HCOOH formation and (f) the HER to H2 formation on the 1D-Fe–POR1,4,5 catalysts. Calculations conducted at the PBE0 level of theory. Values in eV. | ||
These results suggest that 2D Fe–POR5 is the most promising candidate for HCOOH formation. In contrast, 2D Fe–POR1 and 2D Fe–POR4 exhibit similar reaction thermodynamics, indicating poor favourability for HCOOH production. Interestingly, while Fe–POR5 is the least reactive in the 1D configuration ([Fe–POR1]0 > [Fe–POR4]0 > [Fe–POR5]0), transitioning to the 2D structure significantly enhances its catalytic activity. This trend correlates with the shift in its d-band center, which decreases from −0.64 eV (Fig. S3(q)†) in 1D to −2.14 eV (Fig. S7(e)†) in 2D, suggesting stronger adsorption and activation of CO2.
A similar trend is observed in the HER. Among the 2D Fe–POR catalysts, Fe–POR5 exhibits the most favorable adsorption of the H intermediate (DG*H = −0.16 eV), while 2D Fe–POR1 and 2D Fe–POR4 have positive adsorption energies, indicating lower activity. Notably, the reactivity trend for HER in the 2D configuration follows the same order as in the 1D configuration (Fig. 7(d–f)), reinforcing the relationship between electronic structure and catalytic performance.
The overpotentials for the eCO2R and HER on the 2D M–POR are shown in Fig. 8. For Fe–POR5, negative overpotentials were observed for both HCOOH (−0.09 V) and H2 (−0.08 V), indicating that both reactions are highly favoured with no significant preference for one over the other. In contrast, Fe–POR1 exhibited a distinct difference in overpotentials, with HCOOH formation being more favoured (0.12 V) compared to H2 formation (0.24 V).
 | ||
| Fig. 8 Overpotentials for the H2, CO, and HCOOH formation on the 2D Fe–POR5. | ||
To gain deeper insight into the electronic properties influencing CO2 activation, the electron localisation function (ELF) was computed for 2D Fe–POR1,4,5 catalysts. The ELF provides a measure of electron density distribution, particularly around the Fe center, helping to visualise the degree of charge accumulation and its influence on adsorption. The ELF maps for CO− and OCOH− adsorbed M–POR systems (Fig. 9) reveal notable differences in electron density distribution. In Fe–POR1 (Fig. 9(a)), asymmetric electron density accumulation is observed, particularly on one side of the extended porphyrin ring. This localised electron density may guide CO2 adsorption towards the catalytic Fe center, facilitating activation. In contrast, Fe–POR4 exhibits a more dispersed and weakly localised electron density, which could contribute to its poorer catalytic performance by reducing effective charge transfer to the adsorbate. Finally, Fe–POR5 displays strong regions of localized electron density near the Fe center, possibly due to its smaller porphyrin framework restricting charge delocalisation. This localised charge distribution may enhance Fe–CO2 interactions, leading to improved catalytic activity.
 | ||
| Fig. 9 ELF plots for CO (top) adsorbed on (a) 2D-Fe–POR1, (b) 2D-Fe–POR4, and (c) 2D-Fe–POR5, and for OCOH (bottom) adsorbed on (a) 2D-Fe–POR1, (b) 2D-Fe–POR4, and (c) 2D-Fe–POR5. | ||
Further insights can be drawn from projected density of states (PDOS) analysis (Fig. S7†). Fe–POR5 exhibits the smallest bandgap (−2.14 eV for CO-adsorbed and −1.91 eV for OCOH-adsorbed configurations), suggesting enhanced electronic conductivity, which may facilitate charge transfer processes during CO2 reduction. The combination of ELF and PDOS data highlights the importance of electronic structure in governing catalytic performance, with Fe–POR5 emerging as the most promising candidate among the studied systems.
4. Conclusions
A computational investigation of the electrocatalytic CO2 reduction reaction on various metalloporphyrin catalysts with different metal centers (Ni, Fe, Cu, and Co), ligands, and oxidation states was conducted using DFT calculations. Thermodynamic and electrochemical stability analyses revealed that neutral systems exhibit higher stability compared to charged systems, with doubly reduced systems being the least stable. Two possible reaction mechanisms—proton-coupled electron transfer and sequential proton transfer–electron transfer—were explored, with PCET identified as the significantly more favourable pathway, predominantly forming HCOOH rather than CO. Among the studied catalysts, Fe–POR demonstrated superior catalytic performance towards these C1 products. Comparison of overpotentials for CO2 reduction and the competing hydrogen evolution reaction showed that most systems preferentially produce HCOOH.Transitioning to two-dimensional (2D) frameworks, particularly with Fe–POR systems, led to enhanced catalytic activity compared to their molecular counterparts, highlighting the potential for these frameworks in practical electrocatalysis applications. The main electronic descriptor impacting catalytic performance and product selectivity in both molecular and 2D M–POR frameworks appears to be the position of the d-band center relative to the Fermi level.
This study provides fundamental insights into the rational design and optimization of effective metalloporphyrin-based electrocatalysts, guiding future development toward efficient and selective CO2 conversion technologies.
Data availability
The data supporting the findings of this study are openly accessible on ZENODO at https://zenodo.org/records/11361107, reference number 11361107. Additionally, the authors confirm that the data are included in the ESI† and can also be requested from the corresponding author, DDT.Conflicts of interest
The authors declare no competing financial interest.Acknowledgements
This work was supported by the UK Royal Society International Exchanges Cost Share (IEC\R3\193106). We thank Prof. Hirotomo Nishihara and his team at Tohoku University for useful discussions. We are grateful to the UK Materials and Molecular Modelling Hub for computational resources, which is partially funded by EPSRC (EP/P020194/1). Further, D. D. T. thanks the Leverhulme Trust (RPG-2023-239) for resources supporting projects advancing materials characterization by computational means. Via our membership of the UK HEC Materials Chemistry Consortium, which is funded by EPSRC (EP/L000202), this work used the ARCHER2 UK National Supercomputing Service (https://www.archer.ac.uk). This research utilised Queen Mary's Apocrita HPC facility, supported by QMUL Research-IT. https://doi.org/10.5281/zenodo.438045.References
- P. Friedlingstein, M. W. Jones, M. O'Sullivan, R. M. Andrew, D. C. E. Bakker, J. Hauck, C. Le Quéré, G. P. Peters, W. Peters, J. Pongratz, S. Sitch, J. G. Canadell, P. Ciais, R. B. Jackson, S. R. Alin, P. Anthoni, N. R. Bates, M. Becker, N. Bellouin, L. Bopp, T. T. T. Chau, F. Chevallier, L. P. Chini, M. Cronin, K. I. Currie, B. Decharme, L. M. Djeutchouang, X. Dou, W. Evans, R. A. Feely, L. Feng, T. Gasser, D. Gilfillan, T. Gkritzalis, G. Grassi, L. Gregor, N. Gruber, Ö. Gürses, I. Harris, R. A. Houghton, G. C. Hurtt, Y. Iida, T. Ilyina, I. T. Luijkx, A. Jain, S. D. Jones, E. Kato, D. Kennedy, K. Klein Goldewijk, J. Knauer, J. I. Korsbakken, A. Körtzinger, P. Landschützer, S. K. Lauvset, N. Lefèvre, S. Lienert, J. Liu, G. Marland, P. C. McGuire, J. R. Melton, D. R. Munro, J. E. M. S. Nabel, S.-I. Nakaoka, Y. Niwa, T. Ono, D. Pierrot, B. Poulter, G. Rehder, L. Resplandy, E. Robertson, C. Rödenbeck, T. M. Rosan, J. Schwinger, C. Schwingshackl, R. Séférian, A. J. Sutton, C. Sweeney, T. Tanhua, P. P. Tans, H. Tian, B. Tilbrook, F. Tubiello, G. R. van der Werf, N. Vuichard, C. Wada, R. Wanninkhof, A. J. Watson, D. Willis, A. J. Wiltshire, W. Yuan, C. Yue, X. Yue, S. Zaehle and J. Zeng, Earth Syst. Sci. Data, 2022, 14, 1917–2005 Search PubMed.
- S. Chu and A. Majumdar, Nature, 2012, 488, 294–303 Search PubMed.
- J. B. Greenblatt, D. J. Miller, J. W. Ager, F. A. Houle and I. D. Sharp, Joule, 2018, 2, 381–420 CAS.
- F. A. Rahman, M. M. A. Aziz, R. Saidur, W. A. W. A. Bakar, M. R. Hainin, R. Putrajaya and N. A. Hassan, Renewable Sustainable Energy Rev., 2017, 71, 112–126 Search PubMed.
- L. Chen, C. Tang, K. Davey, Y. Zheng, Y. Jiao and S.-Z. Qiao, Chem. Sci., 2021, 12, 8079–8087 CAS.
- W. Zhang, Y. Hu, L. Ma, G. Zhu, Y. Wang, X. Xue, R. Chen, S. Yang and Z. Jin, Adv. Sci., 2018, 5, 205–239 Search PubMed.
- J. D. Shakun, P. U. Clark, F. He, S. A. Marcott, A. C. Mix, Z. Liu, B. Otto-Bliesner, A. Schmittner and E. Bard, Nature, 2012, 484, 49–54 CAS.
- V. K. Arora, J. F. Scinocca, G. J. Boer, J. R. Christian, K. L. Denman, G. M. Flato, V. V. Kharin, W. G. Lee and W. J. Merryfield, Geophys. Res. Lett., 2011, 38, L05805 Search PubMed.
- W. Lai, Y. Qiao, J. Zhang, Z. Lin and H. Huang, Energy Environ. Sci., 2022, 15, 3603–3629 CAS.
- B. Chang, H. Pang, F. Raziq, S. Wang, K.-W. Huang, J. Ye and H. Zhang, Energy Environ. Sci., 2023, 16, 4714–4758 Search PubMed.
- M. Jouny, W. Luc and F. Jiao, Nat. Catal., 2018, 1, 748–755 CAS.
- C. Chen, X. Yan, S. Liu, Y. Wu, Q. Wan, X. Sun, Q. Zhu, H. Liu, J. Ma, L. Zheng, H. Wu and B. Han, Angew. Chem., 2020, 132, 16601–16606 CrossRef.
- T. Kim and G. T. R. Palmore, Nat. Commun., 2020, 11, 3622 Search PubMed.
- R. Song, W. Zhu, J. Fu, Y. Chen, L. Liu, J. Zhang, Y. Lin and J. Zhu, Adv. Mater., 2020, 35, 1–25 Search PubMed.
- P. Gotico, Z. Halime and A. Aukauloo, Dalton Trans., 2020, 49, 2381–2396 CAS.
- S. Gu, A. N. Marianov, T. Lu and J. Zhong, Chem. Eng. J., 2023, 470, 144249 CrossRef CAS.
- H. Lv, X. Zhang, K. Guo, J. Han, H. Guo, H. Lei, X. Li, W. Zhang, U. Apfel and R. Cao, Angew. Chem., Int. Ed., 2023, 62, 1–6 Search PubMed.
- B. Mondal, P. Sen, A. Rana, D. Saha, P. Das and A. Dey, ACS Catal., 2019, 9, 3895–3899 Search PubMed.
- C. Costentin, S. Drouet, M. Robert and J.-M. Savéant, Science, 2012, 338, 90–94 CrossRef CAS PubMed.
- M. Abdinejad, L. F. B. Wilm, F. Dielmann and H. B. Kraatz, ACS Sustainable Chem. Eng., 2021, 9, 521–530 CrossRef CAS.
- Z. Cao, S. B. Zacate, X. Sun, J. Liu, E. M. Hale, W. P. Carson, S. B. Tyndall, J. Xu, X. Liu, X. Liu, C. Song, J. Luo, M. Cheng, X. Wen and W. Liu, Angew. Chem., 2018, 130, 12857–12861 Search PubMed.
- G. Dutta, A. K. Jana, D. K. Singh, M. Eswaramoorthy and S. Natarajan, Chem. – Asian J., 2018, 13, 2677–2684 Search PubMed.
- X. Zhang, X. Li, D. Zhang, N. Q. Su, W. Yang, H. O. Everitt and J. Liu, Nat. Commun., 2017, 8, 14542 Search PubMed.
- S. Park, D. Bézier and M. Brookhart, J. Am. Chem. Soc., 2012, 134, 11404–11407 CAS.
- A. Klinkova, P. De Luna, C.-T. Dinh, O. Voznyy, E. M. Larin, E. Kumacheva and E. H. Sargent, ACS Catal., 2016, 6, 8115–8120 CAS.
- C. Römelt, S. Ye, E. Bill, T. Weyhermüller, M. van Gastel and F. Neese, Inorg. Chem., 2018, 57, 2141–2148 Search PubMed.
- Z. Masood and Q. Ge, Molecules, 2023, 28, 1–12 Search PubMed.
- M. Hammouche, D. Lexa, J. M. Savéant and M. Momenteau, J. Electroanal. Chem. Interfacial Electrochem., 1988, 249, 347–351 CAS.
- I. Bhugun, D. Lexa and J.-M. Savéant, J. Phys. Chem., 1996, 100, 19981–19985 CAS.
- M. Hammouche, D. Lexa, M. Momenteau and J. M. Saveant, J. Am. Chem. Soc., 1991, 113, 8455–8466 CAS.
- H. Cove, D. Toroz and D. Di Tommaso, Mol. Catal., 2020, 498, 111248 CAS.
- N. Corbin, J. Zeng, K. Williams and K. Manthiram, Nano Res., 2019, 12, 2093–2125 Search PubMed.
- E. Boutin, L. Merakeb, B. Ma, B. Boudy, M. Wang, J. Bonin, E. Anxolabéhère-Mallart and M. Robert, Chem. Soc. Rev., 2020, 49, 5772–5809 CAS.
- D. Di Tommaso, D. Di, T. Q. Zhao, R. Crespo-Otero and B. Y. Xia, J. Energy Chem., 2023, 85, 490–500 Search PubMed.
- H. Shin, K. U. Hansen and F. Jiao, Nat. Sustain., 2021, 4, 911–919 Search PubMed.
- A. T. Uddin, Q. Zhao, D. Toroz, R. Crespo-Otero and D. Di Tommaso, Mol. Catal., 2024, 565, 114386 CrossRef CAS.
- E. Aprà, E. J. Bylaska, W. A. de Jong, N. Govind, K. Kowalski, T. P. Straatsma, M. Valiev, H. J. J. van Dam, Y. Alexeev, J. Anchell, V. Anisimov, F. W. Aquino, R. Atta-Fynn, J. Autschbach, N. P. Bauman, J. C. Becca, D. E. Bernholdt, K. Bhaskaran-Nair, S. Bogatko, P. Borowski, J. Boschen, J. Brabec, A. Bruner, E. Cauët, Y. Chen, G. N. Chuev, C. J. Cramer, J. Daily, M. J. O. Deegan, T. H. Dunning, M. Dupuis, K. G. Dyall, G. I. Fann, S. A. Fischer, A. Fonari, H. Früchtl, L. Gagliardi, J. Garza, N. Gawande, S. Ghosh, K. Glaesemann, A. W. Götz, J. Hammond, V. Helms, E. D. Hermes, K. Hirao, S. Hirata, M. Jacquelin, L. Jensen, B. G. Johnson, H. Jónsson, R. A. Kendall, M. Klemm, R. Kobayashi, V. Konkov, S. Krishnamoorthy, M. Krishnan, Z. Lin, R. D. Lins, R. J. Littlefield, A. J. Logsdail, K. Lopata, W. Ma, A. v. Marenich, J. Martin del Campo, D. Mejia-Rodriguez, J. E. Moore, J. M. Mullin, T. Nakajima, D. R. Nascimento, J. A. Nichols, P. J. Nichols, J. Nieplocha, A. Otero-de-la-Roza, B. Palmer, A. Panyala, T. Pirojsirikul, B. Peng, R. Peverati, J. Pittner, L. Pollack, R. M. Richard, P. Sadayappan, G. C. Schatz, W. A. Shelton, D. W. Silverstein, D. M. A. Smith, T. A. Soares, D. Song, M. Swart, H. L. Taylor, G. S. Thomas, V. Tipparaju, D. G. Truhlar, K. Tsemekhman, T. van Voorhis, Á. Vázquez-Mayagoitia, P. Verma, O. Villa, A. Vishnu, K. D. Vogiatzis, D. Wang, J. H. Weare, M. J. Williamson, T. L. Windus, K. Woliński, A. T. Wong, Q. Wu, C. Yang, Q. Yu, M. Zacharias, Z. Zhang, Y. Zhao and R. J. Harrison, J. Chem. Phys., 2020, 152, 184102 CrossRef PubMed.
- H. Jahangiri, J. Bennett, P. Mahjoubi, K. Wilson and S. Gu, Catal. Sci. Technol., 2014, 4, 2210–2229 RSC.
- T. Möller, M. Filippi, S. Brückner, W. Ju and P. Strasser, Nat. Commun., 2023, 14, 5680 CrossRef PubMed.
- T. Burdyny and F. M. Mulder, Joule, 2024, 8, 2449–2452 CrossRef.
- M. J. Frisch, G. W. Trucks, H. B. Schlegel, G. E. Scuseria, M. A. Robb, J. R. Cheeseman, G. Scalmani, V. Barone, G. A. Petersson, H. Nakatsuji, X. Li, M. Caricato, A. V. Marenich, J. Bloino, B. G. Janesko, R. Gomperts, B. Mennucci, H. P. Hratchian, J. V. Ortiz, A. F. Izmaylov, J. L. Sonnenberg, D. Williams-Young, F. Ding, F. Lipparini, F. Egidi, J. Goings, B. Peng, A. Petrone, T. Henderson, D. Ranasinghe, V. G. Zakrzewski, J. Gao, N. Rega, G. Zheng, W. Liang, M. Hada, M. Ehara, K. Toyota, R. Fukuda, J. Hasegawa, M. Ishida, T. Nakajima, Y. Honda, O. Kitao, H. Nakai, T. Vreven, K. Throssell, J. A. Montgomery Jr, J. E. Peralta, F. Ogliaro, M. J. Bearpark, J. J. Heyd, E. N. Brothers, K. N. Kudin, V. N. Staroverov, T. A. Keith, R. Kobayashi, J. Normand, K. Raghavachari, A. P. Rendell, J. C. Burant, S. S. Iyengar, J. Tomasi, M. Cossi, J. M. Millam, M. Klene, C. Adamo, R. Cammi, J. W. Ochterski, R. L. Martin, K. Morokuma, O. Farkas, J. B. Foresman and D. J. Fox, Gaussian 16, Revision C.01, Gaussian, Inc., Wallingford, CT, 2016 Search PubMed.
- A. Klamt and G. Schürmann, J. Chem. Soc., Perkin Trans. 2, 1993, 799–805 RSC.
- A. Klamt, WIREs Comput. Mol. Sci., 2011, 1, 699–709 CrossRef CAS.
- A. D. Becke, J. Chem. Phys., 1993, 98, 5648–5652 Search PubMed.
- C. Lee, W. Yang and R. G. Parr, Phys. Rev. B: Condens. Matter Mater. Phys., 1988, 37, 785–789 Search PubMed.
- W. R. Wadt and P. J. Hay, J. Chem. Phys., 1985, 82, 284–298 CAS.
- CrystalMaker, CrystalMaker:11, 2024 Search PubMed.
- J. P. Perdew, K. Burke and M. Ernzerhof, Phys. Rev. Lett., 1996, 77, 3865–3868 CAS.
- R. Jinnouchi, F. Karsai and G. Kresse, Phys. Rev. B, 2019, 100, 014105 CAS.
- R. Jinnouchi, J. Lahnsteiner, F. Karsai, G. Kresse and M. Bokdam, Phys. Rev. Lett., 2019, 122, 225701 CAS.
- H. J. Monkhorst and J. D. Pack, Phys. Rev. B: Solid State, 1976, 13, 5188–5192 Search PubMed.
- M. Yu and D. R. Trinkle, J. Chem. Phys., 2011, 6, 14–134 Search PubMed.
- V. Wang, N. Xu, J.-C. Liu, G. Tang and W.-T. Geng, Comput. Phys. Commun., 2021, 267, 108033 CAS.
- Q. Zhao, K. Lei, B. Y. Xia, R. Crespo-Otero and D. Di Tommaso, J. Energy Chem., 2024, 93, 166–173 CAS.
- J. Greeley and J. K. Nørskov, Electrochim. Acta, 2007, 52, 5829–5836 Search PubMed.
- X. Guo, J. Gu, S. Lin, S. Zhang, Z. Chen and S. Huang, J. Am. Chem. Soc., 2020, 142, 5709–5721 CAS.
- J. K. Nørskov, T. Bligaard, J. Rossmeisl and C. H. Christensen, Nat. Chem., 2009, 1, 37–46 Search PubMed.
- Q. Zhao, K. Lei, B. Y. Xia, R. Crespo-Otero and D. Di Tommaso, J. Energy Chem., 2024, 93, 166–173 Search PubMed.
- D. D. Zhu, J. L. Liu and S. Z. Qiao, Adv. Mater., 2016, 28, 3423–3452 Search PubMed.
- A. J. Göttle and M. T. M. Koper, Chem. Sci., 2016, 8, 458–465 Search PubMed.
- H. Xin, A. Vojvodic, J. Voss, J. K. Nørskov and F. Abild-Pedersen, Phys. Rev. B: Condens. Matter Mater. Phys., 2014, 89, 115114 Search PubMed.
- L. Gong, D. Zhang, Y. Shen, X. Wang, J. Zhang, X. Han, L. Zhang and Z. Xia, J. Catal., 2020, 390, 126–134 CAS.
- H. Xu, D. Cheng, D. Cao and X. C. Zeng, Nat. Catal., 2018, 1, 339–348 CAS.
- P. He, H. Feng, S. Wang, H. Ding, Y. Liang, M. Ling and X. Zhang, Mater. Adv., 2022, 3, 4566–4577 CAS.
- X. Lu, H. A. Ahsaine, B. Dereli, A. T. Garcia-Esparza, M. Reinhard, T. Shinagawa, D. Li, K. Adil, M. R. Tchalala, T. Kroll, M. Eddaoudi, D. Sokaras, L. Cavallo and K. Takanabe, ACS Catal., 2021, 11, 6499–6509 CAS.
- A. J. Göttle and M. T. M. Koper, Chem. Sci., 2017, 8, 458–465 Search PubMed.
- J. Rossmeisl, Z.-W. Qu, H. Zhu, G.-J. Kroes and J. K. Nørskov, J. Electroanal. Chem., 2007, 607, 83–89 CrossRef CAS.
- Y.-J. Zhang, V. Sethuraman, R. Michalsky and A. A. Peterson, ACS Catal., 2014, 4, 3742–3748 Search PubMed.
- M. J. Cheng, Y. Kwon, M. Head-Gordon and A. T. Bell, J. Phys. Chem. C, 2015, 119, 21345–21352 CrossRef CAS.
- R. Sakamoto, R. Toyoda, G. Jingyan, Y. Nishina, K. Kamiya, H. Nishihara and T. Ogoshi, Coord. Chem. Rev., 2022, 466, 214577 CrossRef CAS.
- D. Zhao, Z. Zhuang, X. Cao, C. Zhang, Q. Peng, C. Chen and Y. Li, Chem. Soc. Rev., 2020, 49, 2215–2264 RSC.
Footnote |
| † Electronic supplementary information (ESI) available. See DOI: https://doi.org/10.1039/d5cy00156k |
| This journal is © The Royal Society of Chemistry 2025 |