
 Open Access Article
 This Open Access Article is licensed under a
 Creative Commons Attribution 3.0 Unported Licence
Realising the ambivalent nature of H2O2 in oxidation catalysis – its dual role as an oxidant and a substrate
C. Maurits
de Roo
 ,
Marika
Di Berto Mancini
and
Wesley R.
Browne
*
,
Marika
Di Berto Mancini
and
Wesley R.
Browne
*
Faculty of Science and Engineering, University of Groningen, Nijenborgh 3, 9747AG, Groningen, The Netherlands. E-mail: w.r.browne@rug.nl
First published on 11th June 2025
Abstract
H2O2 is a desirable terminal oxidant due to its good atom economy with H2O being the only by-product when used productively. Its relative stability is advantageous in transport and storage, meaning that catalysts can both activate and direct its oxidising power towards selective oxidation of organic substrates. Wasteful disproportionation of H2O2 (into H2O and O2) is a well-recognised challenge and receives little, if any, attention in catalyst design. Nevertheless, understanding how H2O2 reacts during catalysed oxidations is essential to avoid inefficient use of H2O2, and, more importantly, hazardous conditions in which large amounts of O2 are released by disproportionation. Reaction progress monitoring is an essential component in catalyst development, typically focusing on substrate conversion/product yield. In this frontier article, we advocate for multi-spectroscopic reaction progress monitoring in which all reaction components, including the oxidant and O2, are tracked over the course of catalysed reactions to establish comprehensive time resolved mass balances. This approach provides insight into the reaction pathways that lead to disproportionation and the species responsible for it. We discuss selected cases to highlight the range of pathways possible and how these impact efforts towards reaction optimisation through catalyst design. In particular, the paradigm that the catalyst responsible for substrate oxidation is a distinct species from that responsible for H2O2 disproportionation, e.g., catalyst degradation products, is likely often incorrect. Rather, various pathways are possible, e.g., the same catalyst intermediate engages in both H2O2 and substrate oxidation. Various reaction pathways with respect to H2O2 consumption are discussed in the case studies. Our conclusion is that it is useful to consider that H2O2, in addition to being an oxidant, can compete with the intended organic substrate. This aspect is particularly important in efforts to elucidate reaction mechanisms and when redesigning catalysts rationally to improve performance, especially for use on large reaction scales where safety is paramount.
Introduction
Despite that H2O2 is a potent oxidant, it is remarkably stable from a kinetic perspective and can be transported and stored relatively safely even at high concentrations. Its presence in biological systems is, however, invariably destructive and as a consequence nature has evolved many effective ways to ‘deactivate’ it safely, using oxidases and, when necessary, a wide range of catalases.1,2 Disproportionation (catalase) neutralises H2O2 by converting it to H2O and O2, but in doing so chemical potential is wasted, and worse, it can lead to other reactive oxygen species such as hydroxyl radicals, singlet oxygen, and the superoxide radical anion. Hence, the more effective way to deactivate H2O2 is to use it as a terminal oxidant releasing water and oxidising an organic substrate. In this way, the generation of reactive oxygen species is minimised.In synthetic chemistry, this is the route of choice, using H2O2 as a reagent and H2O2 stands just behind molecular oxygen in terms of atom efficiency, with water as the only by-product in C–H hydroxylation, sulfoxidation and epoxidation, and complete atom economy in alkene dihydroxylation.3 These reactions are important in nearly all branches of the chemical industry, from polymer synthesis to medicinal chemistry.4–7
Nature inspires synthetic chemists in the design of ligands for transition metal catalysts to use H2O2 effectively, and over the last half-century, a small group of ligand families have emerged, primarily for oxidation catalysis based on iron and manganese, but also on other metals such as copper and cobalt.8–13 In these efforts, the focus is on selectivity, well-defined oxidative transformations, and to a lesser extent on efficiency, primarily in the productive use of H2O2. That is, while effectiveness in terms of substrate conversion is readily apparent, and indeed expected, in most studies in the literature, the fate of H2O2 in these reactions is unclear, more often than not, in large part due to the challenge in determining H2O2 consumed and O2 released during and after reactions. Moreover, when scaling a catalysed reaction up to an industrial process, with H2O2 as a terminal oxidant, efficiency in H2O2 use is critically important beyond activity and selectivity, as high concentrations of O2 can create hazardous conditions.
In this frontier article, we focus on the pathways involved in the competition between the oxidation of organic substrates and the oxidation of H2O2. The approaches needed to suppress the latter reaction depend on the mechanisms involved and hence knowledge of the nature of the species responsible is essential.
Reaction progress monitoring, in terms of the oxidation of organic substrates, is well developed, using in-line (Raman, FTIR, and NMR spectroscopy), at-line (GC and HPLC), and off-line (GC, HPLC, and NMR spectroscopy) techniques. In contrast, monitoring the concentration of H2O2 and O2 during a reaction is more challenging and we will discuss first the (spectroscopic) methods currently available.
Analytical tools for reaction monitoring
Spectroscopic tools that are readily available for monitoring the progress of reactions can be divided into those that monitor the liquid (reaction mixture) phase and those that monitor the headspace above the reaction mixture inside a reaction vessel (e.g., a flask, a cuvette, etc.), or pipe in the case of flow chemistry (Fig. 1). | ||
| Fig. 1 Analytical tools for reaction monitoring discussed here. (A) Headspace FTIR spectroscopy (CO2); (B) UV/vis absorption spectroscopy (e.g., catalyst concentration); (C) luminescence spectroscopy (e.g., 1O2 luminescence); (D) headspace Raman spectroscopy (gases that evolve from the reaction mixture); and (E) Raman (or resonance Raman) spectroscopy (reaction components in solution). | ||
Monitoring reactions in solution
Optical techniques, e.g., UV/vis absorption spectroscopy, are invaluable in studying reaction mixtures when one or more of the reaction components, typically transition metal catalysts, show significant absorption (Fig. 1B). A 0.01–10 mM concentration window of the absorbing reaction components is typically required, dependent on the molar absorptivity of the compounds present, the optical path length, and the dynamic range of the spectrometer. The concentration of species of interest can be determined readily by the Beer–Lambert relation. Similarly, the liquid phase can also be monitored by (resonance) Raman and luminescence spectroscopy. Raman spectroscopy, although using visible/near-infrared light, provides vibrational spectra of the components at concentrations typically >50 mM or at (sub) mM concentrations where the wavelength of the laser used is resonant with an absorption band of a compound of interest (resonance Raman spectroscopy, Fig. 1E).14 Since the intensity of Raman scattering is linearly proportional to concentration, it is especially convenient for quantitative studies. Although less obvious in regard to reaction monitoring, luminescence spectroscopy is useful where the substrate, intermediate, product or other component present in the reaction mixture shows photo- or chemiluminescence (Fig. 1C).As a case in point, the generation of singlet oxygen (1O2), e.g., upon the reaction of MoO4 with H2O2, can be followed by the NIR emission of 1O2 (1269 nm).15,16 Quantification of 1O2 emission produced through chemiluminescence requires calibration of the spectrometer used to record luminescence intensities to relate it to the transient concentration of 1O2. The limit of detection and quantification of 1O2 emission for a particular spectrometer can be determined using the reaction of MoO4 with H2O2. 1O2 emission intensity is correlated also with the release of 3O2 into the headspace of a sealed cuvette, e.g., by headspace Raman spectroscopy (vide infra).17
The reaction intermediates can be monitored by many other analytical techniques, not least online mass spectrometry as discussed in detail elsewhere.18 In addition to these time-resolved methods, sampling the liquid phase by withdrawing aliquots from the reaction mixture at certain time intervals for off-line analysis by NMR spectroscopy or chromatography methods (e.g., HPLC, GC) is quite standard. However, care should be taken to ensure rapid quenching of the reaction in the sample to maintain time resolution. Furthermore, where reactions are carried out at low temperatures, heating the withdrawn sample before quenching can reduce the reliability of the measurement. It is in these aspects that in-line measurements are particularly beneficial. Finally, often for transition metal based oxidation catalysts, (spectro)electrochemical oxidation/reduction can be useful in identifying potential reaction intermediates,19,20 as, for example, in the study of [Mn(OTf)2(RPDP)] discussed below.21
Monitoring the headspace over reaction mixtures
The headspace above the reaction mixture can be monitored for the production or consumption of gases by FT-IR spectroscopy (CO2) and/or headspace Raman spectroscopy (O2, N2, H2, Fig. 1D). Headspace FT-IR spectroscopy can be performed readily in ordinary glass reaction vessels as the spectral cut-off for glass is ca. 2000 cm−1, at a lower wavenumber than many gases of interest. Indeed, a simple approach is to lower a (sealed) cuvette so that the IR light travels through the headspace of the cuvette rather than the liquid phase (Fig. 1A). In this way the evolution of CO2 gas can be monitored and quantified using the pathlength and its molar absorptivity.22 Although Raman scattering from gases is much weaker than in the condensed phase, due to both differences in polarisability and more critically the number density in the confocal volume, headspace Raman spectroscopy is effective in monitoring the headspace above reactions for gases such as O2 (at 1556 cm−1), N2 (at 2332 cm−1), and H2 (at 4197 cm−1)23 (Fig. 1D).24 The gas of interest (usually O2 in the case of oxidation catalysis) may be quantified by relating the integrated Raman intensity of the νO−O,str band to the number of moles of the gas, following the ideal gas law and Henry's law,17 which accounts for the shift in equilibrium between the gas in the headspace and the gas dissolved in the liquid phase (due to the production/consumption of the gas in the closed volume).In the next sections, the power of a multi-spectroscopic approach is exemplified by three case studies exhibiting three distinct types of interaction between a Fe- or Mn-catalyst and H2O2 with respect to substrate oxidation and H2O2 disproportionation.
Case studies in elucidating reaction pathways
In the following examples, we show how understanding which species are responsible for catalysing disproportionation of H2O2 enables rational redesign of catalyst systems to minimise waste.Competition between H2O2 and organic compounds as substrates for the activated form of an oxidation catalyst
The [Mn(OTf)2(RPDP)] family of complexes (where R = H, OMe and RPDP = N,N′-bis(2′′-(4′′-R-pyridylmethyl)-2,2′-bipyrrolidine)) and Mn(II)/pyridine-2-carboxylic acid are two examples of catalysts in which the same reactive species is responsible for both substrate oxidation and H2O2 decomposition. | ||
| Fig. 2 Manganese ((R,R)-[Mn(OTf)2 (RPDP)]) catalysed epoxidation of cis-β-methylstyrene with H2O2.26 | ||
Oxidations with these catalysts are typically carried out with a small (20%) excess of H2O2 with respect to the organic substrate.28 Substituents on the pyridine rings show a considerable influence over the efficiency of the reactions, i.e., conversion and product yields (Table 1). Indeed, although the effect of substituents on conversion is considerable, the effect on enantiomeric excess is all the more remarkable considering the lack of proximity of the substituent to the reaction centre. Since the substituents are in the para-position, steric effects are less pronounced than in the other positions, and hence the effect of the substituents on electron density at the metal centre is focused on in regard to rationalisation of trends observed.26,29
| Catalyst | R | Conversion (yield, %) | ee (%) |
|---|---|---|---|
| HPDP–Mn | –H | 61 (38) | 43 |
| OMePDP–Mn | –OMe | 80 (59) | 69 |
| MePDP–Mn | –Me | 100 (67) | 63 |
| ClPDP–Mn | –Cl | 57 (33) | 40 |
| Me2NPDP–Mn | –NMe2 | 100 (75) | 82 |
| CO2EtPDP–Mn | –CO2Et | 44 (22) | 43 |
The difference in the performance of the variously substituted catalysts, e.g., between HPDP–Mn and OMePDP–Mn analogues (Table 1), and in particular the turnover number (TON), has been ascribed tentatively to the resilience of the catalyst toward inactivation/degradation, or to the maximum turn over frequencies (TOF) each catalyst can achieve and hence compete with unproductive reactions (disproportionation of H2O2).
A combination of resonance Raman, EPR, and UV/vis absorption spectroscopy under reaction conditions revealed the appearance of multi-nuclear Mn(III) and Mn(IV) complexes, which are reminiscent of dinuclear manganese complexes that show activity in the disproportionation of H2O2 (vide infra).21,30 However, these species were shown, using in-line time resolved spectroscopy, to be mostly resting states. In line reaction monitoring of substrate conversion and evolution of O2 revealed that the differences in the efficiency of the OMePDP–Mn complex and its HPDP–Mn analogue were in fact due to the effect substituents on the relative rates of substrate oxidation and H2O2 oxidation.21
The comparative study focused on the relative efficiency of the two catalysts in the epoxidation of styrene and disproportionation of H2O2 over the whole course of the reaction.21 Simultaneous headspace/liquid phase in line Raman spectroscopy was used to quantify the loss of H2O2/release of O2, as well as the formation of styrene oxide (Fig. 3). In these experiments, H2O2 was added dropwise over 10 min or longer. The spectroscopic data revealed that O2 was formed concurrent with alkene oxidation and that the relative efficiencies for the two reactions were constant over the entire period of H2O2 addition for both catalysts (Fig. 3).
 | ||
| Fig. 3 (A) Manganese catalysed epoxidation of styrene using [Mn(OTf)2(RPDP)]. For (B) [MnII(OTf)2(HPDP)] and (C) [MnII(OTf)2(OMePDP)] the amount of O2 released (blue) into the headspace and epoxide formed (red) in the liquid phase, both determined by Raman spectroscopy. Reproduced from Kasper et al. (ACS 2023).21 | ||
However, the ratio of alkene oxidation to H2O2 is different for the two complexes. [Mn(OTf)2(OMePDP)] favours alkene oxidation over H2O2 oxidation to a greater extent than [Mn(OTf)2(HPDP)]. These observations provided a strong indication that H2O2 and styrene were competitive substrates for the H2O2 activated catalyst, rather than that different species were responsible for alkene oxidation and H2O2 disproportionation. Furthermore, the data indicate that the substituents determine the overall efficiency of the catalysts by affecting the selectivity towards oxidation of alkene and H2O2.
The influence of substituents on the activity of the catalysts can be estimated from the turnover frequency (TOF) for the formation of epoxide over time after each drop of H2O2. The conclusion reached on this basis is that [MnII(OTf)2(OMePDP)] is a more active catalyst than [MnII(OTf)2(HPDP)]. However, when the oxidation of H2O2 is taken into account, as well, the overall activity of the two catalysts is in fact similar. While it is uncertain whether the same species is responsible for both H2O2 and substrate oxidation, the constant relative reactivity over the entire course of the reaction suggests it is.21 In conclusion, this example showcases H2O2 as a competing substrate for the activated catalyst and how simultaneous in-line monitoring can reveal this.
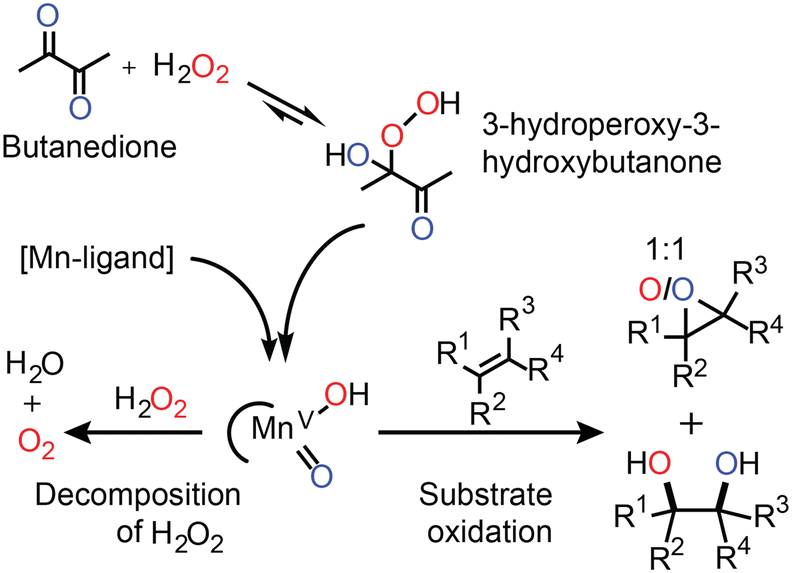 | ||
| Fig. 4 The activation of H2O2 by the in situ prepared Mn(II)/PCA catalyst relies on the initial formation of a ketone-hydroperoxide adduct (e.g., with butanedione). Organic substrates compete with H2O2 for the reaction with the activated manganese species (tentatively assigned LMn(V)O(OH)).33 The results of oxygen atom tracking with oxygen in H2O2 (red) and oxygen in butanedione (blue) are shown.31 | ||
Elucidation of the mechanism by which this catalyst operates is challenging since the low concentration of Mn(II) used means that direct observation of catalyst species is impractical. Nevertheless, in line spectroscopy is invaluable in monitoring changes to the major (>50 mM) components of the reaction mixtures and has allowed for a relatively detailed understanding of the role of each reaction component to be established (Fig. 4).31–33 For example, a ketone such as butanedione acts as a co-catalyst by forming the hydroperoxy-adduct with H2O2 from which the oxidising manganese species is formed (Fig. 4). The formation of this species is rate limiting, and unusually the reaction rate shows a zero-order dependence on the substrate concentration. However, the catalyst is still highly selective. For example, while in separate reactions, styrene and 1-phenyl-ethanol are oxidised with the same observed rate, in a mixture styrene is oxidised first with 1-phenyl-ethanol oxidation beginning only after most of the styrene had been consumed.
Although the catalyst is efficient with high to full conversion with many substrates, a small excess of H2O2 is still required to reach full conversion of alkene. The inefficiency can be ascribed to the concomitant oxidation of other reaction components (e.g., the ketone used as a co-catalyst). However, headspace reaction monitoring together with 18O labelling (Fig. 4) confirmed that H2O2 oxidation also occurs.
Monitoring the extent of O2 evolution during the oxidation of styrene indicates that disproportionation is only significant at the end of the reaction and hence contrasts with the observations made with the Mn-PDP catalysts (vide supra). Namely, as the Mn(II)/PCA catalyst shows a zero-order dependence on the substrate, the evolution of O2 is expected only at the end of the oxidation of styrene. The catalyst shows preference for styrene as the substrate and only when it is consumed does H2O2 become a competitive substrate. Indeed in the absence of styrene, O2 evolves over the entire course of the reaction at the same rate at which styrene had been oxidised (Fig. 5).
 | ||
| Fig. 5 The release of O2 in the reaction of H2O2 catalysed by Mn(II)/PCA was monitored by headspace Raman spectroscopy. In the presence of styrene, O2 is formed only after almost all styrene has been oxidised to styrene oxide (black dots), while in the absence of styrene O2 is released quantitatively (red dots) due to oxidation of H2O2.31 | ||
Despite differences in the evolution of O2 over time between the Mn(II)/PCA and Mn–PDP catalyst systems, the origin of wasteful H2O2 disproportionation is in both cases due to competition between the organic substrate and H2O2 for the oxidising manganese species. Hence, the overall catalyst efficiency depends on the competition for the activated catalyst.
Identifying competing pathways in organic substrate oxidation and H2O2 decomposition through reaction monitoring and kinetic modelling
In contrast to the previous examples, the complex [(N4Py)Fe(II)(CH3CN)]2+, where N4Py is (1,1-bis(pyridin-2-yl)-N,N′-bis(pyridin-2-ylmethyl)methanamine) (Fig. 6) is an example of an oxidation catalyst in which different species are responsible for substrate oxidation and/or H2O2 decomposition.34–37 | ||
| Fig. 6 Proposed mechanism for [(N4Py)FeII (CH3CN)](OTf)2 with H2O2 in methanol.17 | ||
[(N4Py)Fe(II)(CH3CN)]2+ reacts with H2O2 to form an Fe(IV)![[double bond, length as m-dash]](https://www.rsc.org/images/entities/char_e001.gif) O species ([(N4Py)Fe(IV)O]2+) that can oxidise organic substrates selectively.38 However, the complex reaches the Fe(III) state relatively rapidly both through Fe(II)/Fe(IV) comproportionation and by reduction of the initially formed [(N4Py)Fe(IV)O]2+ through hydrogen atom transfer with H2O2, producing [(N4Py)Fe(III)(OH)]2+ and the superoxide anion radical.17,39 The Fe(III) complex, e.g., [(N4Py)Fe(III)(OCH3)]2+, also undergoes ligand exchange with H2O2 to form a relatively stable Fe(III)–OOH species. Although this species can be viewed as the precursor to [(N4Py)Fe(IV)O]2+via homolytic O–O bond cleavage, this reaction is remarkably slow.
O species ([(N4Py)Fe(IV)O]2+) that can oxidise organic substrates selectively.38 However, the complex reaches the Fe(III) state relatively rapidly both through Fe(II)/Fe(IV) comproportionation and by reduction of the initially formed [(N4Py)Fe(IV)O]2+ through hydrogen atom transfer with H2O2, producing [(N4Py)Fe(III)(OH)]2+ and the superoxide anion radical.17,39 The Fe(III) complex, e.g., [(N4Py)Fe(III)(OCH3)]2+, also undergoes ligand exchange with H2O2 to form a relatively stable Fe(III)–OOH species. Although this species can be viewed as the precursor to [(N4Py)Fe(IV)O]2+via homolytic O–O bond cleavage, this reaction is remarkably slow.
Instead, in protic solvents, such as methanol, exceptionally efficient disproportionation of H2O2 is observed, due to the direct reaction of [(N4Py)Fe(III)(OOH)]2+ with H2O2.17,39 Hence, in this case, although [(N4Py)Fe(IV)O]2+ reacts with H2O2, it is not actually formed in the reaction and instead it is [(N4Py)Fe(III)(OOH)]2+ that is responsible for the disproportionation of H2O2. In this example, the species responsible for substrate oxidation ([(N4Py)Fe(IV)O]2+) is clearly different to that responsible for H2O2 disproportionation ([(N4Py)Fe(III)(OOH)]2+). However, it is an interesting example to show how reaction modelling is important in revealing details of the overall catalytic system.
The reactivity of [(N4Py)Fe(II)(CH3CN)]2+ with H2O2 was elucidated using a range of in situ spectroscopic techniques. Time-resolved (resonance) Raman spectroscopy, headspace Raman spectroscopy, and UV/vis absorption spectroscopy showed that [(N4Py)Fe(II)(CH3CN)]2+ disproportionates H2O2 into H2O and O2 in the presence of an excess of H2O2.17,39 Specifically, resonance Raman and UV/vis absorption spectroscopy were used to track the concentration of [(N4Py)Fe(III)(OOH)]2+ in solution, and liquid phase and headspace Raman spectroscopy the concentrations of H2O2 and O2, respectively. The oxygen atom mass balance revealed that all H2O2 is disproportionated to H2O and O2 under these conditions. Fig. 7 shows the results of the combined, time-resolved liquid phase, headspace Raman and UV/vis absorption spectroscopic approach to follow the concentrations of H2O2, O2, and iron species, respectively.17
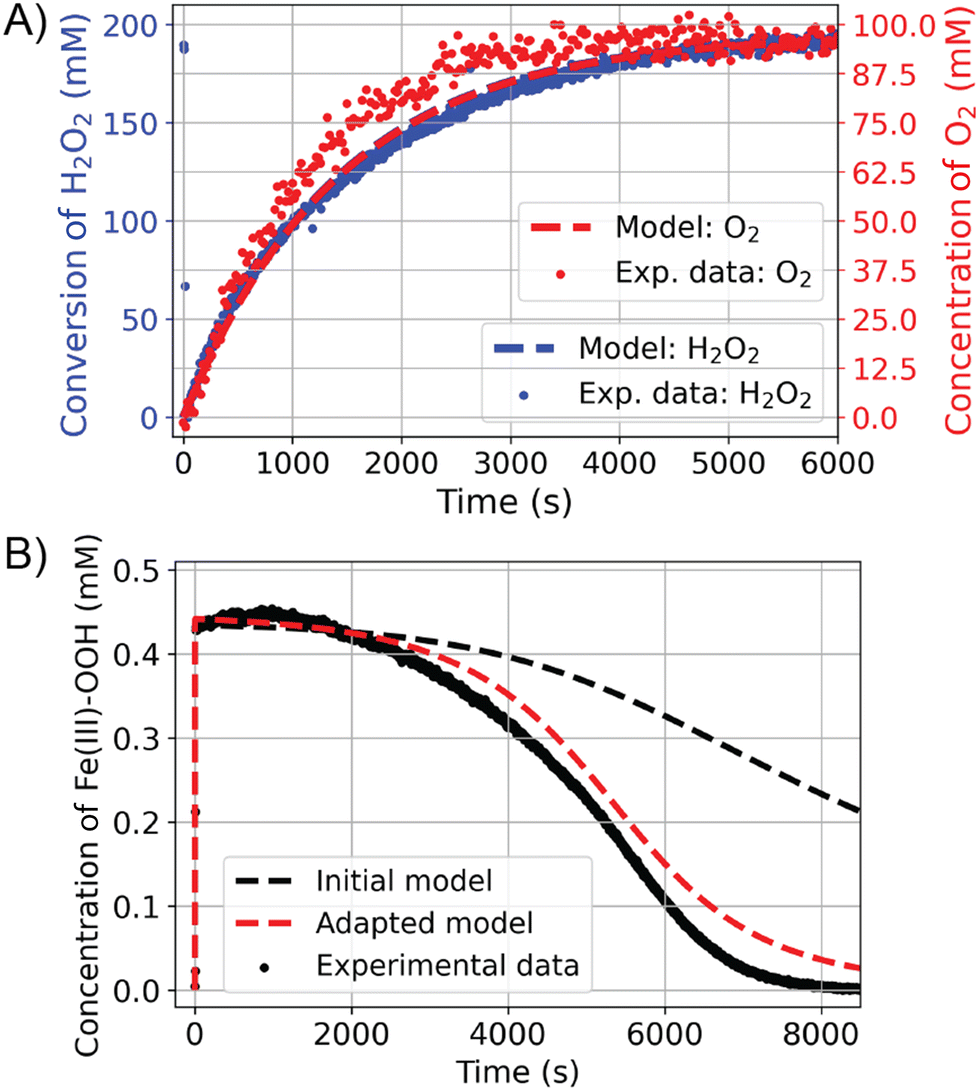 | ||
| Fig. 7 Reaction progress for the conversion of 400 equiv. of H2O2 (0.46 mM [(N4Py)FeII (CH3CN)](OTf)2 and 190 mM H2O2 in methanol). (A) 3O2 (red) and H2O2 (blue) reaction progress determined by Raman spectroscopy. (B) Concentration of (N4Py)FeIII–OOH over time from visible absorption spectroscopy. Experimental data are denoted with dots and the modelled data with dashed lines.17 | ||
The disproportionation of H2O2 is wasteful and can generate hazardous conditions in large-scale applications. Under some circumstances, disproportionation of H2O2 can involve the generation of the highly reactive species 1O2. Singlet oxygen can engage in Diels–Alder type cycloadditions with dienes, for example, but can also trigger radical chain reactions. In the case of disproportionation of H2O2 by [(N4Py)Fe(III)(OOH)]2+, the generation of 1O2 during the reaction was checked for by concurrently monitoring the O2 released from the reaction by headspace Raman spectroscopy and by NIR luminescence spectroscopy to determine 1O2 concentrations in the liquid phase (vide supra).17 Quantification of the chemiluminescence and in particular determination of limits of detection are important and the MoO4− catalyst, which produces 1O2 quantitatively, provides a reliable standard. In the case of [(N4Py)Fe(III)(OOH)]2+, only 3O2 is generated.
The benefit of tacking concentrations of most if not all reaction components over time is that it allows for falsification/validation of proposed mechanisms. In this case, the proposed mechanism for H2O2 disproportionation was validated by comparing a microkinetic model constructed on the basis of the proposed mechanism with the experimental data (Fig. 7, dashed lines). In the kinetic model, the known individual rate constants and initial concentrations are used to predict the outcome of the reaction over time, with variation in any unknown rate constants, etc. to achieve a good fit to the experimental data. The outcome of the microkinetic modelling was consistent with the experimentally determined [H2O2] and [O2] over time (Fig. 7A). However, it did not agree with the time dependence of the concentration of [(N4Py)Fe(III)(OOH)]2+ (Fig. 7B). This discrepancy prompted a closer look at the reactivity of [(N4Py)Fe(III)(OOH)]2+ at lower concentrations, which revealed that in addition to the reaction with H2O2, the complex also reacts with itself to regenerate two equivalents of [(N4Py)Fe(III)(OH)]2+ and an equivalent of H2O2. Furthermore the rate of homolytic O–O bond cleavage in [(N4Py)Fe(III)(OOH)]2+ to form [(N4Py)Fe(IV)(O)]2+ and a hydroxyl radical was much lower than would be expected. Indeed this pathway is essentially irrelevant under normal reaction conditions as the self-decay of [(N4Py)Fe(III)(OOH)]2+ to [(N4Py)Fe(III)(OH)]2+ is faster than the formation of Fe(IV)O from Fe(III)–OOH (Fig. 8). Inclusion of the additional reaction step (the bimolecular reaction of [(N4Py)Fe(III)(OOH)]2+) in the microkinetic model provided much closer agreement with all of the experimental data (Fig. 7).
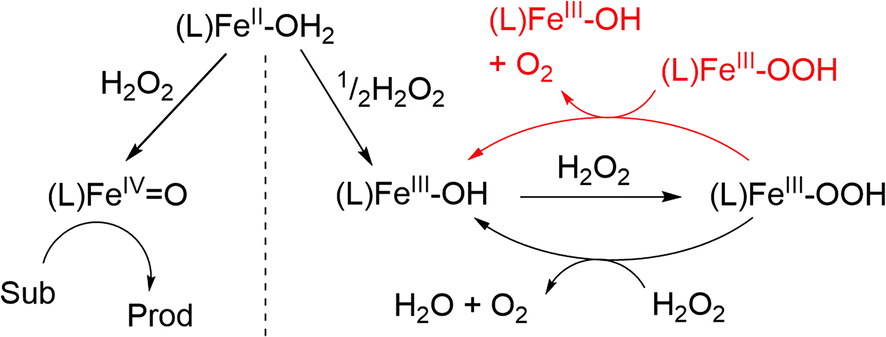 | ||
| Fig. 8 Adapted proposed mechanism for the reaction of [(N4Py)FeII (CH3CN)](OTf)2 with H2O2 in methanol, including an additional elementary step of the second order decay of (N4Py)FeIII–OOH (in red).17 | ||
Switching from H2O2 disproportionation to organic oxidations through in situ changes in the catalyst structure
A quite different situation arises where the initial form of a catalyst used is highly active in the disproportionation of H2O2 initially, but, following a change in the catalyst structure, the reactivity profile changes to the more desirable oxidation of organic substrates. We highlight this scenario with two manganese based catalysts applied already in the 2000s in the oxidation of organic compounds, namely [Mn2(μ-O)(μ-OAc)2TPTN]2+ (Fig. 9)40,41 and [Mn2(μ-O)3TMTACN2]2+ (Fig. 11).42–47 | ||
| Fig. 9 Decomposition of [Mn2(μ-O)(μ-OAc)2TPTN]2+ to pyridine-2-carboxylic acid. | ||
Both of these binuclear manganese complexes were inspired by nature's manganese dependent enzymes and the oxygen evolving centre of photosystem II, and each showed early promise in oxidation catalysis. However, both showed substantial inefficiencies due to the disproportionation of H2O2 during the oxidation of organic compounds, primarily alcohols and alkenes.
The oxidation of alkenes40 and alcohols41 with H2O2 in acetone catalysed by [Mn2(μ-O)(μ-OAc)2TPTN]2+ proceeds with good to excellent conversion, but required typically an 8-fold excess of H2O2 with respect to the substrate, due to excessive disproportionation to H2O and O2. It was noted also that a considerable lag period before oxidation of the substrate (e.g., alcohol) begins. It is during the lag period that most of the H2O2 is lost due to comproportionation (Fig. 10).
 | ||
| Fig. 10 Reaction progress (conversion of the substrate) following addition of H2O2 to [Mn2(μ-O)(μ-OAc)2TPTN]2+.40,41 | ||
Subsequent studies confirmed that during this lag period, the ligand underwent oxidative decomposition to pyridine-2-carboxylic acid (PCA). It was the PCA, together with manganese ions, that formed the catalyst that was responsible for the oxidation of organic compounds (vide supra), while the vigorous decomposition of H2O2 was due to the initial complex [Mn2(μ-O)(μ-OAc)2TPTN]2+.48,49
In contrast to [Mn2(μ-O)(μ-OAc)2TPTN]2+, the catalyst [Mn2(μ-O)(μ-OAc)3TMTACN2]2+ shows neither oxidation of organic substrates nor disproportionation of H2O2. In CH3CN containing carboxylic acids, however, a reproducible carboxylic acid dependent lag period is observed prior to a sudden and rapid conversion of [Mn2(μ-O)3 TMTACN2]2+ to [Mn2(μ-O)(μ-RCO2)2(TMTACN)2]2+ (Fig. 11, where R is an alkyl or aryl group).45 It is notable that with [Mn2(μ-O)(μ-RCO2)2(TMTACN)2]2+ (prepared independently), >95% efficiency in use of H2O2 for the epoxidation/syn-dihydroxylation of alkenes is observed (Fig. 12).46 However, in the short period where [Mn2(μ-O)3 TMTACN2]2+ converts to [Mn2(μ-O)(μ-RCO2)2(TMTACN)2]2+, in line monitoring the concentration of H2O2 revealed that disproportionation of H2O2 is significant, indicating that an intermediate complex is responsible (Fig. 13).47
 | ||
| Fig. 11 (Left) The Mn(IV) complex [Mn2(μ-O)3TMTACN2]2+ and (right) the Mn(III) complex formed after a lag period following addition of H2O2 in the presence of a carboxylic acid. | ||
 | ||
| Fig. 12 Reaction progress in the epoxidation of cyclooctene by dropwise addition of H2O2 with [Mn2(μ-O)3TMTACN2]2+ with 10 eq. of CCl3CO2H (1, blue rectangles) or [Mn2(μ-O)(μ-Cl3CO2)2(TMTACN)2]2+ (2, red circles). Adapted from de Boer et al.46 The turn-over-number (TON) for oxidation of substrate is plotted against the number of equivalents of H2O2 added (at a constant rate over time). The stepwise addition of H2O2 is indicated with a dashed black line. The complexes have different molar absorptivities at 532 nm and hence the conversion from one to the other can be followed over time by the absorbance at 532 nm (dashed line). The change in absorbance with 1 correlates with the switch to fully productive (alkene oxidation) use of H2O2. | ||
 | ||
Fig. 13 Absorbance at 532 nm over time with repeated addition of 50 equiv. of H2O2 to [Mn2(μ-O)(μ-RCO2)2(TMTACN)2]2+ (1 mM) with CCl3CO2H (10 mM) in acetonitrile (the spikes in absorbance denote the points at which H2O2 was added). Inset: overlay of absorbance at 532 nm (blue) and intensity of the Raman band of H2O2 (λexc 473 nm, red) at ![[small nu, Greek, tilde]](https://www.rsc.org/images/entities/i_char_e0e1.gif) = 869 cm−1. = 869 cm−1. | ||
Hence, this system is similar to the earlier TPTN/PCA based system in that the decomposition of H2O2 was primarily due to precursors to the final form of the catalyst that engages in the oxidation of organic compounds. However, in the absence of an oxidisable compound, the complex [Mn2(μ-O)(μ-RCO2)2(TMTACN)2]2+ engages in disproportionation of H2O2. This is seen by concomitant monitoring of the concentration of H2O2 by Raman spectroscopy and the catalyst by UV/vis absorption spectroscopy. In the absence of an organic substrate, the absorbance decreases as the H2O2 is disproportionated and only recovers partly indicating conversion to a Mn(II) state followed by decomposition of the catalyst. This loss is not as pronounced when an alkene substrate is present.
Conclusions
Disproportionation of H2O2 to O2 and H2O is a challenge in developing industrially applicable catalysts for the selective oxidation of organic substrates. Although it can be seen as a side reaction, typically ascribed to catalyst degradation, the study of several Mn- and Fe-catalysed oxidations that use H2O2 as a terminal oxidant has led to the realisation that H2O2 oxidation can occur via any of the several pathways. For example, H2O2 decomposition may occur via a reaction with the ‘activated catalyst’ (i.e., that is directly responsible for the oxidation of the organic substrate), a resting catalyst state, catalyst degradation products, catalyst precursors, etc. Ultimately, it must be recognised that H2O2 is always likely to be a competitive substrate for oxidation.Quantitative analysis of all reaction components, i.e., catalysts, reagents and reaction products, is the ideal situation, allowing for full mass balance to be established, or at least that gaps in our knowledge of the fate of specific components are well established. Time-resolved spectroscopy techniques are especially useful to relate changes in selectivity to changes in catalyst composition and structure over the entire course of the reaction. This approach has allowed gaining insight into the many reasons why H2O2 decomposition can occur and keeping low steady state concentrations of H2O2 during catalysis may be of most importance in this regard. In the area of homogeneous oxidation catalysis with H2O2 as a terminal oxidant, studies aimed at tuning catalyst reactivity by ligand design, with respect to the organic substrate of interest, can be strengthened by taking into account the role of H2O2 disproportionation. In this aspect, there is an opportunity for computational studies to contribute in predicting selectivity.
Author contributions
All authors contributed to the concept and writing of the manuscript.Conflicts of interest
There are no conflicts to declare.Data availability
There are no original data associated with this manuscript.Acknowledgements
This work is funded by the Advanced Research Center for Chemical Building Blocks, ARC CBBC, which is co-founded and co-financed by the Dutch Research Council (NWO) and the Netherlands Ministry of Economic Affairs and Climate Policy.References
- J. V. Bannister, W. H. Bannister and G. Rotilio, Crit. Rev. Biochem., 1987, 22, 111–180 CrossRef CAS PubMed.
- P. Chelikani, I. Fita and P. C. Loewen, Cell. Mol. Life Sci., 2004, 61, 192–208 CrossRef CAS PubMed.
- Modern Oxidation Methods, ed. J. Bäckvall, Wiley, 1st edn, 2010 Search PubMed.
- A. Bunescu, S. Lee, Q. Li and J. F. Hartwig, ACS Cent. Sci., 2017, 3, 895–903 CrossRef CAS PubMed.
- M. I. Childers, J. M. Longo, N. J. Van Zee, A. M. LaPointe and G. W. Coates, Chem. Rev., 2014, 114, 8129–8152 CrossRef CAS PubMed.
- A. D. Mohanty and C. Bae, in Advances in Organometallic Chemistry, Elsevier, 2015, vol. 64, pp. 1–39 Search PubMed.
- G. D. Yadav, R. K. Mewada, D. P. Wagh and H. G. Manyar, Catal. Sci. Technol., 2022, 12, 7245–7269 RSC.
- M. Costas, M. P. Mehn, M. P. Jensen and L. Que, Chem. Rev., 2004, 104, 939–986 CrossRef CAS PubMed.
- X. Engelmann, I. Monte-Pérez and K. Ray, Angew. Chem., Int. Ed., 2016, 55, 7632–7649 CrossRef CAS PubMed.
- V. A. Larson, B. Battistella, K. Ray, N. Lehnert and W. Nam, Nat. Rev. Chem., 2020, 4, 404–419 CrossRef CAS PubMed.
- K. Ray, F. F. Pfaff, B. Wang and W. Nam, J. Am. Chem. Soc., 2014, 136, 13942–13958 CrossRef CAS PubMed.
- P. R. Ortiz De Montellano, Chem. Rev., 2010, 110, 932–948 CrossRef CAS PubMed.
- O. Y. Lyakin, K. P. Bryliakov and E. P. Talsi, Coord. Chem. Rev., 2019, 384, 126–139 CrossRef CAS.
- W. R. Browne, in Practical Approaches to Biological Inorganic Chemistry, Elsevier, 2020, pp. 275–324 Search PubMed.
- V. Nardello, J. Marko, G. Vermeersch and J. M. Aubry, Inorg. Chem., 1995, 34, 4950–4957 CAS.
- V. Nardello, S. Bogaert, P. L. Alsters and J.-M. Aubry, Tetrahedron Lett., 2002, 43, 8731–8734 CrossRef CAS.
- C. M. de Roo, A. S. Sardjan, R. Postmus, M. Swart, R. Hage and W. R. Browne, ChemCatChem, 2024, 16, e202301594 Search PubMed.
- J. Mehara and J. Roithová, Chem. Sci., 2020, 11, 11960–11972 CAS.
- J. J. A. Lozeman, P. Fuehrer, W. Olthuis and M. Odijk, Analyst, 2020, 145, 2482–2509 RSC.
- A. Salame, M. H. Cheah, J. Bonin, M. Robert and E. Anxolabehere-Mallart, Angew. Chem., Int. Ed., 2024, 63, e202412417 CAS.
- J. B. Kasper, L. Vicens, C. M. de Roo, R. Hage, M. Costas and W. R. Browne, ACS Catal., 2023, 13, 6403–6415 CAS.
- C. Wegeberg, F. R. Lauritsen, C. Frandsen, S. Mørup, W. R. Browne and C. J. McKenzie, Chem. – Eur. J., 2018, 24, 5134–5145 CAS.
- K. Tamura, Determination of Ortho-/Para- Hydrogen Ratio Using Raman Spectroscopy – Application to Fuel Cells, 2025 Search PubMed.
- D. Yang, Q. Nie, M. Cheng, S. Pei, C. Cheng, D. Guo and M. Yang, ACS Sens., 2025, 10, 1113–1122 CAS.
- R. V. Ottenbacher, K. P. Bryliakov and E. P. Talsi, Adv. Synth. Catal., 2011, 353, 885–889 CAS.
- O. Cussó, I. Garcia-Bosch, D. Font, X. Ribas, J. Lloret-Fillol and M. Costas, Org. Lett., 2013, 15, 6158–6161 Search PubMed.
- M. C. White and J. Zhao, J. Am. Chem. Soc., 2018, 140, 13988–14009 CrossRef CAS PubMed.
- C. Claraso, L. Vicens, A. Polo and M. Costas, Org. Lett., 2019, 21, 2430–2435 CAS.
- R. V. Ottenbacher, D. G. Samsonenko, E. P. Talsi and K. P. Bryliakov, ACS Catal., 2014, 1599–1606 CAS.
- G. Yang, E. A. Mikhalyova, A. S. Filatov, S. V. Kryatov and E. V. Rybak-Akimova, Inorg. Chim. Acta, 2023, 546, 121288 CrossRef CAS.
- J. B. Kasper, P. Saisaha, M. De Roo, M. J. Groen, L. Vicens, M. Borrell, J. W. De Boer, R. Hage, M. Costas and W. R. Browne, ChemCatChem, 2023, 15, e202201072 CAS.
- P. Saisaha, J. J. Dong, T. G. Meinds, J. W. de Boer, R. Hage, F. Mecozzi, J. B. Kasper and W. R. Browne, ACS Catal., 2016, 3486–3495 CrossRef CAS.
- J. J. Dong, P. Saisaha, T. G. Meinds, P. L. Alsters, E. G. Ijpeij, R. P. van Summeren, B. Mao, B. L. Feringa and W. R. Browne, ACS Catal., 2012, 1087–1096 CAS.
- M. Lubben, A. Meetsma, E. C. Wilkinson, B. Feringa and L. Que, Angew. Chem., Int. Ed. Engl., 1995, 34, 1512–1514 CrossRef CAS.
- G. Roelfes, M. Lubben, R. Hage, L. Que Jr. and B. L. Feringa, Chem. – Eur. J., 2000, 6, 2152–2159 CrossRef CAS PubMed.
- G. Roelfes, M. Lubben, K. Chen, R. Y. N. Ho, A. Meetsma, S. Genseberger, R. M. Hermant, R. Hage, S. K. Mandal, V. G. Young, Y. Zang, H. Kooijman, A. L. Spek, L. Que and B. L. Feringa, Inorg. Chem., 1999, 38, 1929–1936 CAS.
- J. Kaizer, E. J. Klinker, N. Y. Oh, J.-U. Rohde, W. J. Song, A. Stubna, J. Kim, E. Münck, W. Nam and L. Que, J. Am. Chem. Soc., 2004, 126, 472–473 CrossRef CAS PubMed.
- J. Chen, A. S. Sardjan, C. M. de Roo, M. Di Berto Mancini, A. Draksharapu, D. Angelone, R. Hage, M. Swart and W. R. Browne, Inorg. Chem., 2025, 64, 9408–9417 CAS.
- J. Chen, A. Draksharapu, D. Angelone, D. Unjaroen, S. K. Padamati, R. Hage, M. Swart, C. Duboc and W. R. Browne, ACS Catal., 2018, 8, 9665–9674 CrossRef CAS PubMed.
- J. Brinksma, B. L. Feringa, R. Hage and J. Kerschner, Chem. Commun., 2000, 537–538 RSC.
- J. Brinksma, M. T. Rispens, R. Hage and B. L. Feringa, Inorg. Chim. Acta, 2002, 337, 75–82 CrossRef CAS.
- D. E. De Vos, B. F. Sels, M. Reynaers, Y. S. Rao and P. A. Jacobs, Tetrahedron Lett., 1998, 39, 3221–3224 CAS.
- D. E. De Vos, S. De Wildeman, B. F. Sels, P. J. Grobet and P. A. Jacobs, Angew. Chem., Int. Ed., 1999, 38, 980–983 CrossRef CAS PubMed.
- A. Berkessel and C. A. Sklorz, Tetrahedron Lett., 1999, 40, 7965–7968 CAS.
- J. W. De Boer, J. Brinksma, W. R. Browne, A. Meetsma, P. L. Alsters, R. Hage and B. L. Feringa, J. Am. Chem. Soc., 2005, 127, 7990–7991 CrossRef CAS PubMed.
- J. W. De Boer, W. R. Browne, J. Brinksma, P. L. Alsters, R. Hage and B. L. Feringa, Inorg. Chem., 2007, 46, 6353–6372 CAS.
- D. Angelone, S. Abdolahzadeh, J. W. De Boer and W. R. Browne, Eur. J. Inorg. Chem., 2015, 2015, 3532–3542 CrossRef CAS.
- D. Pijper, P. Saisaha, J. W. De Boer, R. Hoen, C. Smit, A. Meetsma, R. Hage, R. P. Van Summeren, P. L. Alsters, B. L. Feringa and W. R. Browne, Dalton Trans., 2010, 39, 10375 CAS.
- It should be noted that the PCA/Mn(II) catalyst mixture formed also disproportionates H2O2 (vide supra) but to much less an extent than initially observed with [Mn2(μ-O)(μ-OAc)2TPTN]2+.
| This journal is © The Royal Society of Chemistry 2025 |