 Open Access Article
Creative Commons Attribution 3.0 Unported Licence
A study of dynamic nanoscale corrosion initiation events using HS-AFM†
Stacy
Moore
 *a,
Robert
Burrows
b,
Loren
Picco
 ac,
Tomas L.
Martin
 a,
Scott J.
Greenwell
 a,
Thomas B.
Scott
 a and
Oliver D.
Payton
 ac
ac
aInterface Analysis Centre, HH Wills Physics Laboratory, University of Bristol, Bristol, BS8 1TL, UK. E-mail: stacy.moore@bristol.ac.uk; Tel: +44(0) 117 33 17684
bNational Nuclear Laboratory, Building 102B, Stonehouse Park, Sperry Way, Stonehouse, Gloucestershire GL10 3UT, UK
cBristol Nano Dynamics Ltd., Bristol, UK
First published on 16th April 2018
Abstract
Atomic force microscopes (AFMs) are capable of high-resolution mapping of structures and the measurement of mechanical properties on nanometre scales within gaseous, liquid and vacuum environments. The contact mode high-speed AFM (HS-AFM) developed at Bristol Nano Dynamics Ltd. operates at speeds that are orders of magnitude faster than conventional AFMs, and is capable of capturing multiple frames per second. This allows for direct observation of dynamic events in real-time, with nanometre lateral resolution and subatomic height resolution. HS-AFM is a valuable tool for the imaging of nanoscale corrosion initiation events, such as metastable pitting, grain boundary (GB) dissolution and short crack formation during stress corrosion cracking (SCC). Within this study HS-AFM was combined with SEM and FIB milling to produce a multifaceted picture of localised corrosion events occurring on thermally sensitised AISI 304 stainless steel in an aqueous solution of 1% sodium chloride (NaCl). HS-AFM measurements were performed in situ by imaging within a custom built liquid cell with parallel electrochemical control. The high resolution of the HS-AFM allowed for measurements to be performed at individual reaction sites, i.e. at specific GB carbide surfaces. Topographic maps of the sample surface allowed for accurate measurements of the dimensions of pits formed. Using these measurements it was possible to calculate, and subsequently model, the volumes of metal reacting with respect to time, and so the current densities and ionic fluxes at work. In this manner, the local electrochemistry at nanoscale reaction sites may be reconstructed.
1 Introduction
Stainless steels are important for structural applications and are widely used in the nuclear power industry due to their good mechanical properties and tolerance of elevated temperatures.1–3 They are, however, susceptible to corrosion, which is the cause of a significant number of failure events in the nuclear sector.2,4,5 Methods to detect and model the effects of corrosion are important for the prevention of these failure events.Corrosion is an irreversible process that causes material deterioration as a result of dissolution.6,7 It is an electrochemical process in which a potential difference across the material/environment interface results in the flow of ions and electrons through an electrolyte.6,7 The process of metallic corrosion is a conglomerate of anodic dissolution of the metal:
| M → Mn+ + ne− |
and cathodic reactions of the electrolyte:
| 2H2O + 2e− → H2 + 2OH− |
| 2H+ + 2e− → H2 |
| O2 + 2H2O + 4e− → 4OH− |
| O2 + 4H+ + 4e− → 2H2O |
| Mn+ + ne− → M. |
Corrosion events are affected by a number of different factors, both internal (e.g. surface microstructural properties) and external (e.g. environmental conditions), and, as such, corrosion is considered to be a highly complex process.4 Corrosion of metallic surfaces can be classified into two different forms: uniform or localised.7 Uniform corrosion takes place over the entire surface and occurs when the surface is in contact with a solution in which it is active.6,7 Localised corrosion occurs at specific sites on the metal surface.7 Forms of localised corrosion, such as pitting or intergranular attack (IGA) for example, are of particular concern as they can occur without any obvious outward signs of damage accumulation, whilst causing significant deterioration of component structural strength.2–4,8–10
Pitting events on stainless steels have been the focus of considerable research.3,6,10–15 Detection methods of the early stages of localised corrosion events, such as pitting, are of particular interest for developing further understanding of the mechanisms occurring. This is typically defined as the stages preceding the development of an optically visible pit or crack.12 These stages are poorly understood, as the small scale at which they occur presents a challenge for successful detection or measurement.12,14 Through producing data from the early stages of localised corrosion, results and observations may be fed into computational models, allowing for a mathematical reconstruction of the electrochemical events occurring.11,12
A number of different techniques have been implemented in previous studies, these include, but are not limited to, optical monitoring techniques,3,10,13 electrochemical noise (EN),16 electrochemical impedance spectroscopy (EIS)17 and scanning electron microscopy (SEM).13,17 Thus far, nucleation sites for localised corrosion events have not been conclusively identified, though they often occur at discontinuities on the surface, such as at grain boundaries (GBs) or inclusions.6,7,11,18
The nanoscale initiation sites and liquid environment of corrosion are ideal for investigation using atomic force microscopy (AFM), which is a scanning probe microscopy technique developed by Binnig, Quate, and Gerber in 1986.19 AFM is capable of high-resolution imaging of surface structures and the measurement of mechanical properties at nanometre scales.20–25 Furthermore, it is able to image in gaseous or liquid environments, making it a valuable tool for studying solid–liquid interfaces, such as those required for in situ corrosion studies.24
In 2000, Williford et al. produced time-lapse images, using electrochemical AFM (ECAFM), of the early stages of pitting and IGA of thermally sensitised Type 304 stainless steel.12 Williford observed that IGA began in the GB between carbides, and proposed that this was a result of the carbides being cathodic with respect to the bulk matrix, and thus being partially cathodically protected.12 Observations were also made of pit growth from an irregular shape into a round pit, with island formations over a period of 6 minutes.12 Williford experienced a number of limitations associated with using AFM. Firstly, time-lapse images were obtained at 3600 s intervals (once every 10–20 cycles of polarisation); this meant that reactions occurring between these intervals must be inferred.12 Additionally, due to the speed at which images were obtained, in combination with the lateral size of the window, Williford was unable to image localised corrosion events as they occurred as a result of not “being in the right place at the right time”.12
The long collection times is a significant limiting factor of AFM. The contact mode high-speed AFM (HS-AFM) (Bristol Nano Dynamics Ltd.) at the University of Bristol images multiple frames per second, and this is orders of magnitude faster than conventional AFM.24 This allows for the imaging of processes in real-time with nanoscale lateral resolution and sub-nanometre height resolution.24 The increased speed of HS-AFM not only allows for direct imaging of dynamic nanoscale events, but also for the imaging of macro-sized areas on the sample surface without any drop in resolution. This is particularly important for detailed pre- and post-corrosion studies as well as higher throughput allowing for statistically significant data.
The capabilities of HS-AFM combined with its ability to image at solid–liquid interfaces, make it an ideal tool for in situ observations of corrosion initiation events.24,26 This has been demonstrated in previous studies.26,27 Within the work presented here, localised corrosion phenomena, such as pitting and IGA, were investigated using HS-AFM.
2 Materials and methods
2.1 Materials and sample preparation
Samples were cut from a sheet of American Iron and Steel Institute (AISI) Type 304 stainless steel supplied by Goodfellow Cambridge Ltd. (Huntingdon, UK), which had been thermally sensitised at 600 °C for 70 hours.Once cut, an electrical connection was made to the sample by attaching a wire to the back face of the sample using silver paint (Agar Scientific, UK); this wire was secured in place once samples were set in resin (cold set, Struers™ Clarocit). Continuity tests of the connection between the wire and the sample surface were carried out using a multimeter.
Subsequent surface preparation techniques were carried out via procedures described in more detail in previous work.28 The sample surface was initially polished using progressively finer grades of silicon carbide (SiC) grit paper, from P600 up to P4000, using water as lubricant. The sample was then polished using 3 μm to 0.25 μm diamond paste (Kemet International Ltd., KD Diamond Pastes), using a Struers™ DP-Lubricant (Brown). As the final polishing step the sample was vibropolished (VibroMet™, Buehler) with colloidal silica (MasterMet R, Buehler) for 12 hours.
Once polished the sample was cleaned thoroughly. Firstly, the surface was rinsed with water and detergent to remove any colloidal silica residue present. The sample was then cleaned by twice placing it into an ultrasonic bath with (HPLC-grade) ethanol. This was then repeated with isopropanol before rinsing with Milli-Q™ water and drying thoroughly with dry air.
2.2 High-speed atomic force microscopy (HS-AFM)
The contact mode HS-AFM (Bristol Nano Dynamics Ltd.) at the University of Bristol uses a laser Doppler vibrometer (LDV) system to accurately measure the vertical displacement of a cantilever with a sharp probe at its tip. The vertical displacement is monitored as the tip is moved across a sample surface in a raster scan pattern. This information is used to build up topographic maps of the surface in real-time using bespoke software (Bristol Nano Dynamics Ltd., UK). The collected data was then analysed further using Gwyddion SPM data processing software.HS-AFM observations of localised corrosion events were performed using a custom-built liquid cell with a contact-mode MSNL-10 cantilever (Bruker, USA). Samples were mounted onto a 12.5 mm SEM stub and secured to the stage of the HS-AFM.
For the investigation into pitting corrosion initiation, samples were imaged in a 1% aqueous sodium chloride solution (NaCl) and polarised using a potentiostat.
The HS-AFM is also equipped with a 20× optical objective. This was used to identify features on the sample surface so that specific areas could be imaged, such as optically visible pitting events. Once pitting corrosion is optically visible the cantilever tip was placed just ahead of the corrosion front so that initiation events may be imaged. This technique has been implemented in other work.12
Modelling of the system was performed using the Tertiary Current Distribution, Nernst–Planck interface in COMSOL Multiphysics 3.5a. This is a pre-defined equation system for solving diffusion and migration for ionic transport under electroneutrality using the Nernst–Planck equations. The electroneutrality condition assumes that the model includes all significant current-carrying ions. In addition, the model includes the water auto-ionisation equilibrium condition.
For each species, i, the mass balance for the diluted species in an electrolyte is described by:
 | (1) |
| Ni = −DiΔci − zium,iFciΔφl + ciu | (2) |
Models are constructed with ease within COMSOL as the appropriate physical equations and constraints are already built into the software.29 A set of partial differential equations are compiled for the system being studied as a result of the user defining the physical attributes of the system, such as material properties, boundary constraints, initial conditions, etc.29
A topographic map produced from HS-AFM data of the corroded area was manually imported into COMSOL to build-up the initial surface geometry. The surface features are interpreted as in-plane (flat) boundaries on a sub-domain surface with matching dimensions. The 3D sub-domain represents the volume of water adjacent to the surface. This geometry was used to set-up a mesh.
The ionic properties of the sub-domain were specified within the model. A simplified system of 5 species was considered in this model: Fe2+, Cl−, Na+, H+ and OH−.29,30 The mobility for each species was calculated using their respective diffusion coefficients.31,32 Boundary conditions were defined for the different features (representative ionic flux, bulk concentration, potential etc.), to give a specific representative set of reactions and behaviours at different boundaries.
The final step was to solve with a time dependent study, computing reaction kinetics and chemical composition of a system over a specified time interval. The results were then inspected and compared to measured results.
A series of assumptions were required for this study, which largely may be considered qualitatively. These included:
• This model did not consider speciation of the corrosion product.
• If a nucleation event occurred at the site of an inclusion, the dissolution products of the inclusion were not considered in the model.
• The rest of the surface in the imported geometry was considered to be inert.
• The action of the cantilever probe on the surface and its effect on local transport and pit initiation was not considered for this model.
2.3 Electrochemical tests
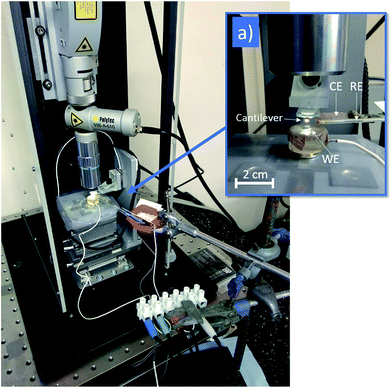
Pitting experiments were performed in situ on the stage of the HS-AFM (shown in Fig. 1). A standard three-electrode set-up was implemented for electrochemical tests, within an electrolyte of 1% (0.28 M) aqueous NaCl. A 4 mm diameter circular area (total area 0.13 cm2) of the sample surface was exposed to the solution, acting as the working electrode (WE). The counter electrode (CE) consisted of a platinum wire mesh, and a silver/silver chloride (Ag/AgCl) micro-electrode with 2 mm diameter (World Precision Instruments Inc.) was used as the reference electrode (RE).The rates at which corrosion reactions take place are influenced by the potential difference across the metal/electrolyte interface.6 These reactions can therefore be driven, or suppressed, by the application of a potential relative to the open circuit potential (OCP), known as an overpotential. Potentiodynamic tests were performed in order to characterise the corrosion behaviour of the system under investigation. Within these tests, a potential was applied between the WE and the RE by an Interface 1000 Potentiostat/Galvanostat/ZRA (Gamry Instruments), which then recorded the resulting net current (equivalent to the difference between anodic and cathodic reaction rates) between the WE and the CE, producing a polarisation curve.
Pitting corrosion on stainless steels is characterised by multiple sharp peaks in the measured current.7,10,11,14,15,18 These occur as a result of the breakdown of the passive layer in the localised areas affected. Samples were monitored by an optical microscope during potentiodynamic tests in order to draw parallels between events visually occurring on the surface and the current transients being measured as potential is varied. It is important for subsequent HS-AFM measurements to identify optical triggers that indicate the onset of corrosion events. These areas may then be identified using the optical objective of the HS-AFM and subsequently imaged.
Following these initial characterisation tests, galvanostatic experiments were performed. For these experiments the potentiostat accurately controls the current flow between the WE and the CE though the application of a potential difference between the RE and WE required to maintain the chosen current.
A galvanostatic scan was chosen over a potentiodynamic or a potentiostatic scan for the observation of stable pitting events as galvanostatic tests alter the potential such that the current stays constant, and, as a result, corrosion reactions are driven at a consistent rate. On the other hand, by ramping up the potential or maintaining a constant potential, corrosion reactions may be driven too aggressively. Once initiated, the rate of corrosion should be matched to the HS-AFM imaging rate such that in situ HS-AFM measurements can be performed.
During galvanostatic tests localised corrosion was driven at a reduced rate such that it could be observed over longer periods of time both optically and using HS-AFM. Appropriate current flow values were identified from the initial potentiodynamic tests.
All experimental work was carried out at room temperature and humidity (20 ± 1 °C, 45 ± 10%). Post analysis of the current transients produced during the experiment was performed using Echem Analyst™ software (Gamry Instruments).
2.4 Scanning electron microscopy and focussed ion beam milling
The surface of the sample was imaged post-corrosion using a Helios NanoLab 600G, which is a dual beam (DB) microscope with combined SEM and focussed ion beam (FIB). High-resolution secondary electron images of the sample surface were taken at a potential of 5 kV and a current of 1.4 nA.Areas of interest across the surface were also selected for FIB milling such that a better idea of the processes occurring beneath the surface could be obtained. FIB milling was performed using a gallium-ion beam at 30 kV and 2.8 nA.
3 Results
3.1 Electrochemical measurements
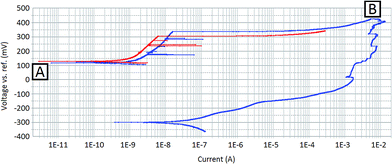
Fig. 2 shows polarisation curves for the sample before and after the sample surface had been damaged by localised corrosion events. The red line in Fig. 2 shows the forward potentiodynamic scan for the undamaged surface. Within this scan, characteristic peaks in current that may be attributed to pitting events can be seen, beginning at approximately 240 mV (vs. Ag/AgCl) and resulting in measured currents of approximately 100 nA (sample surface area of 0.13 cm2). As the potential difference becomes more anodic, a considerable increase in the current is measured, indicating that corrosion reactions are occurring on the surface at an increased rate. Currents are not quoted as current densities as with localised corrosion studies the active area of the surface is unknown.The blue line in Fig. 2 shows the forward and reverse potentiodynamic scan for the sample after localised corrosion events have taken place. The sample was allowed sufficient time for full repassivation of the surface before this test was performed. During the forward scan (blue line starting at point A) it can be seen that the kinetic behaviour is not dissimilar to that of the undamaged surface (red line). However, the forward scan for the damaged surface has a slightly higher corrosion current density than that measured for the undamaged surface. This indicates that, despite the surface being free of any active corrosion sites, the surface may have a decreased passivity. This was also reflected by a slight decrease in the measured OCP, 131 mV (vs. Ag/AgCl) compared to 141 mV (vs. Ag/AgCl).
The return potentiodynamic scan (the second section starting at point B of the blue line in Fig. 2) reveals the effects measured immediately after localised corrosion events were initiated on the sample surface. The return scan is shifted considerably towards more cathodic potentials. In addition, the exchange current density has increased by orders of magnitude. This indicates that the sample surface contains active corrosion sites, demonstrating that the corrosion processes occurring on the surface are self-sustaining.
The measured OCP had also shifted significantly between the forward and the reverse potentiodynamic scans. The measured OCP immediately after the forward potentiodynamic scan (−339 mV vs. Ag/AgCl) was considerably more cathodic than immediately before (131 mV vs. Ag/AgCl), indicating a more active surface. A longer period of OCP measurement was taken directly after the reverse potentiodynamic scan and returned a measured OCP of −352 mV (vs. Ag/AgCl).
Fig. 3 shows a galvanostatic scan for a sample in which corrosion reactions are occurring on the surface. A current of 0.05 mA (sample surface area of 0.13 cm2) was chosen for this test. This was chosen subsequent to measuring the polarisation curve for the undamaged surface (red line Fig. 2). The polarisation curve illustrates that a current of 0.05 mA is sufficient to sustain localised corrosion events on the surface of the sample at a rate suitable for investigation using HS-AFM.
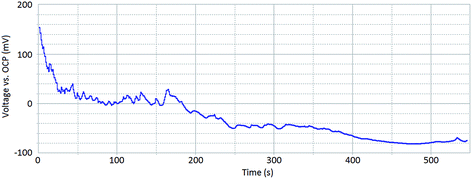 | ||
| Fig. 3 A galvanostatic scan of a sensitised AISI 304 stainless steel sample within 1% aqueous NaCl taken at 0.05 mA, for a sample surface area of 0.13 cm2. | ||
The peaks and troughs that are present in the galvanostatic scan (Fig. 3) suggest that corrosion kinetics across the sample surface are varying. As time increases, the overpotential required to sustain a constant current decreases. This indicates that corrosion events become more self-sustaining as the extent of corrosion progresses.
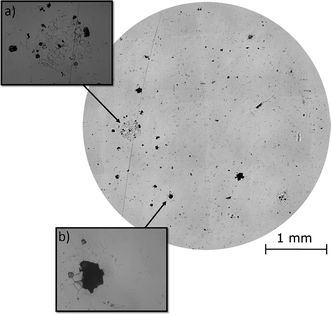
Post-corrosion optical observations of the samples were made using an optical microscope (Fig. 4). These images revealed the intergranular nature of the localised corrosion events occurring on the surface. The severity of IGA gave an indication of the degree of thermal sensitisation across the surface. Pitting corrosion events were also present on the sample surface, though larger pits had appeared to have formed from a combination of pitting corrosion and IGA events.
3.2 HS-AFM
Given the intergranular nature of the localised corrosion events, HS-AFM measurements were primarily made along GBs. Numerous GB inclusions identified as carbides were observed along sensitised GBs, as seen in Fig. 5. These were seen to stand in relief of the surface, due to the difference in hardness of the two regions during mechanical polishing.12 The thermal sensitisation of Type 304 stainless steel occurs due to precipitation of chromium carbides along GBs.2,12,33–35 This results in a depletion of chromium in the areas surrounding the GB, which in turn reduces the oxidation resistance, causing sensitivity to IGA.12 GBs are also softer as a result and therefore are preferentially polished; this is evident from their hollow appearance in Fig. 5.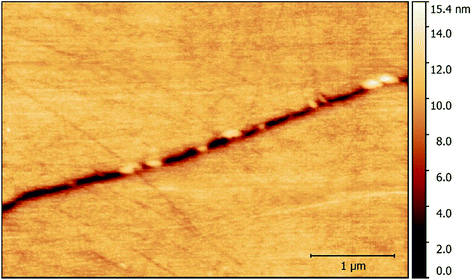 | ||
| Fig. 5 A topographic map showing inclusions along a GB in sensitised AISI 304 stainless steel within 1% aqueous NaCl. | ||
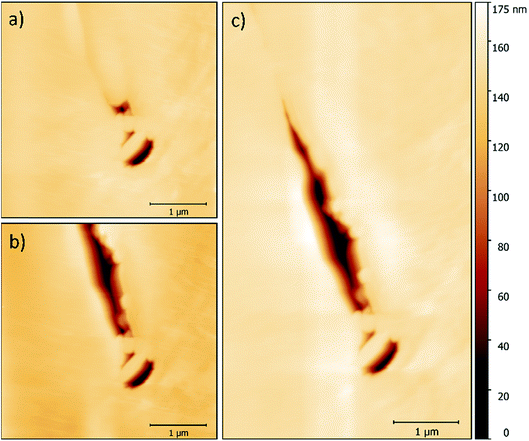
While imaging along GBs just ahead of the corrosion front, a number of small intergranular pits were identified, and in some areas these occurred in chains, as seen in Fig. 6. By monitoring GBs surrounding corrosion events, the formation of an intergranular pit was observed. Fig. 7a and b show before and after topographic maps of an intergranular pit forming at a GB during a galvanostatic scan. The feature formed between two subsequent HS-AFM frames. Given that the HS-AFM was collecting images at a rate of 2 s−1, the timeframe at which this reaction occurred can be deduced as ≤0.5 s.
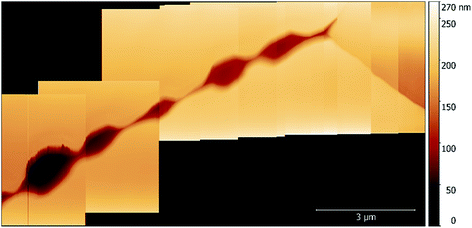 | ||
| Fig. 6 A topographic map of a number of pits formed along a GB in sensitised AISI 304 stainless steel within 1% aqueous NaCl. | ||
A map of the full intergranular pit was produced by stitching together two HS-AFM frames (Fig. 7c). The sensitised GB is not clearly visible within this image as a result of the larger height scale in comparison with Fig. 5. Post processing of this topography produced approximate values for the volume of material dissolved. Using this data the resultant ionic flux and current transients were calculated using Faraday’s law of electrolysis:
| Parameter | Measured value | Units |
|---|---|---|
| Projected area | 1.054 × 10⁻¹² | m2 |
| Depth | 1.228 × 10⁻⁷ | m |
| Volume | 5.03 × 10⁻²⁰ | m3 |
| Parameter | Calculated value | Units |
|---|---|---|
| Mass of iron dissolved | 3.96 × 10⁻¹¹ | g |
| Ionic flux | 1.35 × 10⁻² | Moles per m2 per s |
| Current density | 2.6 × 10³ | A m−2 |
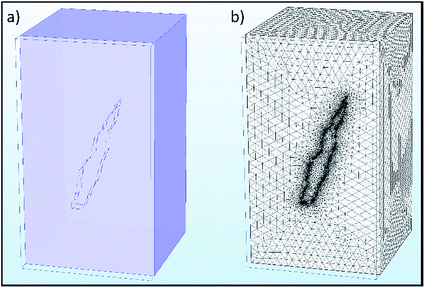
The 3D geometry used in the model is shown in Fig. 8a. This geometry was meshed by COMSOL, as seen in Fig. 8b;the chosen mesh consisted of 239![[thin space (1/6-em)]](https://www.rsc.org/images/entities/char_2009.gif) 226 domain elements, 17
226 domain elements, 17![[thin space (1/6-em)]](https://www.rsc.org/images/entities/char_2009.gif) 514 boundary elements and 1011 edge elements.
514 boundary elements and 1011 edge elements.
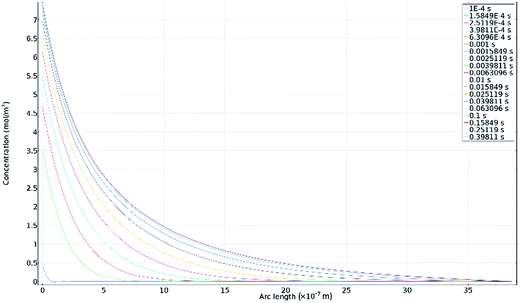
Selected results from the time-dependent solution are shown in Fig. 9a–d. Fig. 9a shows the final concentration of Fe2+ ions; the concentration is seen to diffuse radially outwards from the intergranular pit site. A line plot was produced, illustrating the time taken to converge to the final concentration distribution of Fe2+ ions in the adjacent electrolyte, shown in Fig. 10. This plot demonstrates that the system reaches a radial diffusion regime in under 0.01 s, as time steps beyond this have identical concentration profiles.
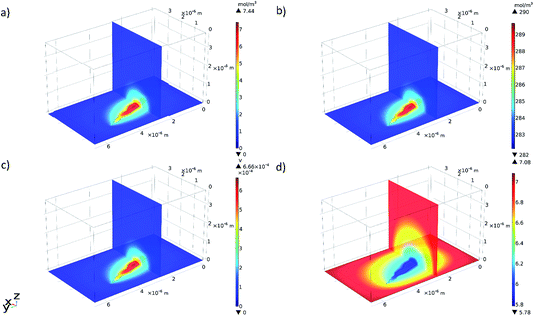 | ||
| Fig. 9 3D multi-slice plots produced in COMSOL showing the final (at a time of 0.5 s): (a) concentration of Fe2+ ions, (b) concentration of Cl− ions, (c) electrolyte potential, and (d) pH. | ||
Fig. 9b shows a local accumulation of Cl− ions in the areas immediately adjacent to the reaction area. This is a consequence of the concentration of Fe2+ cations in that area.3,10,14 As the pit is anodic with respect to the cathodic surface surrounding it, electroneutrality of the pit electrolyte requires an increased abundance of Cl− counter-ions.3,10,14 The relative enhancement in Cl− concentration reconstructed here is small, as the pre-existing concentration within the bulk electrolyte is large.
A plot illustrating the variation of pH (calculated from H+ concentration) in the electrolyte was also produced from the time-dependent solution in COMSOL, shown in Fig. 9d. The areas surrounding the intergranular pit became slightly acidic with respect to the bulk solution due to ionic migration.
3.3 Scanning electron microscopy and focussed ion beam milling
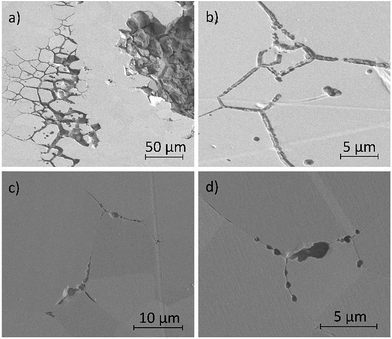
Fig. 11a–d show secondary electron images of the corroded surface. Fig. 11a and b demonstrate the severity of IGA at some areas across the surface, where the GB has been corroded preferentially by the electrolyte. Within these figures, pitting corrosion is also observed within grains.Chains of intergranular pits were observed along GBs just ahead of the corrosion front, in areas such as those seen in Fig. 11a, though some were also observed in isolated areas on the sample surface, as seen in Fig. 11c and d.
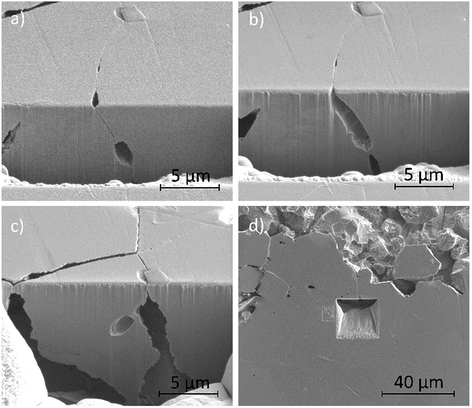
Fig. 12a–d show secondary electron images of an area adjacent to a large pit where an intergranular pit was studied using FIB milling. Fig. 12a–c were taken sequentially as the FIB milling process progressed. The intergranular pit was revealed to be a surface opening to a much larger void underneath the surface, where corrosion had dissolved much of the material surrounding the GBs. Additional smaller voids were also observed along GBs underneath the sample surface.
FIB milling was carried out in the same manner in an area containing an intragranular pit, shown in Fig. 13. This figure demonstrates an undercutting of the grain. Corrosion reactions have attacked the bulk of the grain first, propagating outwards from the pit at the surface.
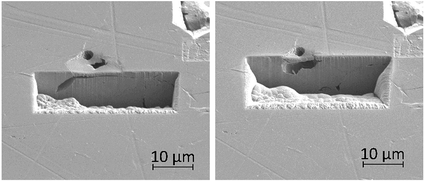 | ||
| Fig. 13 Secondary electron images taken as a part of a series of 2–5 μm thick slices into a region of the material surrounding an intragranular pit using FIB, taken at a tilt of 52°. | ||
4 Discussion
Numerous intergranular pits were observed using an optical microscope, HS-AFM and SEM imaging techniques. By collecting data concerning the intergranular pit chains using a number of different methods a more complete picture of the sequence of events was achieved.The intergranular pits encountered within this work are similar in morphology to those observed using electrochemical AFM by Martin et al. in 2007.18 However, within Martin’s work, investigations were carried out on a sample of unsensitised Type 304L stainless steel.18 This type of material does not contain sensitised GBs, and so pit initiation events will likely differ from the work presented here.18
HS-AFM measurements revealed that intergranular pits form as chains along the GB (Fig. 6). This was due to preferential corrosion of the GB, as a result of thermal sensitisation. During the thermal sensitisation process of AISI 304 stainless steel, chromium carbides precipitate along the GBs, as observed by HS-AFM in Fig. 5.2,33–35 This causes the local composition in the areas surrounding the GBs to be depleted in chromium, substantially reducing the GBs’ local resistance to corrosion.2,26,33–35,37 Previous studies have suggested that GB inclusions, such as chromium carbides, may act as initiation sites for pitting corrosion.11 By comparison of the topographic maps collected showing the chain-like intergranular pits (Fig. 6) and the carbide distribution within the GB (Fig. 5), it is apparent that there are similarities in their distributions. However, from the observations made, it cannot be conclusively stated that the intergranular pits observed initiated at GB inclusions, or indeed between GB inclusions, as suggested in other work.12
Optical images (Fig. 4) in combination with SEM images (Fig. 11a) revealed on a larger scale that these intergranular pits were a common feature in the areas surrounding larger pits, just ahead of the corrosion front. Investigation using FIB milling (Fig. 12a–d) demonstrated that intergranular pits are small surface entryways to much larger voids produced by IGA present beneath the surface. It is unclear, however, whether this undercutting is a result of the intergranular pit acting as an initiation site leading to GB dissolution, or if this is a result of corrosion progressing along GBs from the larger pit nearby (as seen in Fig. 12d).
The formation of an intergranular pit was observed in situ using HS-AFM, as seen in Fig. 7a and b taken before and after the pitting event, respectively. This data was collected ahead of the corrosion front. The full extent of this pit may not have been measured by HS-AFM due to the high aspect ratio of the pit aperture to pit depth. This observation, combined with SEM images of intergranular pits in areas at a distance from larger pits (Fig. 11c and d) suggest that intergranular pits may act as initiation events that lead to larger scale IGA. The secondary electron image in Fig. 11b shows earlier stages of IGA formed from numerous intergranular pits joined together, further substantiating the suggested sequence of events, though further investigation is required.
Optical data taken post-corrosion of the area investigated by HS-AFM (Fig. 4), revealed that the intergranular pit studied in Fig. 7c was no longer present on the surface, as the corrosion front had progressed across the site to form a larger pit (Fig. 4b). This highlighted the importance of in situ observation techniques, such as HS-AFM, as these measurements would not have been possible using ex situ methods.
By modelling the system using HS-AFM and electrochemical data, it was found that the system reached a radial diffusion regime in under 0.01 s, resulting in fast dissolution of material and rapid diffusion of corrosion products away from the pit site. In this model, corrosion product speciation was not simulated. This simplification was supported by this result, in combination with observations that the event transient was very short lived, and the fact that no corrosion product was apparent, according to the HS-AFM measurements (Fig. 7).
Results from the computational model (Fig. 9) also showed an increase in Cl− ion concentration and a reduction in pH (calculated by H+ concentration) in the areas surrounding the pit site. In experimental studies of pitting, enhanced local acidification is known to be a result of hydrolysis of the Fe2+ ions dissolving.3,10,14 Local accumulation of Cl− ions in combination with pH reduction is a key factor in the propagation of pitting corrosion, preventing repassivation.3,10
The current density (averaged over the assumed time interval) produced by this event was calculated to be considerable (2.6 × 10³ A m−2). However, as a result of the extremely small scale at which it occurred, the pitting current during the event was very small (approximately 2.7 × 10⁻⁹ A), as was the total charge transfer (1.37 × 10⁻⁹ C). Multiple pitting sites were observed to propagate simultaneously on the sample surface, illustrated in Fig. 4. As such, the current transient signals produced by events such as the one observed, are dwarfed by the current from other, much larger, stable pitting sites. The calculated current transient is similar to those measured in other studies where single transients for pitting events were successfully measured.14,15 Burstein et al. measured current transients for isolated metastable pitting events reaching nA values; these measurements were taken on an unsensitised sample of Type 304 stainless steel.14,15
Intragranular pits were also present across the sample surface, as observed within Fig. 11a, which was collected using SEM. These pits were round in appearance rather than the elongated shape observed for intergranular pits. Some intragranular pits appeared to have a similar morphology to that of a “satellite” pit, observed by Street et al.13 FIB milling was performed in an area containing an intragranular pit, shown in Fig. 13. This study revealed undercutting of the material beneath the surface. These observations differed from excavations of intergranular pitting, as corrosion appeared to progress outwards from the pit through the bulk of the grain as opposed to inwards from the GB.
Larger pits appeared to have been formed by a combination of intergranular and intragranular pitting, Fig. 11a, however the severity of IGA appeared to be the leading factor in producing the pits on this scale.
Initiation events of intragranular pits were not seen during in situ HS-AFM measurements or optical monitoring of the sample surface. Pitting events are known to often initiate at discontinuities on the surface, such as inclusions. Further investigation is required to identify the intragranular sites at which these pits likely initiated, such that intragranular pit initiation in situ might be observed.
Further work is required to build a more complete picture of events. Additional observations performed in situ of corrosion initiation events will help to provide a more statistically significant result. Further excavation using FIB milling will also be performed in future work. These studies will be performed at different stages of localised corrosion events in order to build up a better picture of how the system progresses.
Techniques implemented within this study do not provide any information about the local chemistry on the sample surface. The next step is therefore to perform energy-dispersive X-ray spectroscopy (EDX) of areas surrounding GBs and inclusions. This may be extended to a more detailed study performed using atom probe tomography (APT) and high-resolution transmission electron microscopy (HR-TEM).
Alterations to the methodology of this study are also considered:
• Build-up of corrosion products on the sample surface resulted in loss of resolution within some frames whilst performing in situ HS-AFM. A custom-built flow-through cell is currently being designed with the aim of minimising this. This modification will also result in the maintenance of the concentration of Cl− ions, which may influence the rate at which corrosion events take place.
• An intergranular pit initiation event was observed to occur within a time interval shorter than that measured using HS-AFM. The contact mode HS-AFM has the capability to reach much higher frame rates than those used within this study. Application of this capability will be implemented in future observations.
• In order to draw parallels between measured current transients and initiation events observed using HS-AFM, it is required that the active area of the sample be reduced considerably in size, as in other studies.3,10,14 This, however, introduces a number of challenges, such as crevice corrosion events.
5 Conclusions
Within this study, localised corrosion events were investigated occurring on thermally sensitised AISI 304 stainless steel in an aqueous solution of 1% NaCl. The sample surface was polarised by performing potentiodynamic and galvanostatic scans. A number of large pits were observed to form across the sample surface. Post-corrosion analysis of the surface using SEM revealed that these pits were a result of severe IGA working in combination with intragranular pitting events. Intragranular pits present across the sample surface were round in appearance rather than the elongated shape observed for intergranular pits.Intergranular pits were observed to occur in chains along GBs, appearing to be an early form of the severe IGA observed in some areas across the surface. Investigation using FIB milling revealed that in some areas these pits are small surface entryways to much larger voids produced by the IGA present beneath the surface. FIB milling was performed in an area containing an intragranular pit revealed undercutting that differed from excavations of intergranular pitting, as corrosion appeared to progress outwards from the pit through the bulk of the grain as opposed to inwards from the GB.
HS-AFM observations were performed in situ showing the formation of an intergranular pit in under 0.5 s. Information from this event in combination with electrochemical data was fed into a computational model using COMSOL MP software. The model calculated that the system reached a radial diffusion regime in under 0.01 s. The results were used to generate 3D plots that illustrated local acidification and a build up of chloride ions in the areas adjacent to the pitting site.
Multiple techniques were combined to produce a multifaceted picture of the electrochemical events occurring on the surface. These results demonstrated the potential of detailed in situ surface techniques, such as HS-AFM, working in combination with ex situ techniques such as FIB milling and SEM that allow for subsurface investigation.
Data availability statement
Further data are provided as the ESI† accompanying this paper. All underlying data are available to download from: Moore, Stacy (2018), “A Study of Dynamic Nanoscale Corrosion Initiation Events by HS-AFM”, Mendeley Data, v1. http://dx.doi.org/10.17632/hbk6xwvhc5.1.Conflicts of interest
Oliver Payton and Loren Picco are shareholders in Bristol Nano Dynamics Ltd., a University of Bristol spin-out company.Acknowledgements
The authors would like to thank COMSOL for providing a trial of COMSOL MP 3.5a with the allowance to publish the results produced in the software, and for the provision of technical support throughout the modelling process. Additional thanks to Celine Ramon, as well as Sammi Shamma (Account Manager), Andrew Young (COMSOL support) and Dr Annette Pahl (Technical Support Engineer) for their assistance. Thanks also to Mr Freddie Russell-Pavier for his discussions and help with modelling. Additional thanks to the physics workshop, the interface analysis centre (IAC) and the NSQI low noise labs at the University of Bristol. As well as the financial support of the National Nuclear Laboratory (NNL), the Engineering and Physical Sciences Research Council (EPSRC), and the Royal Academy of Engineering.References
- G. Du, J. Li, W. Wang, C. Jiang and S. Song, Corros. Sci., 2011, 53, 2918–2926 CrossRef.
- R. Cottis, Guides to good practice in corrosion control–stress corrosion cracking, 2000 Search PubMed.
- W. Tian, S. Li, N. Du, S. Chen and Q. Wu, Corros. Sci., 2015, 93, 242–255 CrossRef.
- R. Cottis et al. , Shreir’s Corrosion, Elsevier Science, 2009 Search PubMed.
- L. Calabrese, L. Bonaccorsi, M. Galeano, E. Proverbio, D. Di Pietro and F. Cappuccini, Corros. Sci., 2015, 98, 573–584 CrossRef.
- S. Pondichery, A study on the effect of magnetic field on the corrosion behavior of materials, The University of Texas at Arlington, 2014 Search PubMed.
- A. Yagati, J. Min and J. Choi, Mod. Electrochem. Methods Nano Surf. Corros. Sci., ed. M. Aliofkhazraei, 2014 Search PubMed.
- B. Nimmo and G. Hinds, Beginners guide to corrosion, 2003 Search PubMed.
- M. Faller and P. Richner, Mater. Corros., 2003, 54, 331–338 CrossRef.
- W. Tian, N. Du, S. Li, S. Chen and Q. Wu, Corros. Sci., 2014, 85, 372–379 CrossRef.
- N. Laycock and S. White, J. Electrochem. Soc., 2001, 148, B264–B275 CrossRef.
- R. E. Williford, C. F. Windisch and R. H. Jones, Mater. Sci. Eng. A, 2000, 288, 54–60 CrossRef.
- S. R. Street, N. Mi, A. J. Cook, H. B. Mohammed-Ali, L. Guo, T. Rayment and A. J. Davenport, Faraday Discuss., 2015, 180, 251–265 RSC.
- G. Burstein and S. Mattin, Philos. Mag. Lett., 1992, 66, 127–131 CrossRef.
- G. Burstein and S. Vines, J. Electrochem. Soc., 2001, 148, B504–B516 CrossRef.
- L. Liu, Y. Li and F. Wang, Electrochim. Acta, 2008, 54, 768–780 CrossRef.
- J.-y. Jiang, Y. Liu, H.-y. Chu, D. Wang, H. Ma and W. Sun, Materials, 2017, 10, 903 CrossRef PubMed.
- F. Martin, C. Bataillon and J. Cousty, Corros. Sci., 2008, 50, 84–92 CrossRef.
- G. Binnig, C. F. Quate and C. Gerber, Phys. Rev. Lett., 1986, 56, 930 CrossRef PubMed.
- O. Payton, L. Picco, D. Robert, A. Raman, M. Homer, A. Champneys and M. Miles, Nanotechnology, 2012, 23, 205704 CrossRef PubMed.
- H.-S. Liao, K.-Y. Huang, I.-S. Hwang, T.-J. Chang, W. W. Hsiao, H.-H. Lin, E.-T. Hwu and C.-S. Chang, Rev. Sci. Instrum., 2013, 84, 103709 CrossRef PubMed.
- G. Schitter, K. J. Astrom, B. E. DeMartini, P. J. Thurner, K. L. Turner and P. K. Hansma, IEEE Transactions on Control Systems Technology, 2007, 15, 906–915 Search PubMed.
- O. D. Payton, PhD thesis, University of Bristol, 2012.
- O. Payton, L. Picco and T. Scott, Int. Mater. Rev., 2016, 61, 473–494 CrossRef.
- A. Humphris, M. Miles and J. Hobbs, Appl. Phys. Lett., 2005, 86, 34106 CrossRef.
- A. Laferrere, R. Burrows, C. Glover, R. N. Clark, O. Payton, L. Picco, S. Moore and G. Williams, Corros. Eng., Sci. Technol., 2017, 52, 596–604 CrossRef.
- A. Pyne, W. Marks, L. M. Picco, P. G. Dunton, A. Ulcinas, M. E. Barbour, S. B. Jones, J. Gimzewski and M. J. Miles, Arch. Histol. Cytol., 2009, 72, 209–215 CrossRef PubMed.
- A. D. Warren, A. I. Martinez-Ubeda, O. D. Payton, L. Picco and T. B. Scott, Microsc. Today, 2016, 24, 52–55 CrossRef.
- S. Salleh, PhD thesis, University of Manchester, 2012.
- D. Macdonald and G. Engelhardt, Shreir’s Corrosion, Elsevier BV, 2010 Search PubMed.
- R. Burrows, PhD thesis, University of Manchester, 2013.
- J. Buffle, Z. Zhang and K. Startchev, Environ. Sci. Technol., 2007, 41, 7609–7620 CrossRef PubMed.
- A. King, G. Johnson, D. Engelberg, W. Ludwig and J. Marrow, Science, 2008, 321, 382–385 CrossRef PubMed.
- M. Breimesser, S. Ritter, H.-P. Seifert, S. Virtanen and T. Suter, Corros. Sci., 2012, 55, 126–132 CrossRef.
- T. M. Wong, Masters thesis, University of Canterbury, Christchurch, New Zealand, 1986.
- D. Ricci and P. C. Braga, Atomic Force Microscopy, Springer, 2004, pp. 25–37 Search PubMed.
- C. J. Moss and J. M. Sykes, Thermal sensitisation of 20Cr/25Ni/Nb stainless steel, in Radiation-induced sensitisation of stainless steels, ed. D. I. R. Norris, United Kingdom, 1987, p. 142 Search PubMed.
Footnote |
| † Electronic supplementary information (ESI) available: Videos of HS-AFM observations of carbides, intergranular pit formation, and intergranular pit chains. Also provided is a full set of results from the multiphysics simulation of the intergranular pit formation event. See DOI: 10.1039/c8fd00017d |
| This journal is © The Royal Society of Chemistry 2018 |

