 Open Access Article
A broadly applicable quantitative relative reactivity model for nucleophilic aromatic substitution (SNAr) using simple descriptors†
Jingru
Lu
,
Irina
Paci
 * and
David C.
Leitch
 *
*
Department of Chemistry, University of Victoria, 3800 Finnerty Rd. Victoria BC, CANADA V8P 5C2. E-mail: ipaci@uvic.ca; dcleitch@uvic.ca
First published on 17th October 2022
Abstract
We report a multivariate linear regression model able to make accurate predictions for the relative rate and regioselectivity of nucleophilic aromatic substitution (SNAr) reactions based on the electrophile structure. This model uses a diverse training/test set from experimentally-determined relative SNAr rates between benzyl alcohol and 74 unique electrophiles, including heterocycles with multiple substitution patterns. There is a robust linear relationship between the experimental SNAr free energies of activation and three molecular descriptors that can be obtained computationally: the electron affinity (EA) of the electrophile; the average molecular electrostatic potential (ESP) at the carbon undergoing substitution; and the sum of average ESP values for the ortho and para atoms relative to the reactive center. Despite using only simple descriptors calculated from ground state wavefunctions, this model demonstrates excellent correlation with previously measured SNAr reaction rates, and is able to accurately predict site selectivity for multihalogenated substrates: 91% prediction accuracy across 82 individual examples. The excellent agreement between predicted and experimental outcomes makes this easy-to-implement reactivity model a potentially powerful tool for synthetic planning.
Introduction
Making reliable predictions about the reactivity of organic molecules under specific conditions is the cornerstone of organic synthesis.1 Every organic chemist learns to qualitatively predict and/or rationalize reactivity based on the properties of functional groups and substituents, and to use these predictions in designing effective syntheses.2,3 Quantitative predictions of reactivity and selectivity are generally more challenging to achieve, and rely on sufficient experimental data to build structure-reactivity correlations, extensive theoretical calculations, or a combination of the two.4–9 Recent advances in this area combine techniques such as high-throughput experimentation, descriptor generation, multivariate statistical analysis, and machine learning to generate robust quantitative structure-reactivity relationships (QSRR) and/or quantitative structure-selectivity relationships (QSSR) for specific reactions.10–22 However, many significant challenges remain, including reliable data collection for a large enough set of chemical space, broad applicability of the resulting models beyond the specific training/test sets examined, and deployment in complex molecule synthesis planning and design.23–25One class of organic reactions for which accurate predictive models would be invaluable is nucleophilic aromatic substitution (SNAr). SNAr is one of the most important and well-studied transformations in organic synthesis.26–29 It is extensively used in total synthesis of natural products,30–37 medicinal chemistry and agrochemistry,38–43 and manufacturing of active pharmaceutical and agrochemical ingredients.44–48 For example, SNAr reactions are particularly powerful for the synthesis and functionalization of N-heterocycles, which are among the most ubiquitous structural components in active pharmaceutical ingredients.49–51
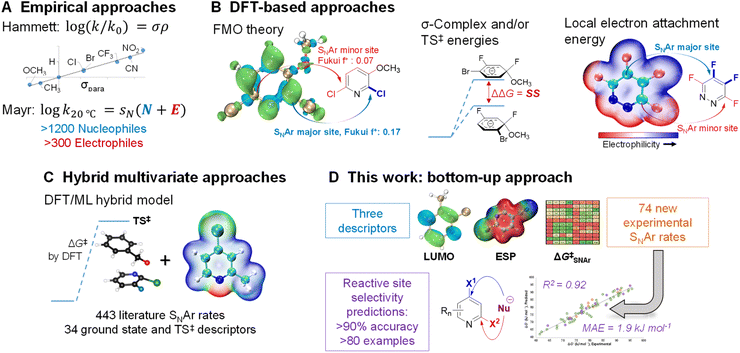
Because of its importance in synthesis, designing efficient and highly selective SNAr reactions involving complex molecules is crucial. Substantial research over the past 100 years has been devoted to understanding the operative reaction mechanisms, whether stepwise or concerted,26,52–54 and in collecting experimental reactivity and selectivity data for myriad substrate combinations. For example, Hammett55 and/or Mayr parameters4 are often used as mechanistic probes and to correlate/predict SNAr reactivity (Fig. 1A).56–62
Theoretical and computational methods have been used to develop predictive models for specific subsets of SNAr chemistry (Fig. 1B). Early work focused on stability of the σ-complex intermediates using Iπ-repulsion theory,63,64 or frontier molecular orbital considerations65 to explain and predict regioselectivity.66 Baker and Muir67,68 as well as Brinck, Svensson, and co-workers69–71 have published several works on predicting regioselectivity for SNAr reactions using DFT-calculated transition state energies and/or stability of the σ-complex intermediates (SS).71
Quantum chemical transition state calculations are undeniably a powerful tool to explore reaction mechanisms and provide theoretical evidence to support experimental findings; however, the computational cost of performing transition state analyses remains high, and the complexity and nuance of these calculations make them beyond the expertise of many synthetic research groups. More desirable from an end-user perspective are models built from easily obtained molecular descriptors. In addition to established electronic and steric descriptors,55,72,73 in 2016 Brinck and co-workers introduced the local electron attachment energy (analogous to the local electron affinity) as a molecular descriptor for electrophilicity,74 and have applied it toward reactivity/selectivity predictions for SNAr reactions.75 While this descriptor correlates well with sets of experimental rates, and is able to provide qualitative selectivity predictions in multihalogenated systems, there is a need for new and more varied data and descriptor sets as foundations to build broadly applicable models for synthetic planning.
Recently, Jorner, Brinck, Norrby, and Buttar reported the use of a hybrid DFT/machine learning (ML) approach to predicting experimental activation energies (Fig. 1C).21 This important study collates more than 440 SNAr reaction rates from the existing literature, and uses 34 ground state and transition state descriptors as the training/test set. Notably, DFT-calculated transition state energies are a crucial descriptor in the best-performing model. This hybrid approach is demonstrably powerful, able to generate a broadly applicable and accurate model; however, the existing experimental rate data contains key gaps, such as an overemphasis on nitroarenes, and relatively few heterocyclic electrophiles. The hybrid DFT/ML approach also requires transition state calculations for maximum accuracy, especially if relatively few data points are available.
In this work, we consider the following three aspects of a predictive model to have equal importance: (1) the prediction accuracy the model provides, especially for new (external) predictions; (2) the breadth of applicability the model affords across chemical space; and (3) the ease and simplicity of applying the model to new systems. In the previously described examples, reaction rate/selectivity data used to train and validate the QSRR/QSSR models are taken from literature values, skewing the chemical space coverage toward well-studied systems. To complement the existing SNAr rate data from the literature, we measured relative reaction rates for 74 individual electrophiles – including many nitrogen heterocycles relevant to pharmaceutical synthesis – using a competition experiment approach, which is commonly used to generate univariate Hammett plots.76–81 Having control over the composition of our training set gives us the flexibility to have a varied and balanced distribution of structural features, which is necessary to ensure both accuracy and applicability in making new predictions. To make the model easy to implement, and to reduce the computational cost required, we combined simple and easy-to-obtain ground state molecular descriptors with our own experimentally determined SNAr rates. From this combination of factors, we have constructed a QSRR model for SNAr reactions with excellent performance in predicting reactivity trends and site selectivity for many different electrophiles, including for multiple external test sets with significantly different molecular structures (Fig. 1D).
Results and discussion
Creating the training/test set
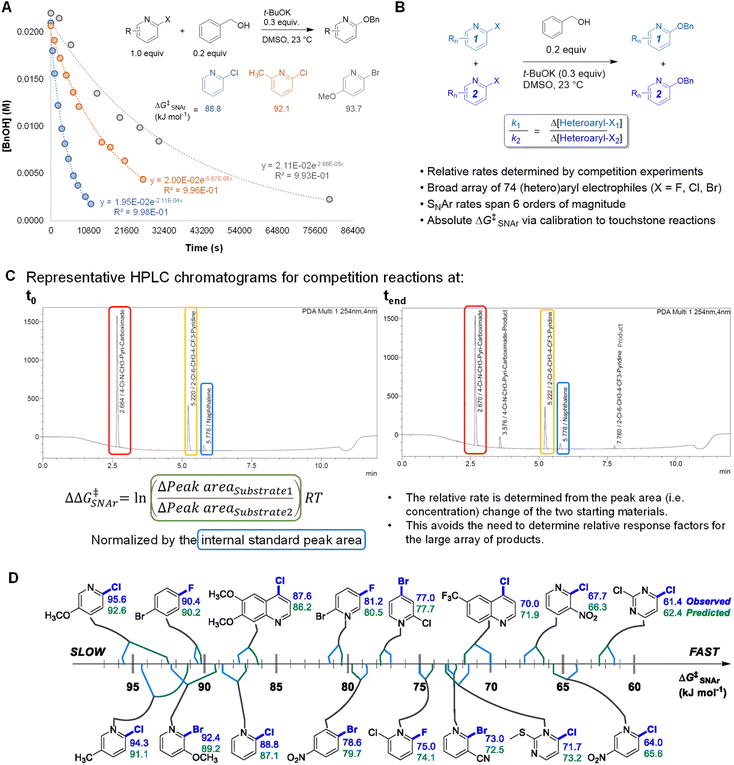
An efficient approach to collect a large and diverse data set of reaction rates is critical to our bottom-up approach. To determine a large number of reaction rates in a timely manner, we followed a workflow of high-throughput competition experimentation shown in Fig. 2. This experimental approach can be summarized in three steps: first, we monitored the reaction progress of three touchstone reactions under pseudo first order conditions. We determined absolute rate constants and free energies of activation (ΔG‡SNAr) for SNAr between benzyl alkoxide and 2-chloropyridine, 2-chloro-6-methylpyridine, or 2-chloro-5-methoxypyridine as the electrophile (Fig. 2A). Next, we determined relative rate constants for the electrophile substrate library by a series of 94 individual competition experiments under analogous conditions (Fig. 2B and Table S2†). Competition reactions were conducted under pseudo first-order conditions by having two electrophiles in excess but equal amount to compete with one nucleophile. The reaction solutions were quantitatively analyzed using UPLC. For each competition experiment, chromatograms were recorded for the reaction solutions at two time points: the start of the reaction (t0) and completion of the reaction (tend). The ratio between the two SNAr rates is obtained from the relative concentrations of the two remaining substrates at tend. This method of quantification avoids the need to obtain relative response factors between all 74 new SNAr products and the internal standards. All experimental details of competition experiment set-up, LC method parameters, and experimentally determined relative rates for the entire array of 74 electrophiles are detailed in the ESI.Finally, we calibrated these relative rate constants using the touchstone reactions, giving absolute rate constants and the corresponding ΔG‡SNAr values for the entire array of SNAr reactions (Table S3†). We used the absolute ΔG‡SNAr value for the 2-chloropyridine touchstone reaction (88.8 kJ mol−1) as the calibration point, with the other two touchstone reactions (2-chloro-6-methylpyridine, and 2-chloro-5-methoxypyridine) used to confirm the validity of the competition determined ΔG‡SNAr values. We obtain a percent difference between the competition values and touchstone values of <2% (Fig. S3†). In addition, we determined independent ΔG‡SNAr values for 17 substrates using multiple competition experiments, giving an estimate of the error for the relative ΔG‡SNAr values; the difference between the average ΔG‡SNAr value and the individual measurements is between 0.2 – 1.7 kJ mol−1 (Table S5†).
Using this competition approach, we were able to rapidly build a reliable and self-consistent data set from a library of 74 (hetero)aryl halides. This includes 6-membered aromatic electrophiles with many different substitution patterns – electron donating/withdrawing groups in all possible positions, multiple substituents, and several heterocycle classes – and thus a variety of electronic effects. The reactivity of these substrates crosses a broad range, with the reaction rates spanning 6 orders of magnitude; a quantitative reactivity scale for several representative electrophiles is shown in Fig. 2D. As an initial check on the validity of our data set, we assessed the general reactivity trends against the known features of SNAr reactivity. As expected, electron-deficient arenes react much faster than electron-rich ones; furthermore, the reactivity of the halides leaving groups follows the established trend, with rates decreasing as Ar–F >> Ar–Cl ∼ Ar–Br.82 We also constructed Hammett plots for four sets of 2-X-pyridine substrates (X = Cl, Br), giving linear correlations with rho values of ∼4–5 (Fig. S4–S7†). Finally, we have prepared and isolated 5 representative SNAr products (compounds S1-S5), and confirmed their structures using NMR spectroscopy and high-resolution mass spectrometry (Fig. S8–S17†).
Model generation and performance
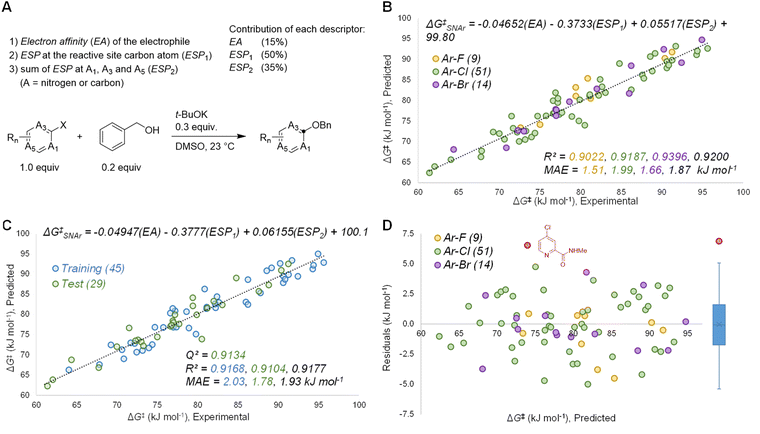
Based on the known aspects of SNAr reaction mechanisms, and our prior work83 in applying ground state molecular descriptors84 to reactivity predictions, we built a quantitative structure-reactivity model for SNAr electrophiles using only three descriptors. These include a global descriptor in the electron affinity (EA) of the electrophile, and two local descriptors based on average molecular electrostatic potentials (ESP).85–88 In addition to the ESP at the carbon undergoing substitution (ESP1), we also discovered that the sum of ESP values for the ortho and para ring atoms is required for accurate predictions (ESP2) (Fig. 3A).By building a multivariate linear correlation between these three ground state descriptors and our experimentally obtained ΔG‡SNAr values, we have established a unified structure-reactivity model able to accurately predict SNAr rates for electrophiles with various structural features and leaving groups under our reaction conditions. There is an excellent linear correlation between the predicted and actual ΔG‡SNAr values (R2 = 0.92) and a mean absolute error (MAE) of only 1.8 kJ mol−1 (0.43 kcal mol−1) (Fig. 3B). Performing a min/max normalization of the descriptors reveals their percentage contribution to the model, with ESP1 being most important (50%), followed by ESP2 (35%), and finally only a modest contribution from the EA (15%). We note that including steric-based descriptors was not necessary to obtain good correlations for our data set; adding substituent A-values as an additional factor in our multivariate regression led to no change in the model, and a very small coefficient for the A-value term (Table S7†). Further work to explore steric effects in a wider range of SNAr reactions is ongoing.
We have assessed the robustness of the model using cross-validation with five different random 60/40 training/test set data splits (Fig. 3C and S20–24†) and one structured split (Fig. S25†). All of these regression analyses give essentially identical results, with excellent correlation statistics as indicated by the range of Q2 values89 from 0.86 to 0.93, and MAE values from 1.6 to 2.3 kJ mol−1 for the test sets. We also evaluated the 95% prediction intervals for the 29 members of the test set in Fig. 3C, giving a range of ±5.1 kJ mol−1 to ±5.5 kJ mol−1 (Fig. S20†). Finally, we also assessed the model performance by analysing the distribution of residuals across the data set, and identifying any possible outliers. As shown in Fig. 3D, the residuals are randomly distributed, almost exclusively in the range −5 to +5 kJ mol−1 (i.e. within an order of magnitude of the experimental rate). A box plot reveals only one significant outlier (|residual| > 5 kJ mol−1): 2-(N-methylcarboxamide)-4-chloropyridine.
The selection of these specific molecular descriptors was guided by the mechanistic features of nucleophilic aromatic substitution, as well as our previous work on a multivariate model for oxidative addition with (hetero)aryl halides.83 We also carried out an iterative refinement of the included descriptors based on our experimental observations and model performance (Table S5†). The following discussion provides more detail on creation and refinement of the model and its mechanistic basis.
A classic approach to describing nucleophile/electrophile reactivity involves frontier molecular orbital (FMO) theory.90,91 At a basic level, a lower LUMO energy for the electrophile leads to smaller HOMO–LUMO gap between nucleophile and electrophile. This results in a lower energy transition state, and therefore a faster reaction. On the other hand, this simple connection between electrophilicity and LUMO energy is not necessarily valid for every system: in one recent example, Zipse, Ofial, and Mayr have demonstrated poor correlation between LUMO energy and electrophilicity for a series of Michael acceptors.92 This is attributed to substituent effects that increase π-conjugation (lowering LUMO energy), but decrease electrophilicity. Nevertheless, we considered including LUMO energies as a potential molecular descriptor for SNAr reactivity.
As a substitute for LUMO energies, we initially used calculated electron affinity (EA) values for each electrophile, since EA is a physical observable that can be experimentally measured. Conceptually, EA and LUMO energy are related according to the Koopmans's theorem approximation (that the LUMO energy is the negative of the EA),93,94 enabling an intuitive analogy to be made to FMO treatments. To confirm this analogy for the substrate set under study, we compared our calculated EA values to LUMO energies obtained via DFT (B3LYP/def2-TVZPD, Fig. S26†), revealing a strong linear correlation (R2 = 0.94). We also investigated an operationally simpler approach to calculating LUMO energies using Entos Envision,95 an open online interactive platform for molecular simulation and visualization that performs rapid semi-empirical calculations using GFN1-xTB.96 Comparing these semi-empirical LUMO energies to our EA calculations also reveals a strong linear correlation (R2 = 0.88, Fig. S28†). In addition, using either set of LUMO energies in lieu of EA values gives nearly identical linear regression models to that in Fig. 3B (Figs. S27 and S29†). While we retained the EA values for our subsequent validation and external predictions, LUMO energies from DFT or semi-empirical calculations could certainly be a rapid and easy to calculate alternative for synthesis-focused research groups.
To account for substituent effects beyond those on FMO energies, we used average molecular ESP at individual aromatic ring atoms as a local descriptor.85–88 The extent of electron deficiency at the reactive carbon is a key factor in determining SNAr rates, and the corresponding ESP is a quantitative descriptor of this molecular feature. Previously, we observed excellent correlation between ESP-based descriptors and rates of Ar–X oxidative addition to Pd(0),83 which shares mechanistic aspects with SNAr reactivity.97 All ESP calculations were performed using the freely available Multiwfn application (version 3.7).98,99
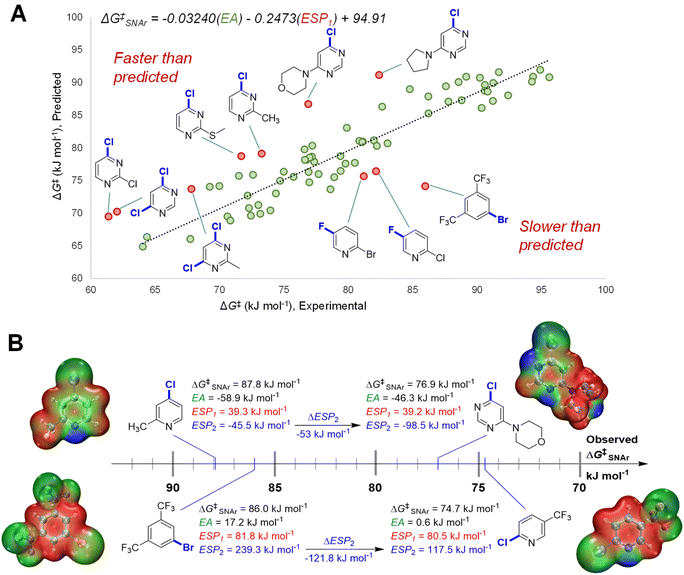
We initially constructed a bivariate linear model using just two descriptors: EA and ESP1 (at the carbon undergoing substitution) (Fig. 4A). This model gives good predictions for halogenated pyridines and quinolines; however, it significantly underestimates the reactivity of halogenated pyrimidines, and overestimates the reactivity of several non-heterocyclic haloarenes. The nature of these outliers led us to consider the electronic structure of the Meisenheimer intermediate and SNAr transition state more generally. During substitution, the excess negative charge in the intermediate/TS‡ is distributed via resonance to the ortho and para positions relative to the reactive site; the degree to which these atoms can stabilize this negative charge should therefore affect the reaction rate. Thus, we included the ESP2 descriptor to account for these additional electronic effects, giving the superior model shown previously in Fig. 3B (vide supra).
To highlight the importance of ESP2 in making accurate predictions for multiple electrophile classes, we examined the two largest outliers from the bivariate model on either side of the distribution. We paired these two outliers with halopyridines that have very similar ESP1 values, but significantly different observed ΔG‡SNAr (Fig. 4B). In the first case, the faster than predicted outlier 4-chloro-6-morpholinopyridine has very similar EA and nearly identical ESP1 values to 4-chloro-2-methylpyridine; however, these two electrophiles have a ΔΔG‡SNAr = 10.9 kJ mol−1 (∼100 fold rate difference at 298 K). These substrates have strikingly different ESP2 characteristics, with the pyrimidine exhibiting a substantially larger negative value due to the additional nitrogen in the ring. The same situation is observed for the slower than predicted outlier 1-bromo-3,5-bis(trifluoromethyl)benzene and 2-chloro-5-(trifluoromethyl)-pyridine (ΔΔG‡SNAr = 11.3 kJ mol−1): both substrates have nearly identical EA and ESP1 descriptor values, but a more than 120 kJ mol−1 difference in ESP2.
Site selectivity in multihalogenated heterocycles
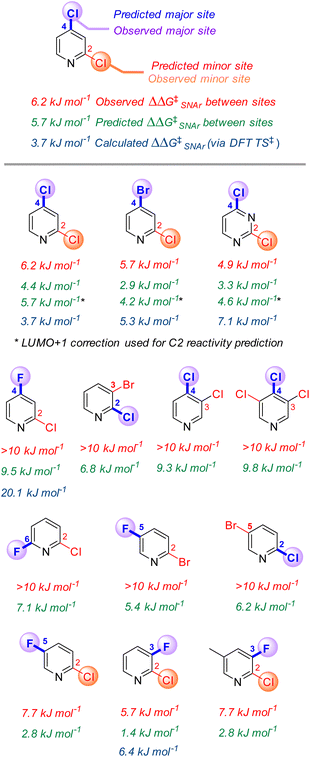
One of the most powerful applications of quantitative models in synthesis is to predict selectivity for one product over another. Many prior efforts in SNAr reactivity prediction focused on exactly this problem, developing qualitative and quantitative models for site selectivity involving multihalogenated electrophiles.21,63–71,74,75,100 Within our 74-member substrate training library are several electrophiles with multiple reactive positions. The reactivity of these substrates provides an opportunity to test the model's applicability for quantitative selectivity predictions, despite not being explicitly trained for this purpose. Importantly, the major contributors to the model (ESP1 and ESP2) are local descriptors, which is key to enabling differential predictions for each reactive site.101For the 13 multihalogenated substrates in our library, we determined the experimental site selectivity and compared the resulting ΔΔG‡SNAr to that predicted by our descriptor-based model. We also calculated ΔΔG‡SNAr values for 5 of the substrates from DFT analysis of the corresponding transition states (Fig. 5). In every case, using the three-descriptor model from Fig. 3B to independently predict ΔG‡SNAr for each site correctly identifies the most reactive position, with reasonable quantitative accuracy that is comparable to that obtained via transition state analysis; however, the model-predicted ΔΔG‡SNAr between sites does appear to be systematically low (i.e. selectivity is consistently underestimated).
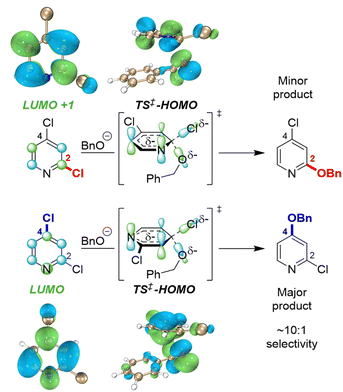
To identify possible reasons for this systematic underestimation, we considered that our global EA descriptor may not be optimal in these cases, and chose the first three substrates from Fig. 5 for further investigation. To assess the FMOs involved in these specific regioselective SNAr reactions, we examined the symmetries of the LUMO and LUMO + 1 orbitals of the substrates, and calculated the structures and energies of the SNAr transition states (Fig. 6 and S30–S39†). In each case, we could not locate a Meisenheimer-type intermediate along the reaction coordinate, but did locate transition states consistent with concerted SNAr reactions.29,53,54,102 As shown for 2,4-dichloropyridine in Fig. 6, the relevant electrophile FMO for attack at C4 is the LUMO, whereas for attack at C2 it is the LUMO+1; this is evident from the LUMO/LUMO+1 symmetries of the substrate, and the HOMO symmetries of two transition states. Subtracting the calculated LUMO/LUMO+1 gap from the EA as a correction when applying the model from Fig. 3B for C4 versus C2 predictions of the first three substrates does give increased accuracy, with errors of 0.3–1.5 kJ mol−1 for ΔΔG‡SNAr.
External case study #1: SNAr rate correlations
With our three descriptor model performance validated against internal data, we sought to assess its performance and generality when applied to new predictions beyond the training set. To challenge the scope of applicability to SNAr reactions with different solvents and/or nucleophile classes, we first examined several correlations between predicted ΔG‡SNAr values from the model and three sets of experimental ΔG‡SNAr values from the literature (Fig. 7).56,103–105 In these experimental data sets, a variety of (hetero)aromatic halides (F, Cl, and Br as leaving groups) are reacted with either alkoxide (Fig. 7A) or amine (Fig. 7B and C) nucleophiles. While the absolute ΔG‡SNAr values from the prediction model are specific to the reaction conditions of the training set, we do obtain good to excellent correlation between the predicted ΔG‡SNAr and experimental ΔG‡ values (R2 = 0.72–0.99). This is remarkable considering only two of the 34 electrophiles from these data sets are included in our training data (compounds 3B and 4B in Fig. 7B), and these reactions are conducted with different nucleophiles, solvents, and temperatures. We do note the diminished performance for set 7B, which may be because our model is predominantly trained using substrates with Cl or Br leaving groups, whereas the 7B set contains several substrates with F leaving groups.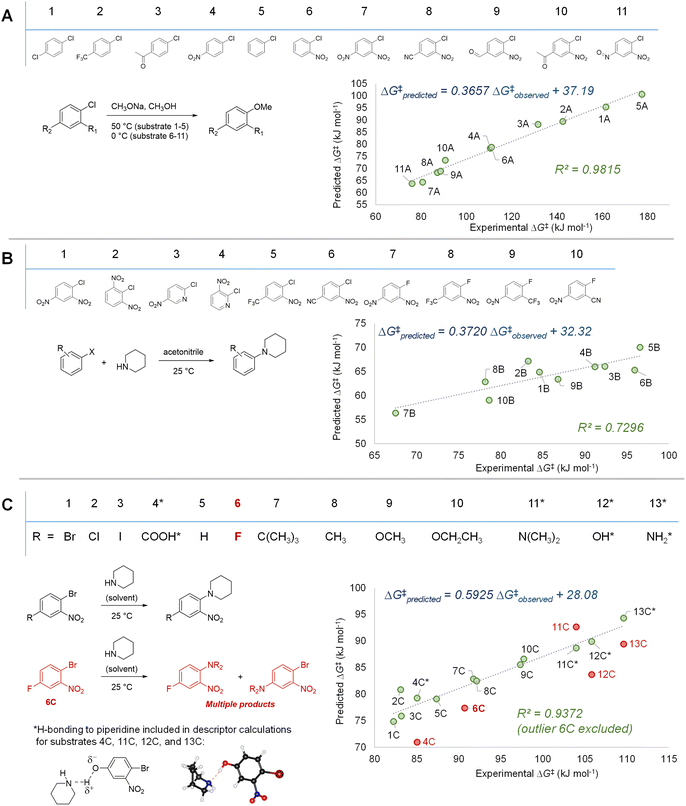 | ||
| Fig. 7 Model validation through assessing correlations between experimental ΔG‡ values and predicted ΔG‡SNAr for three external data sets. (A) SNAr between chlorobenzene derivatives and methoxide; experimental data from ref. 56 and 103 (B) SNAr between (hetero)aryl chlorides/fluorides and piperidine; experimental data from ref. 105 (C) SNAr between substituted 1-bromo-2-nitrobenzenes and piperidine; experimental data from ref. 104. | ||
Notably, we are able to account for solvation effects on electrophile reactivity during descriptor generation. In data set C (Fig. 7C), there are several substrates containing acidic or basic functional groups where the initial correlation between experimental and predicted reactivity is poor (Fig. 7C, substrates 4C, 11–13C, red points). Given that these functional groups will hydrogen-bond with the piperidine solvent, significantly altering the electronics of the substrate, we included one explicit solvent molecule and recalculated the ESP descriptors for these four electrophiles.75 Using these revised ESP values, we obtain excellent linear correlation across the entire substrate set.
In addition to the success in applying the ESP/EA model beyond the training set, and in identifying solvation effects on reactivity, we can also identify potential experimental outliers. For example, the data set in Fig. 7C contains one significant outlier (6C). In this case, 6C has two potentially reactive positions (Ar–Br and Ar–F). We have experimentally confirmed that reacting 6C with piperidine leads to a mixture of the two SNAr products, in a 1.5![[thin space (1/6-em)]](https://www.rsc.org/images/entities/char_2009.gif) :
:![[thin space (1/6-em)]](https://www.rsc.org/images/entities/char_2009.gif) 1 ratio, slightly favouring Ar–Br substitution (Fig. S40†).
1 ratio, slightly favouring Ar–Br substitution (Fig. S40†).
External case study #2: site selectivity predictions
To further examine the potential applicability of our ESP/EA model beyond the training set, we assessed 63 external examples of site selectivity in SNAr reactions under a variety of conditions. We first applied predictions to three data sets previously used as a testing ground for site selectivity predictions using other approaches (Fig. 8–10).69–71,75 These data sets also contain experimentally-determined rates, providing an additional opportunity to test the model's performance.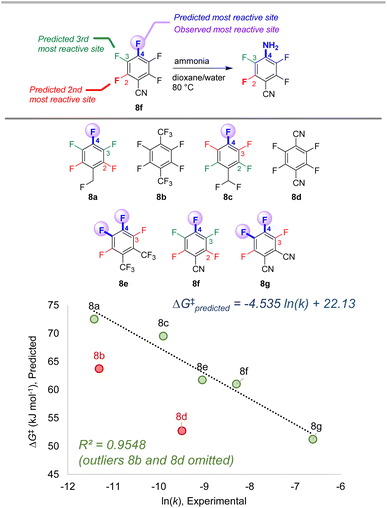 | ||
| Fig. 8 Site selectivity predictions and rate correlation for SNAr between fluorinated arenes and ammonia. Experimental data from ref. 99 | ||
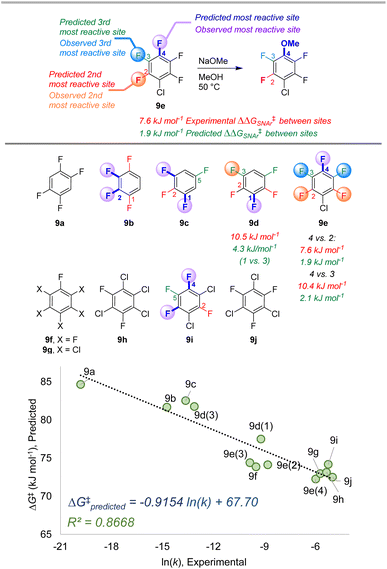 | ||
| Fig. 9 Site selectivity predictions and rate correlation for SNAr between fluorinated arenes and methoxide. Experimental data from ref. 100 | ||
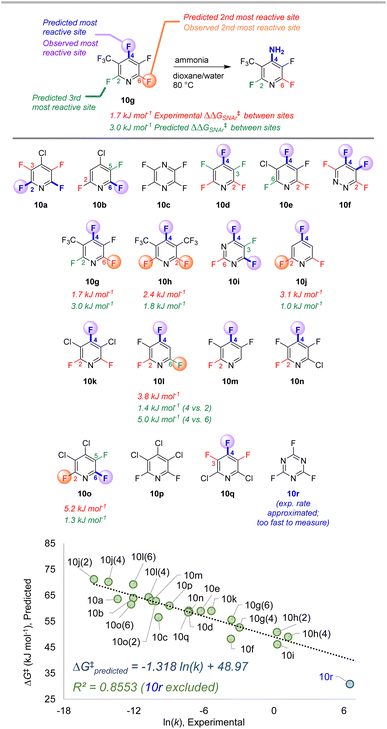 | ||
| Fig. 10 Site selectivity predictions and rate correlation for SNAr between fluorinated heterocycles and ammonia. Experimental data from ref. 99, 101, and 102. | ||
The first data set involves 7 multiply fluorinated arenes undergoing substitution with ammonia, where 5 substrates have potential for regioisomer formation (Fig. 8).106 In each case, the predicted major site based on the ESP/EA model matches the experimental site. Furthermore, the predicted ΔG‡SNAr values correlate well with the experimental ln (k) values for these 5 substrates (R2 = 0.95). Notably, ln (k) for substrates 8b and 8d do not correlate; this exact situation was noted by Stenlid and Brinck, who also observed these two substrates as significant outliers when correlating ln (k) with the local electron attachment energy.75 While these authors attributed this discrepancy between prediction and experiment to steric effects, there may be a different underlying reason considering the small size of both the nucleophile (ammonia) and the cyano group in 8d.
The second data set also involves multiply fluorinated arenes, this time undergoing SNAr with the methoxide anion as the nucleophile in methanol solvent (Fig. 9).107 Across these 10 substrates, 5 have the potential to form regioisomers. In each of these cases, the ESP/EA model correctly predicts the major site of reaction. For substrate 9d, the predicted second most reactive site is incorrect (C2) based on experimental observation (C3); however, for 9e the predicted reactivity order from first to third site is correct. While we again observe an underestimation of selectivity based on predicted ΔG‡SNAr values, we do observe excellent linear correlation with experimental ln (k) across the entire substrate set. This is notable in the context of Stenlid and Brinck's prior work with local electron attachment energy, where the experimental ln (k) for 9g-j does not correlate with that descriptor. Here, the ESP/EA model correctly predicts that these four substrates should have similar SNAr rates (within a factor of 10 of each other).
The third data set contains 18 multiply fluorinated nitrogen heterocycles undergoing SNAr with ammonia, with 15 examples where regioisomers can be formed (Fig. 10).106,108,109 In every case ESP/EA model correctly predicts the major site of reaction, and in all but one case (10l) it also predicts the second site of reaction. The quantitative selectivity predictions are also much closer to the experimental values within this data set. We again observe excellent linear correlation between experimental ln (k) and predicted ΔG‡SNAr. Note that substrate 10r, which has a rate “too fast … to measure”,109 is estimated to have an ∼105-fold larger rate constant than 10d; this estimated data point is not included in the linear correlation.
Finally, to challenge the qualitative accuracy of the model, we applied it toward a series of more complex SNAr examples with a wider variety of nucleophiles (Fig. 11). Sets A–D were previously collated and categorized by Brinck, Svensson, and co-workers and categorized depending on the nature of the nucleophile/electrophile pairing.70,109–127 Using only the structure of the electrophile, our ESP/EA model is able to correctly predict the major site of reaction in 26 of the 32 cases. Within sets A and C – (hetero)aryl halides reacting with anionic nucleophiles – the two incorrect predictions are for relatively non-polar fluorinated arenes. For sets B and D, which employ neutral nucleophiles, the incorrect examples all involve secondary amine nucleophiles. In these cases, steric effects appear to play a significant role in overriding the electronic nature of the electrophile; for example, pentachloropyridine reacts preferentially at C4 (as predicted) with alkoxide or ammonia nucleophiles, but switches to C2 selectivity with diethylamine. We also applied predictions to 6 mixed halide electrophiles reacting with a variety of nucleophiles in set E, drawn from examples in medicinal/agrochemical discovery.128–133 The model is able to correctly identify the major site of reactivity for each example, except for a case where the predicted site is at an Ar–F, and the observed reactivity is at a 2-Cl-pyridine site.
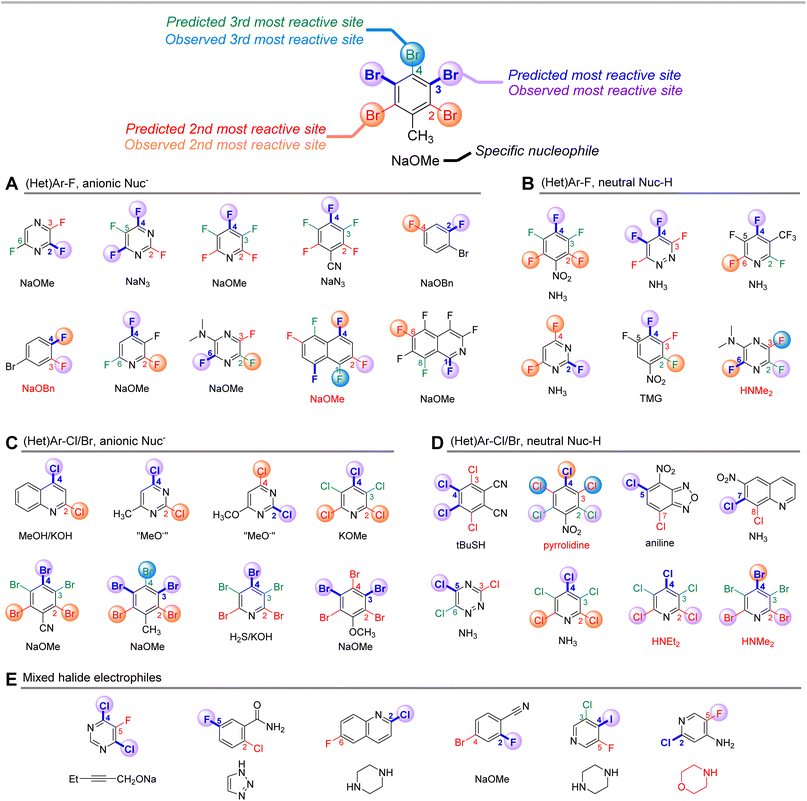 | ||
| Fig. 11 Qualitative site selectivity predictions for combinations of (hetero)aryl halides with anionic (A and C) and neutral (B and D) nucleophiles, and for mixed halide aromatics (E). | ||
External case study #3: complex molecule synthetic planning
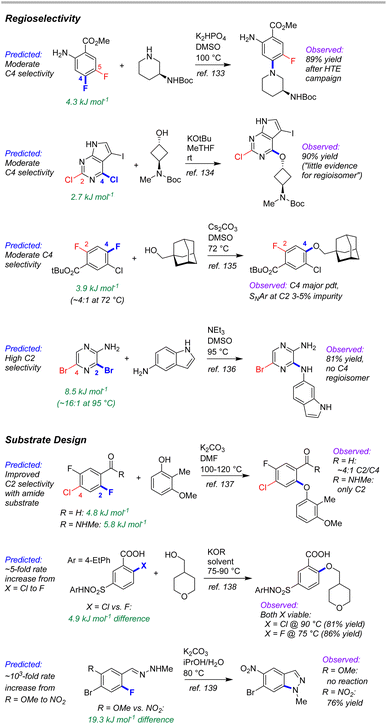
As a test of the ESP/EA model's potential utility in real-world synthetic planning, we sought to validate its predictions against SNAr reactions used to prepare clinical candidate active pharmaceutical ingredients (APIs). These include recent reports on branebrutinib,134 an EGFR T790 M inhibitor,135 a Nav1.7 inhibitor,136 a tyrosine kinase inhibitor,137 an SRI/5-HT2A antagonist,138 an RoRγ inverse agonist,139 and merestinib140 (Fig. 12).The first four examples concern site selective SNAr to generate a variety of targets from structurally complex substrates. In each of these cases, the ESP/EA model is able to predict the correct reactive site. Thus, applying these predictions during synthetic design would help pharmaceutical process chemists to proceed with confidence that selective substitution is feasible. In fact, the chemists at Pfizer used an internal prediction tool (based on Fukui indices) to help guide their synthetic planning toward the EGFR T790 M inhibitor (2nd example in Fig. 12).135
A particularly powerful aspect of in silico reactivity predictions is the ability to evaluate multiple options in substrate design before committing experimental resource. We have examined three examples where the substitution pattern of the SNAr electrophile affects the site selectivity or reactivity. In the first case, synthesis of the target SRI/5-HT2A antagonist requires a site selective SNAr to install an aryl ether ortho to a carbonyl functionality.138 This was initially performed using an aldehyde moiety; however, the relatively poor site selectivity meant column chromatography was required to purify the intermediate. Further process developments identified an N-methylamide as a more selective alternative that retained key functionality for progressing to the target API. This improved selectivity is predicted by the ESP/EA model. A second case involves choice of either an Ar–F or Ar–Cl electrophile for SNAr with an alkoxide nucleophile.139 Experimental evaluation of each revealed that both substrates are viable, with the Ar–Cl version requiring slightly higher reaction temperature than the Ar–F analogue. The ESP/EA model predicts that the F for Cl switch would result in a relatively modest reactivity decrease, indicating both should be suitable substrates.
The final example concerns an intramolecular SNAr to generate an indazole en route to merestinib.140 The final API contains a methoxy group para to the indazole nitrogen; however, attempts to perform the intramolecular SNAr with this strong electron donating group para to the substitution site were not successful. Instead, the researchers installed a nitro group to enable the SNAr to proceed, but which would require multiple functional group interconversions. The substantial difference in reactivity between –OMe and –NO2 derivatives is conceptually obvious (and borne out by the ESP/EA model); however, the orders-of-magnitude difference in predicted rate between the two means that the more desirable –OMe substrate could be ruled out earlier on in synthetic development. Furthermore, additional hypothetical substrates that retain the required oxygen (such as a sulfonate) could be evaluated using the prediction model (the –OMs derivative has a predicted ΔG‡SNAr halfway between the –NO2 and –OMe derivatives).
Conclusions
We have demonstrated an effective bottom-up approach to developing a quantitative structure-reactivity model for nucleophilic aromatic substitution reactions. By curating a diverse library of (hetero)aromatic electrophiles, and determining their corresponding relative SNAr reaction rates through a series of competition experiments, we rapidly assembled a reliable and diverse data set as an experimental foundation. Pairing this set of reactivity data with simple ground state molecular descriptors – electron affinity and molecular electrostatic potentials – results in a robust multivariate linear correlation between relative rate and the molecular structure of the electrophile.Importantly, even though the model was trained using only one set of reaction conditions with a single nucleophile, it is suitable for making correlations and predictions about SNAr reactivity for a wide variety of nucleophiles, solvents, and temperatures. These include a >90% success rate in predicting the major reaction site for multihalogenated arenes (>80 cases), and examples where substrate design for active pharmaceutical ingredient synthesis can be informed by predicted reactivity. Thus, this simple and easy-to-apply model can generate rapid and accurate predictions for complex molecule targets. There are still specific limitations to be addressed, including the inability of the model to properly predict selectivity outcomes for non-halogenated leaving groups (e.g. –NO2 or –OMe) and for bulky nucleophiles (as shown in Fig. 11). Further work to build additional targeted models for these effects in SNAr chemistry, as well as for additional commonly-used organic reaction classes is currently underway in our laboratories.
Data availability
Additional data files are available as part of the ESI,† including machine readable tables of descriptors (xlsx format) and coordinate files for calculated structures (xyz format).Author contributions
J. Lu: conceptualization, methodology, investigation, validation, formal analysis, writing. I. Paci: conceptualization, methodology, formal analysis, supervision, writing. D. C. Leitch: conceptualization, methodology, formal analysis, supervision, writing.Conflicts of interest
There are no conflicts to declare.Acknowledgements
We acknowledge and respect the Lekwungen peoples on whose traditional territory the University of Victoria (UVic) stands, and the Songhees, Esquimalt and WSÁNEĆ peoples whose historical relationships with the land continue to this day. We also acknowledge funding from the New Frontiers in Research Fund – Exploration (DCL) and NSERC Discovery Grant program (IP and DCL). Supercomputing resources at Westgrid and Compute Canada were integral to this work.Notes and references
- R. C. Larock, Comprehensive Organic Transformations: A Guide to Functional Group Preparations; Wiley, 2018 Search PubMed.
- E. J. Corey and X.-M. Cheng, The Logic of Chemical Synthesis, John Wiley & Sons, Nashville, TN, 1995 Search PubMed.
- The Art of Writing Reasonable Organic Reaction Mechanisms, ed., R. B. Grossman, Springer: New York, NY, 2003 Search PubMed.
- H. Mayr and M. Patz, Angew. Chem., Int. Ed. Engl., 1994, 33, 938–957 CrossRef.
- H. Mayr, B. Kempf and A. R. Ofial, Acc. Chem. Res., 2003, 36, 66–77 CrossRef CAS PubMed.
- H. Mayr and A. R. Ofial, Pure Appl. Chem., 2005, 77, 1807–1821 CrossRef CAS.
- H. Mayr and A. R. Ofial, J. Phys. Org. Chem., 2008, 21, 584–595 CrossRef CAS.
- H. Mayr and A. R. Ofial, Acc. Chem. Res., 2016, 49, 952–965 CrossRef CAS PubMed.
- H. Mayr and A. R. Ofial, Pure Appl. Chem., 2017, 89, 729–744 CrossRef CAS.
- M. S. Sigman, K. C. Harper, E. N. Bess and A. Milo, Acc. Chem. Res., 2016, 49, 1292–1301 CrossRef CAS PubMed.
- Z. L. Niemeyer, A. Milo, D. P. Hickey and M. S. Sigman, Nat. Chem., 2016, 8, 610–617 CrossRef CAS PubMed.
- K. Wu and A. G. Doyle, Nat. Chem., 2017, 9, 779–784 CrossRef CAS PubMed.
- D. T. Ahneman, J. G. Estrada, S. Lin, S. D. Dreher and A. G. Doyle, Science, 2018, 360, 186–190 CrossRef CAS PubMed.
- B. Maryasin, P. Marquetand and N. Maulide, Angew. Chem., Int. Ed., 2018, 57, 6978–6980 CrossRef CAS PubMed.
- O. Engkvist, P.-O. Norrby, N. Selmi, Y. Lam, Z. Peng, E. C. Sherer, W. Amberg, T. Erhard and L. A. Smyth, Drug Discov. Today, 2018, 23, 1203–1218 CrossRef CAS PubMed.
- A. F. Zahrt, J. J. Henle, B. T. Rose, Y. Wang, W. T. Darrow and S. E. Denmark, Science, 2019, 363, eaau5631 CrossRef CAS PubMed.
- T. Toyao, Z. Maeno, S. Takakusagi, T. Kamachi, I. Takigawa and K. Shimizu, ACS Catal., 2020, 10, 2260–2297 CrossRef CAS.
- E. N. Muratov, J. Bajorath, R. P. Sheridan, I. V. Tetko, D. Filimonov, V. Poroikov, T. I. Oprea, I. I. Baskin, A. Varnek, A. Roitberg, O. Isayev, S. Curtalolo, D. Fourches, Y. Cohen, A. Aspuru-Guzik, D. A. Winkler, D. Agrafiotis, A. Cherkasov and A. Tropsha, Chem. Soc. Rev., 2020, 49, 3525–3564 RSC.
- B. Mahjour, Y. Shen and T. Cernak, Acc. Chem. Res., 2021, 54, 2337–2346 CrossRef CAS PubMed.
- L. C. Gallegos, G. Luchini, P. C. St. John, S. Kim and R. S. Paton, Acc. Chem. Res., 2021, 54, 827–836 CrossRef CAS PubMed.
- K. Jorner, T. Brinck, P.-O. Norrby and D. Buttar, Chem. Sci., 2021, 12, 1163–1175 RSC.
- M. Orlandi, M. Escudero-Casao and G. Licini, J. Org. Chem., 2021, 86, 3555–3564 CrossRef CAS PubMed.
- Y. Shen, J. E. Borowski, M. A. Hardy, R. Sarpong, A. G. Doyle and T. Cernak, Nat. Rev. Methods Primers, 2021, 1, 23 CrossRef CAS.
- I. O. Betinol and J. P. Reid, Org. Biomol. Chem., 2022, 20, 6012–6018 RSC.
- W. Beker, R. Roszak, A. Wołos, N. H. Angello, V. Rathore, M. D. Burke and B. A. Grzybowski, J. Am. Chem. Soc., 2022, 144, 4819–4827 CrossRef CAS PubMed.
- J. Meisenheimer, Justus Liebigs Ann. Chem., 1902, 323, 205–246 CrossRef CAS.
- J. F. Bunnett and R. E. Zahler, Chem. Rev., 1951, 49, 273–412 CrossRef CAS.
- The SNAr Reactions: Mechanistic Aspects. in Modern Nucleophilic Aromatic Substitution; Wiley-VCH Verlag: Weinheim, Germany, 2013; pp pp 1–94 Search PubMed.
- S. Rohrbach, A. J. Smith, J. H. Pang, D. L. Poole, T. Tuttle, S. Chiba and J. A. Murphy, Angew. Chem., Int. Ed., 2019, 58, 16368–16388 CrossRef CAS PubMed.
- D. A. Evans, M. R. Wood, B. W. Trotter, T. I. Richardson, J. C. Barrow and J. L. Katz, Angew. Chem., Int. Ed., 1998, 37, 2700–2704 CrossRef CAS PubMed.
- D. A. Evans, C. J. Dinsmore, P. S. Watson, M. R. Wood, T. I. Richardson, B. W. Trotter and J. L. Katz, Angew. Chem., Int. Ed., 1998, 37, 2704–2708 CrossRef CAS PubMed.
- K. C. Nicolaou, S. Natarajan, H. Li, N. F. Jain, R. Hughes, M. E. Solomon, J. M. Ramanjulu, C. N. C. Boddy and M. Takayanagi, Angew. Chem., Int. Ed., 1998, 37, 2708–2714 CrossRef CAS PubMed.
- K. C. Nicolaou, N. F. Jain, S. Natarajan, R. Hughes, M. E. Solomon, H. Li, J. M. Ramanjulu, M. Takayanagi, A. E. Koumbis and T. Bando, Angew. Chem., Int. Ed., 1998, 37, 2714–2716 CrossRef CAS PubMed.
- K. C. Nicolaou, M. Takayanagi, N. F. Jain, S. Natarajan, A. E. Koumbis, T. Bando and J. M. Ramanjulu, Angew. Chem., Int. Ed., 1998, 37, 2717–2719 CrossRef CAS PubMed.
- A. J. Zhang and K. Burgess, Angew. Chem., Int. Ed., 1999, 38, 634–636 CrossRef CAS PubMed.
- L.-J. Cheng, J.-H. Xie, Y. Chen, L.-X. Wang and Q.-L. Zhou, Org. Lett., 2013, 15, 764–767 CrossRef CAS PubMed.
- K. Yamashita, Y. Kume, S. Ashibe, C. A. D. Puspita, K. Tanigawa, N. Michihata, S. Wakamori, K. Ikeuchi and H. Yamada, Chem.– Eur. J., 2020, 26, 16408–16421 CrossRef CAS PubMed.
- J. T. Bork, J. W. Lee and Y.-T. Chang, QSAR Comb. Sci., 2004, 23, 245–260 CrossRef CAS.
- D. G. Brown and J. Boström, J. Med. Chem., 2016, 59, 4443–4458 CrossRef CAS PubMed.
- S. Preshlock, M. Tredwell and V. Gouverneur, Chem. Rev., 2016, 116, 719–766 CrossRef CAS PubMed.
- C. N. Neumann and T. Ritter, Acc. Chem. Res., 2017, 50, 2822–2833 CrossRef CAS PubMed.
- J. Boström, D. G. Brown, R. J. Young and G. M. Keserü, Nat. Rev. Drug Discovery, 2018, 17, 709–727 CrossRef PubMed.
- Y. Y. See, M. T. Morales-Colón, D. C. Bland and M. S. Sanford, Acc. Chem. Res., 2020, 53, 2372–2383 CrossRef CAS PubMed.
- M. Baumann and I. R. Baxendale, Beilstein J. Org. Chem., 2013, 9, 2265–2319 CrossRef PubMed.
- A. C. Flick, C. A. Leverett, H. X. Ding, E. McInturff, S. J. Fink, C. J. Helal, J. C. DeForest, P. D. Morse, S. Mahapatra and C. J. O'Donnell, J. Med. Chem., 2020, 63, 10652–10704 CrossRef CAS PubMed.
- A. C. Flick, C. A. Leverett, H. X. Ding, E. McInturff, S. J. Fink, S. Mahapatra, D. W. Carney, E. A. Lindsey, J. C. DeForest, S. P. France, S. Berritt, S. V. Bigi-Botterill, T. S. Gibson, Y. Liu and C. J. O'Donnell, J. Med. Chem., 2021, 64, 3604–3657 CrossRef CAS PubMed.
- S. Jeanmart, A. J. F. Edmunds, C. Lamberth and M. Pouliot, Bioorg. Med. Chem., 2016, 24, 317–341 CrossRef CAS PubMed.
- S. Jeanmart, A. J. F. Edmunds, C. Lamberth, M. Pouliot and J. A. Morris, Bioorg. Med. Chem., 2021, 39, 116162 CrossRef CAS PubMed.
- E. Vitaku, D. T. Smith and J. T. Njardarson, J. Med. Chem., 2014, 57, 10257–10274 CrossRef CAS PubMed.
- M. D. Delost, D. T. Smith, B. J. Anderson and J. T. Njardarson, J. Med. Chem., 2018, 61, 10996–11020 CrossRef CAS PubMed.
- P. Das, M. D. Delost, M. H. Qureshi, D. T. Smith and J. T. Njardarson, J. Med. Chem., 2019, 62, 4265–4311 CrossRef CAS PubMed.
- F. Terrier, Chem. Rev., 1982, 82, 77–152 CAS.
- C. N. Neumann, J. M. Hooker and T. Ritter, Nature, 2016, 534, 369–373 CrossRef CAS PubMed.
- E. E. Kwan, Y. Zeng, H. A. Besser and E. N. Jacobsen, Nat. Chem., 2018, 10, 917–923 CrossRef CAS PubMed.
- C. Hansch, A. Leo and R. W. Taft, Chem. Rev., 1991, 91, 165–195 CrossRef CAS.
- J. Miller and W. Kai-Yan, J. Chem. Soc., 1963, 3492–3495 RSC.
- S. E. Fry and N. J. Pienta, J. Am. Chem. Soc., 1985, 107, 6399–6400 CrossRef CAS.
- A. H. M. Renfrew, J. A. Taylor, J. M. J. Whitmore and A. Williams, J. Chem. Soc., Perkin trans. 2, 1993, 1703–1704 RSC.
- A. Hunter, M. Renfrew, D. Rettura, J. A. Taylor, J. M. J. Whitmore and A. Williams, J. Am. Chem. Soc., 1995, 117, 5484–5491 CAS.
- I.-H. Um, L.-R. Im, J.-S. Kang, S. S. Bursey and J. M. Dust, J. Org. Chem., 2012, 77, 9738–9746 CrossRef CAS PubMed.
- N. ElGuesmi, G. Berionni and B. H. Asghar, J. Fluorine Chem., 2014, 160, 41–47 CrossRef CAS.
- F. Mahdhaoui, R. Zaier, N. Dhahri, S. Ayachi and T. Boubaker, Int. J. Chem. Kinet., 2019, 51, 249–257 Search PubMed.
- J. Burdon, Tetrahedron, 1965, 21, 3373–3380 CAS.
- J. Burdon and I. W. Parsons, J. Am. Chem. Soc., 1977, 99, 7445–7447 CAS.
- N. D. Epiotis and W. Cherry, J. Am. Chem. Soc., 1976, 98, 5432–5435 CAS.
- S. Scales, S. Johnson, Q. Hu, Q.-Q. Do, P. Richardson, F. Wang, J. Braganza, S. Ren, Y. Wan, B. Zheng, D. Faizi and I. McAlpine, Org. Lett., 2013, 15, 2156–2159 CAS.
- M. Muir and J. Baker, J. Fluorine Chem., 2005, 126, 727–738 CAS.
- J. Baker and M. Muir, Can. J. Chem., 2010, 88, 588–597 CAS.
- M. Liljenberg, T. Brinck, B. Herschend, T. Rein, G. Rockwell and M. Svensson, Tetrahedron Lett., 2011, 52, 3150–3153 CAS.
- M. Liljenberg, T. Brinck, B. Herschend, T. Rein, S. Tomasi and M. Svensson, J. Org. Chem., 2012, 77, 3262–3269 CAS.
- M. Liljenberg, T. Brinck, T. Rein and M. Svensson, Beilstein J. Org. Chem., 2013, 9, 791–799 CAS.
- J. A. Hirsch, Table of Conformational Energies—1967. in Topics in Stereochemistry, John Wiley & Sons: Nashville, TN, 1967, Vol. 1, pp 199–222 Search PubMed.
- H. Clavier and S. P. Nolan, Chem. Commun., 2010, 46, 841–861 CAS.
- T. Brinck, P. Carlqvist and J. H. Stenlid, J. Phys. Chem. A, 2016, 120, 10023–10032 CAS.
- J. H. Stenlid and T. Brinck, J. Org. Chem., 2017, 82, 3072–3083 CAS.
- R. J. Mullins, A. Vedernikov and R. Viswanathan, J. Chem. Educ., 2004, 81, 1357 CAS.
- K. W. Fiori and J. Du Bois, J. Am. Chem. Soc., 2007, 129, 562–568 CAS.
- J. B. C. Mack, T. A. Bedell, R. J. DeLuca, G. A. B. Hone, J. L. Roizen, C. T. Cox, E. J. Sorensen and J. Du Bois, J. Chem. Educ., 2018, 95, 2243–2248 CAS.
- H. M. Yau, A. K. Croft and J. B. Harper, Chem. Commun., 2012, 48, 8937–8939 CAS.
- H. M. Yau, R. S. Haines and J. B. Harper, J. Chem. Educ., 2015, 92, 538–542 CAS.
- N. W. Fenwick, R. Telford, A. Saidykhan, W. H. C. Martin and R. D. Bowen, Molecules, 2021, 26, 5077 CAS.
- G. Bartoli and P. E. Todesco, Acc. Chem. Res., 1977, 10, 125–132 CAS.
- J. Lu, S. Donnecke, I. Paci and D. C. Leitch, Chem. Sci., 2022, 13, 3477–3488 CAS.
- P. Geerlings, F. De Proft and W. Langenaeker, Chem. Rev., 2003, 103, 1793–1874 CAS.
- C. H. Suresh, P. Alexander, K. P. Vijayalakshmi, P. K. Sajith and S. R. Gadre, Phys. Chem. Chem. Phys., 2008, 10, 6492–6499 CAS.
- F. B. Sayyed and C. H. Suresh, New J. Chem., 2009, 33, 2465–2471 CAS.
- G. S. Remya and C. H. Suresh, Phys. Chem. Chem. Phys., 2016, 18, 20615–20626 CAS.
- S. R. Gadre, C. H. Suresh and N. Mohan, Molecules, 2021, 26, 3289 CAS.
- V. Consonni, D. Ballabio and R. Todeschini, J. Chem. Inf. Model., 2009, 49, 1669–1678 CAS.
- K. Fukui, T. Yonezawa, C. Nagata and H. Shingu, J. Chem. Phys., 1954, 22, 1433–1442 CAS.
- K. N. Houk, Acc. Chem. Res., 1975, 8, 361–369 CAS.
- D. S. Allgäuer, H. Jangra, H. Asahara, Z. Li, Q. Chen, H. Zipse, A. R. Ofial and H. Mayr, J. Am. Chem. Soc., 2017, 139, 13318–13329 Search PubMed.
- T. Koopmans, Physica, 1934, 1, 104–113 Search PubMed.
- J. P. Perdew, R. G. Parr, M. Levy and J. L. Balduz, Phys. Rev. Lett., 1982, 49, 1691–1694 CAS.
- Entos Envision, https://www.entos.ai/envision (accessed 2022-07-07) Search PubMed.
- S. Grimme, C. Bannwarth and P. Shushkov, J. Chem. Theory Comput., 2017, 13, 1989–2009 CAS.
- B. U. W. Maes, S. Verbeeck, T. Verhelst, A. Ekomié, N. von Wolff, G. Lefèvre, E. A. Mitchell and A. Jutand, Chem.– Eur. J., 2015, 21, 7858–7865 CAS.
- T. Lu and F. Chen, J. Comput. Chem., 2012, 33, 580–592 CAS.
- T. Lu and F. Chen, J. Mol. Graph. Model., 2012, 38, 314–323 CAS.
- B. Wang, C. Rong, P. K. Chattaraj and S. Liu, Theor. Chem. Acc., 2019, 138, 124 Search PubMed.
- R. K. Roy and S. Saha, Annu. Rep. Sect. C Phys. Chem., 2010, 106, 118–162 Search PubMed.
- S. Rohrbach, J. A. Murphy and T. Tuttle, J. Am. Chem. Soc., 2020, 142, 14871–14876 CAS.
- J. Miller and A. J. Parker, Aust. J. Chem., 1958, 11, 302–308 CAS.
- E. Berliner and L. C. Monack, J. Am. Chem. Soc., 1952, 74, 1574–1579 CAS.
- M. R. Crampton, T. A. Emokpae and C. Isanbor, Eur. J. Org. Chem., 2007, 2007, 1378–1383 Search PubMed.
- R. D. Chambers, P. A. Martin, G. Sandford and D. L. H. Williams, J. Fluorine Chem., 2008, 129, 998–1002 CAS.
- R. Bolton and J. P. B. Sandall, J. Chem. Soc., Perkin trans. 2, 1976, 1541–1545 CAS.
- R. D. Chambers, D. Close, W. K. R. Musgrave, J. S. Waterhouse and D. L. H. Williams, J. Chem. Soc., Perkin trans. 2, 1977, 1774–1778 CAS.
- R. D. Chambers, P. A. Martin, J. S. Waterhouse, D. L. H. Williams and B. Anderson, J. Fluorine Chem., 1982, 20, 507–514 CAS.
- R. D. Chambers, W. K. R. Musgrave and P. G. Urben, J. Chem. Soc., Perkin trans. 1, 1974, 2580–2584 CAS.
- R. E. Banks, A. Prakash and N. D. Venayak, J. Fluorine Chem., 1980, 16, 325–338 CAS.
- R. D. Chambers, M. J. Seabury, D. L. H. Williams and N. Hughes, J. Chem. Soc., Perkin trans. 1, 1988, 251–254 CAS.
- R. D. Chambers, M. J. Seabury, D. L. H. Williams and N. Hughes, J. Chem. Soc., Perkin trans. 1, 1988, 255–257 Search PubMed.
- J. F. W. Keana and S. X. Cai, J. Org. Chem., 1990, 55, 3640–3647 CAS.
- R. Dirr, C. Anthaume and L. Désaubry, Tetrahedron Lett., 2008, 49, 4588–4590 CAS.
- G. M. Brooke, R. D. Chambers, C. J. Drury and M. J. Bower, J. Chem. Soc., Perkin trans. 1, 1993, 2201–2209 CAS.
- K. Tanaka, M. Deguchi and S. Iwata, J. Chem. Res. Synop., 1999, 528–529 CAS.
- G. Schroeder, K. Eitner, B. Gierczyk, B. Rózalski and B. Brzezinski, J. Mol. Struct., 1999, 478, 243–253 CAS.
- T. J. Delia, D. P. Anderson and J. M. Schomaker, J. Heterocycl. Chem., 2004, 41, 991–993 CAS.
- M. L. Belli, G. Illuminati and G. Marino, Tetrahedron, 1963, 19, 345–355 CAS.
- M. Yukawa, T. Niiya, Y. Goto, T. Sakamoto, H. Yoshizawa, A. Watanabe and H. Yamanaka, Chem. Pharm. Bull., 1989, 37, 2892–2896 CAS.
- W. T. Flowers, R. N. Haszeldine and S. A. Majid, Tetrahedron Lett., 1967, 8, 2503–2505 Search PubMed.
- I. Collins and H. Suschitzky, J. Chem. Soc. C, 1969, 2337–2341 CAS.
- K. A. Volkov, G. V. Avramenko, V. M. Negrimovskii and E. A. Luk’yanets, Russ. J. Gen. Chem., 2007, 77, 1108–1116 CAS.
- Z. Xinzhuo and T. Ibata, Chin. J. Org. Chem., 2002, 22, 778 Search PubMed.
- A. Carta, M. Palomba and P. Corona, Heterocycles, 2006, 68, 1715 CAS.
- I. Collins and H. Suschitzky, J. Chem. Soc. C, 1970, 1523–1530 CAS.
- H. Mizuno and A. Manabe, Pyrimidine Compounds and Pests Controlling Composition Containing the Same. WO2004099160A1, 2004 Search PubMed.
- J. M. Allen, R. J. Butlin, C. Green, W. Mccoull, G. R. Robb and J. M. Wood, Benzothiazoles as Ghrelin Receptor Modulators. WO2009047558A1, 2009 Search PubMed.
- D. Zhou, G. P. Stack, J. Lo, A. A. Failli, D. A. Evrard, B. L. Harrison, N. T. Hatzenbuhler, M. Tran, S. Croce, S. Yi, J. Golembieski, G. A. Hornby, M. Lai, Q. Lin, L. E. Schechter, D. L. Smith, A. D. Shilling, C. Huselton, P. Mitchell, C. E. Beyer and T. H. Andree, J. Med. Chem., 2009, 52, 4955–4959 CAS.
- O. Weber, V. Voehringer, H.-G. Lerchen, F.-T. Hafner, J. Keldenich, K.-H. Schlemmer, U. Krenz and B. Riedl, Benzofuran and Benzothiophene Derivatives Useful in the Treatment of Cancers of the Central Nervous System. WO2008025509A1, 2008 Search PubMed.
- N. Ahmad, D. Boyall, J.-D. Charrier, C. Davis, R. Davis, S. Durrant, G. E. I. Jardi, D. Fraysse, J.-M. Jimenez, D. Kay, R. Knegtel, D. Middleton, M. O'Donnell, M. Panesar, F. Pierard, J. Pinder, D. Shaw, P.-H. Storck, J. Studley and H. Twin, Compounds Useful as Inhibitors of Atr Kinase. WO2014089379A1, 2014 Search PubMed.
- R. Al-Awar, M. Isaac, A. M. Chau, A. Mamai, I. Watson, G. Poda, P. Subramanian, B. Wilson, D. Uehling, M. Prakesch, B. Joseph and J.-A. Morin, Inhibitors of the Bcl6 Btb Domain Protein-Protein Interaction and Uses Thereof. WO2019153080A1, 2019 Search PubMed.
- J. M. Stevens, E. M. Simmons, Y. Tan, A. Borovika, J. Fan, R. V. Forest, P. Geng, C. A. Guerrero, S. Lou, D. Skliar, S. E. Steinhardt and N. A. Strotman, Org. Process Res. Dev., 2022, 26, 1174–1183 CAS.
- Y. Tao, N. F. Keene, K. E. Wiglesworth, B. Sitter and J. C. McWilliams, Org. Process Res. Dev., 2019, 23, 382–388 CAS.
- A. Stumpf, Z. K. Cheng, D. Beaudry, R. Angelaud and F. Gosselin, Org. Process Res. Dev., 2019, 23, 1829–1840 CAS.
- U. Bremberg, J. Eriksson-Bajtner, F. Lehmann, V. Oltner, E. Sölver and J. Wennerberg, Org. Process Res. Dev., 2018, 22, 1360–1364 CAS.
- Y. Tao, D. W. Widlicka, P. D. Hill, M. Couturier and G. R. Young, Org. Process Res. Dev., 2012, 16, 1805–1810 CAS.
- G. A. Barcan, J. J. Conde, M. K. Mokhallalati, M. G. Nilson, S. Xie, C. L. Allen, Y. W. Andemichael, N. A. Calandra, D. C. Leitch, L. Li and M. J. Morris, Org. Process Res. Dev., 2019, 23, 1396–1406 CAS.
- Y. Lu, K. P. Cole, J. W. Fennell, T. D. Maloney, D. Mitchell, R. Subbiah and B. Ramadas, Org. Process Res. Dev., 2018, 22, 409–419 CAS.
Footnote |
| † Electronic supplementary information (ESI) available: detailed experimental and computational procedures, statistical modeling information, supplementary figures, tables of molecular descriptors, and coordinate files for calculated structures. See DOI: https://doi.org/10.1039/d2sc04041g |
| This journal is © The Royal Society of Chemistry 2022 |

