
The effects of polyolefin structure and source on pyrolysis-derived plastic oil composition†
Jiayang
Wu
 a,
Zhen
Jiang
a,
Victor S.
Cecon
b,
Greg
Curtzwiler
b,
Keith
Vorst
b,
Manos
Mavrikakis
a and
George W.
Huber
*a
a,
Zhen
Jiang
a,
Victor S.
Cecon
b,
Greg
Curtzwiler
b,
Keith
Vorst
b,
Manos
Mavrikakis
a and
George W.
Huber
*a
aDepartment of Chemical and Biological Engineering, University of Wisconsin-Madison; Madison, WI 53706, USA. E-mail: gwhuber@wisc.edu
bPolymer and Food Protection Consortium, Department of Food Science and Human Nutrition, Iowa State University, Ames, IA 50011, USA
First published on 30th October 2024
Abstract
Seven types of plastics were pyrolyzed in a fluidized bed reactor: post-consumer recycled (PCR) high-density polyethylene (HDPE), PCR polypropylene (PP), HDPE virgin resins with two different molecular weights, virgin resins of low-density polyethylene (LDPE), linear low-density polyethylene (LLDPE), and PP. Pyrolysis produced non-condensable gases (C1–C3), liquid phase products (C4–C40), and solids (C40+ and chars), with alkane, alkene, alkadiene, aromatic, and multi-cycloaromatics as the predominant compounds. The polymer structure had the greatest impact on product distribution, with minimal influence from molecular weight. Branches in polyethylene (PE) acted as thermal defects initiating degradation. Higher branch density in PE led to increased concentrations of aromatics, branched alkanes, and internal alkenes. PP and PE exhibited distinct degradation mechanisms, with PP requiring less energy for decomposition and yielding more oil. Pyrolysis oil from PCR HDPE and PCR PP contained a higher proportion of branched compounds. Additives in PCR plastics may promote isomerization during pyrolysis.
1. Introduction
Nearly 4 billion tons of plastic waste were produced globally in 2022.1 Plastic production is increasing at an annual rate of 3.3%, signifying a continual rise in plastic waste quantities.2 The amount of accumulated discarded plastic could reach 12 billion tons by the end of 2050 if advanced recycling technologies are not rapidly developed and deployed.2 In 2016, plastic waste products occupied 20 wt% of the total waste going into landfills.3 In the United States (U.S.), polyolefins (polyethylene and polypropylene) represented 65 wt% of the total plastic waste in 2018, with a recycling rate of less than 3 wt%.3 A wide variety of polyolefins are used in industry that are typically classified into four different classes: high-density polyethylene (HDPE), polypropylene (PP), low-density polyethylene (LDPE), and linear low-density polyethylene (LLDPE).4,5 Over a dozen different grades of these four different classes exist, which have different molecular weight distributions, additives and colorants. The wide variety of polyolefins makes mechanical recycling of polyolefins very difficult as it involves a lot of sorting and cleaning.6Plastic pyrolysis thermally decomposes polyolefins in an oxygen-free environment to small molecules. These small molecules can be upgraded back into virgin plastics or other valuable materials. By 2030, the plastic pyrolysis market is projected to reach $25.4 billion.7 There are three potential methods to upgrade plastic pyrolysis oils including: (1) blending with naphtha for olefin production in steam crackers,8 (2) utilizing zeolites to produce short-chain olefins and aromatics,9 and (3) hydroformylating pyrolysis oils to yield aldehydes, alcohols, carboxylic acids, and amines.10,11 Steam crackers and zeolite upgrading require low levels of alkenes in the feed because of coke formation. Alkene and alkadienes are desirable in hydroformylation of pyrolysis oils to produce more valuable aldehydes and dialdehydes.10 A more detailed understanding of the chemistry of polyolefin pyrolysis processes and their product distributions could provide special insights for how to apply pyrolysis for upcycling of polyolefins.
Numerous studies on polyolefin pyrolysis have been reported in the academic literature. Kusenberg et al. reported a detailed study comparing the pyrolysis of real waste polyethylene (PE) film and polypropylene (PP) mixture through a continuous stirred tank reactor (CSTR). The products were characterized using a two-dimensional gas chromatography (GC × GC) system, indicating that the PP-derived oil has a higher concentration of branched olefins and diolefins than the PE-derived oil.12 Abbas-Abadi et al. studied virgin LDPE, virgin and waste PP, along with LDPE-rich polyolefin waste under pyrolysis conditions of 430–490 °C and pressures between 0.1 and 2 bar using a CSTR. The products were analyzed by GC × GC, demonstrating that increased pressure and temperature resulted in a higher yield of lighter products, alkenes and conjugated alkadienes.13 These studies feature very thorough analysis of pyrolysis oil compositions along with potential impurities.
Perez et al. investigated the degradation of virgin PP pyrolysis at three temperatures (460 °C, 530 °C, and 600 °C), three particles size ranges (53–125, 125–300, and >300 µm), and three residence times (16, 24, and 48 ms) using a Frontier pyrolyzer, with product quantification achieved through GC × GC, and found that there was no statistical difference between the products obtained under these different conditions.14 Krishna et al. used the same reaction conditions and analytical tools to study virgin PE pyrolysis, reporting increased yields of cyclodiolefins, cycloolefins, and aromatics at 600 °C.15 Zhang et al., also using a Frontier pyrolyzer, reported that the apparent activation energy for pyrolysis increased in the order of simulated plastic waste mixture (a mixture of virgin resins) < PP < PE.16 The Frontier reactor generally requires a very small sample amount (from microns to milligrams) and demands highly homogeneous samples. This requirement made it challenging to study actual waste materials. Also, the simulated plastic waste mixture cannot fully represent actual plastic waste due to the presence of additives and contaminants such as pigments, paper, or aluminum films. Therefore, the results obtained from a Frontier pyrolyzer cannot fully represent what happens during industrial pyrolysis processes.
These studies illustrate that the products from plastic pyrolysis are complicated with more than 500 individual products. Plastic pyrolysis produces a broad range of molecular weights from light gases (methane) to heavy waxes (∼C70). The products include linear alkanes, iso-alkanes, linear alkenes, iso-alkenes, cyclic alkenes, linear alkadienes, conjugated alkadienes, iso-alkadienes, cyclic alkadienes, aromatics, and polycyclic aromatic hydrocarbons (PAHs).8,13–15,17 Most of the previous studies were performed with virgin polyolefins while impurities in post-consumer recycling (PCR) polyolefins could influence the reaction chemistry. More research is needed to better understand the complex chemistry that occurs during the pyrolysis of PCR polyolefins.
The objective of this paper is to provide a more detailed understanding of PCR polyolefin plastic pyrolysis chemistry using different PCR and virgin polyolefin feedstocks combined with modern analytical methods and density functional theory (DFT) calculations. This paper examines polyolefin pyrolysis using a continuous fluidized bed reactor, comparing three key factors: (1) the branching structure of polyolefins, (2) the molecular weights of polymers, and (3) the source of plastics (PCR vs. virgin grades). A detailed understanding of pyrolysis oil was achieved using GC × GC, with alkene structures further identified through nuclear magnetic resonance (NMR). DFT calculations are combined with the experimental results to provide a mechanistically based understanding of polyolefin degradation pathways. Seven types of polyolefins were tested: post-consumer recycled (PCR) HDPE, PCR PP, virgin HDPE with two different molecular weights, virgin LDPE, LLDPE, and PP. The feedstocks were characterized for their structural properties and impurities. Structural and branch density analyses of all plastics were conducted using NMR, attenuated total reflectance Fourier transform infrared (ATR-FTIR) spectroscopy, and gel permeation chromatography (GPC). The pyrolysis products were evaluated using GC×GC with duo detectors of flame ionization detector (FID), and mass spectroscopy (MS), as well as NMR, and inductively coupled plasma (ICP) spectroscopy.
The results indicate that the branching structure of polyolefins plays a significant role in the distribution of gas, liquid, and solid products, as well as in the oil composition and alkene structures, while molecular weights and impurities have the least impact on these factors. This is because a higher branch density in PE leads to decreased alkene yields and increased yields of alkanes and aromatics, with more internal alkene structures reducing the likelihood of random scission reactions. PE and PP tend to degrade from the carbon backchain, whereas LDPE and LLPDE tend to cleave from branch structures.
2. Experiments
2.1 Materials
Seven types of plastic were used in this study: post-consumer recycled (PCR) high-density polyethylene (HDPE) and PCR polypropylene (PP) flakes, which were collected by Iowa State University (ISU); and HDPE virgin resins with two different molecular weights (the one with high molecular weight is referred to as HDPE HMW and the one with low molecular weight is referred to as HDPE LMW); low-density polyethylene (LDPE) virgin resins; linear low-density polyethylene (LLDPE) virgin resins; and PP virgin resins, which were received from Amcor. All plastics were shredded to approximately 3 mm particle size. Fig. S1† shows the PCR plastics fed into a fluidized bed reactor. All other chemicals used for GC calibrations and NMR were obtained from Sigma-Aldrich. Detailed information can be found in the ESI Materials section.†Table 1 lists the manufacturers and molecular weights of virgin polymers.| Manufacturer | M W | M N | Gas | Liquid | Solid | Heavy oil | Light oil | Mass Balance | |
|---|---|---|---|---|---|---|---|---|---|
| The PCR HDPE pyrolysis was repeated 5 times. | |||||||||
| HDPE HMW | Nova Surpass HPs167-AS | 162![[thin space (1/6-em)]](https://www.rsc.org/images/entities/char_2009.gif) 920 920 |
27292 |
24.9% | 72.5% | 0.9% | 22.1% (31.5%) | 50.4% (68.5%) | 98.3% |
| HDPE LMW | ExxonMobil Paxon AL55-003 | 93178 |
41937 |
24.4% | 70.9% | 1.7% | 18.4% (30.0%) | 52.5% (70.0%) | 97.0% |
| PCR HDPE | MRF collected PCR (ISU) | 73963 |
36130 |
22.4 ± 1.2% | 69.8 ± 2.2% | 3.3 ± 0.8% | 20.5% (29.4%) | 49.3% (70.6%) | 95.5% |
| LDPE | LyondellBasell Petrothene NA216000 | 95064 |
26775 |
26.3% | 68.3% | 1.1% | 9.3% (13.6%) | 58.9% (86.4%) | 95.7% |
| LLDPE | Exact 3040 Cast ExxonMobil | 57369 |
41937 |
30.5% | 61.9% | 5.8% | 5.6% (9.1%) | 56.3% (90.9%) | 98.2% |
| PP | D218 Braskem | 334060 |
138850 |
18.8% | 74.1% | 1.6% | 6.4% (8.7%) | 67.6% (91.3%) | 94.5% |
| PCR PP | MRF collected PCR (ISU) | 188325 |
99299 |
20.7% | 76.2% | 0.4% | 16.2% (21.3%) | 60.0% (78.7%) | 97.3% |
2.2 Pyrolysis and distillation
The plastic was fed into a customized fluidized bed reactor and pyrolyzed at 500 °C with a residence time of 20 seconds and a plastic feeding rate of 2 g min−1. We chose these reaction conditions because they provided the highest oil yield without producing excess heavy oil, which favors potential upgrading methods. The pyrolysis reactor was operated for one hour. Pyrolysis oils were collected in 10 condensers arranged in series (4 condensers in an ice bath and 6 condensers in a dry ice bath), and the non-condensable gas was collected in gas bags every 10 minutes. The overall gas flow was measured using a 100 ml soap film flowmeter. After each pyrolysis run, the sand was removed, and approximately 60 g of sand was calcined in a muffle furnace at 600 °C for at least 3 hours to ensure that all char was burnt out. The mass of the char was determined by the mass difference of the sand before and after calcination. The remaining sand was returned to the fluidized bed reactor and calcined in the reactor at 600 °C for 5 hours with an airflow. The collected pyrolysis oils were distilled into two fractions: light oil (C4–C10) and heavy oil (C10+) to simplify oil characterization. Detailed descriptions of the fluidized bed reactor and distillation process are provided in ESI section 2.†10,172.3 Plastic and plastic oil characterization
The plastics were characterized by ATR-FTIR (Bruker Vertex 70) and high-temperature quantitative NMR (Bruker Avance-500 with a BBFO probe) before pyrolysis to check the purity of the polymers used, as well as the branch density of the polymers. These plastics were also analyzed with high-temperature GPC (Malvern Viscotek 350 HT-GPC) to obtain molecular weight data. TGA (TA Instruments Q5000IR thermogravimetric analyzer) was used to obtain the thermal degradation patterns of the polyolefins and compare them with the pyrolysis results. The pyrolyzed plastic oils (undistilled oil, light oil, and heavy oil) were characterized by GC × GC-FID (Agilent 7890B) and NMR (Bruker Avance-500 with a DCH cryoprobe). The gas samples collected in gas bags were characterized using a refinery gas analyzer (RGA) with both FID and TCD detectors (Shimadzu GC-2014). Both the plastics and their corresponding oils were digested using a microwave digestion system (Milestone UltraWave) and characterized by ICP-OES (Thermo Scientific iCap-7400 Duo) to obtain information on trace elements (impurities). Detailed information is provided in ESI sections 3.1–3.6.†2.4 DFT mechanistic studies of polyolefin degradation
All calculations were performed using the Gaussian 09 software package.18 High-density polyethylene (HDPE) was modeled by an oligomer of C10H22 with the linear C-backbone benchmarked in our previous study.10 To consider the branch effects on the energetics of C–C bond scission, five methyl groups and one butyl group were initially added to our HDPE model as branches of PP and LLDPE oligomers, respectively (Fig. 8A). More detailed information is provided in the ESI, section 3.7.†3. Results
3.1 Characterization of the plastic feedstocks
Fig. 1A shows the ATR-FTIR spectra of PCR HDPE, PCR PP and virgin polyolefins used for this study. The FTIR spectra of PCR HDPE and PCR PP were obtained from 10 random samples, with the FTIR spectra of all PCR plastics being shown in ESI Fig. S3.† Three representative spectra of PCR HDPE and PCR PP are shown in Fig. 1A. The PCR HDPE samples, sourced from Mexico by Iowa State University, primarily comprised ground detergent bottles. The PCR PP samples were obtained from a local material recovery facility (MRF) in Iowa and exhibited higher impurity levels compared to the PCR HDPE samples, including alumina films, various fillers, and paper contaminants. The FTIR spectra of PCR HDPE showed four main peaks, identical to those of virgin HDPE resins: 2916 cm−1 and 2848 cm−1, assigned to the CH stretching of –CH2– groups; 1467 cm−1, assigned to the C–H bending of CH2 groups; and 721 cm−1, attributed to the rocking mode of CH2 groups.19,20 In the FTIR spectra of PCR PP, two main groups of peaks were observed, which were also shown in the virgin PP resins: 2947 cm−1, 2924 cm−1, and 2846 cm−1, assigned to CH2 and CH3 stretching; and 1448 cm−1 and 1379 cm−1, assigned to the symmetrical bending of CH3 groups.21 | ||
| Fig. 1 (A) ATR-FTIR spectra of PCR HDPE, PCR PP and virgin polyolefins used in this study. (B) Zoomed-in quantitative 13C NMR results for PCR HDPE, HDPE HMW, LDPE, and LLDPE. The * symbol is the tertiary carbon and 1 refers to the primary carbon, which indicates the end groups. | ||
FTIR analysis indicated the presence of trace amounts of other plastics, such as the ethylene vinyl alcohol copolymer (EVOH) in PCR PP, due to the distinct peak at 3321 cm−1 in the PCR PP3 spectrum, which can be attributed to OH groups. The peaks observed at 1100 cm−1 and 1180 cm−1 in the FTIR spectra of both PCR HDPE and PP could be attributed to the fluorinated polyolefins containing CHF and CF2 groups,22,23 as fluorination is commonly used in polyolefin containers to enhance their chemical storage performance.23
Quantitative 13C high-temperature NMR was used to quantify the branch structure in all the polyethylene samples, as shown in Fig. 1B. The peak shown at 14.02 ppm is assigned to the primary carbon, and the peak shown at 38.28 ppm is assigned to the tertiary carbon.24,25 Virgin and PCR HDPE plastics had no detectable branches, while LDPE contained 10 tertiary carbons per 1000 carbons, and LLDPE contained 20 tertiary carbons per 1000 carbons. Tertiary carbons refer to the carbons in the carbon backbones that have a branch. The ranking of polyethylene branch density in this study, from highest to lowest, is: LLDPE (2%) > LDPE (1%) > HDPE (0%).
3.2 Pyrolysis results: overall product yields and feedstock molecular weights
Table 1 summarizes the molecular weights of the feedstocks and the overall yields of the pyrolysis products. The light oil composition was in the naphtha range with a carbon distribution from C4 to C10. The heavy oil contained components larger than C10. All HDPE samples exhibited similar distributions, yielding around 24 wt% gas and 70 wt% oil, despite variations in their weight-average molecular weight (MW) and number-average molecular weight (MN). The solid yield of PCR HDPE was a little bit higher than the solid yield of virgin HDPEs. LDPE had a lower oil yield and a higher total yield of gas and light oil than HDPE. LLDPE had a lower oil yield and a higher total yield of gas and light oil than LDPE. Thus, increasing the branch density in PE resulted in higher yields of light gases and light oils, while decreasing the yield of heavy oil, as depicted in Fig. 2A. This result agreed with the literature that branching reduces the plastic thermal stabilities because hydrogen atoms on the tertiary carbons and tertiary carbon C–C bonds are more reactive than the secondary carbons.26,27 Both PCR PP and virgin resin PP had the highest liquid yield (75 wt%) and the lowest gas yield (20 wt%), which is consistent with the finding of Ahamd et al.28 The decomposition mechanism of PP is likely different from that of PE as will be described in this paper.4,16,29 | ||
| Fig. 2 (A) Yields of gas, light oil, and heavy oils of HDPE (no branch), LDPE (1% of branch), and LLDPE (2% of branch) from the fluidized bed laboratory pyrolysis reactor. (B) Thermal decomposition of HDPE HMW, HDPE LMW, PCR HDPE, LDPE, LLDPE, PP, and PCR PP analysed through TGA under N2 conditions (the same particle sizes as was fed to the fluidized bed reactor). | ||
The TGA results, presented in Fig. 2B, demonstrated that all HDPE samples, despite their different molecular weights and sources, had similar degradation patterns in TGA. Most of the mass loss in all HDPE samples occurred between 450 °C and 520 °C, with the maximum mass loss rate observed at 495 °C. Both LDPE and LLDPE degraded between 420 °C and 510 °C, with the maximum mass loss rate at 485 °C. LDPE began degrading at approximately 10 °C earlier than LLDPE, suggesting it may possess more thermal defects, such as methyl group branches, compared to LLDPE. These thermal defects will be further discussed in the subsequent DFT calculation section.
In contrast, PCR PP and PP, unlike the HPDE samples, exhibited different degradation temperature zones even though they have similar product distributions, as shown in Table 1. PCR PP experienced most of its mass loss between 360 °C and 485 °C, with the maximum mass loss rate at 460 °C, while virgin PP lost most of its mass between 380 °C and 500 °C, with the maximum mass loss rate at 475 °C. Therefore, the TGA and DGT patterns cannot be used as the only source to predict the product distributions of polyolefin pyrolysis.
3.3 Elemental analysis of plastics and plastic oils
Table 2 shows the metal analysis of the plastics and pyrolysis oils. The element mass balance was calculated from eqn (1), which referred to the percentage of an element from the plastic that ended up in different fractions of oils. The sum element balance was calculated from eqn (2), which referred to the percentage of the overall elements that ended up in different fractions of oils. We measured 14 elements: Mg, Al, Ca, Ti, Cr, Fe, Co, Ni, Cu, Zn, Cd, Sn, Sb, and Pb, as their derivatives are commonly used as catalysts, additives, fillers, or pigments in plastics. Trialkylaluminum compounds (e.g. Al2(C2H5)6) and magnesium dichloride (MgCl2) are co-catalysts and the support of Ziegler–Natta catalysts in the polyolefin polymerization process.30,31 Common fillers and additives include calcium carbonate (CaCO3), talc (Mg3Si4O10(OH)2), aluminum trihydroxide (Al(OH)3), magnetite (Fe3O4), and stearates containing Ca, Mg and Zn.31–33 Common inorganic pigments in plastics are titanium dioxide (TiO2), zinc sulfide (ZnS), cadmium sulfide (CdS), chromium(III) oxide (Cr2O3), cobalt aluminate (CoAl2O4), and brass (Cu3Zn2).34 Lead- and nickel-based pigments were previously added to plastic products but now are limited due to regulatory restrictions for food or human contact products.34 Elements Cu, Sn, and Sb were not detected in the sample plastics and their corresponding oils so they are not included in Table 2. | (1) |
 | (2) |
| (ppm) | Sample/wt% | Mg | Al | Ca | Ti | Cr | Fe | Co | Ni | Zn | Cd | Pb | Sum |
|---|---|---|---|---|---|---|---|---|---|---|---|---|---|
| HDPE HMW | Plastic | 60.70 | 186.22 | 262.68 | <LOD | 24.00 | 13.34 | 763.97 | <LOD | 98.06 | <LOD | <LOQ | 1408.97 |
| Light oil | <LOD | 68.26 | 13.94 | <LOD | <LOD | <LOQ | <LOD | <LOD | <LOD | <LOD | <LOQ | 82.20 | |
| wt% | <LOD | 18.47 | 2.67 | <LOD | <LOD | <LOQ | <LOD | <LOD | <LOD | <LOD | <LOQ | 2.94 | |
| Heavy oil | 2.16 | 107.00 | 63.94 | 12.08 | 19.65 | 53.13 | <LOD | <LOD | <LOQ | 35.97 | <LOQ | 293.93 | |
| wt% | 0.83 | 13.33 | 5.65 | N.A. | 19.00 | 88.02 | <LOD | <LOD | <LOQ | N.A. | <LOQ | 4.84 | |
| HDPE LMW | Plastic | <LOD | 127.76 | 60.32 | <LOD | 8.33 | 7.61 | 208.87 | <LOD | 68.27 | <LOD | <LOQ | 481.16 |
| Light oil | <LOD | 126.63 | 31.42 | <LOD | <LOD | 1.66 | <LOD | <LOD | <LOD | <LOD | <LOQ | 159.71 | |
| wt% | <LOD | 52.04 | 27.35 | <LOD | <LOD | 11.45 | <LOD | <LOD | <LOD | <LOD | <LOQ | 17.43 | |
| Heavy oil | 2.52 | 131.23 | 74.23 | 17.5 | 21.46 | 64.28 | <LOD | <LOD | <LOQ | 4.24 | <LOQ | 315.46 | |
| wt% | N.A. | 18.90 | 22.64 | N.A. | 47.40 | 155.42 | <LOD | <LOD | <LOQ | N.A. | <LOQ | 12.06 | |
| PCR HDPE | Plastic | 65.88 | 285.00 | 2205.49 | 97.38 | 84.17 | 252.14 | 905.72 | <LOQ | 97.44 | 124.56 | 251.33 | 4369.11 |
| Light oil | <LOD | 63.36 | 16.92 | <LOD | <LOD | <LOD | <LOD | <LOD | <LOD | <LOD | <LOQ | 80.28 | |
| wt% | <LOD | 10.96 | 0.38 | <LOD | <LOD | <LOD | <LOD | <LOD | <LOD | <LOD | <LOQ | 0.91 | |
| Heavy oil | <LOD | 93.79 | 28.22 | <LOD | <LOD | 17.75 | <LOD | <LOD | <LOQ | 17.00 | <LOQ | 156.76 | |
| wt% | <LOD | 6.75 | 0.26 | <LOD | <LOD | 1.44 | <LOD | <LOD | <LOQ | 2.80 | <LOQ | 0.74 | |
| LDPE | Plastic | <LOD | 130.46 | 58.12 | <LOD | <LOQ | 7.03 | 150.23 | <LOD | 38.60 | <LOD | <LOQ | 384.44 |
| Light oil | 4.28 | 84.45 | 210.72 | <LOD | <LOD | 5.5 | <LOD | <LOD | 59.75 | <LOD | <LOQ | 364.70 | |
| wt% | N.A. | 38.13 | 213.55 | <LOD | <LOD | 46.08 | <LOD | <LOD | 91.17 | <LOD | <LOQ | 55.88 | |
| Heavy oil | 5.63 | 101.05 | 228.48 | 3.2 | <LOQ | 51.83 | <LOD | <LOD | 64.76 | 41.35 | <LOQ | 496.3 | |
| wt% | N.A. | 7.20 | 36.56 | N.A. | <LOQ | 68.57 | <LOD | <LOD | 15.60 | N.A. | <LOQ | 12.00 | |
| LLDPE | Plastic | <LOD | 222.06 | 84.40 | <LOD | <LOD | 5.14 | 39.40 | <LOD | 53.35 | <LOD | <LOQ | 404.35 |
| Light oil | 3.90 | 79.37 | 194.42 | <LOD | <LOD | 7.03 | <LOD | <LOD | 64.93 | <LOD | <LOQ | 349.65 | |
| wt% | N.A. | 20.12 | 129.69 | <LOD | <LOD | 77.00 | <LOD | <LOD | 68.52 | <LOD | <LOQ | 48.68 | |
| Heavy oil | 4.99 | 99.47 | 221.75 | 6.5 | 5.56 | 84.72 | <LOD | <LOD | 51.76 | 40.2 | <LOQ | 514.95 | |
| wt% | N.A. | 2.51 | 14.71 | N.A. | N.A. | 92.30 | <LOD | <LOD | 5.43 | N.A. | <LOQ | 7.13 | |
| PP | Plastic | 56.23 | 297.28 | 270.41 | <LOD | <LOD | 3.78 | <LOD | <LOQ | 55.62 | <LOD | <LOQ | 683.32 |
| Light oil | <LOD | 47.27 | 11.28 | <LOD | <LOD | <LOD | <LOD | <LOD | <LOD | <LOD | <LOQ | 58.55 | |
| wt% | <LOD | 10.75 | 2.82 | <LOD | <LOD | <LOD | <LOD | <LOD | <LOD | <LOD | <LOQ | 5.79 | |
| Heavy oil | <LOQ | 81.72 | 62.84 | 11.94 | 13.91 | 65.1 | <LOD | 5.88 | 2.31 | 2.23 | <LOQ | 245.93 | |
| wt% | <LOQ | 1.76 | 1.49 | N.A. | N.A. | 110.22 | <LOD | N.A. | 0.27 | N.A. | <LOQ | 2.30 | |
| PCR PP | Plastic | 160.90 | 191.30 | 4543.67 | 31.992 | 4.45 | 300.61 | 500.87 | 41.92 | 17.05 | <LOQ | <LOQ | 5792.76 |
| Light oil | 19.29 | 138.01 | 60.48 | <LOD | <LOD | 2.92 | <LOQ | <LOD | <LOQ | <LOD | <LOD | 220.70 | |
| wt% | 7.19 | 43.29 | 0.80 | <LOD | <LOD | 0.58 | <LOQ | <LOD | <LOD | <LOD | <LOD | 2.29 | |
| Heavy oil | 19.53 | 173.00 | 65.77 | <LOQ | <LOQ | 4.14 | <LOQ | <LOD | 2.77 | <LOD | <LOD | 265.21 | |
| wt% | 1.97 | 14.65 | 0.23 | <LOQ | <LOQ | 0.22 | <LOQ | <LOD | 2.63 | <LOD | <LOD | 0.74 | |
| LOD | 1.03 | 6.43 | 0.13 | 0.47 | 1.40 | 0.37 | 0.93 | 1.23 | 0.53 | 0.10 | 3.97 | ||
| LOQ | 3.44 | 21.44 | 0.44 | 1.56 | 4.67 | 1.22 | 3.11 | 4.11 | 1.78 | 0.33 | 13.22 |
PCR plastic samples had higher metal concentrations than virgin plastic resins. The virgin PE resins mainly contained Al (127–222 ppm), Ca (84–263 ppm), Co (39–764 ppm), and Zn (38–98 ppm), with trace amounts of Cr (5–24 ppm) and Fe (7–40 ppm). These elements could have been introduced through the use of Al(OH)3 as a flame retardant, or Al2(C2H5)6 as a co-catalyst of Ziegler–Natta catalysts, calcium–zinc as a heat stabilizer, calcium stearate as a lubricant, and Cr as part of the Phillips catalyst for the synthesis of PE.32,35 The PCR HDPE sample had higher metal content than virgin PE samples, with approximately double the Al content, 10–40 times higher Ca content, four times higher Cr content, and 3–15 times higher Fe content. The Co and Zn levels in PCR HDPE were similar to those in HDPE HMW. The virgin PP sample mainly contained Al (298 ppm), Ca (270 ppm), and Zn (56 ppm), with small amounts of Mg (56 ppm) and Fe (4 ppm). The PCR PP sample had similar amounts of Al, Mg, and Zn as PP but with much higher concentrations of Ca (4544 ppm), Fe (301 ppm) and Co (501 ppm). To summarize, PCR HDPE and PCR PP contained approximately 4400 ppm and 5800 ppm of trace metal elements, which was approximately 8 times and 24 times higher than their corresponding virgin resins, respectively.
After pyrolysis, most of the trace metals were present in lower concentrations in the pyrolysis oils compared to that in the corresponding feedstock materials. In PCR HDPE oils, the light oil only contained a total of 82 ppm metal, which was less than 1 wt% of the original metal content in PCR HDPE. The heavy oil had a total of 157 ppm metal, also less than 1 wt% of the original metal content in PCR HDPE. Therefore, more than 98 wt% of the total metal content was removed during PCR HDPE pyrolysis. In PCR PP oils, the light oil contained a total of 221 ppm of metals, and the heavy oil contained a total of 265 ppm metal, representing 2.5 wt% and 0.8 wt% of the original metal content of PCR PP, respectively. Thus, over 96 wt% of the total metal content was removed for PCR PP. The metal concentrations in the plastic oils obtained from this study were lower than those reported in the literature for the pyrolysis oil obtained without sand.12 The sand thus likely acted as a getter during pyrolysis. The missing metal content was probably deposited on the sand and char, which were not collected in this study.
The concentrations of the total minerals in the heavy oils were typically more than twice the concentration in the light oils for most of the plastics in this study (e.g., the PCR HDPE light oil had a total metal concentration of 82 ppm, while the PCR HDPE heavy oil had a total of 157 ppm). Thus, distillation could be used to further separate the inorganic fraction. This finding aligns with the existing literature, suggesting that distillation can effectively remove metal impurities from the oil.36 However, in some cases (such as LDPE and LLDPE), the total metal concentrations in the plastic oils were comparable to or even higher than those in the feed plastics. This is likely due to cross-contamination from previous experiments. In addition, as listed in Table 2, the mineral balances of Fe in several plastics were higher than 100 wt% and there were two potential reasons for this: (1) the cross-contaminations and (2) the Fe leached from the stainless-steel fluidized bed reactor. The sand used in the fluidized bed reactor was replaced before PCR HDPE and PCR PP pyrolysis. When pyrolysis was conducted on fresh sand, as discussed before, most impurities were removed from the oil and likely ended up in the sand or char. More research is needed to better understand the buildup of inorganics on the sand.
Different elements had different removal efficiencies through the same pyrolysis process. Heavier elements (Co, Ni, Zn, and Pb) are more easily removed during pyrolysis with sand, while lighter elements (Al, Ca, and Fe) are more challenging to eliminate. For example, the Co concentrations of HDPE HMW (764 ppm), PCR HDPE (906 ppm), and PCR PP (501 ppm) were high but no Co was observed in their pyrolysis oils. A similar trend was noted for Zn, with over 95 wt% of Zn removed from most plastics except for LDPE and LLDPE, which were likely cross-contaminated. In contrast, lighter elements such as Al, Ca, and Fe were present in most oils, with removal rates ranging from approximately 60 wt% to 80 wt%.
However, even though pyrolysis with sand and distillation could help in removing the metal elements, the quality of the plastic oils still did not meet the requirements for the upgrading process. The most common method for upgrading the oil is feeding it into an industrial steam cracker.4,8,12 Most oils did not meet the standards for Ca (0.5 ppm) and Fe (0.001 ppm), but did meet the standards of Ni (100 ppm) and Cu (50 ppm).8 Further purification needs to be performed on plastic pyrolysis oils before sending to the steam cracker for upgrading.
3.4 Detailed hydrocarbon composition analysis
The GC × GC-FID chromatograms of pyrolysis oils from all 7 types of plastics at 500 °C are depicted in Fig. 3. GC × GC-FID enabled effective separation of compounds within the carbon number range of C4–C40, identifying over 1000 peaks for each oil. In a GC × GC chromatogram, a complex mixture is separated based on boiling points on the x-axis (retention time for the first column) and functionality on the y-axis (retention time for the second column). Along the x-axis, the boiling points of the compounds increase from left to right. Along the y-axis, the polarity of the compounds increases from top to bottom. These peaks were categorized into 6 groups: linear hydrocarbons, branched alkanes, branched alkenes, branched alkadienes, aromatics, and dicyclo-aromatics (aromatic compounds with multiple rings). The template of GC × GC-FID is provided in ESI Fig. S4.† The linear hydrocarbons were further divided into linear alkanes, alkenes, and alkadienes using another GC, with the detailed procedure provided in the ESI.† According to the GC × GC chromatograms, compared to PE oils, PP oils contained more aromatics and fewer alkenes. The plasticizer, bis(2-ethylhexyl)terephthalate, was detected in all plastic oils. The quantification results from GC × GC-FID were validated through the detailed hydrocarbon analysis (DHA) and nitric oxide ionization spectroscopy evaluation (NOISE) results, as shown in ESI Fig. S5.†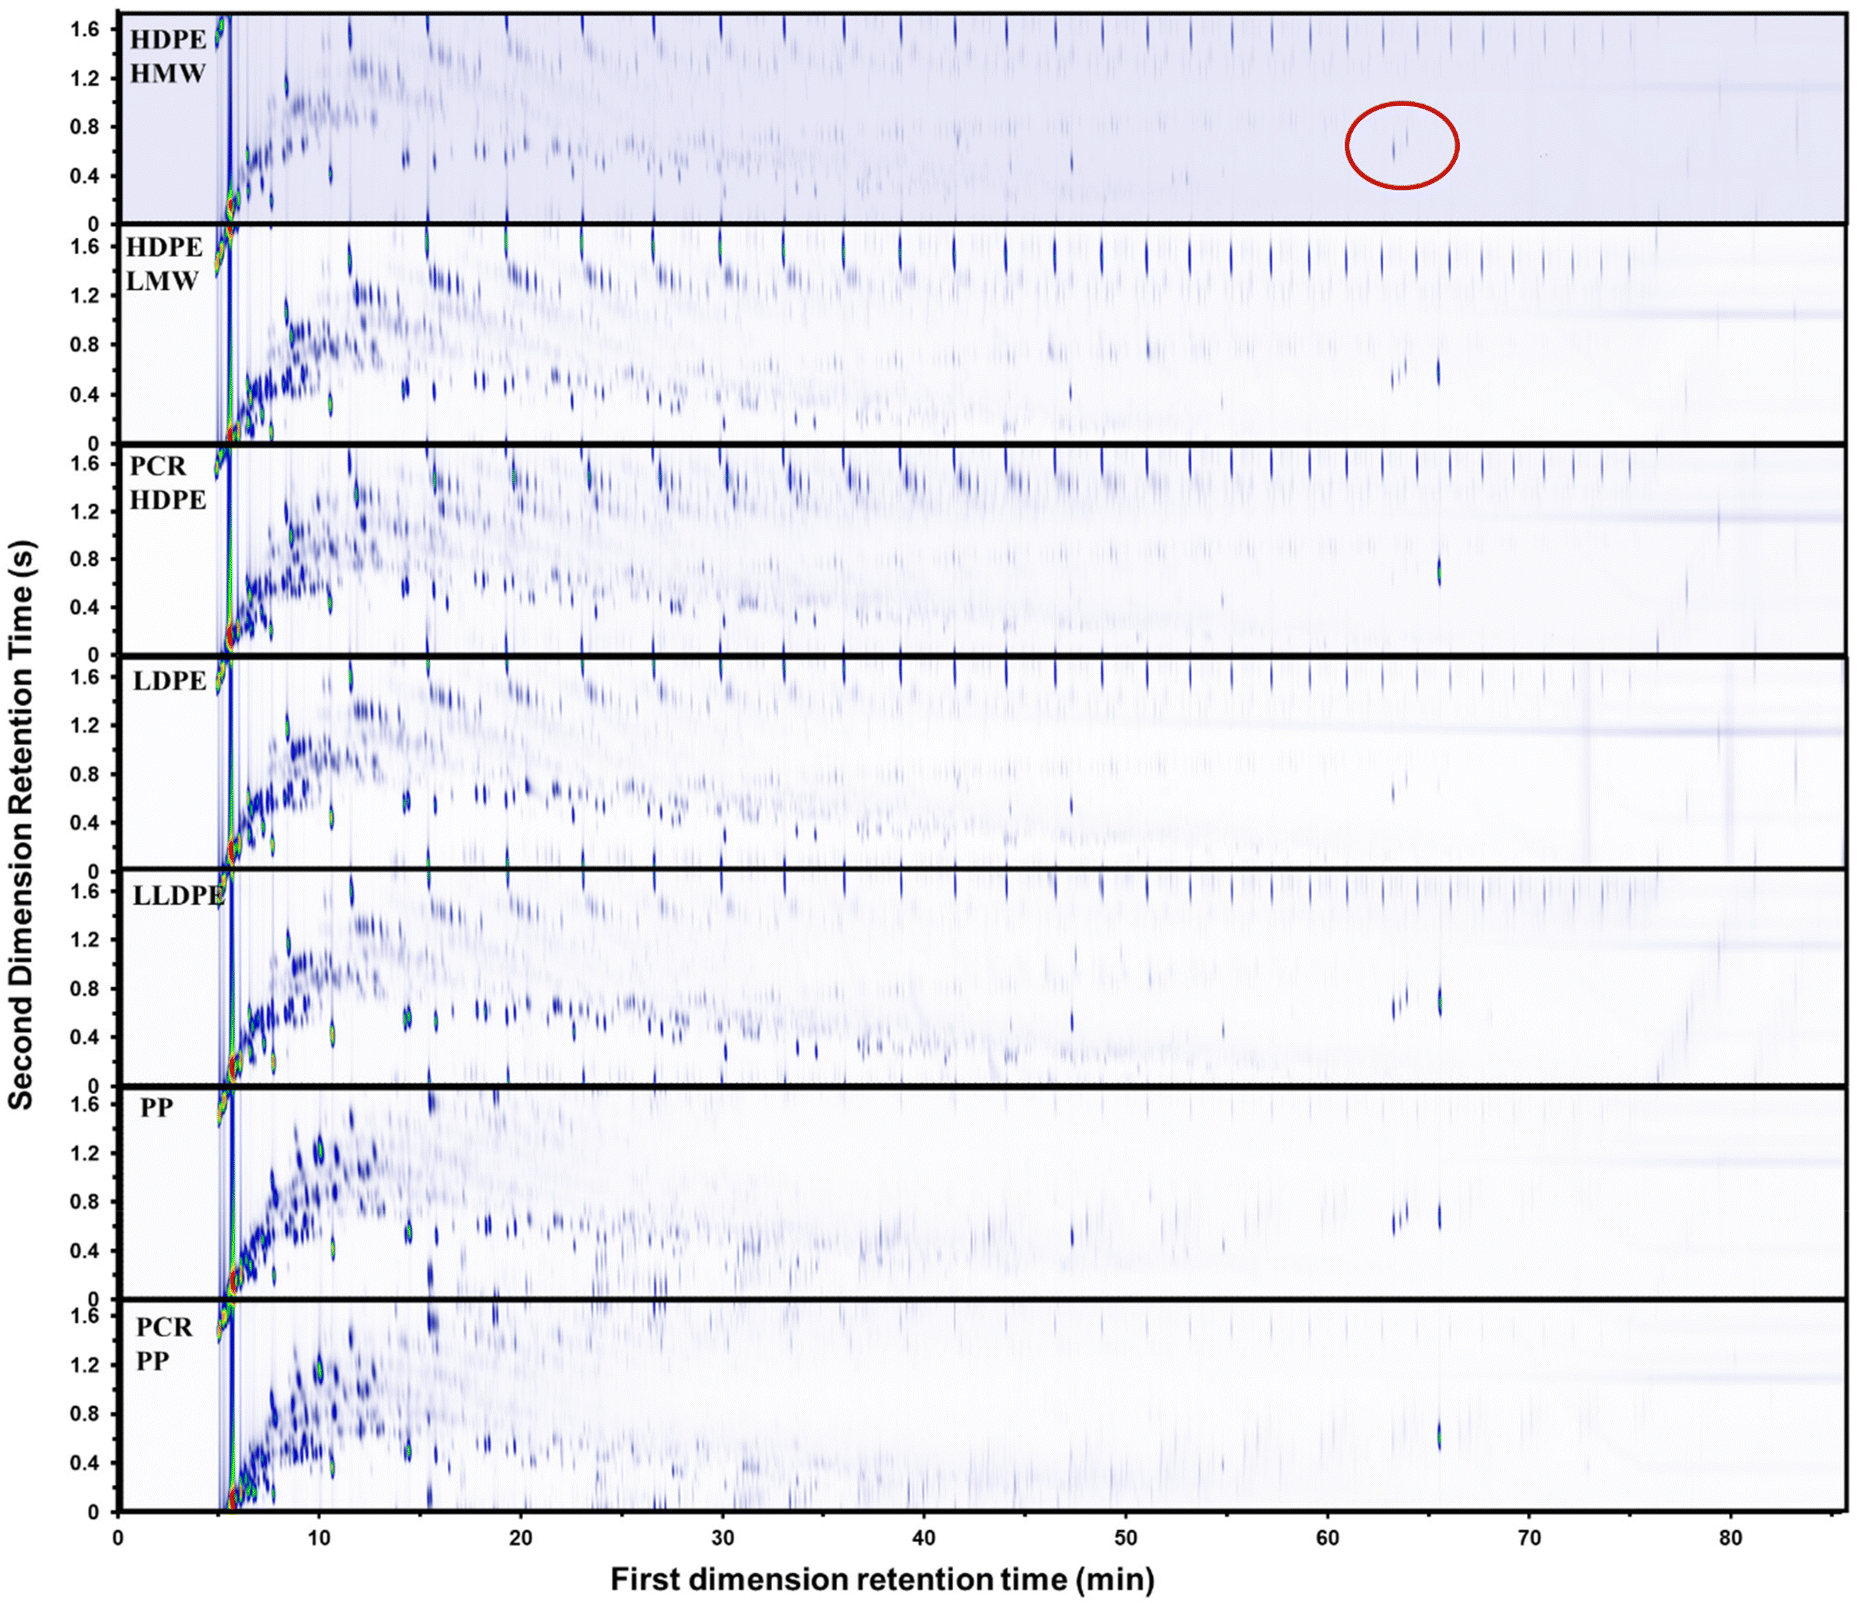 | ||
| Fig. 3 GC × GC-FID chromatographs of HDPE with high weight molecular weight, HDPE with low weight molecular weight, PCR HDPE, LDPE, LLDPE, PP, and PCR PP. The circled component is bis(2-ethylhexyl)terephthalate, a common plastics additive. | ||
The gas products from the pyrolysis of all seven types of plastics were quantified using a refinery gas GC (RGA). A detailed analysis of the gas products is provided in ESI Fig. S6.† The gas compositions of the PP and PE resins differed. The gas products generated from PE pyrolysis were similar (Fig. S6A–E†); the major components, ranked in order of abundance from highest to lowest, were ethylene, propylene, ethane, and methane. For the gas products generated from PP pyrolysis (Fig. S6F and G†), the major components, ranked in order of abundance from highest to lowest, were propylene, ethane, ethylene, methane, and propane. In addition, PP generated less hydrogen compared to PE. In the gas phase, ethylene had the highest yield among all PE plastics, while propylene had the highest yield in PP plastics. This indicated that β-scission was occurring. However, the overall yields of both ethylene and propylene were below 10 wt%, suggesting that β-scission is not the dominant reaction in polyolefin pyrolysis.
The major products in the polyolefin oils generated in this study are alkanes, alkenes, alkadienes, and mono-aromatics. Although some dicyclo-aromatics were detected, their yields were below 5 wt% in all oils. The quantities of these compounds varied among different polyolefins. Fig. 4A shows the quantified compositions of the oils. HDPE HMW, HDPE LMW, and LDPE had similar distributions: approximately 30 wt% alkanes, 40 wt% alkenes, 15 wt% alkadienes, and 10 wt% mono-aromatics. PCR HDPE contained around 10 wt% fewer alkanes and 5 wt% more alkenes compared to virgin HDPE. LLDPE oil had a similar alkane content to HDPE oils but a lower alkene yield (30 wt%) and a higher aromatic yield (25 wt%). PCR PP and PP oils had the highest alkane yield (40 wt%) and the lowest alkene yield (25 wt%) among all seven plastics. In addition, PCR PP contained about 5 wt% more alkadienes than virgin PP.
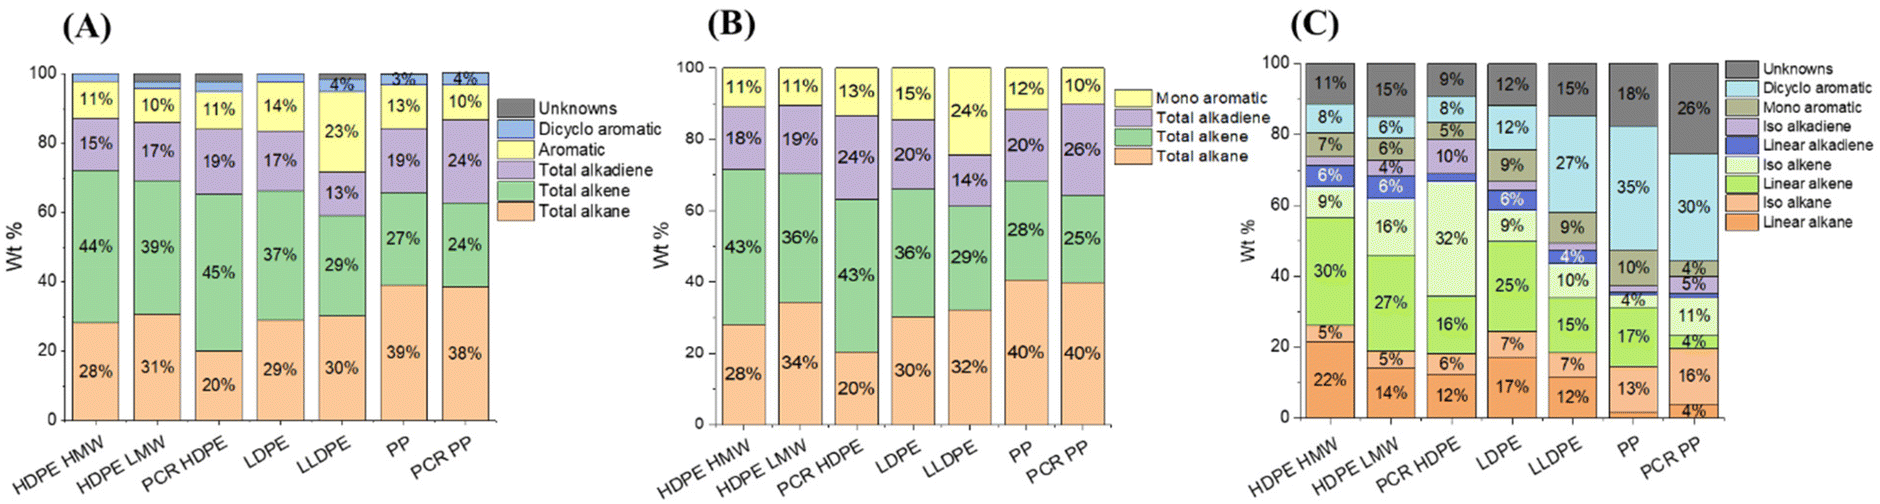 | ||
| Fig. 4 The overall summary of oil weight percentage distributions of (A) whole oil, (B) light oil, and (C) heavy oil with branch analysis for all 7 plastic pyrolysis oils, quantified through GC × GC-FID. | ||
Fig. 4B shows the composition of the light oil (C4–C10). Fig. 4C shows the composition of the heavy oil (C11–C40). Generally, light oils had similar yields of alkanes, alkenes, and aromatics but contained more alkadienes compared to the whole oil. In the heavy oils, branched structures were distinguishable by GC × GC and labeled as iso-alkane, iso-alkene, and iso-alkadiene, as shown in Fig. 4C. Both PCR HDPE and PCR PP had higher concentrations of branched compounds. PCR HDPE contained 15–25 wt% higher content of the branched alkene and 5% higher content of alkadienes than HPDE resins. PCR PP contained 5 wt% more branched alkanes and alkadienes, and around 10 wt% more branched alkenes than the PP resin. In addition, as the branch density of polyolefin increased, the yield of dicyclo-aromatics in the heavy oil also increased. Although LLDPE, PP, and PCR PP contained 30–40 wt% of dicyclo-aromatics, the yield of the heavy oil was less than 10 wt% (Table 1), resulting in low total yields.
Alkanes, alkenes, and alkyl radicals are initially formed during the decomposition of PEs. As the alkenes continue to degrade, more alkanes and alkadienes can be formed.4 Consequently, with an increase in secondary reactions, more alkanes, alkadienes, and aromatics will be generated.4 Comparing the pyrolysis results of HDPE HMW and LMW (Fig. 4B), HDPE LMW exhibited higher yields of alkanes and alkadienes in the C4–C10 range. This suggests that during pyrolysis, lower molecular weight polymers are less thermally stable than higher molecular weight polymers and undergo more secondary reactions, despite showing similar degradation patterns in TGA (Fig. 2B).
Increasing branch density decreases the thermal stability of the polymer because it introduces more reactive tertiary hydrogens and weaker carbon-to-carbon bonds on the tertiary or quaternary carbon atoms.26,37 This trend was evidenced not only by the liquid yield, but also the detailed product distribution. In the pyrolysis results of HDPE HMW, LDPE, LLDPE, and PP, an increase in branch density led to a decrease in the alkenes yield and an increase in the yield of alkanes, and a total yield of alkadienes, aromatics, and dicyclo-aromatics, as alkenes decompose into alkanes and alkadienes, and alkadienes further form aromatics. Aromatics then can further convert to dicyclo-aromatics due to the addition of small alkene molecules like ethene.38
When comparing the pyrolysis results of PCR plastics to their corresponding virgin resins, it appears that the impurities or additives in PCR plastics played two roles: promoting hydrocarbon isomerization and preventing decomposition of hydrocarbon oligomers. This was evidenced, as shown in Fig. 4A and C, by PCR HDPE having the highest yields of branched alkanes, alkenes, and alkadienes, as well as an overall higher alkene yield, indicating fewer secondary reactions. PCR PP oils contained a higher concentration of branched compounds but relatively similar concentration of alkenes. Further investigation is needed to determine the specific impurities responsible for hydrocarbon isomerization during pyrolysis.
Alkenes are one of the most abundant products in pyrolysis oils, and their structures were further studied using NMR. Fig. 5 shows the alkene composition normalized by total alkenes. Examples of 1H NMR spectra for the light and heavy oils of PCR HDPE and PCR PP are shown in ESI Fig. S7.† Three main types of alkenes were detected in both oils: terminal alkenes, internal alkenes, and 1,1-disubstituted alkenes. The conjugated alkadienes and cyclic alkenes (e.g. compounds with structures like cyclohexene) were only detected in light oils in this study through 1H NMR, which aligns with the findings of the studies by Abbas-Abadi et al. and Krishna et al. that conjugated alkadienes and cyclic alkenes only exist as small molecules.13,15 The formation of cyclic olefins and conjugated alkadienes might result from secondary reactions, as the compounds in the heavy oil underwent fewer cracking reactions. This phenomenon emphasized the significant impact of secondary reactions on the formation of different groups of pyrolysis products.
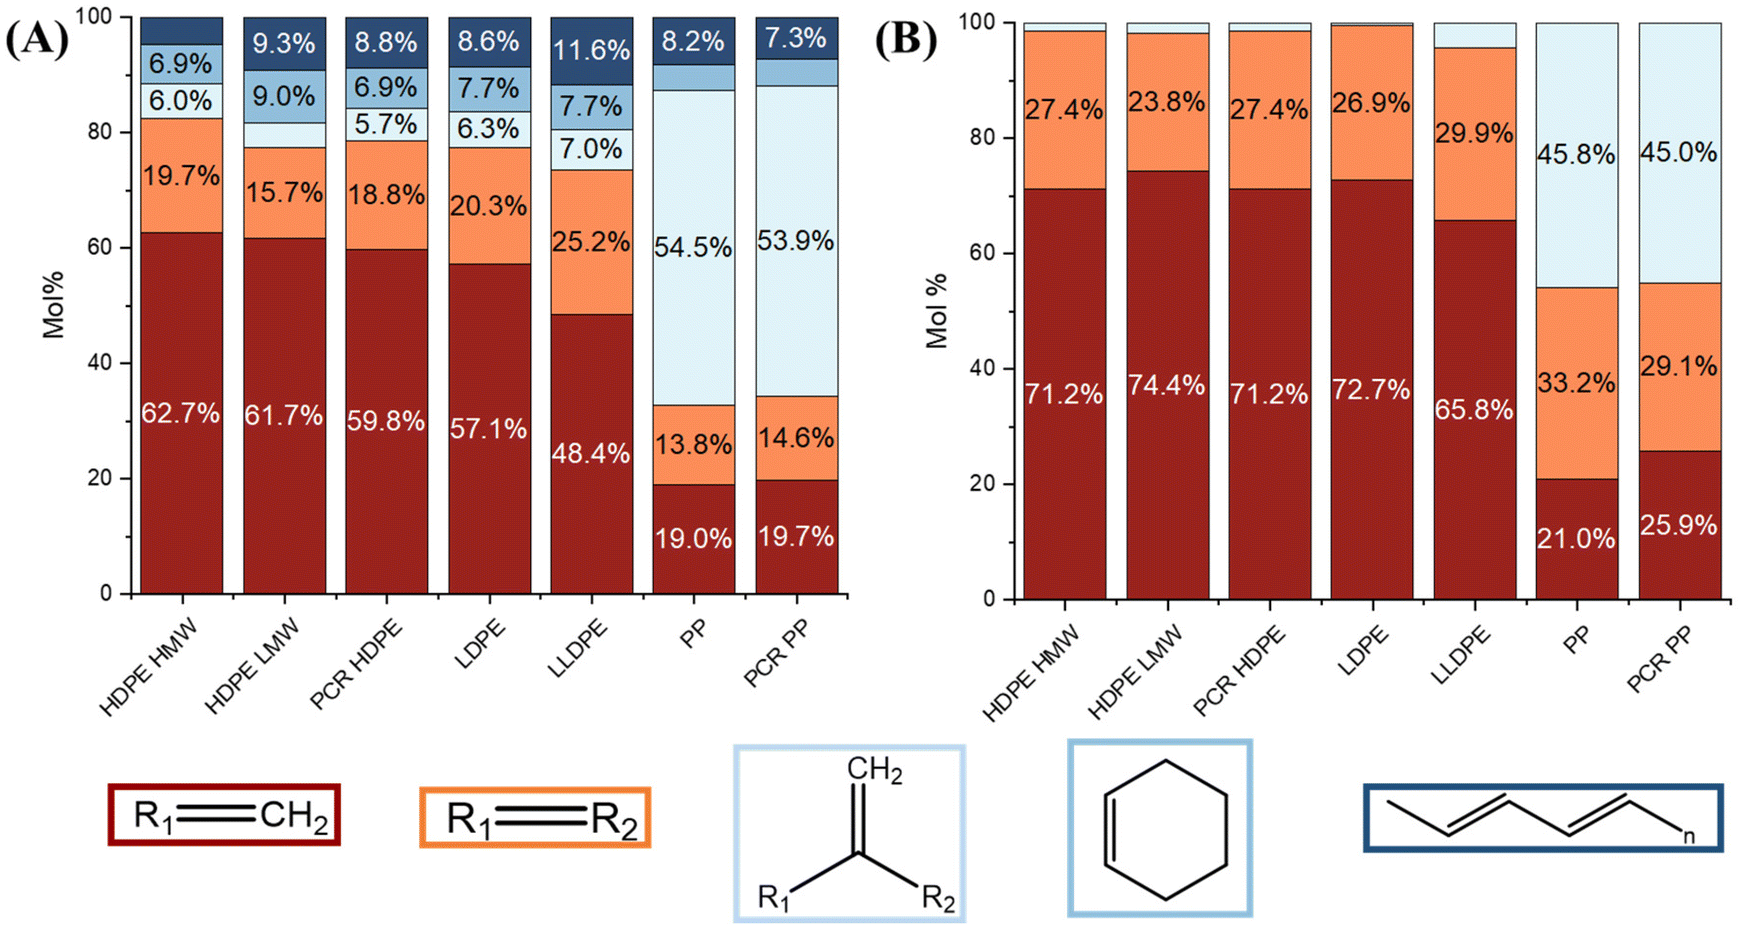 | ||
| Fig. 5 Normalized molar percentage of terminal (crimson), internal (orange), 1,1-disubstituted (light blue), and cyclic (mid-blue) alkenes, as well as conjugated dienes (navy blue) quantified through 1H NMR for (A) light oils and (B) heavy oils. | ||
Terminal alkenes were the most abundant, comprising approximately 50–60 mol% of the light oil among all PE samples. Internal alkenes were around 15–25 mol%. Less than 10 mol% of the products were 1,1-disubstituted alkenes, cyclic alkenes, and conjugated dienes, respectively. In heavy PE oils, terminal alkenes remained the most abundant, but the proportion of 1,1-disubstituted alkenes decreased to less than 5 mol%. In light PE oils, the amount of internal alkenes increased with higher branch density, while the amount of cyclic alkenes and conjugated alkadienes remained relatively similar. In heavy PE oils, the proportions of internal and terminal alkenes were comparable. In light PP oils, 1,1-disubstituted alkenes were the most abundant products (60 mol%) and contained approximately 20 mol% of terminal alkenes and 15 mol% of internal alkenes. In heavy PP oils, the amount of the internal alkenes increased to 30 mol% and the 1,1-disubstituted alkenes decreased to 45 mol%.
Overall, light oils contained more 1,1-disubstituted alkenes, cyclic alkenes, and conjugated dienes than heavy oils across all samples. The main difference between PE and PP oils was the different concentrations of 1,1-disubstituted alkenes. For PE oils, the higher concentration of 1,1-disubstituted alkenes in light oils compared to heavy oils likely resulted from secondary pyrolysis reactions. In contrast, 1,1-disubstituted alkenes in PP oils likely formed during the primary degradation reaction, making them predominant in both PP heavy and light oils, as further discussed in sections 3.6 and 4.1. However, PP heavy oils showed a noticeable increase in internal alkenes compared to light oils. This might be due to NMR's limitation in distinguishing specific molecules. Hence, it is possible that in PP heavy oil, some dicyclo-aromatics (as it was one of the main compounds in PP heavy oil revealed by GC × GC) with side chains containing internal alkenes were present.
Fig. 6 shows the quantified results for each group of compounds distributed by carbon number. Among all HDPE oils, even though they had relatively similar gas, liquid, and solid yields (Table 1) and TGA patterns (Fig. 2B), their carbon distributions were different. For the HDPE samples, HDPE HMW had the highest molecular weight, followed by HDPE LMW and PCR HDPE. HDPE LMW exhibited the sharpest distribution, resulting in the highest C5 and C6 yields among the HDPE samples. PCR HDPE and HDPE HMW oils had similar carbon distributions, despite the molecular weight of HDPE HMW being more than double that of PCR HDPE. This similarity in carbon distribution may be attributed to certain additives in PCR HDPE that could inhibit oligomer degradation. Fig. S8 in the ESI† provides branching information of C7–C40 products. According to Fig. S8,† HDPE HMW has the highest yields of linear alkanes and alkenes, while PCR HDPE has the highest yields of branched alkanes and alkenes.
 | ||
| Fig. 6 Detailed product analysis with each carbon number of HDPE HMW, HDPE LMW, PCR HDPE, LDPE, LLDPE, PP, and PCR PP. The total amounts of C3 and C4 products were modified by the solubility of propane and butane in hexane at room temperature.39,40 | ||
Comparing HDPE LMW, LDPE, and LLDPE highlighted the impact of PE structure on product distributions in plastic oils. In Fig. 6, LDPE had a similar product carbon distribution to HDPE LMW but with higher benzene and toluene yields. LLDPE pyrolysis products showed different carbon distributions from both LDPE and HDPE LMW with a higher C1–C3 yield and a lower C4–C6 yield. LLDPE also had the highest yields of ethene and aromatics (Fig. S8E† shows LLDPE aromatic yields close to 50% for C7–C40 products). These results further suggested that branching in PE promotes thermal degradation.
The PP carbon distributions differed from those of PE samples, exhibiting much sharper distributions, with 25 wt% C5 yields. In PE samples, C2 (ethane and ethene) always had higher or similar yields to C3 (propane and propene). This indicated that PP degradation was dominated by “unzipping reactions” since propene is the monomer of PP. In contrast, PE degradation was dominated by random scission reactions. PP oils also had the lowest benzene yield and tended to have more branched aromatics (toluene and xylenes) and more branched alkanes and alkenes (ESI Fig. S8†).
3.5 Schultz–Flory distributions of polyolefin pyrolysis oils
The Schultz–Flory distribution model41–43 was applied to the products from all 7 types of plastic oils. The model is described by eqn (3), where Cn is the carbon selectivity of the alkane and alkene of each carbon number as they are the main primary products from pyrolysis, n is the carbon number, α is originally the chain-growth probability, and (1 − α) is the termination probability for the polymerization. When a polymer degradation process follows random scission reactions, the products tend to be formed with a Schultz–Flory distribution. This hypothesis has been applied to the thermal degradation of polyolefins.44,45 In this context, α in eqn (3) represents the likelihood of the polyolefin following random scission reactions: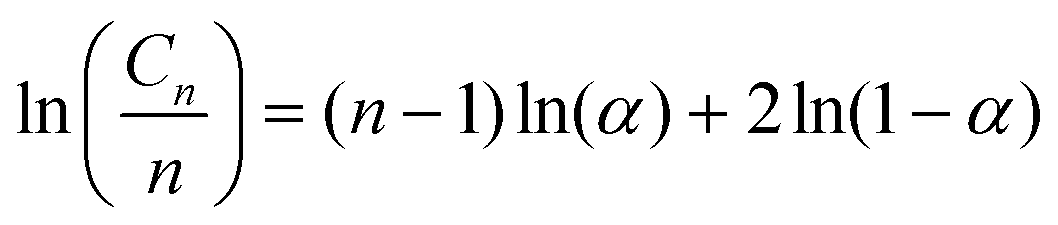 | (3) |
Not all polyolefins are thermal degradation products that conform to Schultz–Flory distribution. As shown in Fig. 7A, all HDPE samples fitted the Schultz–Flory distribution, with α values ranging from 0.72 to 0.75 and R2 values above 0.9. With an increase in the branch density of polyolefins, both α and R2 values decrease (Fig. 7B). The α value of LDPE decreased to 0.715, with an R2 value of 0.904, still indicating a reasonable fit. However, LLDPE had a similar α value to LDPE but its R2 value decreased to 0.633, which departed from the fitting. In Fig. 7C, the α value of PP further decreased to 0.645 with an R2 value of 0.360, suggesting that PP degradation products did not follow Schultz–Flory distribution. A similar pattern was observed in PCR PP.
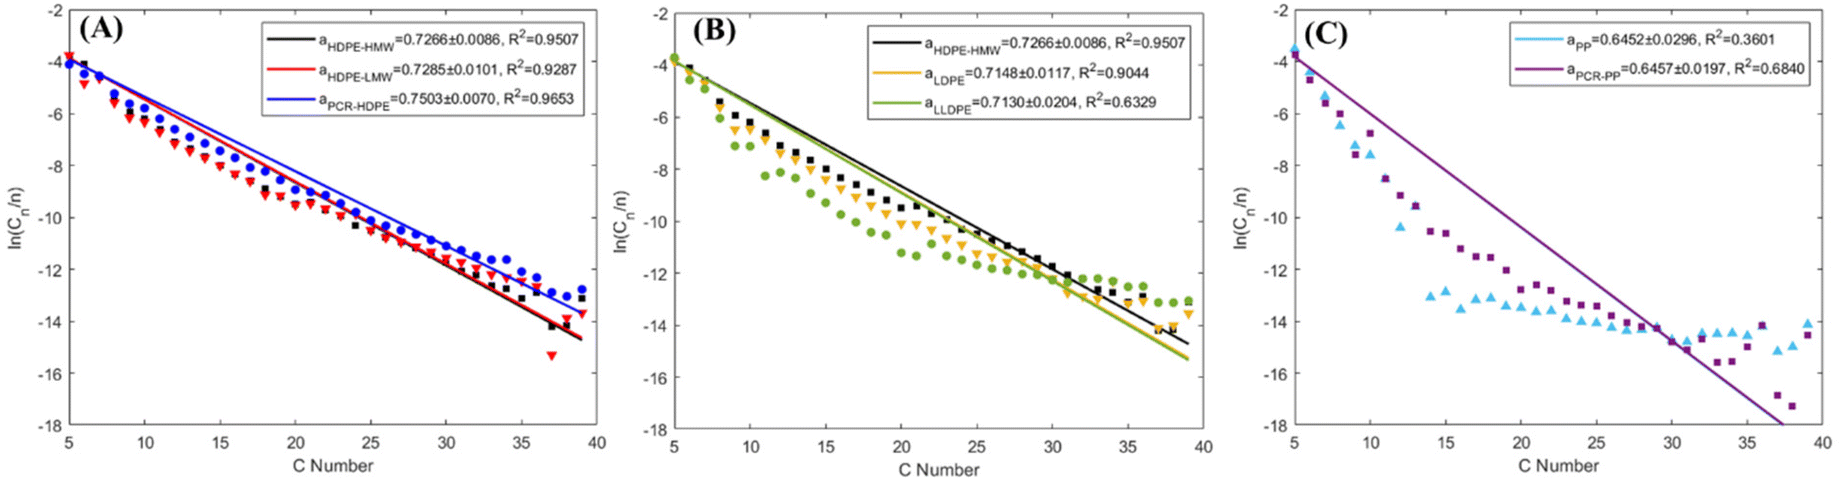 | ||
| Fig. 7 Schultz–Flory distribution plots for products (C5+) with (A) all HDPE samples, (B) all virgin polyethylene resins, and (C) all PP samples. The α values include a 95% confidence interval. | ||
Therefore, the HDPE samples pyrolyzed in this study followed random scission reactions, which is consistent with other literature reports.17,46 As the branch density in the plastics increased, the likelihood of plastics undergoing a random scission reaction decreased, which was indicated by the lack of fitting LLDPE, PP, and PCR PP product distributions to that of the Schultz–Flory distribution model. This finding indicated that increased branching affected the degradation pattern and chemistry of polyolefins. Further discussion is provided in section 4.1.
3.6 DFT calculations
Ab initio calculations of the thermochemistry and kinetics of HDPE, LLDPE, and PP pyrolysis were conducted by varying the branch size, density, and position of the linear C10 backbone (Fig. 8A) to reveal the effects of branches on product selectivity towards light oil and gas products. Fig. 8B shows the DFT-derived activation energy barriers for C–C scission in HDPE, PP, and LLDPE. The backbone C–C scission in HDPE (blue bar) requires an activation energy barrier of 365.4 kJ mol−1, which is higher than that for PP (321.3 kJ mol−1, purple bar) and LLDPE (315.3 kJ mol−1, red bar). Such a significant energy barrier reduction from HDPE to LLDPE indicates that branching can promote backbone C–C cleavage. Therefore, a greater incidence of backbone C–C scission is expected in the hydrocarbon polymers with branches, which can also qualitatively explain our experimental observation that LLDPE and PP yield more light oil products than heavy oil products (Fig. 2A). Furthermore, our computational chemistry findings suggest that the amount of light oil from the branched polymers (LLDPE and PP) is higher than that from the non-branched one (HDPE), which agrees with our experimental findings (Fig. 2A). Importantly, we determined that the activation energy for backbone C–C scission in LLDPE is lower than that for PP (Fig. 8B), which suggests that larger branch sizes and lower branch density facilitate easier backbone C–C scission. This may be due to the highest occupied molecular orbital (HOMO) electrons accumulating in the middle C–C sites of LLDPE for backbone scission (Fig. 8C).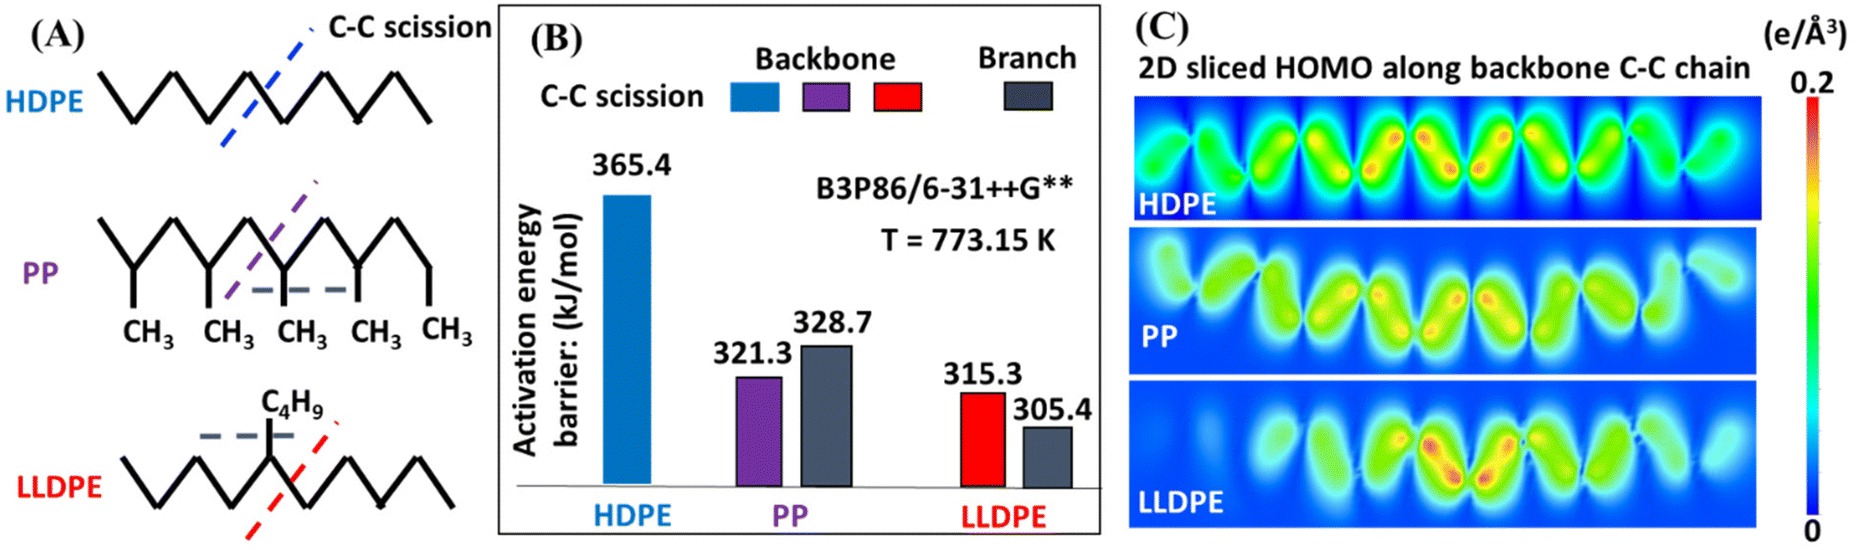 | ||
| Fig. 8 (A) Schematics of the initial configurations of the model compounds of HDPE, LLDPE and PP, in which the dashed lines refer to the backbone and branch C–C scission sites. (B) Calculated activation energy barriers for backbone C–C scission in HDPE (blue bar), PP (purple bar), and LLDPE (red bar), and branch C–C scission in PP and LLDPE (grey bars). (C) Two-dimensional (2D) sliced highest occupied molecular orbital (HOMO) electron densities of HDPE, LLDPE and PP along the backbone C–C chains. | ||
To further investigate the effect of branch size on the pyrolysis product selectivity, we calculated the barrier energy of backbone C–C scission in LLDPE by varying the branch length from methyl to ethyl, propyl, butyl, pentyl and hexyl (ESI Fig. S10†). A notable effect of branch size was not observed when going from methyl to ethyl, facilitating the kinetics of C–C scission. Meanwhile, we observed that if the branch is a methyl group, the polymer backbone tends to break first; if the branch is longer than a methyl group (>1 carbon), the whole branch tends to be cleaved off from the backbone first. Therefore, the butyl group as a branch (corresponding to LLDPE) contributes to the lower energy cost of C–C scission in the branch than in the backbone, which leading to the highest selectivity towards gas in LLDPE pyrolysis (Table 1). In contrast, the lower methane selectivity (one of the major gas components) (Fig. 6) of PP pyrolysis can be explained by the lower priority of the methyl branch being broken than backbone C–C scission. The limited gas selectivity of PP pyrolysis can also be understood by the energy profiles of the most favorable pathways for the gasification of our HDPE and PP models (ESI Fig. S11†). Through DFT calculations, we found that the presence of methyl branches increases the carbon number of ultimate products, which in turn indicates incomplete gasification and favors liquid production. Therefore, the significant effect of branch length on the backbone and branch C–C scission in HDPE, PP and LLDPE can reveal the intrinsic reason for product selectivity towards liquid and gas product distributions of the three polymers as observed in our experiments.
4. Discussion
4.1 The impact of polymers’ structures
The polymer branch structure impacts the distribution of gas, liquid, and solid products (Table 1) due to its effect on thermal stability and degradation kinetics.26 This is supported by DFT calculations, which show that PP requires about 44 kJ mol−1 less energy than other polymers for C–C bond cleavage. LLDPE requires about 60 kJ mol−1 less energy at thermal defects to initiate degradation compared to HDPE (Fig. 8B). The polymer contains more thermal defects as the branch structure increases, leading to a faster decomposition rate and resulting in more secondary reactions. Consequently, the pyrolysis oils of these polymers contain fewer alkenes, and higher numbers of alkanes, alkadienes, and aromatics (Fig. 4).Branching structures also produce more internal olefins. For LLDPE, there are two possible pathways to initiate degradation, as depicted in Fig. 9A: cleavage from the side chain or from the backbone. Regardless of the cleavage points, the presence of branches in LLDPE increases the likelihood of forming internal radicals without isomerization. The combination of DFT (Fig. 8B) and NMR (Fig. 5A) results suggest that LLDPE degradation likely begins with side-chain cleavage, forming a short-chain paraffin with a long internal radical. This internal radical can then undergo β-scission, resulting in the formation of a relatively short-chain internal alkene.46,47 This is further supported by Fig. 6, which shows that LLDPE has a higher C4 yield compared to HDPE (LLDPE used in this study is a copolymer of ethene and hexene, so it contained the C4 length of the side chain). Although LDPE has a higher yield of C4 when compared to LLDPE, predicting the composition of LDPE decomposition is more challenging due to the unknown branch structure of LDPE.
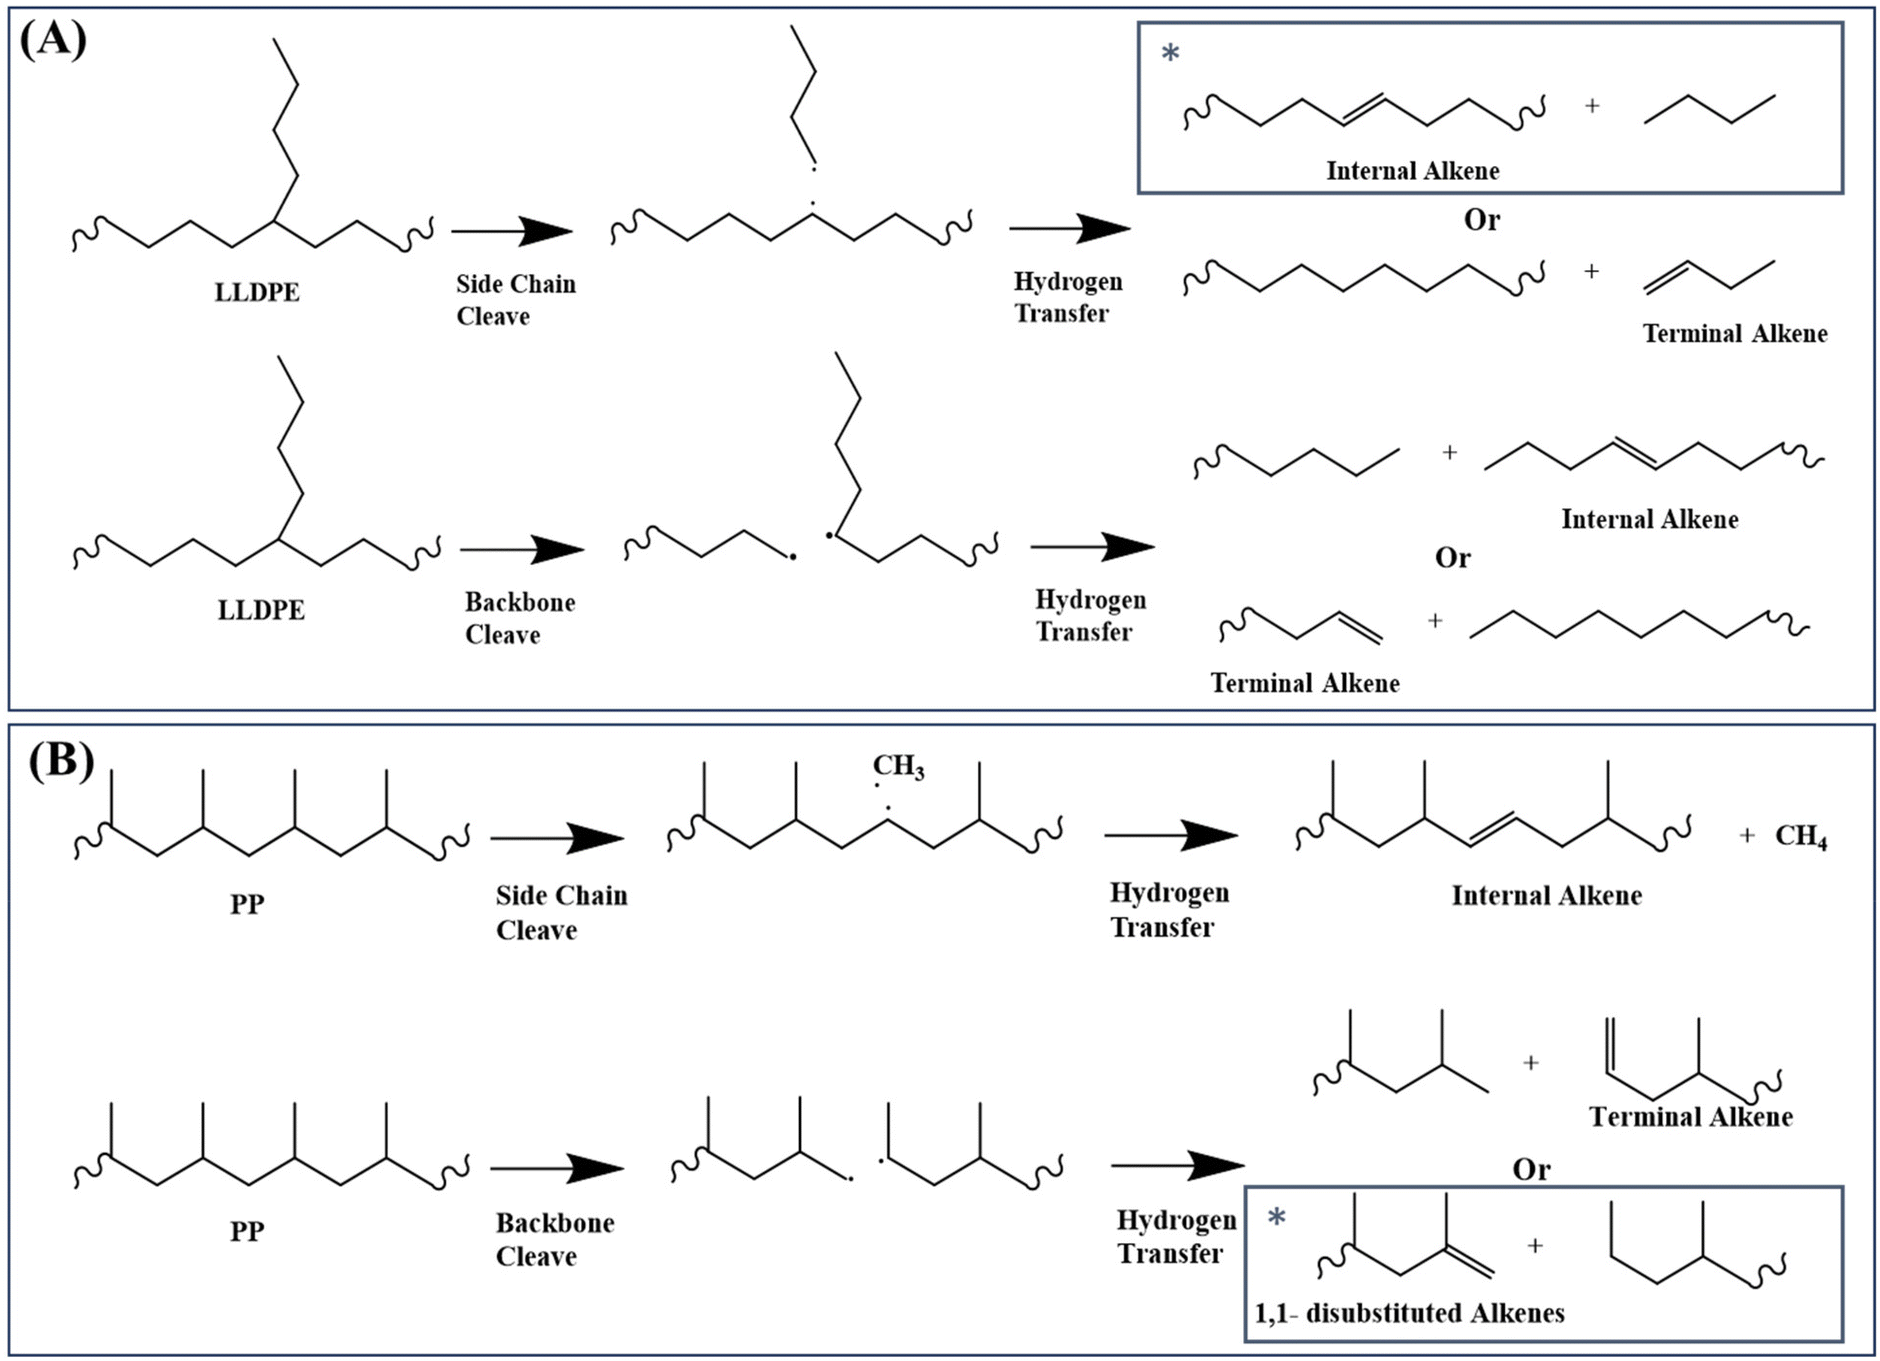 | ||
| Fig. 9 Plausible (A) LLDPE and (B) PP thermal degradation pathways. The star symbol indicates the most favored degradation pathway. | ||
As shown in Fig. 5A, LLDPE oils exhibit 10 mol% more internal alkenes than HDPE oils, despite having only 2% branch content in the original polymer. This may be caused by the double-bond isomerization of alkenes at high temperature. According to our previous study,10 formation of internal alkenes is more thermodynamically favored compared to terminal alkenes. Since LLDPE requires a lower degradation energy (Fig. 8B), more secondary reactions including double-bond isomerization would have a higher chance to take place during pyrolysis and therefore has a higher yield of internal alkenes.
Fig. 9B illustrates the plausible initiation pathways for PP thermal degradation. According to the DFT calculations (Fig. 8B) and NMR data (Fig. 5), PP primarily degrades through the carbon backbone, forming a 1,1-disubstituted alkene and an alkane. Some literature reports suggest that PP degradation involves random scission, followed by an unzipping process.48–50 Once the initial backbone C–C scission occurs (random scission), the generated radicals initiate the unzipping process. This is further supported by Fig. 6, where among all polyolefins pyrolyzed under the same conditions, PP and PCR PP have the lowest yields of methane, indicating unfavored cleavage from the methyl branch, as supported by the DFT calculations (Fig. 8B). In addition, the high methyl branch content in PP favors the oil yields (Fig. S11†), which explains why PP has the highest oil yield among all polyolefins. Also, PP heavy oils exhibit a higher concentration of dicyclo-aromatics, likely due to the methyl branches facilitating the cyclization of PP oligomers, consistent with observations from other studies.14
Furthermore, the Shultz–Flory plot (Fig. 7B) indicates that higher branch density in polyolefins reduces the likelihood of random scission during pyrolysis. For the PE samples, the HDPE samples have undetectable tertiary carbons (Fig. 1B), indicating minimal thermal defects, and thus the carbon backbone decomposes at randomly distributed C–C bonds. For high branch-density PE samples, such as LLDPE, the branches cleave first from the carbon backbone, and the generated internal radicals may deviate the polymer degradation process from the random scission pathway. In the PP samples, degradation begins with random scission, followed by an unzipping reaction, which resulted in a poor fit to the Schultz–Flory distribution model.
4.2 The impact of polymers’ molecular weight
In this study, the molecular weight (MW) did not significantly affect the gas, liquid, and char distribution for the HDPE samples (Table 1). However, lower MWs led to higher yields of C4–C10 compounds and higher yields of paraffins and aromatics in the overall oil (Fig. 4 and 6). This may be attributed to the relatively mild pyrolysis temperature and long residence time used in this study. At 500 °C, hydrocarbons with carbon numbers less than or equal to C10 barely degrade.10 At this temperature, smaller molecules (C4–C10) barely decompose to non-condensable molecules (C1–C3), leading to similar gas yields among all HDPE samples. A relatively long residence time allows for more secondary reactions for the small MW polymer to take place, leading to higher concentrations of alkanes and alkadienes. In addition, the two PP samples, despite having higher molecular weights than the PE samples, showed much sharper and lighter product distributions (Table 1 and Fig. 6). This result further supports the hypothesis that the polymer structure has a greater impact on pyrolysis product distribution than the molecular weight.4.3 The impact of polymers’ sources
The impact of additives on PCR plastics is complex, and the additive content in PCR plastics can vary significantly from batch to batch. According to Fig. 4C, 6, and ESI Fig. S8,† PCR plastics produce more branch products during pyrolysis. Acid catalysts, such as AlCl3, are well known for promoting alkane skeletal rearrangement reactions to form branched alkanes.51 The branched alkenes may result from the decomposition of long-chain alkanes. Although the Al concentration in PCR plastics is not significantly different from that in virgin resins (Table 2), other impurities in PCR plastics might create an acidic environment and synergize with Al to catalyze hydrocarbon isomerization.Unlike Al, Ca is detected as one of the main impurities in PCR plastics, originating from fillers, stabilizers, and lubricants.32,35,52 CaO, which forms from the decomposition of the common Ca additive CaCO3, can act as a catalyst for the isomerization and hydrogenation of alkenes.53 However, the concentrations of internal alkenes (Fig. 5) and alkanes (Fig. 4A–C) in the PCR plastic oils were not higher than that in the corresponding virgin resins. There are two possible explanations for this: first, the pyrolysis temperature is too low for CaCO3 to degrade into CaO; second, the limited hydrogen generation during pyrolysis may slow the hydrogenation rate of alkenes. Other forms of Ca, such as Ca salts, can serve as heat stabilizers in PE (which may also be Zn or Pd salts).8 These heat stabilizers may reduce the thermal degradation rate of PE. Therefore, PCR HDPE shows more C10+ products and a broader product distribution compared to virgin HDPE resins (Fig. 3A). PP usually does not contain stabilizers.52 Although PCR PP also has a slightly wider distribution of products, it is not as significant as that for PCR HDPE.
Despite the changes in the oil compositions, the main challenge in pyrolyzing PCR plastics remains the removal of impurities from the plastic oils and managing the carryover of impurities from different plastic sources (Table 2). While pyrolysis with the distillation process can remove 80–90 wt% of the metal contents, the issue of impurity removal persists.
5. Conclusions
Seven types of virgin and PCR plastics, including PCR HDPE, PCR PP, and virgin resins with varying molecular weights of HDPE, LDPE, LLDPE, and PP, were pyrolyzed in a fluidized bed reactor. The polymer structure had the greatest influence on pyrolysis product distributions, while the molecular weight had the least impact. The predominant compounds found in the pyrolysis oils were alkanes, alkenes, alkadienes, aromatics, and dicyclo-aromatics, with variations in their composition observed across different plastic feedstocks. HDPE oils had relatively higher yields of alkenes and alkadienes and lower yields of alkanes. In contrast, LLDPE oils showed lower yields of alkenes and alkadienes but higher yields of alkanes and aromatics compared to HDPE oils; PP oils had even lower yields of alkenes and alkadienes with higher yields of alkanes and aromatics. This is because branches in polyolefins are usually identified as thermal defects where polymer degradation is initiated; therefore, with more branch structures, more secondary reactions occur, resulting in a lower yield of alkenes.DFT calculations also revealed that in the absence of branches or with a methyl group branch, cleavage of the polymer C–C backbone required 365.4 kJ mol−1 and 321.3 kJ mol−1 for HDPE and PP, respectively. Conversely, in polymers like LDPE and LLDPE, where branches contain more than one carbon, branch cleavage from the backbone occurred first, requiring lower energy (305.4 kJ mol−1) and forming internal olefins. Higher branch density in PE resulted in increased concentrations of aromatics and branched and non-branched alkanes due to more frequent secondary reactions.
Pyrolysis oil derived from PCR HDPE and PCR PP contained a higher proportion of branched compounds compared to virgin plastics. Additives, such as trace elements present in PCR plastics, could potentially promote the isomerization of linear hydrocarbons to branched forms during pyrolysis. While pyrolysis effectively eliminated most trace elements, additional purification steps may be necessary for the resulting oils.
Data availability
The data supporting the results of this study are included within the manuscript and in the ESI.† For any further data requests, please reach out to the corresponding author. Your inquiry will be promptly addressed to enhance the understanding of the research.Conflicts of interest
All authors declare that they have no conflicts of interest.Acknowledgements
This work was supported by the U.S. Department of Energy, Office of Energy Efficiency and Renewable Energy, Bioenergy Technologies Office under Award Number DEEE0009285. Computations were partially performed using resources at the National Energy Research Scientific Computing Center, a DOE Office of Science User Facility supported by the Office of Science of the U.S. Department of Energy under Contract No. DE-AC02-05CH11231 using NERSC Award BES-ERCAP0027367.References
-
M. Garside, Global plastic production 1950-2022, Statista, 2024 Search PubMed
.
- R. Geyer, J. R. Jambeck and K. L. Law, Sci. Adv., 2017, 3, e1700782 CrossRef PubMed
- Advancing Sustainable Materials Management: 2018 Tables and Figures United States Enviornmental Protection Angency, 2020.
- H. Li, H. A. Aguirre-Villegas, R. D. Allen, X. Bai, C. H. Benson, G. T. Beckham, S. L. Bradshaw, J. L. Brown, R. C. Brown, V. S. Cecon, J. B. Curley, G. W. Curtzwiler, S. Dong, S. Gaddameedi, J. E. García, I. Hermans, M. S. Kim, J. Ma, L. O. Mark, M. Mavrikakis, O. O. Olafasakin, T. A. Osswald, K. G. Papanikolaou, H. Radhakrishnan, M. A. Sanchez Castillo, K. L. Sánchez-Rivera, K. N. Tumu, R. C. Van Lehn, K. L. Vorst, M. M. Wright, J. Wu, V. M. Zavala, P. Zhou and G. W. Huber, Green Chem., 2022, 24, 8899–9002 RSC
-
D. I. W. Posch, in Applied Plastics Engineering Handbook, ed. M. Kutz, William Andrew Publishing, 2nd edn, 2017, pp. 27–53, DOI:10.1016/B978-0-323-39040-8.00002-X
- K. Ragaert, L. Delva and K. Van Geem, Waste Manage., 2017, 69, 24–58 CrossRef CAS PubMed
-
T. Hundertmark, M. Mayer, C. McNally, T. J. Simons and C. Witte, How plastics waste recycling could transform the chemical industry, McKinsey & Company, 2018 Search PubMed
- M. Kusenberg, A. Eschenbacher, M. R. Djokic, A. Zayoud, K. Ragaert, S. De Meester and K. M. Van Geem, Waste Manage., 2022, 138, 83–115 CrossRef CAS PubMed
- S. Dong, T. Ryu, C. Oi, J. Wu, N. R. Altvater, R. Hagmann, Z. Alikhani, E. A. Lebrón-Rodríguez, J. H. Jansen, V. S. Cecon, G. W. Curtzwiler, K. L. Vorst, G. W. Huber and I. Hermans, Chem. Eng. J., 2024, 482, 148889 CrossRef CAS
- H. Li, J. Wu, Z. Jiang, J. Ma, V. M. Zavala, C. R. Landis, M. Mavrikakis and G. W. Huber, Science, 2023, 381, 660–666 CrossRef CAS PubMed
- H. Li, A. Cutherbertson, A. A. Alamer, V. S. Cecon, H. Radhakrishnan, J. Wu, G. W. Curtzwiler, K. L. Vorst, X. Bai, C. R. Landis, G. T. Beckham and G. W. Huber, Green Chem., 2024 10.1039/D4GC01013B
- M. Kusenberg, A. Zayoud, M. Roosen, H. D. Thi, M. S. Abbas-Abadi, A. Eschenbacher, U. Kresovic, S. De Meester and K. M. Van Geem, Fuel Process. Technol., 2022, 227, 107090 CrossRef CAS
- M. S. Abbas-Abadi, M. Kusenberg, A. Zayoud, M. Roosen, F. Vermeire, S. Madanikashani, M. Kuzmanović, B. Parvizi, U. Kresovic, S. De Meester and K. M. Van Geem, Waste Manage., 2023, 165, 108–118 CrossRef CAS PubMed
- B. A. Perez and H. E. Toraman, J. Anal. Appl. Pyrolysis, 2024, 177, 106376 CrossRef CAS
- J. V. J. Krishna, B. A. Perez and H. E. Toraman, ACS Sustainable Chem. Eng., 2024, 12, 7508–7518 CrossRef
- Y. Zhang, Z. Fu, W. Wang, G. Ji, M. Zhao and A. Li, ACS Sustainable Chem. Eng., 2022, 10, 91–103 CrossRef CAS
- D. Zhao, X. Wang, J. B. Miller and G. W. Huber, ChemSusChem, 2020, 13, 1764–1774 CrossRef CAS PubMed
-
M. J. Frisch, G. W. Trucks, H. B. Schlegel, G. E. Scuseria, M. A. Robb, J. R. Cheeseman, G. Scalmani, V. Barone, B. Mennucci, G. A. Petersson, H. Nakatsuji, M. Caricato, X. Li, H. P. Hratchian, A. F. Izmaylov, J. Bloino, G. Zheng, J. L. Sonnenberg, M. Hada, M. Ehara, K. Toyota, R. Fukuda, J. Hasegawa, M. Ishida, T. Nakajima, Y. Honda, O. Kitao, H. Nakai, T. Vreven, J. A. Montgomery Jr., J. E. Peralta, F. Ogliaro, M. J. Bearpark, J. J. Heyd, E. N. Brothers, K. N. Kudin, V. N. Staroverov, T. A. Keith, R. Kobayashi, J. Normand, K. Raghavachari, A. P. Rendell, J. C. Burant, S. S. Iyengar, J. Tomasi, M. Cossi, N. Rega, J. M. Millam, M. Klene, E. Knox, J. B. Cross, V. Bakken, C. Adamo, J. Jaramillo, R. Gomperts, R. E. Stratmann, O. Yazyev, A. J. Austin, R. Cammi, C. Pomelli, J. W. Ochterski, R. L. Martin, K. Morokuma, V. G. Zakrzewski, G. A. Voth, P. Salvador, J. J. Dannenberg, S. Dapprich, A. D. Daniels, O. Farkas, J. B. Foresman, J. V. Ortiz and J. Cioslowski, and D. J. Fox, Gaussian 09, Gaussian, Inc., Wallingford CT, 2009 Search PubMed
- L. K. Krehula, Z. Katančić, A. P. Siročić and Z. Hrnjak-Murgić, J. Wood Chem. Technol., 2014, 34, 39–54 CrossRef CAS
-
G. S. Misra, Introductory polymer chemistry, New Age International, 1993 Search PubMed
- J. Fang, L. Zhang, D. Sutton, X. Wang and T. Lin, J. Nanomater., 2012, 2012, 382639 CrossRef
- J. Peyroux, M. Dubois, E. Tomasella, L. Frézet, A. P. Kharitonov and D. Flahaut, Eur. Polym. J., 2015, 66, 18–32 CrossRef CAS
- Z. Wang, S. Li, B. Li, W. Lai, Y. Liu, Z. Cheng, X. Wang and X. Liu, J. Fluorine Chem., 2017, 200, 169–178 CrossRef CAS
- M. Pollard, K. Klimke, R. Graf, H. W. Spiess, M. Wilhelm, O. Sperber, C. Piel and W. Kaminsky, Macromolecules, 2004, 37, 813–825 CrossRef CAS
- Z. Zhou, S. Pesek, J. Klosin, M. S. Rosen, S. Mukhopadhyay, R. Cong, D. Baugh, B. Winniford, H. Brown and K. Xu, Macromolecules, 2018, 51, 8443–8454 CrossRef CAS
- L. A. Wall and S. Straus, J. Polym. Sci., 1960, 44, 313–323 CrossRef CAS
- L. A. Wall, S. L. Madorsky, D. W. Brown, S. Straus and R. Simha, J. Am. Chem. Soc., 1954, 76, 3430–3437 CrossRef CAS
- I. Ahmad, M. I. Khan, H. Khan, M. Ishaq, R. Tariq, K. Gul and W. Ahmad, Int. J. Green Energy, 2015, 12, 663–671 CrossRef CAS
- R. E. Harmon, G. SriBala, L. J. Broadbelt and A. K. Burnham, Energy Fuels, 2021, 35, 6765–6775 CrossRef CAS
- T. Shiono, S. Yoshida, H. Hagihara and T. Ikeda, Appl. Catal., A, 2000, 200, 145–152 CrossRef CAS
-
C. Maier and T. Calafut, in Polypropylene, ed. C. Maier and T. Calafut, William Andrew Publishing, Norwich, NY, 1998, pp. 3–9, DOI:10.1016/B978-188420758-7.50006-0
-
M. Tolinski, in Additives for Polyolefins, ed. M. Tolinski, William Andrew Publishing, Oxford, 2009, pp. 93–119, DOI:10.1016/B978-0-8155-2051-1.00007-8
-
P. Hiremath, K. Nuguru and V. Agrahari, in Handbook of Pharmaceutical Wet Granulation, ed. A. S. Narang and S. I. F. Badawy, Academic Press, 2019, pp. 263–315, DOI:10.1016/B978-0-12-810460-6.00012-9
-
M. Tolinski, in Additives for Polyolefins, ed. M. Tolinski, William Andrew Publishing, Oxford, 2009, pp. 137–156, DOI:10.1016/B978-0-8155-2051-1.00009-1
- A. Ranji, M. G. Ravandi and M. A. Farajzadeh, Anal. Sci., 2008, 24, 623–626 CrossRef CAS PubMed
- W. Zeb, M. Roosen, P. Knockaert, S. Janssens, D. Withoeck, M. Kusenberg, J. Hogie, P. Billen, S. Tavernier, K. M. Van Geem and S. De Meester, J. Cleaner Prod., 2023, 416, 137881 CrossRef CAS
- J. A. González-Pérez, N. T. Jiménez-Morillo, J. M. de la Rosa, G. Almendros and F. J. González-Vila, J. Chromatogr., A, 2015, 1388, 236–243 CrossRef PubMed
- V. V. Kislov, A. I. Sadovnikov and A. M. Mebel, J. Phys. Chem. A, 2013, 117, 4794–4816 CrossRef CAS PubMed
- W. Hayduk and R. Castaneda, Can. J. Chem. Eng., 1973, 51, 353–358 CrossRef CAS
- D. Fleury and W. Hayduk, Can. J. Chem. Eng., 1975, 53, 195–199 CrossRef CAS
- C. T. Young, R. von Goetze, A. K. Tomov, F. Zaccaria and G. J. P. Britovsek, Top. Catal., 2020, 63, 294–318 CrossRef CAS
- G. J. P. Britovsek, R. Malinowski, D. S. McGuinness, J. D. Nobbs, A. K. Tomov, A. W. Wadsley and C. T. Young, ACS Catal., 2015, 5, 6922–6925 CrossRef CAS
- P. A. Cuello-Penaloza, R. G. Dastidar, S.-C. Wang, Y. Du, M. P. Lanci, B. Wooler, C. E. Kliewer, I. Hermans, J. A. Dumesic and G. W. Huber, Appl. Catal., B, 2022, 304, 120984 CrossRef CAS
- V. J. Triacca, P. E. Gloor, S. Zhu, A. N. Hrymak and A. E. Hamielec, Polym. Eng. Sci., 1993, 33, 445–454 CrossRef CAS
- D. Browarzik and A. Koch, J. Macromol. Sci., Part A: Pure Appl.Chem., 1996, 33, 1633–1641 CrossRef
- T. Ueno, E. Nakashima and K. Takeda, Polym. Degrad. Stab., 2010, 95, 1862–1869 CrossRef CAS
- H. Bockhorn, A. Hornung, U. Hornung and D. Schawaller, J. Anal. Appl. Pyrolysis, 1999, 48, 93–109 CrossRef CAS
- M. Seeger and H. J. Cantow, Makromol. Chem., 1975, 176, 2059–2078 CrossRef CAS
- B. Dickens, J. Polym. Sci., Polym. Chem. Ed., 1982, 20, 1169–1183 CrossRef CAS
- L. Zhao, Z. Guo, S. Ran, Z. Cao and Z. Fang, J. Therm. Anal. Calorim., 2014, 115, 1235–1244 CrossRef CAS
- A. Dhar, R. L. Vekariya and P. Bhadja, Cogent Chem., 2018, 4, 1514686 CrossRef
-
V. Ambrogi, C. Carfagna, P. Cerruti and V. Marturano, in Modification of Polymer Properties, ed. C. F. Jasso-Gastinel and J. M. Kenny, William Andrew Publishing, 2017, pp. 87–108, DOI:10.1016/B978-0-323-44353-1.00004-X
- Y. Schächter and H. Pines, J. Catal., 1968, 11, 147–158 CrossRef
Footnote |
| † Electronic supplementary information (ESI) available. See DOI: https://doi.org/10.1039/d4gc04029e |
| This journal is © The Royal Society of Chemistry 2024 |