 Open Access Article
Effect of density and thickness of flexible polyurethane foam on the performance of triboelectric nanogenerators†
Ahmed Abdelhamid
Maamoun
a,
Ahmed Adel
Mahmoud
a,
David Magdy
Naeim
b,
Mustafa
Arafa
 *b and
Amal M. K.
Esawi
 b
b
aDepartment of Engineering Physics and Mathematics, Chemistry Division, Faculty of Engineering, Ain Shams University, 1 EL-Sarayat Street-Abdo Basha Sq., Cairo, 11517, Egypt
bDepartment of Mechanical Engineering, The American University in Cairo, AUC Avenue, P.O. Box 74, New Cairo 11835, Egypt. E-mail: mharafa@aucegypt.edu
First published on 19th June 2024
Abstract
Triboelectric nanogenerators (TENGs) offer an attractive approach for energy harvesting for self-powered devices. Improving the output performance of TENGs depends on many factors, including the density and thickness of the materials used. In this study, flexible polyurethane foam (FPU) with different densities of 17, 22, 26, and 33 kg m−3 was fabricated by altering the isocyanate index and water content during preparation and the effect on the TENG's output voltage was investigated. Additionally, the effect of changing the thickness of FPU (namely, 4, 6, 8, and 10 mm) for each density on the TENG's output voltage was also examined. The chemical structure and pore morphology of the FPU foams were investigated using FTIR and FESEM. The findings of the study indicate that increasing the isocyanate index and water content led to the formation of larger cavities and pores, resulting in reduced densities and increased porosity. In addition, the compression test results demonstrated that the compressive strength of FPU foam increased as the isocyanate index and water content decreased. The results obtained from the TENG device showed that increasing the applied frequency and the FPU density caused an increase in the output voltage, while increasing the thickness resulted in a drop in the output voltage. Therefore, FPUs with a higher density (33 kg m−3) and a smaller thickness (4 mm) produce a higher output voltage. In addition, the FPU-based TENG achieved a maximum power density of 0.025 mW cm−2 under the conditions of a 5 Hz frequency, 20 MΩ resistance, and 4.8 N force. The TENG device effectively charged a 10 μF capacitor to 15.4 V in approximately 60 seconds, storing 1185.8 μJ of energy. This energy was utilized to illuminate four white commercial LEDs connected in series. Hence, the FPU-based TENG has promising prospects for applications involving the powering of electronics and energy storage.
1. Introduction
Exploiting renewable energy has gained increased relevance in light of the continuous development of the global economy, the depletion of non-renewable resources, and the threat of environmental deterioration.1,2 As a result, considerable efforts have been made to find alternative and sustainable sources of energy in order to mitigate these challenges.Triboelectric nanogenerators (TENGs) are a category of sustainable energy harvesting devices that function by leveraging the triboelectric effect, a phenomenon characterised by the exchange of electrons between two materials with distinct electronegativities.3 TENGs can enable electrical energy generation without the requirement of an external power source, making them a viable and promising approach for the production of sustainable energy.4 They can be constructed using various techniques, including freestanding, single electrode, lateral sliding, and vertical contact separation.5 Due to its high efficiency, ease of use, and high stability, vertical contact separation is the most popular of these techniques and is therefore a good choice for a variety of applications in energy harvesting and self-powered sensing.6–8 Several factors, including materials used, contact area, contact force, and separation distance, can be adjusted to control and optimize the output of TENG devices.9
The operating principle of TENGs relies on electrostatic induction and triboelectrification between two tribopolar materials with distinct triboelectric properties: one with a tendency to donate electrons (referred to as tribopositive), and the other tends to accept electrons (referred to as tribonegative). When these materials come into contact, electrons are transferred from one material to the other, resulting in charge separation. Due to the charge imbalance, the separation of the materials generates an electric field that can derive electrons through an external circuit and produce an electrical current.10,11 Metals have traditionally been utilized as tribopositive materials in TENGs because of their high conductivity. However, the use of metals in TENGs is associated with several disadvantages, such as corrosion, degradation, and oxidation.12,13 These factors can result in a decline in the performance of TENGs over time. Therefore, it is essential to seek alternative materials that offer both durability and high electrical output for TENG applications. Generally, porous polymeric materials are more efficient in TENG than dense and compact materials because charges are induced not only on the material's surface, but also from the material's inner pores during deformation, resulting in a higher electrical output.14 In 2014, foams were first incorporated into TENGs to harness the benefits of their porous nature.15 Lee et al.16 demonstrated the successful fabrication of a hydrophobic sponge based TENG, utilizing a polymer composite of polydimethylsiloxane (PDMS) and polystyrene foam. Their findings revealed that the TENG device produced an output of 130 V and 100 μA cm−2 at 90 N. Kamaruzaman et al.17 investigated the utilization of recycled polystyrene (rPS) foam combined with zinc oxide (ZnO) nanoparticles for applications in TENG devices. Their findings revealed that the untreated rPS generated an output voltage of 3.8 V at 2 N with a power density of 6.2 μW cm−2. In contrast, the rPS-ZnO composite TENG demonstrated significant performance improvements, achieving an output voltage of 8.2 V (a two-fold increase) and a power density of 28.1 μW cm−2 (a 4.5-fold enhancement). Ren et al.18 developed a TENG using foam and polyvinyl chloride (PVC) as triboelectric materials. Their findings demonstrated that the device achieved an open-circuit voltage of 224.26 V and a short-circuit current of 2.74 mA. Wu et al.19 designed a sensor-based TENG by combining porous PDMS foam and serpentine silver nanowires. This device yielded an open circuit voltage of 78.7 V when subjected to a contact force of 10 N.
Among all foam materials, flexible polyurethane (FPU) is a promising material characterized by its unique three-dimensional porous network that can be used in TENG devices for various applications. FPU exhibits several desirable characteristics, such as versatility, functionality, porosity, lightweight, breathability, flexibility, compressibility, durability and low cost compared to other porous materials.20 FPU is a synthetic polymer composed of urethane (NHCOO) moieties.21 It has various applications, including sound absorption,22 bedding,23 and automotive interior.24 The architecture of FPU foam consists of soft and hard segments, which provide flexibility and rigidity, respectively.25 The synthesis of FPU involves two significant reactions: one is between polyol (OH) and diisocyanate (NCO) to yield NHCOO, named gelling reaction, and the other is between NCO and water to produce carbon dioxide (CO2), urea and biuret linkages, termed the blowing reaction.26,27 The two reactions occur simultaneously, and their rate depends on temperature, amount of blowing agent and isocyanate index. The isocyanate index, represented by the (NCO/OH) ratio, influences the density and mechanical performance of the FPU foam.28 An increase in the isocyanate index and in water content, leads to an increase in the blowing reaction and consequently a reduction in the foam density. Furthermore, it has been shown that an increased isocyanate index is associated with a greater rigidity in the FPU foam, whereas a decreased isocyanate index leads to a higher level of elasticity. Hence, changing the isocyanate index during the preparation of FPU foam can provide a degree of control over its properties, which can be advantageous for its use as a tribopositive layer in TENGs.
Several investigations have been conducted to enhance the electrical characteristics of FPU foam by the use of fillers during the synthesis process or by the application of surface coatings. Weldemhret et al.20 for instance, demonstrated that incorporating carbon into FPU foam could improve its electrical properties. The findings of their study revealed that FPU/carbon composites generated an output of 36 V and 100 V while walking and running, respectively, at a contact force of 20N and a frequency of 6 Hz. These results indicate the promising potential of such composites in shoe insoles. The current authors modified FPU foam through the incorporation of natural montmorillonite (Na-MMT) nanoclay at different weight ratios (0.1, 0.3, 0.5, and 0.7 wt%) and reported an output voltage of 164 V for the FPU/Na-MMT0.3 when tested at a force of 4.8 N and a frequency of 5 Hz corresponding to an increase of 62.37% compared to pristine FPU.29 Liu et al.30 studied the effect of polyaniline coating on the electrical properties of FPU foam. They reported that the modified material could produce an output of 570 V at 60% deformation, due to the polyaniline coating's high contact area. Nevertheless, it is important to note that both methods have their own limitations, since the presence of excessive filler material might potentially lead to agglomeration, hence negatively impacting the cellular structure of the foam.29,31 On the other hand, surface coatings have a physical bond with the polymer matrix and are susceptible to degradation when exposed to water.20 In addition, the application of coatings involves a significant investment of time and capital. The aforementioned drawbacks can have a detrimental effect on the long-term effectiveness of TENG. Consequently, it is crucial to develop strategies that enhance the flexibility and durability of FPU foam without compromising its mechanical properties. One approach involves modifying the isocyanate index and water content during the production process of FPU which is expected to significantly impact the characteristics of the foam, including density, functionality, porosity, and mechanical performance. This, in turn, can influence the FPU foam's electrical characteristics.
The objective of the current study is to investigate the impact of modifying the isocyanate index and water content during FPU foam fabrication on the performance of TENG. The purpose is to determine the optimal formulation that yields the maximum output voltage when implemented in the TENG device. In addition, an investigation was conducted to assess the impact of different FPU thicknesses on the generated output voltage of the TENG. Moreover, the prepared material's chemical structure, morphology, porosity, density, thermal stability, and compression performance were also studied. Finally, the fabricated FPU-based TENG device was characterized by measuring the output voltage, current, and power density under varying load resistances.
2. Experimental section
2.1 Materials
Different densities from FPU foam were fabricated using polyether polyol, marketed under the trade name of Desmophen 1905 N, provided by Covestro Co. (Germany) with an OH number of 41.5–45.5 mg of KOH per g, styrene-acrylonitrile solid content 10 wt%. Lupranate T80, a mixture of 80% 2,4 and 20% 2,6 toluene diisocyanate (TDI) with an NCO content of 48.2 wt % and a molecular weight of 174.2 g mol−1, was used as the diisocyanate and was supplied by BASF polyurethanes (Germany). Struksilon 8146 was used as stabilizer, supplied by Schill + Seilacher GmbH (Germany). Struksilon Amine 33, a compound of 33.3% triethylenediamine and 66.7% dipropylene glycol, was employed as amine catalyst, purchased from Schill + Seilacher GmbH (Germany). Stannous octoate was provided by Air product (UK) as Dabco T-9. The chemical blowing agent used was distilled water sourced from our laboratory.2.2 Synthesis of FPU foam with different densities
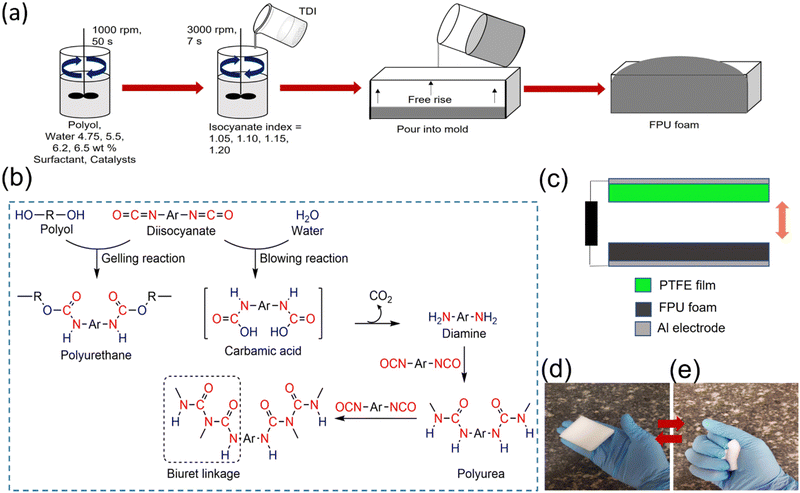
FPU foams of varying densities were synthesized using a laboratory-scale one-shot process. The polyol was dried for 24 hours at 105 °C to eliminate any residual moisture and subsequently cooled to ambient temperature. The polyol was combined with a distilled water-blowing agent in several weight ratios, specifically 4.75, 5.5, 6.2, and 6.5 wt %. Additionally, silicon surfactant, tertiary amine and stannous octoate were added in different ratios for each formulation, as specified in Table 1. The ratios were adjusted in order to regulate the exothermic reaction and the amount of rise in foam level. The mixing process was conducted in a polypropylene vessel for 50 seconds at a rotational speed of 1000 rpm. To ensure the thorough dispersion of the catalysts, the amine and stannous octoate were diluted in the polyol, utilizing ratios of 1![[thin space (1/6-em)]](https://www.rsc.org/images/entities/char_2009.gif) :
:![[thin space (1/6-em)]](https://www.rsc.org/images/entities/char_2009.gif) 3 and 1
3 and 1![[thin space (1/6-em)]](https://www.rsc.org/images/entities/char_2009.gif) :
:![[thin space (1/6-em)]](https://www.rsc.org/images/entities/char_2009.gif) 2 by weight, respectively, prior to their incorporation. Subsequently, TDI was introduced into the polyol system and vigorously stirred for 7 seconds at 3000 rpm. Fig. 1a presents a schematic of the process employed for the production of FPU foam. The resulting mixture was promptly poured into a mould measuring 200 × 200 × 150 mm, and the foam was allowed to rise freely and cure for 48 hours prior to being sectioned for measurements. The reaction scheme of FPU preparation is illustrated in Fig. 1b. The amount of TDI was calculated according to the following equation:
2 by weight, respectively, prior to their incorporation. Subsequently, TDI was introduced into the polyol system and vigorously stirred for 7 seconds at 3000 rpm. Fig. 1a presents a schematic of the process employed for the production of FPU foam. The resulting mixture was promptly poured into a mould measuring 200 × 200 × 150 mm, and the foam was allowed to rise freely and cure for 48 hours prior to being sectioned for measurements. The reaction scheme of FPU preparation is illustrated in Fig. 1b. The amount of TDI was calculated according to the following equation: | (1) |
| Materials | Formulations (Pphpa) | |||
|---|---|---|---|---|
| FPU1.05 | FPU1.10 | FPU1.15 | FPU1.20 | |
| a Pphp: part per hundred parts of polyol by weight. | ||||
| Polyol | 100 | 100 | 100 | 100 |
| TDI | 55 | 66 | 77 | 84 |
| Distilled water | 4.75 | 5.50 | 6.20 | 6.50 |
| Silicon surfactant | 1.95 | 2.20 | 2.23 | 2.40 |
| Stannous octoate | 0.5 | 0.48 | 0.56 | 0.65 |
| Tertiary amine | 0.95 | 0.64 | 0.75 | 0.63 |
| Isocyanate index | 1.05 | 1.10 | 1.15 | 1.20 |
2.3 Fabrication of FPU-based TENG
Fig. 1c illustrates the vertical contact separation mode exhibited by the TENG device. The construction of the TENG entailed the use of FPU foam, which served as a static layer, functioning as the tribopositive layer due to its electron-donating capability. Fig. 1d and e display the original shape of the prepared FPU and its degree of flexibility, respectively. In contrast, polytetrafluoroethylene (PTFE) film, a movable layer, was chosen as a tribonegative layer due to its superior electron-attracting capability. Aluminium (Al) adhesive tapes were employed to construct the electrodes on the upper and lower surfaces. Subsequently, the fabricated TENG device was connected to a digital oscilloscope in order to measure the output voltage. The contact area of the TENG device was 8 × 5.5 cm2.2.4 Characterization of the prepared FPU foams
The Thermo Scientific Nicolet FTIR instrument was utilized, employing attenuated total reflection (ATR) mode to examine the chemical structure of the prepared FPU foams. In transmission mode, four samples were scanned within the frequency range of 400–4000 cm−1, with a resolution of 4 cm−1. A field-emission scanning electron microscope (FESEM, Thermo Scientific Quattro S) was employed to investigate the morphology of the produced FPU foams. The analysis was conducted under a magnification of 50× and an accelerating voltage of 10 kV. ImageJ software was used to analyze the SEM images and obtain the average pore and cavity diameters. The porosity of the FPU foams was evaluated using the following formula: | (2) |
The apparent density of FPU foams was calculated as the mass-to-volume ratio of a sample taken from the midsection of the foam block. The thermal decomposition behavior of FPU foam was studied using a LABSYS EVO TGA (SETARAM) instrument. Differential thermogravimetric analysis (DTG) data were also reported. Samples were deposited in platinum pans and heated in nitrogen gas at a constant rate of 10 °C min−1 between 25–600 °C. The compression strength of FPU foams was assessed using the ZwickRoell/Z100 universal testing machine, in accordance with the testing procedure specified in the ASTM D-3574-17 test C. The cell load applied was 1 kN, with a crosshead displacement rate of 50 mm min−1 and a deformation level of 50%. The sample dimensions were 50 × 50 × 40 mm3 (length × width × height). The effect of modifying the density and thickness of the FPU foams on the output voltage of the TENG was investigated.
Mechanical testing was conducted by mounting the FPU foam sample on a rigid horizontal surface while attaching an upper PTFE film to a cam-operated oscillating arm that causes cyclic contact and separation between the layers. The cam is driven by an electric motor whose speed is varied to test the device at different frequencies. In addition, the applied force was measured by a straight bar load cell. The output voltage was measured using a mixed domain oscilloscope (Tektronix MDO 3024).
The magnitude of the voltage signal was evaluated over a complete cycle, from peak to peak, at three distinct forces of 3.8 N, 4 N, and 4.8 N and frequencies of 2.5 Hz, 3.75 Hz, and 5 Hz. Four densities of FPU were prepared and examined, and the influence of four different thicknesses (4, 6, 8, and 10 mm) from each density on the output voltage of the TENG device was studied.
3. Results and discussion
3.1 Fourier transform infrared (FTIR) spectroscopy
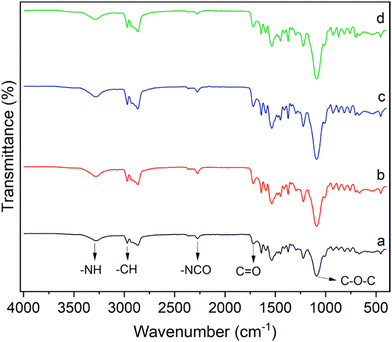
FTIR spectroscopy was used to investigate the chemical structure of the produced FPU foam. Fig. 2a–d illustrates the typical FTIR pattern for FPU foam samples. The FTIR spectra exhibit all the well-defined bands that are characteristic of FPU foam: the band at 3280 cm−1 is attributed to urethane (–NH) stretching vibrations,32 whereas the bands at 2970 and 2807 cm−1 are attributed to asymmetric and symmetric aliphatic (C–H) stretching vibrations of CH2 groups, respectively.33 All samples exhibited a band at 2275 cm−1 ascribed to unreacted NCO groups.34 In addition, the band at 1720 cm−1 is attributed to unbonded urethane carbonyl groups (C![[double bond, length as m-dash]](https://www.rsc.org/images/entities/char_e001.gif) O) stretching vibrations, the band at 1640 cm−1 to monodentate H-bond urea C
O) stretching vibrations, the band at 1640 cm−1 to monodentate H-bond urea C![[double bond, length as m-dash]](https://www.rsc.org/images/entities/char_e001.gif) O groups,35 the band at 1533 cm−1 to N–H bending vibrations, the band at 1296 cm−1 to C–H bending vibrations of –CH3 groups, and the band at 1089 cm−1 to C–O–C stretching vibrations.22,36
O groups,35 the band at 1533 cm−1 to N–H bending vibrations, the band at 1296 cm−1 to C–H bending vibrations of –CH3 groups, and the band at 1089 cm−1 to C–O–C stretching vibrations.22,36
3.2 Scanning electron microscopy (SEM) analysis
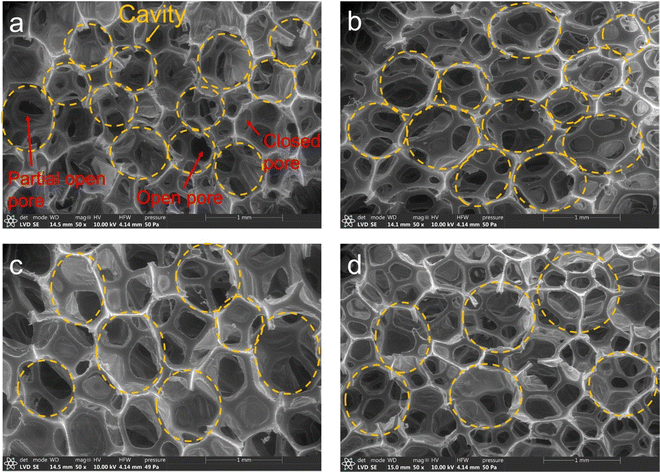
The effect of changing the isocyanate index and water content on the morphological structure of FPU foam was investigated. The SEM micrographs of the FPU foams are presented in Fig. 3. It is worth noting that all samples display cavities and pores of varying sizes. The mechanism of cavity formation can be explained as follows: the reaction between isocyanate and water initiates the generation of CO2 gas, which subsequently expands until it encounters adjacent cavities. Pores are formed when the narrow hollow walls cannot withstand pressure from either side. The type of pores that emerge is contingent upon the cavity walls' thickness and the liquid and gas drainage flow rate. Closed pores develop when the polymerization reaction is completed prior to the rupture of the cavity walls; in this case, the walls of cavities are strong enough to withstand the gas pressure. Conversely, open pores arise due to the reduced strength of the walls and a high flow rate of drainage within the thin cavity walls. On the other hand, partial open pores occur when the wall strength is elevated, and the drain flow rate is low; in this case, the pores may be neither fully closed nor completely open.37–39It was found that increasing isocyanate index and water contents resulted in the formation of larger cavities and pores, as presented in Table 2. The average cavity diameter for FPU1.05 was 0.562 ± 0.058 mm. Increasing the isocyanate index and water content increased cavity diameter by 24.02%, 28.29%, and 56.93% for FPU1.10, FPU1.15, and FPU1.20, respectively. The average pore diameter followed the same trend. This is because decreasing the isocyanate index and the water content in FPU foam formulations limits the generation of CO2 gas during the foam rise. This, in turn, decreases the growth of foam cavities, producing foam with smaller cavities and pores. Therefore, it is crucial to carefully adjust the ratios to achieve the desired cellular structure that gives the highest output voltage.
| Sample | Average cavity diameter (mm) | Average pore diameter (mm) |
|---|---|---|
| FPU1.05 | 0.562 ± 0.058 | 0.197 ± 0.075 |
| FPU1.10 | 0.697 ± 0.084 | 0.25 ± 0.1 |
| FPU1.15 | 0.721 ± 0.103 | 0.271 ± 0.08 |
| FPU1.20 | 0.882 ± 0.047 | 0.275 ± 0.09 |
3.3 Porosity
The porosity of FPU foam is a significant attribute that is expected to have a direct impact on the performance output of TENGs. Typically, porous materials have superior output performance in comparison to compact materials13,15,40,41 due to the improved contact area and electrostatic induction between the triboelectric layers during the process of cyclic contact separation. Table 3 presents the values for the open porosity of the prepared FPU foams. It is clearly observed that the porosity increases with the increase in isocyanate index and water ratios. This can be attributed to enhanced CO2 gas generation from the isocyanate-water reaction, which produces more pores during foam rise resulting in a cellular structure that is less dense. However, it is essential to carefully optimize the isocyanate index and water ratios during FPU production in order to prevent the formation of excessive voids/pores and attain the necessary balance between porosity and other material properties, particularly for use in TENG devices.| Sample | Porosity (%) | Density (kg m−3) |
|---|---|---|
| FPU1.05 | 69.6 ± 0.99 | 33 |
| FPU1.10 | 74.5 ± 1.04 | 26 |
| FPU1.15 | 77.1 ± 0.86 | 22 |
| FPU1.20 | 82.7 ± 0.49 | 17 |
3.4 Apparent density
The output voltage of the TENG device is expected to be significantly influenced by the FPU foam's density. This is because the density significantly impacts the contact surface area between triboelectric layers during the periodic contact separation process. The measured densities of the prepared FPU foams were calculated and presented in Table 3. It was found that increasing the isocyanate index and water content reduces the density of FPU foam. This can be attributed to the shift of the reaction towards increased blowing and less gelling. Consequently, a greater amount of carbon dioxide gas is produced. As a result, cell volume experiences an increase, leading to a reduction in density.3.5 Thermogravimetric analysis (TGA)
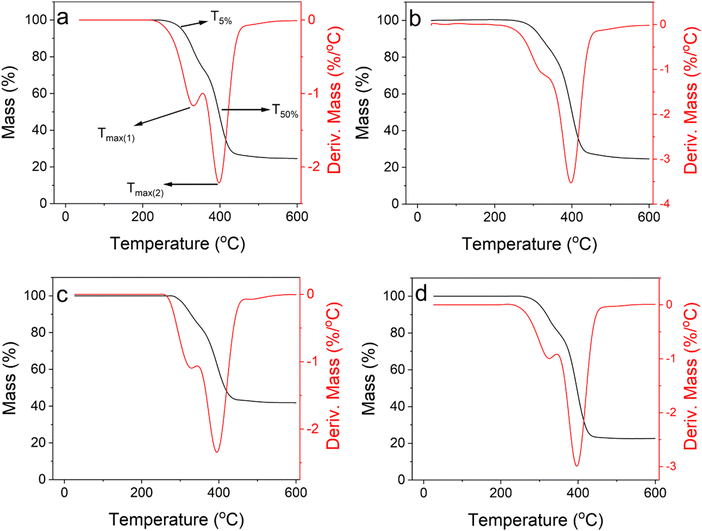
Prior to fabricating the TENG device, it is crucial to measure the thermal stability of the FPU foams to ensure that the developed foams can resist temperature fluctuations without deterioration. While temperature variations during TENG operation are not our focus in the present study, these may result from environmental conditions or periodic contact between two triboelectric layers, potentially affecting their stability and overall performance. The thermal stability of the manufactured FPU foams was examined using a TGA instrument in a nitrogen gas atmosphere. Fig. 4 demonstrates the TGA/DTG plots for the FPU samples. In addition, the thermal decomposition data, such as the temperature at which 5% and 50% of the mass is lost (T5% and T50%, respectively), and the maximum decomposition temperatures (Tmax1 and Tmax2) were determined and presented in Table 4. It is clearly noticed that the thermal degradation profiles for FPU samples revealed two primary decomposition stages with two maximum temperatures that are characteristic of FPU foams. The first stage, which falls within the temperature range of 250–350 °C, corresponds to the decomposition of hard domains such as urethane and urea.25 The urethane moieties are known to be thermally unstable, and the polyurethane structure influences its decomposition temperature.42 The urethane segment degrades via three scenarios: dissociation into isocyanate and polyol precursors, formation of carbamic acid and olefin with subsequent dissociation of carbamic acid into primary amine and carbon dioxide, and a formation of a secondary amine and carbon dioxide.43 On the other hand, the second stage, which occurs between 350–450 °C, is associated with the degradation of the polyol's soft segments.44| Sample | T 5% (°C) | T 50% (°C) | T max1 (°C) | T max2 (°C) |
|---|---|---|---|---|
| FPU1.05 | 301.36 | 396.89 | 324.04 | 396.18 |
| FPU1.10 | 303.29 | 400.14 | 324.41 | 396.63 |
| FPU1.15 | 310.93 | 415.73 | 329.28 | 396.10 |
| FPU1.20 | 300.77 | 396.55 | 326.81 | 396.58 |
It was found that increasing isocyanate index, specifically in the range of 1.05–1.15, and water content significantly improved the FPU foam's thermal stability. The evidence for this enhancement is provided by a gradual increase in T5%, T50%, and Tmax1 values for FPU1.05, FPU1.10, and FPU1.15, as shown in Table 4. The enhanced thermal stability is ascribed to the development of an ordered pi-stacking network structure, which is a result of the aromatic rings present in TDI. This is facilitated by the higher NCO/OH ratio. This structural arrangement imparts some degree of rigidity, and stiffness, to the foam, delaying the onset of thermal deterioration and consequently increasing the thermal stability. However, FPU1.20 displayed a decrease in the thermal stability compared to other foam samples, possibly due to excess NCO by 20% promoting the formation of more volatile products, which accelerate degradation and hence decrease the thermal stability, as shown in Table 4. Finally, Tmax2 revealed no significant change since it mainly relies on the nature of the polyol employed, which remains the same across all formulations (see Table 1).
3.6 Compression behavior
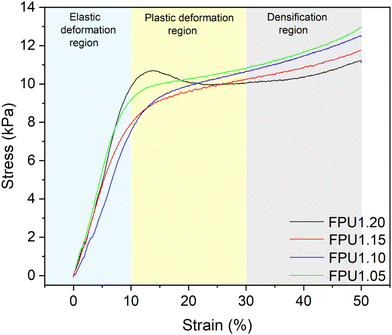
Fig. 5 presents the compression stress–strain curves of the prepared FPU foam at 50% deformation level. The compression plots showed three distinct regions: The first is elastic deformation (0–10%), wherein the stress and strain exhibit a linear relationship. The second region signifies plastic deformation (10–30%), where the material undergoes permanent deformation. The third region is densification (30–50%), whereby the material undergoes a reduction in voids, leading to the formation of a more compact structure.25,45The results suggest that there is a direct relationship between the decrease in isocyanate index and water content, and the increase in compression strength of the foam. This can be explained by a reduction in the blowing reaction between the isocyanate and water, resulting in the reduced production of CO2 gas. Consequently, the foam displays fewer open-cell structures and higher density, which improves its compression strength. Furthermore, FPU foams' compression properties can be closely linked to its pore morphology. Specifically, as the isocyanate index and water content decrease, the foams generate smaller cavities that may effectively resist the compression forces.
3.7 The output voltage of FPU-based TENG
Fig. 6a–e illustrates the working principle of the FPU-based TENG one-cycle process. TENG's operation mechanism generally is based on the coupling effect, triboelectrification, and electrostatic induction.46 In the initial position (Fig. 6a), the surfaces have no charge because the PTFE and foam are not in contact. When the two surfaces come into contact, the different electron affinities of the FPU and the PTFE film result in contact electrification at the interface, causing equivalent negative and positive charges (Fig. 6b). When PTFE begins to separate (Fig. 6c), the triboelectric charges become unbalanced. In order to attain electrical equilibrium, the positive charge on the surface of the FPU induces a negative charge on the Al electrode, causing electrons to travel from the ground to the electrode. Complete separation of the foam and PTFE surfaces (Fig. 6d) results in the induced negative triboelectric charges on the Al electrode, completely compensating for the positive triboelectric charges on the foam. When the PTFE re-approaches the surface of the foam (Fig. 6e), the induced negative charges on the Al electrode decrease, allowing the free electrons to return to the ground and resulting in an inverted output signal. This represents a single electricity generation cycle. New working cycles would begin during the periodical contact separation between the two triboelectric layers.47,48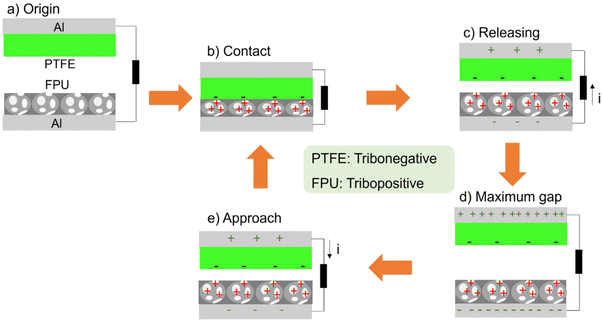 | ||
| Fig. 6 (a)–(e) Schematic illustration of the operating principal of the FPU-based TENG in vertical contact-separation mode. | ||
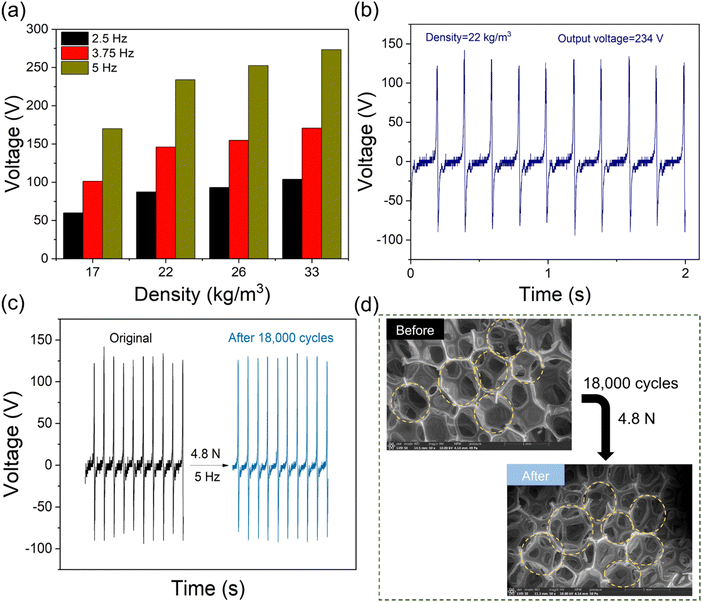
The durability and mechanical robustness of the fabricated materials employed in TENG devices are crucial for their practical applications. As an example, the durability of an FPU-based TENG with a density of 22 kg m−3 was evaluated by subjecting it to continuous contact-separation for 18![[thin space (1/6-em)]](https://www.rsc.org/images/entities/char_2009.gif) 000 cycles at a force of 4.8 N, as depicted in Fig. 7c. The results showed that there was no significant change in the output voltage signals of the TENG after continuous contact-separation for 18
000 cycles at a force of 4.8 N, as depicted in Fig. 7c. The results showed that there was no significant change in the output voltage signals of the TENG after continuous contact-separation for 18![[thin space (1/6-em)]](https://www.rsc.org/images/entities/char_2009.gif) 000 cycles, indicating the mechanical robustness and durability of the fabricated foam sheet. Additionally, SEM analysis was conducted before and after 18
000 cycles, indicating the mechanical robustness and durability of the fabricated foam sheet. Additionally, SEM analysis was conducted before and after 18![[thin space (1/6-em)]](https://www.rsc.org/images/entities/char_2009.gif) 000 cycles at a force of 4.8 N, as shown in Fig. 7d, to further investigate the mechanical robustness of the developed foam sample. The analysis clearly showed that the foam cavities did not collapse or undergo permanent deformation after the periodic contact-separation for 18
000 cycles at a force of 4.8 N, as shown in Fig. 7d, to further investigate the mechanical robustness of the developed foam sample. The analysis clearly showed that the foam cavities did not collapse or undergo permanent deformation after the periodic contact-separation for 18![[thin space (1/6-em)]](https://www.rsc.org/images/entities/char_2009.gif) 000 cycles, confirming a stable and robust foam morphology. This stability is crucial for long-term use and, consequently, a wide range of practical applications.
000 cycles, confirming a stable and robust foam morphology. This stability is crucial for long-term use and, consequently, a wide range of practical applications.
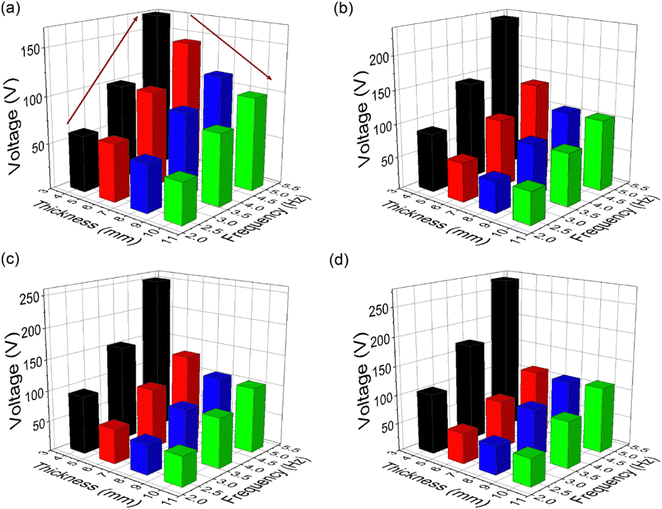 | ||
| Fig. 8 The relationship between the thickness of the FPU, applied frequency and output voltage of TENG for four different densities: (a) 17, (b) 22, (c) 26, and (d) 33 kg m−3. | ||
| Material | Generation mode | Applied frequency (Hz) | Force (N) | Contact area (cm2) | Output voltage (Voc) | Ref. |
|---|---|---|---|---|---|---|
| Bulk PU | TENG | 0.15 | 4 | 19.6 | 58.5 | 51 |
| Polystyrene foam | TENG | 10 | 90 | 1 × 1 | 130 | 16 |
| PDMS sponge | TENG | 1.6 | 6 | 3.7 × 3.7 | 181 | 52 |
| Porous PTFE | TENG | 30 | — | 2 × 2 | 5.1 | 53 |
| Porous PVDF | TENG | 10 | 16 | 90 | 54 | |
| FPU1.05 | TENG | 5 | 4.8 | 8 × 5.5 | 273 | This work |
| FPU1.10 | TENG | 5 | 4.8 | 8 × 5.5 | 252 | This work |
| FPU1.15 | TENG | 5 | 4.8 | 8 × 5.5 | 234 | This work |
| FPU1.20 | TENG | 5 | 4.8 | 8 × 5.5 | 170 | This work |
3.8 Characterization of TENG device
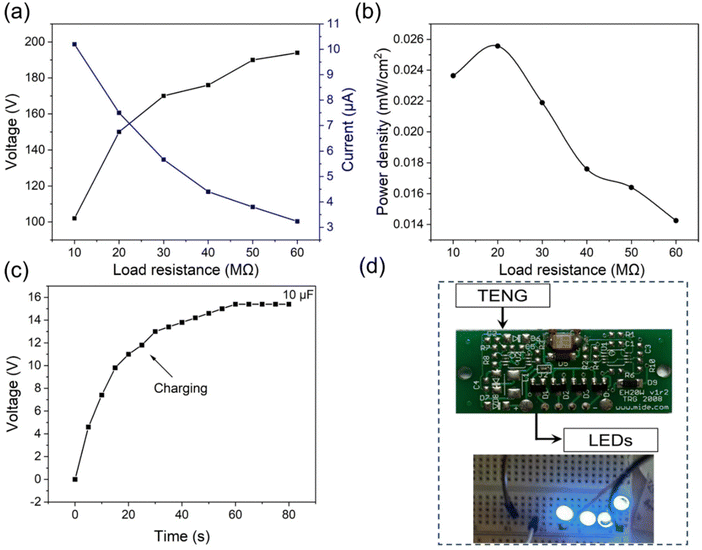
To assess the performance of the developed FPU-based TENG, the TENG device that was constructed using FPU foam with a density of 33 kg m−3 and a thickness of 4 mm was connected to different load resistances ranging from 10–60 MΩ. The output voltage, current, and power density were then measured while maintaining a constant force of 4.8 N and a frequency of 5 Hz. Fig. 9a illustrates the changes in output current and voltage in relation to different load resistances. The findings indicated a positive correlation between the load resistance and the output voltage, with the voltage peaking at 194 V when the resistance reached 60 MΩ. In contrast, the output current reaches a maximum value of 10.2 μA when the resistance is reduced to 10 MΩ, indicating the occurrence of a short circuit. The output current was found to decrease to 3.2 μA at 60 MΩ due to ohmic losses.12 The fabricated TENG device was used to supply power to a series connection of four commercial white Light-Emitting Diodes (LEDs) (please see ESI† Video S1). Additionally, to evaluate the effectiveness of an FPU-based TENG device, its power density, defined as the quantity of electrical power per unit area, was computed utilizing the following equations: | (3) |
 | (4) |
The correlation between power density and varying load resistances is illustrated in Fig. 9b. The findings show that the developed FPU-based TENG achieved a maximum power density of 0.025 mW cm−2 under a resistance of 20 MΩ, a contact area of 8 × 5.5 cm2, an applied force of 4.8 N, and a contact frequency of 5 Hz. The power density produced in this study was found to be satisfactory when compared to porous materials that have been described in the literature. For instance, Oh et al.55 fabricated a highly porous TENG based on TPU/PP layers for energy harvesting through human motion. The findings showed that at an applied force and frequency of 5 N and 8 Hz, respectively, the maximum power density at a load resistance of 10 MΩ was 0.9 μW cm−2. In another study, Gokarna et al.56 designed a TENG device for energy harvesting applications using an ultrathin porous PU membrane. The results indicated that the developed TENG obtained a maximum power density of 9.7 mW m−2 at a load resistance of 40 MΩ, a force of 4 N, and a contact area of 19.6 cm2.
In order to assess the charging capabilities of the constructed FPU-based TENG, it was connected to a rectifier circuit (model: Mide EH20W) with a capacitance of 10 μF. The capacitor's charging behavior curve is presented in Fig. 9c. It is evident that the TENG device charges the 10 μF capacitor and reaches a maximum value of 15.4 V in about 60 seconds, indicating the device's capability for rapid energy storage. The formula  48 can be employed to quantify the energy storage capacity, where E represents the energy stored, C denotes the capacitance of the capacitor, and V signifies the output voltage. It was found that the developed FPU-based TENG device could store 1185.8 μJ of energy using the 10 μF capacitor. Practically, this energy was effectively converted into power for four commercial white LEDs, as illustrated in Video S2 (ESI†) and Fig. 9d. Thus, the fabricated FPU-based TENG has a great potential for energy harvesting in microelectronic devices.
4. Conclusions
In this work, we conducted a thorough investigation to examine how modifying the density and thickness of the FPU triboelectric layer impacts the output voltage of the TENG device. Through the adjustment of the isocyanate index and water content during the foam preparation process, we were able to successfully produce four different densities of FPU foam. The chemical structure and morphology of FPU foams was investigated using the FTIR and FESEM techniques, respectively. The results demonstrated that higher isocyanate index and water content lead to an increased production of CO2 gas, resulting in the formation of larger cavities and pore diameters. As a consequence, the density of the FPU decreased while its porosity increased. In addition, the prepared foams' thermal stability was explored using a TGA device. The results showed that increasing the isocyanate index (1.05–1.15) and water content provides the foam structure with some rigidity, which arises from the pi-stacking of aromatic rings of the isocyanate, thus increasing thermal stability. The compression performance of the obtained foams was also examined, and the findings showed that the compression strength increased with a decrease in isocyanate index and water content. In addition, we examined how the applied force and contact frequency, FPU density, and FPU thickness impact the output voltage of the TENG device. The results demonstrated that higher applied frequencies and greater FPU densities positively influenced the output voltage. On the other hand, increasing the thickness of the FPU layer had an adverse effect, reducing the TENG's output voltage. In addition, the maximum power density of the FPU-based TENG device at a resistance of 20 MΩ, force of 4.8 N, and frequency of 5 Hz was found to be 0.025 mW cm−2 for an FPU thickness of 4 mm and density of 33 kg m−3. In addition, this device was capable of rapidly charging a 10 μF capacitor to 15.4 V in 60 seconds, with an estimated energy storage of 1185.8 μJ. The findings of our study lead to the conclusion that by adjusting the density and thickness of FPU foam, we may effectively optimize the performance of TENG. Moreover, this work introduces a simple, cost-effective and sustainable energy harvesting device that can be utilized to supply power to electronic devices.Conflicts of interest
There are no conflicts to declare.Acknowledgements
This research was supported by the American University in Cairo under the internal grant agreement number SSE-MENG-A.E-FY22-RG-2022-Nov-10-19-38-38.References
- I. Dincer, Renewable Sustainable Energy Rev., 2000, 4, 157–175 CrossRef.
- A. Midilli, M. Ay, I. Dincer and M. A. Rosen, Renewable Sustainable Energy Rev., 2005, 9, 255–271 CrossRef CAS.
- F.-R. Fan, Z.-Q. Tian and Z. L. Wang, Nano Energy, 2012, 1, 328–334 CrossRef CAS.
- X. Cao, Y. Jie, N. Wang and Z. L. Wang, Adv. Energy Mater., 2016, 6, 1600665 CrossRef.
- J. Chen and Z. L. Wang, Joule, 2017, 1, 480–521 CrossRef CAS.
- G. Zhu, C. Pan, W. Guo, C.-Y. Chen, Y. Zhou, R. Yu and Z. L. Wang, Nano Lett., 2012, 12, 4960–4965 CrossRef CAS PubMed.
- S. Wang, L. Lin and Z. L. Wang, Nano Lett., 2012, 12, 6339–6346 CrossRef CAS PubMed.
- R. Dharmasena and S. Silva, Nano Energy, 2019, 62, 530–549 CrossRef CAS.
- A. Ahmed, I. Hassan, A. M. Pourrahimi, A. S. Helal, M. F. El-Kady, H. Khassaf and R. B. Kaner, Adv. Mater. Technol., 2020, 5, 2000520 CrossRef CAS.
- F. R. Fan, W. Tang and Z. L. Wang, Adv. Mater., 2016, 28, 4283–4305 CrossRef CAS PubMed.
- Y. S. Choi, S. W. Kim and S. Kar-Narayan, Adv. Energy Mater., 2021, 11, 2003802 CrossRef CAS.
- Z. Saadatnia, S. G. Mosanenzadeh, T. Li, E. Esmailzadeh and H. E. Naguib, Nano Energy, 2019, 65, 104019 CrossRef CAS.
- H.-Y. Mi, X. Jing, Q. Zheng, L. Fang, H.-X. Huang, L.-S. Turng and S. Gong, Nano Energy, 2018, 48, 327–336 CrossRef CAS.
- Q. Zheng, L. Fang, H. Guo, K. Yang, Z. Cai, M. A. B. Meador and S. Gong, Adv. Funct. Mater., 2018, 28, 1706365 CrossRef.
- M. M. Rastegardoost, O. A. Tafreshi, Z. Saadatnia, S. Ghaffari-Mosanenzadeh, C. B. Park and H. E. Naguib, Nano Energy, 2023, 111, 108365 CrossRef CAS.
- K. Y. Lee, J. Chun, J.-H. Lee, K. N. Kim, N.-R. Kang, J.-Y. Kim, M. H. Kim, K.-S. Shin, M. K. Gupta and J. M. Baik, Adv. Mater., 2014, 26, 5037–5042 CrossRef CAS PubMed.
- D. Kamaruzaman, N. S. M. Mustakim, A. S. R. A. Subki, N. Parimon, M. K. Yaakob, M. F. Malek, N. Vasimalai, M. H. Abdullah, S. A. Bakar and M. K. Ahmad, Mater. Today Sustainability, 2024, 26, 100726 CrossRef.
- L. Ren, Mater. Technol., 2022, 37, 1140–1145 CrossRef CAS.
- M. Wu, Z. Gao, K. Yao, S. Hou, Y. Liu, D. Li, J. He, X. Huang, E. Song and J. Yu, Mater. Today Energy, 2021, 20, 100657 CrossRef CAS.
- T. G. Weldemhret, D.-W. Lee, Y. T. Park and J. I. Song, Chem. Eng. J., 2022, 450, 137982 CrossRef.
- M. Zhi, Q. Liu, Y. Zhao, S. Gao, Z. Zhang and Y. He, ACS Omega, 2020, 5, 2734–2746 CrossRef CAS PubMed.
- A. Maamoun, A. El-Wakil and T. M. El-Basheer, J. Cell. Plast., 2022, 58(4), 645–672 CrossRef CAS.
- P. Scarfato, L. Di Maio and L. Incarnato, Composites, Part B, 2017, 109, 45–52 CrossRef CAS.
- R. Deng, P. Davies and A. Bajaj, J. Sound Vib., 2003, 262, 391–417 CrossRef.
- A. Maamoun and A. Mahmoud, Cellulose, 2022, 29, 6323–6338 CrossRef CAS.
- S. Dworakowska, D. Bogdał, F. Zaccheria and N. Ravasio, Catal. Today, 2014, 223, 148–156 CrossRef CAS.
- M. Ionescu, Chemistry and technology of polyols for polyurethanes, iSmithers Rapra Publishing, 2005 Search PubMed.
- S. A. Baghban, M. Khorasani and G. M. M. Sadeghi, J. Appl. Polym. Sci., 2019, 136, 47363 CrossRef.
- A. A. Maamoun, D. M. Naeim, A. A. Mahmoud, A. M. Esawi and M. Arafa, Nano Energy, 2024, 124, 109426 CrossRef CAS.
- Y. Liu, Y. Zheng, Z. Wu, L. Zhang, W. Sun, T. Li, D. Wang and F. Zhou, Nano Energy, 2021, 79, 105422 CrossRef CAS.
- H. Choe, G. Sung and J. H. Kim, Compos. Sci. Technol., 2018, 156, 19–27 CrossRef CAS.
- M. Kardeş, H. C. Yatmaz and K. Öztürk, ACS Appl. Nano Mater., 2023, 6, 6605–6613 CrossRef.
- F. Zhou, T. Zhang, B. Zou, W. Hu, B. Wang, J. Zhan, C. Ma and Y. Hu, Polym. Degrad. Stab., 2020, 171, 109029 CrossRef CAS.
- K. Cole, P. Van Gheluwe, M. Hébrard and J. Leroux, J. Appl. Polym. Sci., 1987, 34, 395–407 CrossRef CAS.
- L. Zhang, H. K. Jeon, J. Malsam, R. Herrington and C. W. Macosko, Polymer, 2007, 48, 6656–6667 CrossRef CAS.
- R. Hodlur and M. Rabinal, Compos. Sci. Technol., 2014, 90, 160–165 CrossRef CAS.
- S. H. Baek and J. H. Kim, Compos. Sci. Technol., 2020, 198, 108325 CrossRef CAS.
- G. Sung and J. H. Kim, Compos. Sci. Technol., 2017, 146, 147–154 CrossRef CAS.
- S.-T. Lee and N. S. Ramesh, Polymeric foams: mechanisms and materials, CRC Press, 2004 Search PubMed.
- M. Karimi, S. Seddighi and R. Mohammadpour, Sci. Rep., 2021, 11, 16191 CrossRef CAS PubMed.
- Z. Saadatnia, S. G. Mosanenzadeh, E. Esmailzadeh and H. E. Naguib, Sci. Rep., 2019, 9, 1370 CrossRef PubMed.
- A. Lapprand, F. Boisson, F. Delolme, F. Méchin and J.-P. Pascault, Polym. Degrad. Stab., 2005, 90, 363–373 CrossRef CAS.
- A. A. Septevani, D. A. Evans, C. Chaleat, D. J. Martin and P. K. Annamalai, Ind. Crops Prod., 2015, 66, 16–26 CrossRef CAS.
- X. Liu, J. Hao and S. Gaan, RSC Adv., 2016, 6, 74742–74756 RSC.
- T.-T. Li, W. Dai, S.-Y. Huang, H. Wang, Q. Lin, C.-W. Lou and J.-H. Lin, Mater. Des., 2019, 183, 108150 CrossRef CAS.
- R. Ccorahua, J. Huaroto, C. Luyo, M. Quintana and E. A. Vela, Nano Energy, 2019, 59, 610–618 CrossRef CAS.
- T. G. Weldemhret, D.-W. Lee, M. Prabhakar, Y. T. Park and J. I. Song, ACS Appl. Nano Mater., 2022, 5, 12464–12476 CrossRef CAS.
- G. M. Rani, C.-M. Wu, K. G. Motora and R. Umapathi, J. Cleaner Prod., 2022, 363, 132532 CrossRef.
- S. Wang, L. Ding, Y. Wang and X. Gong, Nano Energy, 2019, 59, 434–442 CrossRef CAS.
- L. Shi, S. Dong, H. Xu, S. Huang, Q. Ye, S. Liu, T. Wu, J. Chen, S. Zhang and S. Li, Nano Energy, 2019, 64, 103960 CrossRef CAS.
- D. S. Mahmoud, S. H. El-Sabbagh, T. M. El-Basheer, A. Moustafa and M. A. Barakat, J. Thermoplast. Compos. Mater., 2023, 36, 4684–4706 CrossRef CAS.
- Z. Peng, J. Song, Y. Gao, J. Liu, C. Lee, G. Chen, Z. Wang, J. Chen and M. K. Leung, Nano Energy, 2021, 85, 106021 CrossRef CAS.
- M. Wang, N. Zhang, Y. Tang, H. Zhang, C. Ning, L. Tian, W. Li, J. Zhang, Y. Mao and E. Liang, J. Mater. Chem. A, 2017, 5, 12252–12257 RSC.
- M. Wang, W. Liu, X. Shi, J. Pan, B. Zhou, J. Wang, T. Sun and Y. Tang, New J. Chem., 2021, 45, 1893–1898 RSC.
- H. J. Oh, J. H. Bae, Y. K. Park, J. Song, D. K. Kim, W. Lee, M. Kim, K. J. Heo, Y. Kim and S. H. Kim, Polymers, 2020, 12, 1044 CrossRef CAS PubMed.
- M. Gokana, C.-M. Wu, U. Reddicherla and K. Motora, eXPRESS Polym. Lett., 2021, 15, 1019–1031 CrossRef CAS.
Footnote |
| † Electronic supplementary information (ESI) available. See DOI: https://doi.org/10.1039/d4ma00304g |
| This journal is © The Royal Society of Chemistry 2024 |

