 Open Access Article
Creative Commons Attribution 3.0 Unported Licence
A combined 3D and 2D light scattering study on aqueous colloidal model systems with tunable interactions
Yi
Liu
a,
Nathalie
Claes
b,
Bastian
Trepka
c,
Sara
Bals
b and
Peter R.
Lang
*ad
aForschugszentrum Jülich, Institute of Complex Systems ICS-3, Jülich, Germany. E-mail: p.lang@fz-juelich.de
bElectron Microscopy for Materials Research (EMAT), University of Antwerp, Belgium
cUniversity of Konstanz, Germany
dHeinrich-Heine Universität, Düsseldorf, Germany
First published on 22nd August 2016
Abstract
In this article we report on the synthesis and characterization of a system of colloidal spheres suspended in an aqueous solvent which can be refractive index-matched, thus allowing for investigations of the particle near-wall dynamics by evanescent wave dynamic light scattering at concentrations up to the isotropic to ordered transition and beyond. The particles are synthesized by copolymerization of a fluorinated acrylic ester monomer with a polyethylene-glycol (PEG) oligomer by surfactant free emulsion polymerization. Static and dynamic light scattering experiments in combination with cryo transmission electron microscopy reveal that the particles have a core shell structure with a significant enrichment of the PEG chains on the particles surface. In index-matching DMSO/water suspensions the particles arrange in an ordered phase at volume fraction above 7%, if no additional electrolyte is present. The near-wall dynamics at low volume fraction are quantitatively described by the combination of electrostatic repulsion and hydrodynamic interaction between the particles and the wall. At volume fractions close to the isotropic to ordered transition, the near-wall dynamics are more complex and qualitatively reminiscent of the behaviour which was observed in hard sphere suspensions at high concentrations.
1 Introduction
The properties of colloidal particles at or close to interfaces between an aqueous and a non-aqueous phase have acquired growing attention from the scientific community and industry during recent years.1 The spectrum of topics spans fundamental scientific subjects such as particle stabilized emulsions,2 protein stability and adsorption3 or self-assembly at water–oil interfaces4 for the fabrication of functional nano-films, with industrial applications such as corrosion protection5 or water-borne ‘green’ coatings,6 to name a few examples. While there is a plethora of publications considering static properties such as interaction forces, structure formation and phase behaviour of particles at interfaces,7–9 there are comparatively few contributions reporting on experimental investigations of particle dynamics in the ultimate vicinity of interfaces,10–18 despite the fact that the dynamics of colloidal particles at interfaces is an important feature, especially when the dimension of confining geometries are approaching those of the particles, as in the case of microfluidics,19 emulsion stabilization20,21 as well as many biological processes.22,23 Interfaces between a solid and a liquid phase are of particular technological importance e.g. in coating processes or bio-film formation. In these cases, the motion of the particles close to the wall is slowed down due to hydrodynamic interaction and this hindrance differs for particles moving parallel and perpendicular to the wall.24,25 The interplay between static particle wall interaction and the slowing-down caused by the so-called wall drag effect has significant implications in potential applications. Geometrical constraints were used to quench Brownian rotational motion of spherical Janus particles providing a means to steer their trajectory.26 Furthermore, the trajectories of active swimmers, driven by flagellar motion, can be directed by tuning their interaction with a surface, and spatial confinements can be used to accumulate active swimmers.27 For a targeted exploitation of the combined effects of static interaction, the wall drag effect and particle concentration, a fundamental understanding of their mutual interplay is essential. In this paper we report on the synthesis and characterization of an aqueous system, which allows a systematic variation of the static interactions and at the same time enables the study of the near-wall dynamics of particles at arbitrary concentrations.For experimental purposes, interfaces between transparent solids and a liquid phase are convenient, since in this case, the near-wall dynamics of colloidal particles can be investigated by evanescent wave dynamic light scattering (EWDLS). This technique was first devised by Lan et al. in 1986,28 and has been advanced constantly since then. The principle is as follows: an evanescent wave is created as an illumination source when a laser beam is totally reflected off a glass–solution interface; particles, which are located within this illumination profile will scatter light, which is then collected by a detecting unit and passed down to a correlator to generate the intensity correlation function. The penetration depth of the evanescent wave can be tuned by varying the incident angle of the laser beam. Being a light scattering technique in essence, EWDLS is most suited to the measurement of particles within a radius range around 100 nm, and at the same time provides good statistics. Modern instrumentation has made it possible to independently vary the scattering vector components parallel, Q∥, and normal, Q⊥, to the interface and hence to distinguish between the anisotropic diffusivity of colloids parallel and perpendicular to the interface experimentally.15 EWDLS has also been employed to study the rotational diffusion of optically anisotropic particles,29 to probe the particle dynamics at liquid–liquid interfaces,30 and to measure the near-wall velocity profile of a streaming suspension with a resolution of tens of nanometers.31 The near-wall dynamics of colloidal hard spheres dispersed in an organic solvent have been systematically studied over a broad range of volume fractions.16,17 In the latest endeavor, experimental data were thoroughly compared with theoretical predictions based on a virial approximation and simulation results32 where excellent agreement has been achieved.18 This agreement between experiments and theory has provided a framework for the understanding of near-wall dynamics in general, and paved the way for the study of more complex systems.
Despite its high potential, EWDLS has not been employed to study the near-wall dynamics of particles in aqueous solution, except for very dilute suspensions. The main challenge is to find a suitable aqueous model system, which is monodisperse and can be refractive index-matched to the aqueous solvent to avoid multiple scattering. To this end, the fluorinated monomer 2,2,3,3,4,4,4-heptafluorobutyl methacrylate (FBMA) has been successfully used to synthesize monodisperse particles with a low refractive index via emulsion polymerization and the system was shown to form well-ordered crystalline colloidal arrays.33 Further effort has led to the production of FBMA particles with radii between 50 nm to 700 nm.34 However, such particles are susceptible to irreversible aggregation upon salt addition or under compression by centrifugation, as they are solely stabilized through electrostatic repulsion (ER) in aqueous solution. This would bring great difficulty into volume variation and interaction tuning, which is essential for the study of near-wall dynamics in dense suspensions. This situation calls for a more robust aqueous model system. The first attempt in this direction was made by Wiemann et al., who designed a core–shell system with a fluoroacrylate core and a poly(ethylene glycol) (PEG) surface layer, for the study of glass transition and re-entry behaviour.35 These so-called PEGylated particles are sterically stabilized in aqueous solution by the PEG layer, and were shown to be stable against compression up to a particle volume fraction of 69% and high salt concentrations. Continued effort has made it possible to synthesize particles with a single and well-defined PEG layer.36 Moreover, this system bridges fundamental research to life science application, as PEG is a biocompatible material and e.g. PEGylation has already been widely used for drug delivery applications.37,38
In this paper we show that PEGylated FBMA particles are an interesting model system for the study of near-wall dynamics in aqueous solution for several reasons. First of all, they fulfill the requirements of being monodisperse, iso-refractive with aqueous solvents and stable, which ensures reliable EWDLS measurements; secondly, they are highly versatile, as their interactions can be tuned by varying the PEG chain length, the solvent composition, and salt concentrations where the PEG-layer should ensure colloidal stability even at high salt concentration. We describe the synthesis of the particles by emulsion polymerization and their bulk characterization, by cryo transmission electron microscopy (cryo-TEM) and light scattering. Finally we show that the near-wall dynamics of this model system is in very good agreement with current theoretical predictions for low particle volume fractions. However, due to the long range particle–particle interactions and those between the particles and the wall, the effect of increased concentration on the particles' near-wall dynamics is much more pronounced than for suspensions of colloidal hard spheres.
2 Experimental
2.1 Materials and synthesis
2.2 Bulk characterization methods
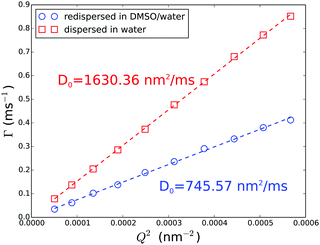
![[thin space (1/6-em)]](https://www.rsc.org/images/entities/char_2009.gif) sin(θ/2)/λ0 is the scattering vector with nS the refractive index of the solution and λ0 the vacuum wave length of the laser. To determine the diffusion constant of the particles, D0, and their polydispersity index, U, a cumulant analysis of the correlation functions was performed. The particles' hydrodynamic radius, RH, was calculated via the Stokes–Einstein relation, using the appropriate solvent viscosity.
sin(θ/2)/λ0 is the scattering vector with nS the refractive index of the solution and λ0 the vacuum wave length of the laser. To determine the diffusion constant of the particles, D0, and their polydispersity index, U, a cumulant analysis of the correlation functions was performed. The particles' hydrodynamic radius, RH, was calculated via the Stokes–Einstein relation, using the appropriate solvent viscosity.
2.3 Evanescent wave dynamic light scattering
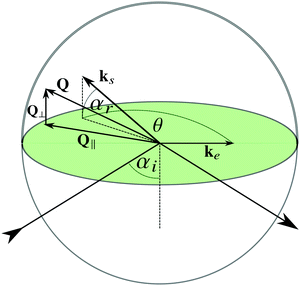
The inverse penetration depth of the evanescent wave is determined by the angle of incidence αi as  and the refractive index of the glass n1 and the suspension n2, respectively. The magnitude of the scattering vector component parallel to the interface is given by
  while the normal component is Q⊥ = 2πn2
![[thin space (1/6-em)]](https://www.rsc.org/images/entities/char_2009.gif) sin
sin![[thin space (1/6-em)]](https://www.rsc.org/images/entities/char_2009.gif) αr/λ0. The two components can be varied independently of each other by changing θ and αr. To distinguish between particle dynamics parallel and normal to the wall, series of correlation functions are recorded at fixed Q⊥ varying Q∥ (Q∥-scan) or vice versa (Q⊥-scan).
αr/λ0. The two components can be varied independently of each other by changing θ and αr. To distinguish between particle dynamics parallel and normal to the wall, series of correlation functions are recorded at fixed Q⊥ varying Q∥ (Q∥-scan) or vice versa (Q⊥-scan).
| g2(t) = 1 + 2C1ĝ1(t) + (C2ĝ1(t))2 | (1) |
 and C1 = C2 − C22, with A the experimental intercept of g2(t).
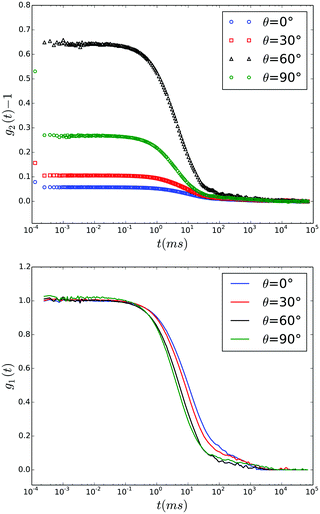 | ||
| Fig. 2 Time auto correlation functions recorded during a Q∥ scan in EWDLS at αr = 60° and values of θ as indicated in the legend. Top: Intensity correlation functions ĝ2(t) − 1 as measured. Bottom: Field correlation functions calculated by the generalized Siegert relation, eqn (1). | ||
Furthermore, in many cases EWDLS intensity-auto correlation functions exhibit a very slow decay at large times, as shown in the top part of Fig. 2. The physical origin of this slow relaxation is not clear yet. While Garnier et al. conjecture that it is due to a slow reversible adsorption of the particles to the wall due to van der Waals attraction,11 Lisicki et al. argue that it is also caused by the unavoidable stray-light from surface defects, which is scattered by colloids in the bulk of the suspension into the detector.40 Since these slow modes are in general well separated from the relaxation rates of interest, we approximate their contribution by an additional baseline B1 to ĝ1(t).
Thus, to determine the initial slope Γ of ĝ1(t), which is related to the dynamic properties of interest, we chose to fit the experimental correlation functions, using a non-linear least squares algorithm, to eqn (1), where ĝ1(t) is modeled as a decaying single exponential function in time.
| ĝ1(t) = (1 − B1)exp{−Γt} + B1. | (2) |
 . Consequently there are three fit parameters A, Γ and B2. Since an erroneous baseline value will lead to a deviation of Γ from the true relaxation rate, due to a normalization error, we fitted g2(t) repeatedly, starting with a number of data points, Np. After the convergence of a single fit, two data points at the long time end of g2(t) were removed, and the remaining points were fitted again with reduced Np. This procedure was repeated until Np < 20. With this technique it was possible to identify a limited range of Np's where the best fitting parameters are essentially independent of the number of points. The Γ values determined in this range are considered to be the initial slope or the first cumulant of ĝ1(t). Repeated measurements on the same sample show that Γ can be determined by this procedure with an uncertainty which is generally smaller than 10% as shown by the error bars displayed in Fig. 9.
 | (3) |
 | (4) |
For particles, which are subject to a long-ranging interaction potential with the wall V(z), the Boltzmann-factor of the potential will enter into the average diffusion constants15 as
 | (5) |
3 Results and discussion
3.1 Particle characterization
The particles yield turbid suspensions, if dispersed in water at volume fractions above ϕ ≳ 0.01, since the refractive index of the fluorinated polymer is higher than that of water. In order to conduct light scattering measurement at higher concentrations, the refractive index of the particles needs to be matched to the surrounding medium by adding a co-solvent. DMSO was chosen as co-solvent because of its miscibility with water in all proportions, and its very low toxicity. A series of DMSO/water solutions was prepared, with refractive indices ranging from 1.33 to 1.40. To keep the particle concentration constant in all cases, 0.2 mL of a dialyzed stock suspension were added to 0.8 mL DMSO/water mixtures of various compositions. The scattering intensities of the resulting samples were measured at a scattering angle of θ = 90°, as the scattering intensity at constant volume fraction is approximately proportional to the square of the refractive index difference between the solvent and the particles. At a volume ratio of water to DMSO, ϕ(H2O)![[thin space (1/6-em)]](https://www.rsc.org/images/entities/char_2009.gif) :
:![[thin space (1/6-em)]](https://www.rsc.org/images/entities/char_2009.gif) ϕ(DMSO) of 69
ϕ(DMSO) of 69![[thin space (1/6-em)]](https://www.rsc.org/images/entities/char_2009.gif) :
:![[thin space (1/6-em)]](https://www.rsc.org/images/entities/char_2009.gif) 31, the scattering intensity shows a minimum, which corresponds to the smallest obtainable refractive index difference between particles and solvent. The refractive index at this solvent composition was determined to be nsol = 1.3847, with an ABBEMAT RXA 156 refractometer from Anton Paar.
31, the scattering intensity shows a minimum, which corresponds to the smallest obtainable refractive index difference between particles and solvent. The refractive index at this solvent composition was determined to be nsol = 1.3847, with an ABBEMAT RXA 156 refractometer from Anton Paar.
To obtain index-matched suspensions for further scattering experiments, the aqueous suspension was centrifuged at low speed and the sediments re-dispersed in the index-matching solvent mixture, for three times. The resulting dispersion is completely transparent and used as stock solution.
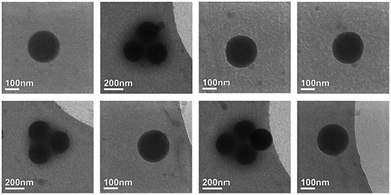
To confirm the spherical shape of the particles they were investigated by cryo-electron tomography. A series of 2D projections was acquired while tilting the specimen around an axis perpendicular to the electron beam (x-axis) over a range from −65° to +60° with a tilt increment of 5°. Example images from this series are shown in Fig. 4, where the perfectly circular shape of the 2D projection can be observed for all tilt angles. This observation is supported by the calculated 3D reconstruction which is displayed in Fig. 5.
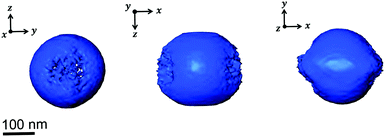 | ||
| Fig. 5 Visualization of the 3D reconstruction. In the yz plane a spherical shape is observed, while in the zx and xy planes the reconstruction is elongated along the direction of the missing wedge. | ||
The elongation of the 3D-reconstruction, which is observed in the zx and xy planes, is an artifact, which is caused by the limited number of acquisitions and the so-called missing wedge problem. The missing wedge is caused by the inability to tilt the sample over ±90° range. This is related to the limited gap between the pole pieces of the objective lens and shadowing effects of the TEM grid at high angles.41 As the 3D reconstruction is mathematically speaking an ill-defined inverse problem, multiple solutions correspond to the incomplete data set that was collected. This eventually results in a blurring/elongation of the reconstruction in the direction of the missing wedge.
 | (6) |
 of the core, the shell and the solvent respectively. To account for the particles' polydispersity we applied a logarithmic normal distribution p(Rc) of the core radii assuming a constant shell thickness dshell = R − Rc. With this the model function used for the fitting is
 | (7) |
![[small epsilon, Greek, macron]](https://www.rsc.org/images/entities/i_char_e0c6.gif) = (Rc3Δεcs − R3εs)/R3. The lines in Fig. 6 were obtained by simultaneously fitting the three sets of data with eqn (7), where the global parameters Rc, R, σr were forced to be the same for all three sets of data, while the local parameters nc and ns were allowed to vary between the data sets. The resulting best fitting parameter values are collected in Table 1.
= (Rc3Δεcs − R3εs)/R3. The lines in Fig. 6 were obtained by simultaneously fitting the three sets of data with eqn (7), where the global parameters Rc, R, σr were forced to be the same for all three sets of data, while the local parameters nc and ns were allowed to vary between the data sets. The resulting best fitting parameter values are collected in Table 1.
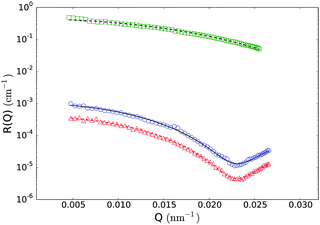 | ||
| Fig. 6 Static light scattering data at low volume fractions. Open squares: ϕ = 5.6 × 10⁻³ in water, open circles: ϕ = 1.4 × 10⁻³ in DMSO/water, open triangles: ϕ = 5.6 × 10⁻³ in DMSO/water, lines: best fits to data with eqn (7) resulting the parameters listed in Table 1. | ||
| Solvent volume fraction | H2O 0.0056 | H2O/DMSO 0.0056 | H2O/DMSO 0.014 |
|---|---|---|---|
| 〈Rc〉/nm | 115.3 | 115.3 | 115.3 |
| 〈R〉/nm | 121.2 | 121.2 | 121.2 |
| σ r | 0.08 | 0.08 | 0.08 |
| n c | 1.3838 | 1.3839 | 1.3839 |
| n s | 1.3549 | 1.400 | 1.3999 |
The geometrical parameters are in very good agreement with the information deduced from cryo-TEM. Further we find nc ≈ 1.38 which is qualitatively in agreement the reported refractive index values for pure FBMA particles nFBMA ≈ 1.37.34 The parameters associated with the particle shell are well in line with the picture of a thin PEG layer, which is swollen by the solvent. The molar mass of the PEG chain corresponds to an average degree of polymerization of N ≈ 22, yielding an all-trans contour length of the chain lc ≈ 8 nm and a radius of gyration Rg ≈ 0.8 nm if a length of about 0.13 nm per backbone atom44,45 and a monomer segment length of approximately 0.38 nm is assumed. This implies that a shell consisting of PEG should have a thickness between approximately 1.5 nm and 8 nm in accordance with our findings from SLS 〈R〉 − 〈Rc〉 = 5.9 nm. Assuming an ideal mixture, we can obtain an estimate for the PEG volume fraction in the shell as ϕPEG = (ns − nsol)/(nPEG − nsol). Applying nPEG ≈ 1.35846 this yields a polymer volume fraction of about 20% in both solvents. These findings strongly indicate that our particles exhibit a pronounced core shell structure with a significant enrichment of the PEG chains at the surface of an FBMA core, which was not reported before.
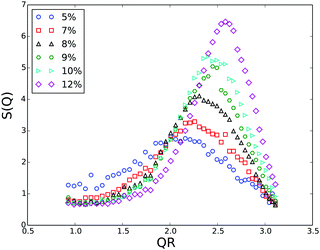
Generally, with increasing volume fraction of the particle suspension, a transition from an isotropic solution to a colloidal crystal is expected. Indeed, FBMA-particle suspensions with volume fractions ϕ > 10 are opalescent, indicating the formation of an ordered structure. With lower volume fractions this colourful effect vanishes gradually and the determination of the transition volume fraction by optical inspection is rather ambiguous. Therefore we applied the Hansen–Verlet criterion to estimate the lowest volume fraction at which coexistence between an isotropic solution and an ordered structure occurs. According to this empirical rule, it is generally accepted that the maximum of the structure factor S(Qmax) = 2.85 at the freezing point of colloidal hard sphere suspensions,47 while it slightly increases for particles interacting by electrostatic repulsion (ER), depending weakly on their surface charge density and the solvent salinity. For charged particles at low salinity, as in our case the threshold value is S(Qmax) ≈ 3.0–3.1.48–51 In Fig. 7 we plotted the structure factors of suspensions with different volume fractions, obtained from the static scatting data according to
 | (8) |
At the given salinity S(Qmax) ≲ 3 for the sample with ϕ = 0.07, while the structure factor maximum is significantly larger than the threshold value for the sample with 8% volume fraction. Thus, at ϕ = 0.08 there is definitely a coexistence between an isotropic solution and an ordered structure.
3.2 EWDLS measurements
To investigate the PEGylated FBMA particles near-wall dynamics at low volume fractions, we performed EWDLS measurements on suspensions with ϕ = 0.01. As the colloids and the glass surface are negatively charged, the addition of electrolyte will make a difference to the particles' near-wall dynamics, by changing the range of the electrostatic repulsion (ER). To illustrate this influence, Fig. 9 shows values of Γ plotted versus the square of the parallel scattering vector component obtained during parallel scans, at two different salt concentrations. Here and in the following we show normalized quantities, where d = 2RH is the particle diameter, to facilitate comparison between the results obtained from different systems, in particular with a hard sphere system as shown in Fig. 12. The red symbols represent a sample with 10 mM NaCl, which corresponds to a Debye length of lD = 3 nm. In this situation the electrostatic repulsion (ER) is almost completely screened and the measured Γ agree within experimental error with the prediction for a hard sphere with a hydrodynamic radius of RH = 130 nm, represented by the black line in Fig. 9. The error bars assigned to these data, which represent the standard deviation of three repeated measurements, are representative for all EWDLS data discussed in the following. For the sake of clarity we will not display error bars in the following graphs. The data represented by the blue symbols were obtained from the sample without extra salt addition, which corresponds to an ionic strength ∼10−5 M and a Debye length of lD = 95 nm. In this suspension, the particles move significantly faster than those dispersed at a high salt concentration. This can be explained intuitively, since the long range electrostatic repulsion (ER) will effectively push the particles away from the interface thereby reducing the hydrodynamic wall drag effect. To quantitatively analyze these data, we calculated the Γ vs. Q∥2 dependence, by numerically integrating eqn (5) into which we introduced the electrostatic interaction potential which may be approximated within the Debye–Hückel–Derjaguin limit byVes(z) = BER![[thin space (1/6-em)]](https://www.rsc.org/images/entities/char_2009.gif) exp{−(z − R)/lD} exp{−(z − R)/lD} | (9) |
 | ||
| Fig. 9 Normalized initial relaxation rates Γ as a function of the parallel scattering vector component squared. Symbols represent experimental data obtained from a ϕ = 0.01 sample at different Debye screening lengths, as indicated in the legend. Lines represent theoretical predictions for infinite dilution according to eqn (5) and (9). The error bars assigned to the data obtained from the sample with added salt, represent standard deviations from three repeated measurements. | ||
The amplitude BER scales with particle radius and depends on the surface charge density of particles and the wall. In the model calculations, this amplitude is the only adjustable parameter and we could achieve good agreement between all experimental data discussed in this paper and the predictions with a fixed value of BER = 2kBT. In Fig. 9 and 10, the lines labeled ER represent predictions for lD = 95 nm (blue), and for lD = 3 nm (red). The black line shows the hard sphere prediction as a reference, where no electrostatic interaction is taken into account. The systematic deviation of the experimental data at high Q∥ is due to the fact that the primary laser beam is reflected upon exiting of the semi-spherical lens, by that giving rise to a second scattering event with an in-plane angle θr = 180 − θ. This effect is frequently observed, even in bulk experiments, with index-matched particles. For the case of EWDLS on hard sphere samples it has been discussed in detail in a previous paper.18 As a consequence of this back reflection, data obtained from EWDLS experiments at θ > 90° are often not reliable, which in the present case corresponds to (Q∥d)2 ≳ 30, given αr = 60° and the refractive index of the solution nS ≈ 1.38.
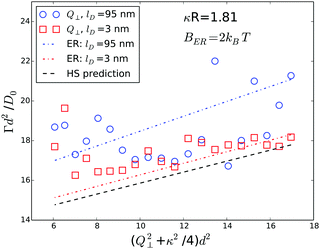 | ||
| Fig. 10 Normalized initial relaxation rates Γ as a function of the normal scattering vector component squared. Symbols represent experimental data obtained from a ϕ = 0.01 sample at different Debye screening lengths, as indicated in the legend. Lines represent theoretical predictions for infinite dilution according to eqn (5) and (9). | ||
The agreement between experiments and predictions is less satisfying in the case of the Q⊥-scans, as shown in Fig. 10, since the scatter of the experimental data is significantly larger, especially at long Debye lengths. At high salt concentrations the experimental data are reasonably well represented by the prediction for a Debye length of 3 nm, while the experimental data obtained from the sample without additional salt follow the prediction only qualitatively.
To investigate the influence of the evanescent wave penetration depth on the measured values of Γ we performed experiments at different angles of incidence. Fig. 11 shows data obtained from Q∥-scans at two different penetration depths together with the corresponding theoretical prediction. Although the agreement is very good, the scatter of the experimental data is larger than the difference between the predictions for different penetration depths. Thus, the influence of the penetration depth is too small to be reliably detected experimentally.
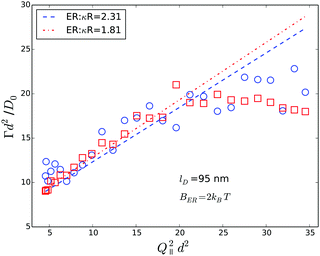 | ||
| Fig. 11 Effect of evanescent wave penetration depth on measured Γ. Symbols represent experimental data obtained from a ϕ = 0.01 sample at different penetration depths. Lines of equal color represent theoretical predictions for infinite dilution according to eqn (5) and (9). Penetration depths are indicated in the legend. | ||
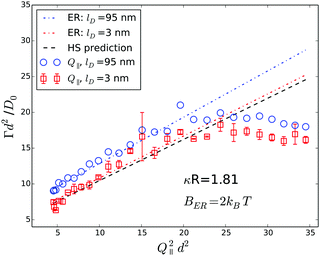
So far, we have shown that in dilute suspensions, PEGylated FBMA particles behave like charged spheres, and their near-wall dynamics can be suitably described by a combination of hydrodynamic wall effect and the particles' static interaction with the wall. However, a more interesting and challenging question concerns the near-wall dynamics at increased volume fractions, at which the system changes from an isotropic solution to an ordered structure, stabilized by long-ranged particle interactions. As a first step to tackle this question we show data obtained from a suspension with a particle volume fraction of 7% in Fig. 12. The graph displays the normalized Γ versus Q∥2 data, obtained at κR = 1.81 from a suspension without added salt. As a general trend we observe that the relaxation rates are lager at ϕ = 0.07 than at infinite dilution, which is represented by the dashed dotted line. Further, there is a significant deviation from the linear Q∥2 behaviour, which was observed at low volume fraction. The relaxation rates rather undulate with Q∥2 which is very reminiscent of the behaviour we reported earlier for hard spheres at high volume fractions. For comparison we also show experimental data obtained from a suspension of hard spheres at a volume fraction of 30% together with a set of simulated data for the same system. Note that these data were obtained at αr = 27.8° and nS ≈ 1.49, thus the effect of back reflections will only become visible at (Q∥d)2 ≳ 50. Based on the observed qualitative similarity we conjecture that also the near-wall dynamics of the PEGylated FBMA particles at ϕ = 0.07 are significantly affected by the suspension's structure factor, which is in line with our observation that suspensions with a volume fraction of 7% are close to the disorder/order coexistence of the system. A systematic experimental investigation and a quantitative theoretical analysis of this effect will be the subject of a future contribution.
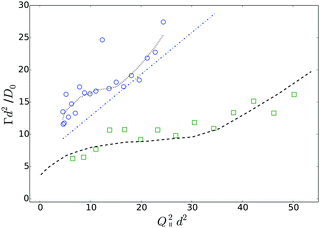 | ||
| Fig. 12 Comparison of Q∥-scans on a PEGylated FBMA suspension with ϕ = 0.07 (open circles) and a hard sphere system at ϕ = 0.3 (open squares). The dashed line represents simulation data for the hard sphere system, the dashed dotted line is the prediction for charged spheres at low ϕ according to eqn (5) and (9) and the dotted line is a guide for the eyes. | ||
4 Conclusion
We have synthesized PEGylated fluorinated particles by an emulsion polymerization, for the study of near-wall dynamics of colloidal particles in aqueous solution. Bulk characterizations show that the particles have a core shell structure, a negligible polydispersity, are stable against compression and addition of salt, and can be easily index-matched to aqueous solutions, which makes them a good model system for scattering experiments in aqueous suspensions at increased concentrations up to the transition from an isotropic solution to an ordered phase and beyond. By static light scattering we have shown that a coexistence of isotropic and ordered suspensions already occurs at a volume fraction of 8% in DMSO/water, if no additional electrolyte is present. In future we will use this system for the systematic investigation of near-wall dynamics of particles with long-ranging interactions. In this contribution we showed that EWLDS measurements on this system produce reliable and reproducible data. At low volume fractions the near-wall dynamics can be well predicted taking into account the particles hydrodynamic and electrostatic interaction with the wall. However, even at moderate volume fractions the near-wall dynamics are reminiscent of the behaviour which was observed for hard spheres at much higher volume fractions, which is attributed to the long range particle–particle repulsion. A thorough experimental investigation of the interaction effects on near-wall dynamics and the design of a theoretical framework for their prediction is the objective of ongoing work.Acknowledgements
The authors thank Prof. J. K. G. Dhont and the ICS-3 group for useful discussions and support. YL would like to thank the Marie Sklodowska Curie Initial Training Network SOMATAI under the EU Grant Agreement No. 316866 for financial support. BT contributed to this work during an internship at Forschungszentrum Jülich supported by the International Helmholtz Research School of Biophysics and Soft Matter (IHRS BioSoft), which is gratefully acknowledged. SB and NC acknowledge financial support from the European Research Council (ERC Starting Grant No. 335078-COLOURATOMS).References
-
Soft Matter at Aqueous Interfaces, ed. P. R. Lang and Y. Liu, Springer, Doordrecht, 2016, pp. 1–556 Search PubMed
.
-
Particle-Stabilized Emulsions and Colloids, ed. T. Ngai and S. Bon, The Royal Society of Chemistry, 2015, pp. P001–P322 Search PubMed
.
-
J. D. Andrade and V. Hlady, Protein adsorption and materials biocompatibility: a tutorial review and suggested hypotheses, Biopolymers/Non-Exclusion HPLC, Springer Berlin Heidelberg, Berlin, Heidelberg, 1986, pp. 1–63 Search PubMed
.
- L. Hu, M. Chen, X. Fang and L. Wu, Chem. Soc. Rev., 2012, 41, 1350–1362 RSC
.
- M. Zheludkevich, J. Tedim and M. Ferreira, Electrochim. Acta, 2012, 82, 314–323 CrossRef CAS
.
- I. W. Cheong and J. H. Kim, Chem. Commun., 2004, 2484–2485 RSC
.
- D. T. Wasan and A. D. Nikolov, Nature, 2003, 423, 156–159 CrossRef CAS PubMed
.
-
D. T. Wasan, A. D. Nikolov, A. Trokhymchuck and D. J. Henderson, Confinement-Induced Structural Forces in Colloidal Systems, in Encycopedia of Surface and Colloidal Science, ed. P. Somasundaran, CRC Press Taylor and Francis, Boca Raton, FL, 2006, p. 1485 Search PubMed
.
- H. Löwen, J. Phys.: Condens. Matter, 2009, 21, 474203 CrossRef PubMed
.
- M. I. M. Feitosa and O. M. Mesquita, Phys. Rev. A: At., Mol., Opt. Phys., 1991, 44, 6677–6685 CrossRef CAS
.
- N. Garnier and N. Ostrowsky, J. Phys. II, 1991, 1, 1221–1232 CrossRef CAS
.
- M. Hosoda, K. Sakai and K. Takagi, Phys. Rev. E: Stat. Phys., Plasmas, Fluids, Relat. Interdiscip. Top., 1998, 58, 6275–6280 CrossRef CAS
.
- B. Lin, J. Yu and S. A. Rice, Phys. Rev. E: Stat. Phys., Plasmas, Fluids, Relat. Interdiscip. Top., 2000, 62, 3909–3919 CrossRef CAS
.
- P. Holmqvist, J. K. G. Dhont and P. R. Lang, Phys. Rev. E: Stat., Nonlinear, Soft Matter Phys., 2006, 74, 021402 CrossRef PubMed
.
- P. Holmqvist, J. K. G. Dhont and P. R. Lang, J. Chem. Phys., 2007, 126, 044707 CrossRef PubMed
.
- V. Michailidou, G. Petekidis, J. Swan and J. Brady, Phys. Rev. Lett., 2009, 102, 068302 CrossRef CAS PubMed
.
- V. N. Michailidou, J. W. Swan, J. F. Brady and G. Petekidis, J. Chem. Phys., 2013, 139, 164905 CrossRef CAS PubMed
.
- Y. Liu, J. Bławzdziewicz, B. Cichocki, J. K. G. Dhont, M. Lisicki, E. Wajnryb, Y.-N. Young and P. R. Lang, Soft Matter, 2015, 11, 7316–7327 RSC
.
-
P. Mathai, Brownian Motion in Microfluidics and Nanofluidics, in Encyclopedia of Microfluidics and Nanofluidics, ed. D. Li, Springer New York, New York, NY, 2015, pp. 213–218 Search PubMed
.
- D. M. Kaz, R. McGorty, M. Mani, M. P. Brenner and V. N. Manoharan, Nat. Mater., 2011, 11, 138–142 CrossRef PubMed
.
- E. M. Herzig, K. A. White, A. B. Schofield, W. C. K. Poon and P. S. Clegg, Nat. Mater., 2007, 6, 966–971 CrossRef CAS PubMed
.
- M. L. Gibiansky, J. C. Conrad, F. Jin, V. D. Gordon, D. A. Motto, M. A. Mathewson, W. G. Stopka, D. C. Zelasko, J. D. Shrout and G. C. L. Wong, Science, 2010, 330, 197 CrossRef CAS PubMed
.
- I. H. Riedel, K. Kruse and J. Howard, Science, 2005, 309, 300–303 CrossRef CAS PubMed
.
- H. Brenner, Chem. Eng. Sci., 1961, 16, 242–251 CrossRef CAS
.
- A. Goldman, R. Cox and H. Brenner, Chem. Eng. Sci., 1967, 22, 653–660 CrossRef CAS
.
- S. Das, A. Garg, A. I. Campbell, J. R. Howse, A. Sen, D. Velegol, R. Golestanian and S. J. Ebbens, Nat. Commun., 2015, 6, 8999 CrossRef CAS PubMed
.
- J. Elgeti, R. G. Winkler and G. Gompper, Rep. Prog. Phys., 2015, 78, 056601 CrossRef CAS PubMed
.
- K. H. Lan, N. Ostrowsky and D. Sornette, Phys. Rev. Lett., 1986, 57, 17–20 CrossRef PubMed
.
- S. A. Rogers, M. Lisicki, B. Cichocki, J. K. G. Dhont and P. R. Lang, Phys. Rev. Lett., 2012, 109, 098305 CrossRef CAS PubMed
.
- A. Stocco, T. Mokhtari, G. Haseloff, A. Erbe and R. Sigel, Phys. Rev. E: Stat., Nonlinear, Soft Matter Phys., 2011, 83, 011601 CrossRef PubMed
.
- B. Loppinet, J. K. G. Dhont and P. Lang, Eur. Phys. J. E: Soft Matter Biol. Phys., 2012, 35, 1–4 CrossRef PubMed
.
- B. Cichocki, E. Wajnryb, J. Blawzdziewicz, J. K. G. Dhont and P. R. Lang, J. Chem. Phys., 2010, 132, 074704 CrossRef CAS PubMed
.
- G. Pan, A. S. Tse, R. Kesavamoorthy and S. A. Asher, J. Am. Chem. Soc., 1998, 120, 6518–6524 CrossRef CAS
.
- G. H. Koenderink, S. Sacanna, C. Pathmamanoharan, M. Rasa and A. P. Philipse, Langmuir, 2001, 17, 6086–6093 CrossRef CAS
.
- M. Wiemann, R. Schneider and E. Bartsch, Z. Phys. Chem., 2012, 226, 761–778 CrossRef CAS
.
- J. Ulama, M. Zackrisson Oskolkova and J. Bergenholtz, J. Phys. Chem. B, 2014, 118, 2582–2588 CrossRef CAS PubMed
.
- M. Z. Oskolkova, A. Stradner, J. Ulama and J. Bergenholtz, RSC Adv., 2015, 5, 25149–25155 RSC
.
- D. Pozzi, V. Colapicchioni, G. Caracciolo, S. Piovesana, A. L. Capriotti, S. Palchetti, S. De Grossi, A. Riccioli, H. Amenitsch and A. Laganà, Nanoscale, 2014, 6, 2782–2792 RSC
.
- W. Van Aarle, W. J. Palenstijn, J. De Beenhouwer, T. Altantzis, S. Bals, K. J. Batenburg and J. Sijbers, Ultramicroscopy, 2015, 157, 35–47 CrossRef CAS PubMed
.
- M. Lisicki, B. Cichocki, J. K. G. Dhont and P. R. Lang, J. Chem. Phys., 2012, 136, 204704 CrossRef PubMed
.
- P. A. Midgley and M. Weyland, Ultramicroscopy, 2003, 96, 423–431 CrossRef
.
-
P. Schurtenberger, Contrast and contrast variation in neutron, X-ray, and light scattering, in Neutrons, X-rays and Light: Scattering Methods Applied to Soft Condensed Matter, ed. L. Peter and T. Zemb, North-Holland, Amsterdam, 2002, p. 145 Search PubMed
.
- M. Zackrisson, A. Stradner, P. Schurtenberger and J. Bergenholtz, Langmuir, 2005, 21, 10835–10845 CrossRef CAS PubMed
.
-
C. Tanford, The Hydrophobic Effect, Wiley, New York, 1973 Search PubMed
.
-
J. Israelachvili, Intramolecular and Surface Forces, Academic Press, 2nd edn, 1991, p. 370 Search PubMed
.
- S. Ottani, D. Vitalini, F. Comelli and C. Castellari, J. Chem. Eng. Data, 2002, 47, 1197–1204 CrossRef CAS
.
- J. P. Hansen and L. Verlet, Phys. Rev., 1969, 184, 151 CrossRef CAS
.
- H. S. Kang and F. H. Ree, J. Chem. Phys., 1995, 103, 3629 CrossRef CAS
.
- D. C. Wang and A. P. Gast, J. Phys.: Condens. Matter, 1999, 11, 10133–10141 CrossRef CAS
.
- J. Gapinski, G. Nägele and A. Patkowski, J. Chem. Phys., 2012, 136, 024507 CrossRef PubMed
.
- J. Gapinski, G. Nägele and A. Patkowski, J. Chem. Phys., 2014, 141, 124505 CrossRef PubMed
.
| This journal is © The Royal Society of Chemistry 2016 |

