 Open Access Article
Highly sensitive ethylene glycol-doped PEDOT–PSS organic thin films for LPG sensing
Apsar Pashaa,
Syed Khasim *bc,
Omar A. Al-Hartomyd,
Mohana Lakshmic and
K. G. Manjunathae
aDepartment of Physics, Ghousia College of Engineering, Ramanagaram-562159, Karnataka, India
bDepartment of Physics, Faculty of Science, University of Tabuk, Tabuk 71491, Kingdom of Saudi Arabia
cDepartment of Physics, PES University, Bangalore-560100, India. E-mail: syed.pes@gmail.com
dDepartment of Physics, Faculty of Science, King Abdul Aziz University, Jeddah-21599, Kingdom of Saudi Arabia
eDepartment of Chemistry, Ghousia College of Engineering, Ramanagaram-562159, Karnataka, India
First published on 16th May 2018
Abstract
In this study, for the first time we report the fabrication of low-cost ethylene glycol (EG)-doped PEDOT–PSS (poly 3,4-ethylenedioxythiophene:polystyrene sulfonate) organic thin film sensors for the detection of LPG at room temperature. The prepared thin films were characterized by scanning electron microscopy (SEM), atomic force microscopy (AFM), Fourier transform infrared spectroscopy (FTIR), ultraviolet-visible (UV-Vis) spectroscopy and thermogravimetric analysis (TGA) techniques for the analysis of their structural and morphological features. The doping of EG strongly improved the conductivity of pure PEDOT–PSS films by three orders of magnitude. The gas sensing responses of pristine and doped PEDOT–PSS thin films were investigated at room temperature by fabricating a sensor device on an ITO-coated glass substrate. The gas sensing characteristics of the prepared thin films were investigated for liquified petroleum gas (LPG), dimethyl propane, methane and butane test gases. The EG-doped PEDOT–PSS thin films exhibited excellent sensitivity for all the test gases, especially towards LPG, at room temperature. The sensitivity of the doped PEDOT–PSS films was recorded to be >90% for LPG with improved response and recovery time. The stability study indicated that the sensing response of doped PEDOT–PSS thin films was highly stable over a period of 30 days. Due to enhanced sensitivity, stability and fast response and recovery times, these EG-doped PEDOT–PSS thin films can be used in gas sensor technology, especially towards the detection of LPG at room temperature.
1. Introduction
In recent years, several sensor devices have been fabricated based on ceramic thin films, and these devices operate at very high temperatures. There is a growing demand to develop sensor devices which can detect flammable gases at room temperature. Methods are being devised to fabricate such devices, which are economical, accurate and stable.1–3 Several researchers have paid their attention towards the development of polymer thin film-based sensors by doping the thin films with small quantities of polar solvents, such as DMSO, ethylene glycol, DMF and sorbitol, due to their unique electrical resistivity and selective gas sensing properties.4–6 For instance, the doping of ZnO into PEDOT–PSS has reasonably improved the gas sensitivity, response and recovery time for sensing LPG.7 Polar solvent-doped PEDOT–PSS thin films have found considerable interest due to their ability to enhance the sensing properties, and these properties are not exhibited by polymeric materials alone.8–12 The PEDOT–PSS thin films are widely used as sensing materials in various gas sensors.13 Unfortunately, the conductivity and sensitivity of PEDOT–PSS thin films are low; this problem can be overcome by secondary doping in PEDOT–PSS. The incorporation of a polar solvent with a high boiling point in PEDOT–PSS can enhance the electron transport via direct or mediated methods, resulting in improved conductivity and sensitivity.14–16 Significant attention has been paid to study the gas sensing properties in ethylene glycol-doped PEDOT–PSS thin films. Recently, many studies have been carried out on the enhancement of gas sensitivity in doped PEDOT–PSS organic thin films used for the detection of LPG, ammonia, nitric oxide and alcohol. In these studies, it was observed that PEDOT–PSS thin films exhibit a maximum sensitivity of 58.90% upon exposure to 900 ppm of LPG.17,18In this study, the authors report a simple method for the fabrication of ethylene glycol-doped PEDOT–PSS thin film sensors useful for the detection of flammable gases at room temperature. Through this study, an attempt has been made to improve the sensitivity, stability, response and recovery time of PEDOT–PSS films by the secondary doping of ethylene glycol in PEDOT–PSS. Furthermore, the prepared thin films are characterized by SEM, AFM, FTIR, UV-Vis and TGA. The temperature-dependent conductivity, frequency-dependent conductivity and dielectric properties are studied using a Keithley source meter and impedance analyzer. The gas sensor device is fabricated by spin coating pristine and doped PEDOT–PSS thin films over an ITO-coated glass substrate to optimize the response towards sensing LPG and other test gases at room temperature.
2. Experimental
2.1 Materials
PEDOT–PSS (conductive grade with 0.5 wt% of PEDOT and 0.8 wt% of PSS dispersion in water media) and ethylene glycol (99.9% purity) were purchased from Sigma-Aldrich (India). The indium tin oxide-coated glass plates with dimensions of 2.5 cm × 2.5 cm and surface resistivity of 12 Ω sq−1 were also procured from Sigma-Aldrich (India). The test gases such as LPG, dimethylpropane, methane, and butane were procured from the Bharath Petroleum Company (India).2.2 Preparation of PEDOT–PSS organic thin films
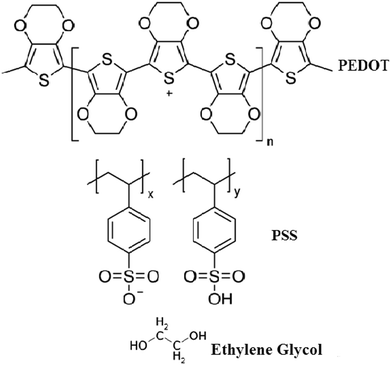
The organic thin films were prepared by the spin coating method by doping different weight percentages of EG (10 wt% and 20 wt%) in pure PEDOT–PSS. The solutions of pure and doped PEDOT–PSS were ultra-sonicated for 2 hours at room temperature to obtain uniform dispersions. The doped PEDOT–PSS solutions were filtered by using Whatman filter papers of pore size 0.45 μm prior to preparation of thin films. The pure and doped PEDOT–PSS thin films were developed on ITO-coated glass substrates with resistance of 12 Ω per square. The pristine and doped PEDOT–PSS solutions were coated by using the spin coating unit (Model No. Spin NXG-P1). The spin coating process was carried out at a rotation speed of 1000 rpm for 60 seconds. The prepared thin films were annealed at a temperature of 100 °C for 6 hours under ambient conditions to remove the moisture content from the thin films. Fig. 1 presents the chemical structures of PEDOT–PSS and ethylene glycol used in the present investigation.2.3 Design of gas sensor setup
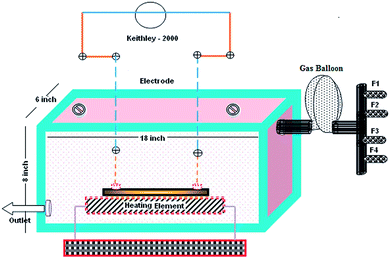
A gas sensor setup consisting of a rectangular box made out of glass plates was designed as shown in Fig. 2. Complete care was taken to ensure that the gas chamber was air tight and leak proof with proper sealing. The gas chamber consisted of four flow meters (F1, F2, F3 and F4) to introduce different test gases into the chamber through a gas balloon.19 A Keithley 2000 multimeter was used to measure changes in the resistance of thin films using the four probe technique. The degasification of the test gases was conducted through an outlet valve connected to an external vacuum pump.2.4 Fabrication of sensor device
The sensor device was fabricated with two components; one was a sensitive layer, which reacted with the analyte, and the other was a transducer, which converts chemical changes into electrical output. An ITO-coated glass substrate was used to prepare the sensor device. The glass substrates were sonicated in an ultrasonic bath for 30 minutes using acetone, isopropyl alcohol and deionized water; the cleaned glass substrates were then dried by blowing nitrogen. The pristine and PEDOT–PSS solutions doped with EG (with different wt% contents of EG in PEDOT–PSS) were sonicated for 30 minutes to get a uniform dispersion. The solutions of pristine and PEDOT–PSS doped with EG were spin-coated at 1000 rpm over rectangular electrodes of sensing area 2.5 × 2.5 cm2. Gold electrodes with an average thickness of 500 nm, line width of 300 μm and a contact distance of 1000 μm were deposited on the sensor area to form a transducer with ohmic contact by the thermal vapor deposition method. The schematic representation of the gas sensing device prepared using ethylene glycol doped in PEDOT–PSS is represented in Fig. 3.3. Experimental
The structural analyses of pure and EG-doped PEDOT–PSS thin films were carried out using an FTIR spectrophotometer (Thermo-Nicolet 6700) in KBr medium. A scanning electron microscope (Zeiss Ultra 60) and atomic force microscope (Bruker-Dimension Icon) were used to study the surface morphology of the prepared thin films. Absorbance and transmission spectra of the prepared thin films were studied using a UV-visible spectrometer (Analytik jena SPECORD S-600). The thermal characterization of the prepared thin films was carried out using a thermogravimetric analyzer (NETZSCH STA409 PC). The temperature-dependent conductivities of pure and EG-doped PEDOT–PSS thin films were studied by a four probe method (Keithley 2410 source meter) in the temperature range of 20 °C to 200 °C. The frequency-dependent conductivities and dielectric properties of pure and doped PEDOT–PSS thin films were studied by using the two probe technique in the frequency range of 50 Hz to 2 MHz using an LCR impedance analyzer (Model: Wayne Kerr 6500B). Gas sensor studies were carried out using a laboratory-made gas-flow-through sensor setup at room temperature (27 ± 1 °C) at a relative humidity of 40 ± 5%.20 The four probe technique was used to determine the change in electrical resistance of the prepared thin films by applying a constant voltage of 5 V using a simple voltage divider circuit in the presence of air, LPG, dimethyl propane, methane and butane test gases. Dry air (synthetic air) was used as the carrier gas for the different analyte test gases. The synthetic air was allowed in the volume chamber at a constant flux of 1 l min−1 until the resistance (Rair) of the sensor device stabilized. After the determination of Rair, the chamber was evacuated using an external vacuum pump connected to the chamber outlet. The analyte test gases of interest were obtained by controlling the flow rates and concentrations (using gas flow meters) and then, they were mixed with dry air at a constant flux of 1 l min−1. The resistance of the sensor device in the presence of different analyte test gases was recorded as Rgas. The sensitivity of pristine and doped PEDOT–PSS thin films in the presence of LPG, dimethyl propane, methane, and butane gases was determined using the following relation:| Sensitivity (%) = (Rair − Rgas/Rair) × 100 |
4. Results and discussion
4.1 Scanning electron microscope
Fig. 4(a) and (b) represent the SEM micrographs of pure and ethylene glycol-doped PEDOT–PSS thin films. The SEM micrograph of the pristine PEDOT–PSS thin film shown in Fig. 4(a) indicates the smooth morphology of the film without the formation of grains in the polymer matrix. The doping of EG into PEDOT–PSS leads to the creation of micro grains, which are perfectly interconnected with each other, as can be seen in Fig. 4(b). The doping of EG into PEDOT–PSS leads to a phase separation between PEDOT and PSS, which can be seen as bright and dark regions in the SEM micrograph. The bright and dark areas in the EG-doped PEDOT–PSS micrographs correspond to PEDOT-rich grains and PSS-rich matrix. The SEM image of doped PEDOT–PSS reveals homogeneous distribution of PEDOT grains in the PSS matrix, which results in the formation of interconnected conducting networks of PEDOT and PSS via the EG binder. The formation of interconnected micro grains is expected to facilitate the charge transport mechanism in the polymer chain due to better conducting pathways.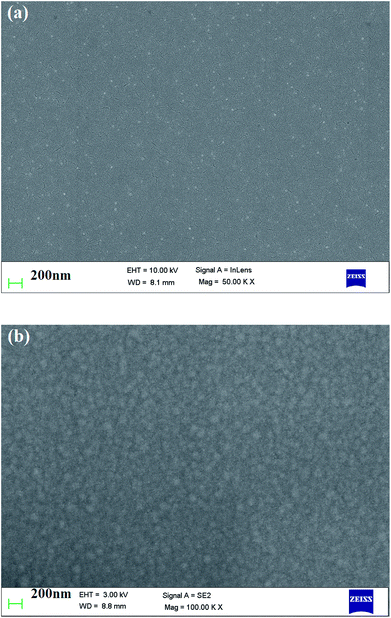 | ||
| Fig. 4 SEM micrographs of (a) pure PEDOT–PSS thin film (b) PEDOT–PSS thin film doped with 20 wt% EG. | ||
4.2 Atomic force microscope
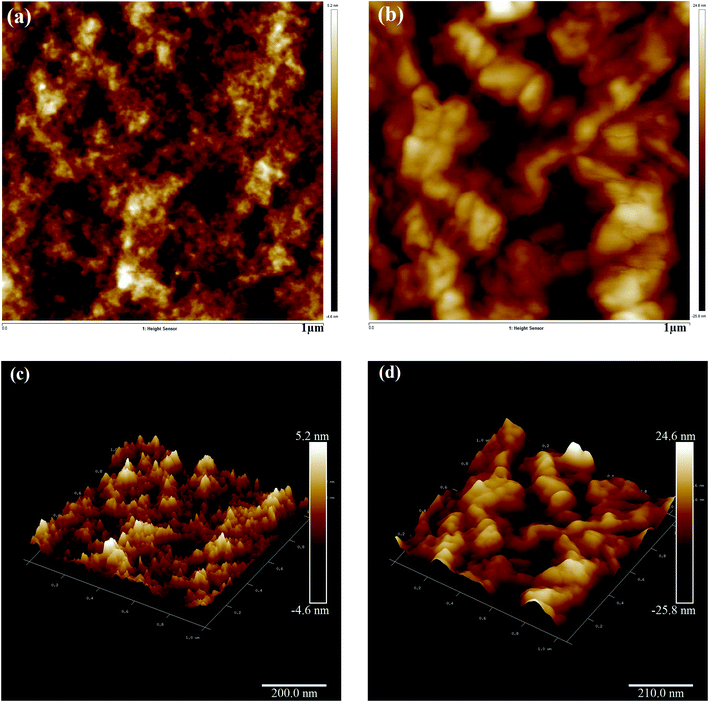
Fig. 5(a) and (c) present the 2D and 3D AFM images of the pristine PEDOT–PSS thin film, respectively. The AFM image of pristine PEDOT–PSS shows a smooth array of atoms associated with molecular separation between PEDOT–PSS chains with the rms roughness of about 5.2 nm. In pristine PEDOT–PSS, the electrostatic interaction between positively charged PEDOT and negatively charged PSS is very low, and this kind of morphology hinders the charge carrier transport. In Fig. 5(a), the bright regions correspond to PEDOT-rich particles, and dark regions represent smooth PSS-rich particles. Fig. 5(b) and (d) present the 2D and 3D AFM images of the EG-doped PEDOT–PSS thin film. The AFM images of the doped PEDOT–PSS thin film exhibit significant changes with the appearance of thick domains. The morphological changes in the doped PEDOT–PSS thin film are due to the conformational changes from the coil structure to the linear structure of the polymer backbone. It is observed that in the doped PEDOT–PSS thin film, the formation of dark spots indicates the embedded PEDOT-rich domains, and the broad bright spots represent PSS-rich particles.21–23 Furthermore, the spatial separation in the PEDOT domains decreases their electrostatic interaction with the PSS-rich domains. By doping ethylene glycol in PEDOT–PSS, we can observe that the rms roughness increases from 5.2 nm for pure PEDOT–PSS to 24.6 nm for the EG-doped PEDOT–PSS thin film. The increase in surface roughness in the doped thin film might be due to the thinning effect of the PSS segment as a result of its interaction with ethylene glycol. Since ethylene glycol has two hydroxyl groups that can readily interact with the PEDOT and PSS segments, we can expect a compact morphology of the doped PEDOT–PSS thin film.4.3 FTIR analysis
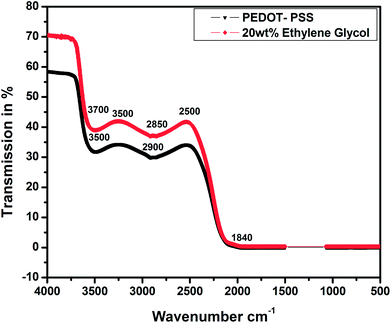
Fig. 6 shows the FTIR spectra of the pristine and EG-doped PEDOT–PSS thin films; these results can help us understand the structural confirmations of different functional groups in pure and doped PEDOT–PSS thin films. The main characteristic peaks detected for pristine PEDOT–PSS are observed at 3700 cm−1 due to the O–H stretching, 3500 cm−1 due to the C–H stretching, and 2900 cm−1 due to the C![[double bond, length as m-dash]](https://www.rsc.org/images/entities/char_e001.gif) O stretching. The EG-doped PEDOT–PSS thin films exhibit a characteristic absorption band at 1840 cm−1 due to the intrinsic vibration of the O
O stretching. The EG-doped PEDOT–PSS thin films exhibit a characteristic absorption band at 1840 cm−1 due to the intrinsic vibration of the O![[double bond, length as m-dash]](https://www.rsc.org/images/entities/char_e001.gif) H group, which confirms the doping of EG in PEDOT–PSS. The addition of EG in PEDOT–PSS results in an increase in the peak intensity, and it is also observed that the peaks shift towards a higher wave number region. This study reveals the homogenous dispersion of EG and PEDOT–PSS with a weak interaction through van der Waals forces. The small variation in the FTIR spectra of doped PEDOT–PSS is due to the delocalization of electrons in the aromatic rings and C
H group, which confirms the doping of EG in PEDOT–PSS. The addition of EG in PEDOT–PSS results in an increase in the peak intensity, and it is also observed that the peaks shift towards a higher wave number region. This study reveals the homogenous dispersion of EG and PEDOT–PSS with a weak interaction through van der Waals forces. The small variation in the FTIR spectra of doped PEDOT–PSS is due to the delocalization of electrons in the aromatic rings and C![[double bond, length as m-dash]](https://www.rsc.org/images/entities/char_e001.gif) O bonds to π clouds and the formation of π–π stacking upon the addition of ethylene glycol.24 Hence, it can be concluded that the presence of EG in PEDOT–PSS favors the conformational changes from coil to linear structure via π–π interactions between EG and PEDOT–PSS.
O bonds to π clouds and the formation of π–π stacking upon the addition of ethylene glycol.24 Hence, it can be concluded that the presence of EG in PEDOT–PSS favors the conformational changes from coil to linear structure via π–π interactions between EG and PEDOT–PSS.
4.4 UV-visible spectroscopy
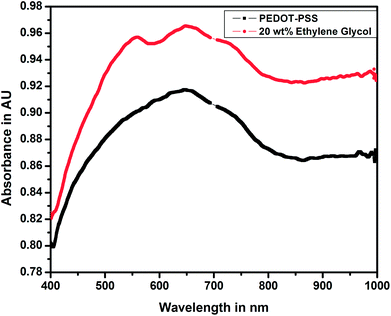
Fig. 7 shows the UV-visible spectra of pure and doped PEDOT–PSS thin films studied in the wavelength range of 400 nm to 1000 nm. The UV-visible spectra of both pure and doped PEDOT–PSS thin films exhibit similar trends, the spectra shows relatively sharp absorption peaks in the ultraviolet region (550–750 nm) and broad absorption peak near infrared (NIR) region. In the doped PEDOT–PSS thin films, the characteristic peak shifts towards the higher wavelength region due to the formation of π–π conjugations in the polymer backbone. The higher energy transition in the doped PEDOT–PSS thin films gives rise to π–π* transitions. The band observed at a wavelength of 800 nm is described as a free carrier tail, which arises mainly due to polaron and bipolaron sub-gap transitions in the polymer chain.25 The UV-Vis spectra of the doped film show higher peak intensity in the absorption spectra due to the possible interactions between PEDOT–PSS domains assisted through the presence of EG. The presence of EG in PEDOT–PSS disrupts the bonding and electrostatic interaction between PEDOT and PSS counterparts and leads to phase separation as well as π-stacking; this results in the increased intensity of doped PEDOT–PSS thin films, as observed in UV-Vis spectra.4.5 Thermogravimetric analysis
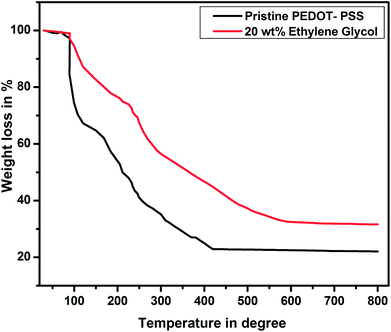
Fig. 8 shows the thermograms of pure and EG-doped PEDOT–PSS thin films. It is observed that the thin films exhibit weight loss in three steps. The initial weight loss occurs at 100 °C, which is mainly due to the evaporation of water from the thin films. In the second stage, the weight loss is due to the significant loss of EG at a temperature around 200 °C, which is close to the boiling point of EG. At the temperature around 200 °C, the pristine PEDOT–PSS film shows 50% weight loss, whereas EG-doped PEDOT–PSS thin films exhibit 37% weight loss. The doped PEDOT–PSS thin films exhibit a constant weight loss beyond 500 °C, and 35% of the PEDOT–PSS residue remains at higher temperatures. This confirms the better thermal stability of EG-doped PEDOT–PSS films in comparison with that of pristine PEDOT–PSS.5. Transport properties
5.1 Temperature-dependent conductivity
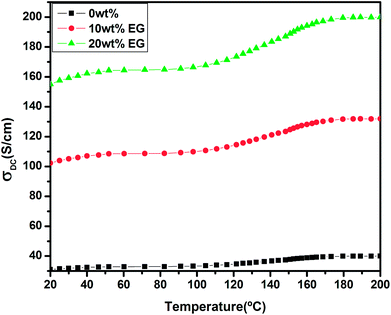
Fig. 9 shows the temperature-dependent conductivities for the pristine and EG-doped PEDOT–PSS thin films in the temperature range of 20 °C to 200 °C. The pristine PEDOT–PSS thin film exhibits a three-step variation in conductivity. Initially, there is a small increment in the conductivity values between the temperature range of 20 °C to 80 °C. In the temperature range of 80 °C to 160 °C, the conductivity shows a marginal increment, and it is found to increase rapidly between the temperature range from 160 °C to 200 °C. Among all of the compositions, the PEDOT–PSS thin film doped with 20 wt% EG shows higher conductivity. The enhancement in conductivity of the doped films is mainly due to the creation of a large number of charge carriers in the polymer backbone with the addition of EG. Additionally, the elongation of polymer chain length and the ease with which charge carriers (polarons/bipolarons) hop between the conducting PEDOT and insulating PSS chain result in improved conductivity.26 The conductivity of the pristine PEDOT–PSS thin film is found to be 39 S cm−1, whereas the addition of 20 wt% of EG significantly increases the conductivity of doped films to 199 S cm−1. The addition of EG into PEDOT–PSS increases the conductivity by 3 orders of magnitude when compared with that observed for pure PEDOT–PSS film. The presence of EG in PEDOT–PSS favors the formation of well-connected monolayers of PEDOT and PSS, resulting in higher conductivity.27,28 The screening effect after the introduction EG in PEODT–PSS may be the driving force for the conformational changes in PEDOT and PSS chains. The screening effect of EG in PEDOT–PSS also plays a significant role in decreasing the activation energies of the doped films, as shown in Table 1.| S. no. | Sample | Activation energy in eV |
|---|---|---|
| 1 | Pure PEDOT–PSS | 5.2024123 × 10⁻⁴ |
| 2 | 10 wt% of EG | 4.6731267 × 10⁻⁴ |
| 3 | 20 wt% of EG | 2.6564867 × 10⁻⁴ |
5.2 Frequency-dependent conductivity
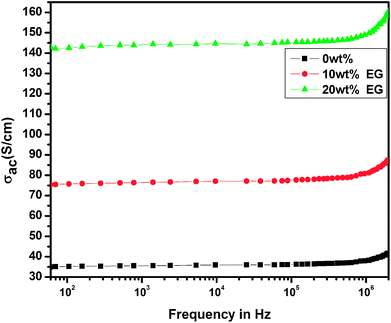
Fig. 10 shows the variation of frequency-dependent conductivity for the pristine PEDOT–PSS and EG-doped PEDOT–PSS thin films. In the pristine and EG-doped PEDOT–PSS thin films, the conductivities were observed to increase with an increase in the applied frequency, and these results obeyed the universal power law. In the low frequency region, the conductivity of the thin films was relatively small and independent of frequency; however, in the higher frequency region, the conductivity exhibited a strong dependence on frequency. The enhancement in conductivity was due to Maxwell–Wagner–Sillar's (MWS) interfacial polarization supported by the hopping of conduction electrons at higher frequencies. In Fig. 10, it can be observed that the doping of EG in PEDOT–PSS significantly enhanced the conductivity by 3 orders of magnitude in comparison to that observed for pure PEDOT–PSS thin films. Among the various thin films prepared, 20 wt% EG-doped PEDOT–PSS thin film exhibited higher conductivity beyond the frequency of 105 Hz. Such a behavior of conductivity observed in these materials might be due to the polarization effects at the grain boundaries in the polymer matrix. The doping of EG in PEDOT–PSS led to the creation of large grains with a compact morphology and facilitated the charge transport mechanism in the form of polarons and bipolarons, which resulted in significant enhancement in the frequency-dependent conductivity.5.3 Dielectric studies
The variations of real and imaginary parts of the dielectric constant with the applied frequency for pure and EG-doped PEDOT–PSS thin films are depicted in Fig. 11 and 12, respectively. The real and imaginary parts of the dielectric constant were found to decrease gradually as a function of applied frequency due to dipole polarization.29 The thin films exhibited high values of dielectric constants towards lower frequencies due to polarization effects and at higher frequencies, the dielectric constant was observed to decrease due to the switching action of dipoles to the applied electric field.30 It was observed that both the components of the dielectric constant exhibited a broad dispersion in the entire frequency range due to dipole polarization, which is mainly associated with MWS interfacial polarization. Among the different thin films prepared, the pristine PEDOT–PSS showed a higher dielectric constant value, and PEDOT–PSS thin films doped with 20 wt% EG exhibited a very low dielectric constant. The decrease in the values of dielectric constant can be mainly due to resonant electronic transition or molecular vibrations in the polymer matrix as well as interfacial electrode polarization at the grain boundaries with the addition of EG in PEDOT–PSS.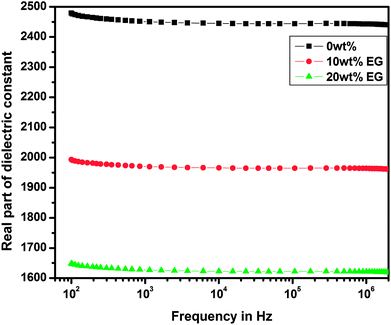 | ||
| Fig. 11 Variation of real part of dielectric constant in pure PEDOT–PSS and PEDOT–PSS thin film doped with EG. | ||
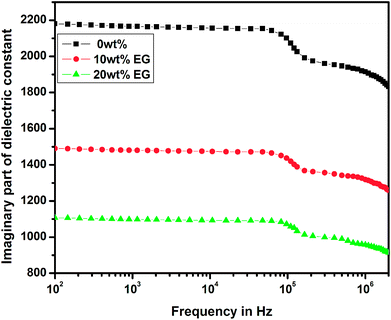 | ||
| Fig. 12 Variation of imaginary part of dielectric constant in pure PEDOT–PSS and PEDOT–PSS thin film doped with EG. | ||
6. Gas sensor study
6.1 Gas sensing mechanism
Various gas sensing mechanisms have been proposed for polymer systems including the reduction reaction between the analyte and polymer. The charge transfer mechanisms between the analyte and polymer consequently result in the swelling of polymer chains.31,32 In the case of PEDOT–PSS and doped PEDOT–PSS thin films, it was observed that the resistance increased upon exposure to the gas. The change in resistance can be explained on the basis of three possible mechanisms:(1) When the pure and doped PEDOT–PSS thin films were exposed to the gas, there was an increase in the volume of the polymer matrix. The increasing chain lengths in the polymer resulted in better conducting paths, which led to a change in the resistance of the films in air and gas media.
(2) The reaction between the analyte and polymer is generally a reduction reaction where oxygen is chemisorbed over the exterior surface in a region between PEDOT–PSS and EG. The trapped oxygen blocks the charge carrier hopping, thereby increasing the resistance of the films in the air medium. When the polymer is exposed to gas molecules, it reacts with the oxygen species, which results in electron delocalization within the pure and doped PEDOT–PSS thin films. Generally, the reactions of different gases such as LPG, dimethylpropane, methane and butane with chemisorbed oxygen can be represented as follows:33
| CnH2n+2 + 2O− → CnH2n − O + H2O + e− |
| C5H12 + 2O− → C5H10 − O + H2O + e− |
| CH4 + 2O− → CH2 − O + H2O + e− |
| C4H10 + 2O− → C4H8 − O + H2O + e− |
(3) In direct charge transfer mechanism, the gas molecules are adsorbed onto the surfaces of pure and doped PEDOT–PSS thin films via physisorption. These gas molecules interact with the polymer matrix thereby causing delocalization of the π electrons.34 The addition of dopants in PEDOT–PSS enhances the surface area of absorption and improves the π–π links, resulting in higher sensing performance.
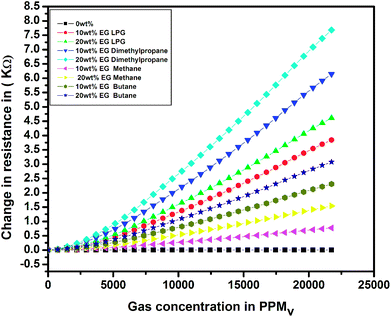
To investigate the sensing characteristics of the prepared thin films upon exposure to different test gases, the change in resistance (ΔR = Rg − Ra) was evaluated in the presence of various test gases. The results for the change in electrical resistance for the pristine and EG-doped PEDOT–PSS thin films for different test gases at room temperature are shown in Fig. 13. The change in resistance increased linearly with an increase in the concentration of test gases, and a maximum change was observed for the PEDOT–PSS thin film doped with 20 wt% of EG after it was exposed to LPG. The increase in ΔR for all the samples was mainly due to the swelling effects of polymer chains when they were exposed to test gases. The swelling effects resulted in distorted conducting paths, leading to a greater change in resistance. The increase in ΔR can also be due to the creation of a large number of holes when the samples are exposed to test gases, which indicated that the EG-doped PEDOT–PSS thin film behaves as a p-type semiconductor material. The ΔR value was observed to be quite high in the case of LPG due to the fact that the exposure to LPG creates more number of holes in the polymer matrix when compared with the observations for other test gases.
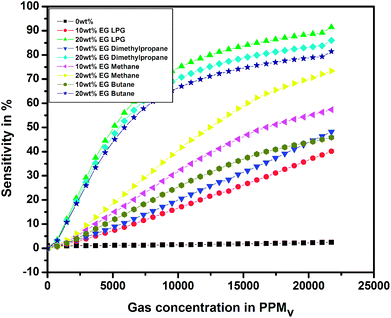
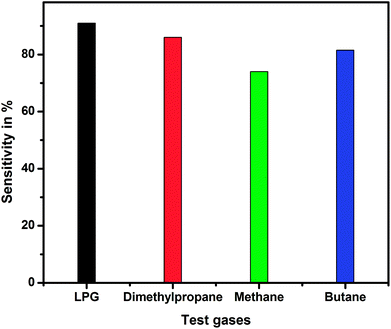
Fig. 14 shows the variation in sensitivity with the concentration of different test gases for the pristine and EG-doped PEDOT–PSS thin films studied at room temperature. From the plots, it was observed that the PEDOT–PSS thin films doped with 20 wt% of EG showed higher sensitivity of the order of 90% for LPG gas in comparison to the results obtained for the other test gases. This can be mainly due to the higher values of ΔR for LPG. The EG-doped PEDOT–PSS thin films were highly sensitive to LPG, which led to pronounced ΔR, and this in-turn enhanced the sensitivity of the films. The increase in the sensitivity of the doped films was mainly due to an increase in the surface roughness of the films with the addition of EG. This increase in the surface roughness provided a higher surface-to-volume ratio for the analyte gas molecules to react with the polymer matrix, which effectively increased the sensitivity of the doped films. Upon exposure to gas molecules, the interaction between doped polymer and analyte led to charge transfer with the delocalization of π-electrons, thus resulting in improved sensing performance of the thin films. The higher content of EG in PEDOT–PSS created more π-networks, leading to better sensitivity. Hence, the maximum sensitivity was observed for 20 wt% EG content in PEDOT–PSS. Among the prepared thin films, the PEDOT–PSS thin film doped with 20 wt% of EG exhibited a sensitivity in the order of 91% on exposure to LPG in comparison to the results obtained for dimethyl propane (86%), butane (81%) and methane (73%). In the present study, the authors for the first time report a high sensitivity (>90%) at room temperature towards the detection of LPG using these thin films in comparison with the data available in the literature.
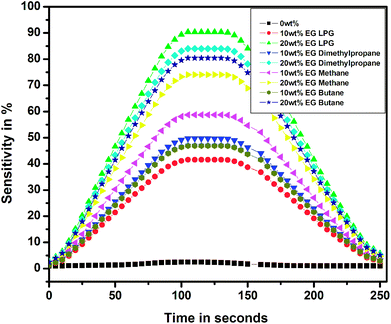
Fig. 15 shows the sensitivity of the thin films for different test gases as a function of time over a complete cycle of gasification and degasification. The sensitivity over a complete cycle was found to be the highest for the PEDOT–PSS thin film doped with 20 wt% of EG for LPG when compared with the observations for other test gases, and these results were also in accordance with the results observed in Fig. 13 and 14. The response and recovery times for pristine and EG-doped PEDOT–PSS thin films calculated from the observations in Fig. 15 are represented in Table 2.
| S. no. | Details of test gases | Composition | Response time in minutes | Recovery time in minutes |
|---|---|---|---|---|
| 1 | LPG | Pure PEDOT–PSS | 14.67 | 22.34 |
| 10 wt% of EG | 11.87 | 17.64 | ||
| 20 wt% of EG | 8.45 | 12.75 | ||
| 2 | Dimethylpropane | Pure PEDOT–PSS | 13.12 | 20.12 |
| 10 wt% of EG | 11.89 | 16.32 | ||
| 20 wt% of EG | 9.12 | 14.1 | ||
| 3 | Methane | Pure PEDOT–PSS | 12.1 | 19.12 |
| 10 wt% of EG | 11.1 | 15.02 | ||
| 20 wt% of EG | 10.1 | 13.25 | ||
| 4 | Butane | Pure PEDOT–PSS | 13.12 | 18.45 |
| 10 wt% of EG | 12.12 | 17.12 | ||
| 20 wt% of EG | 11.12 | 16.35 |
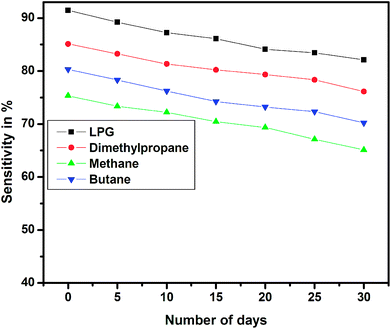
The long-term stability of the sensor device was tested over a period of 30 days for different test gases, and the results are shown in Fig. 16. The stability studies indicate that the EG-doped PEDOT–PSS thin films are highly stable over a period of 30 days with nearly 10% decrease in the sensitivity at the end of 1 month.
The selectivity studies of the pristine and PEDOT–PSS thin films doped with EG for different test gases are shown in Fig. 17. The selectivity studies reveal the fact that the sensitivity of the thin films used in the present investigation is quite high towards LPG compared to that towards other test gases such as dimethyl propane, methane, and butane. From the selectivity studies, it can be concluded that the ethylene glycol-doped PEDOT–PSS thin films are better candidates for LPG sensing.
7. Conclusion
The PEDOT–PSS organic thin films were prepared by doping ethylene glycol of different concentrations in PEDOT–PSS. The prepared thin films were characterized by SEM, AFM, UV-visible spectra, FTIR and TGA. The SEM micrograph of EG-doped PEDOT–PSS revealed the formation of micro grains of about 30 nm in size. The AFM images of the pure and doped PEDOT–PSS thin films indicated the formation of phase separation with improved rms roughness in the PEDOT–PSS thin films doped with EG. The FTIR spectra confirmed the uniform dispersion of EG in PEDOT–PSS, and the UV-visible spectra showed an increase in the intensity of the peaks and the formation of a large number of charge carriers through π–π interactions. The thermal characterization studies showed that the doped PEDOT–PSS thin films were more stable than the pristine PEDOT–PSS thin films. The temperature-dependent conductivity was found to increase by three orders of magnitude compared to that of the pure PEDOT–PSS thin film. The PEDOT–PSS thin films doped with EG exhibited improved dielectric response in comparison to pristine PEDOT–PSS. The sensor device fabricated using doped films showed better sensitivity (>90%) with fast response and recovery time when exposed to LPG in comparison to the sensor devices exposed to other test gases such as dimethyl propane, methane and butane. The gas response was found to increase when the content of EG in PEDOT–PSS was increased. The improved sensing response in these films was mainly due to the swelling of polymer chains and direct charge transfer between the polymer and analyte. The stability study towards sensing performance indicated that the films were highly stable over a period of 30 days with a loss in sensitivity of nearly 10%. Due to low cost, simple technique of fabrication, and improved conductivity and dielectric response along with better sensitivity towards detection of various gases, especially LPG, these thin films can be useful materials in gas sensor technology for the detection of flammable gases.Conflicts of interest
There are no conflicts of interest to declare.Acknowledgements
Authors Apsar Pasha and Syed Khasim have equal contributions in this manuscript.References
- K. Arshak and I. Gaidan, Mater. Sci. Eng., B, 2005, 118, 44 CrossRef
.
- V. R. Shinde, T. P. Gujar and C. D. Lokhande, Sens. Actuators, B, 2007, 120, 551 CrossRef
.
- L. F. Nazar, Z. Zang and D. Zinkweg, J. Am. Chem. Soc., 1992, 114, 6239 CrossRef
.
- A. Pasha, A. S. Roy, M. V. Murugendrappa, O. A. Al-Hartomy and S. Khasim, J. Mater. Sci.: Mater. Electron., 2016, 27, 8332 CrossRef
.
- Y. Sun, S. Yang, P. Du, F. Yan, J. Qu, Z. Zhu, J. Zuo and C. Zhang, Opt. Express, 2017, 25, 1723 CrossRef PubMed
.
- F. Soltani-kordshuli and F. Zabihi, Engineering Science and Technology, an International Journal, 2016, 19, 1216–1223 CrossRef
.
- D. S. Dhawale, D. P. Dubal, A. M. More, T. P. Gujar and C. D. lokhande, Sens. Actuators, B, 2010, 147, 488 CrossRef
.
- J. Li, J. Liu and C. Gao, e-Polym., 2011, 11, 428 Search PubMed
.
- S. Timpanaro, M. Kemerink, F. J. Touwslager, M. M. de Kok and S. Schrader, Chem. Phys. Lett., 2004, 394, 339 CrossRef
.
- B. Y. Ouyang, C. W. Chi, F. C. Chen, Q. Xu and Y. Yang, Adv. Funct. Mater., 2005, 15, 203 CrossRef
.
- E. Yang, J. Kim, B. J. Jung and J. Kwak, J. Mater. Sci.: Mater. Electron., 2015, 26, 2838 CrossRef
.
- A. M. Nardes, M. Kemerink, R. A. J. Janssen, J. A. M. Bastiaansen, N. M. M. Kiggen, B. M. W. Langeveld, A. J. J. M. van Breemen and M. M. de Kok, Adv. Mater., 2007, 19, 1196 CrossRef
.
- Y. Seekae, S. Lokavee, D. Phokharatku, A. Wisitsoraat, T. Kerdcharoen and C. Wongchoosuk, Org. Electron., 2014, 15, 2971–2981 CrossRef
.
- G. A. Sotzing, S. M. Briglin, R. H. Grubbs and N. S. Lewis, Anal. Chem., 2000, 72, 3181 CrossRef PubMed
.
- A. M. Nardes, M. Kemerink, M. M. de Kok, E. Vinken, K. Maturova and R. A. J. Janssen, Org. Electron., 2008, 9, 727 CrossRef
.
- A. Onorato, M. A. Invernale, I. D. Berghorn, C. Pavlik, G. A. Sotzing and M. B. Smith, Synth. Met., 2010, 160, 2284 CrossRef
.
- N. B. Sanawane, R. R. Ahire, K. V. Gurav and B. Sankapal, J. Alloys Compd., 2004, 592, 1 CrossRef
.
- R. D. Ladhe, K. V. Gurav, S. M. Pawar, J. H. Kim and B. R. Sankapal, J. Alloys Compd., 2012, 515, 80 CrossRef
.
- A. Parveen, A. R. Koppalkar and A. S. Roy, Sens. Lett., 2013, 11, 242 CrossRef
.
- T. Machappa, M. Sasikala and M. V. N. Ambika Prasad, IEEE Sens. J., 2010, 10, 807 CrossRef
.
- U. Lang, E. Muller, N. Naujoks and J. Dual, Adv. Funct. Mater., 2009, 19(8), 1215 CrossRef
.
- A. M. Nardes, M. Kemerink, R. A. J. Janssen, J. A. M. Bastiaansen, N. M. M. Kiggen, B. M. W. Langeveld, A. J. J. M. Van Breemen and M. M. de Kok, Adv. Mater., 2007, 19, 1196 CrossRef
.
- D. A. Mengistie, M. A. Ibrahem, P.-C. Wang and C.-W. Chu, ACS Appl. Mater. Interfaces, 2014, 6, 2292 Search PubMed
.
- A. Mandal and A. K. Nandi, J. Phys. Chem. C, 2012, 116, 9360 Search PubMed
.
- P. Granitzer and K. Rumpf, Materials, 2011, 4, 908 CrossRef PubMed
.
- M. Angelopoulos, IBM J. Res. Dev., 2001, 45, 57 CrossRef
.
- L. A. A. Petterson, S. Ghosh and O. Inganas, Org. Electron., 2002, 3, 143 CrossRef
.
- S. Timpanaro, M. Kemerink, F. J. Touwslager, M. M. dekok and S. Schrader, Chem. Phys. Lett., 2004, 394, 339 CrossRef
.
- S. Abdul Jawad, A. S. Abu Surrah and Z. Khattari, Phys. B, 2011, 406(13), 2565 CrossRef
.
- V. Panwar, B. Kang and J. O. Park, Eur. Polym. J., 2009, 45(6), 1777 CrossRef
.
- C. Y. Lina, J. G. Chena, C.-W. Hub, J. J. Tunneyc and K. C. Hoa, Sens. Actuators, B, 2009, 140, 402 CrossRef
.
- H. Bai and G. Shi, Sensors, 2007, 7, 267 CrossRef
.
- K. Arshak and I. Gaidan, J. Mater. Sci. Eng. B, 2005, 118, 44 CrossRef
.
- X. Crispin, S. Marciniak, W. Osikowicz, G. Zotti and A. W. Denier Vander Gon, J. Polym. Sci., Part B: Polym. Phys., 2003, 41, 2525 CrossRef
.
| This journal is © The Royal Society of Chemistry 2018 |

