Simple renormalization schemes for multiple scattering series expansions
Received
3rd December 2021
, Accepted 4th February 2022
First published on 4th February 2022
Abstract
A number of renormalization schemes for improving the convergence of multiple scattering series expansions are investigated. Numerical tests on a small Cu(111) cluster demonstrate their effectiveness, for example increasing the rate of convergence by up to a factor 2 or by transforming a divergent series into a convergent one. These techniques can greatly facilitate multiple scattering calculations, especially for spectroscopies such as photoelectron diffraction, Auger electron diffraction, low energy electron diffraction etc., where an electron propagates with a kinetic energy of hundreds of eV in a cluster of hundreds of atoms.
1 Introduction
Multiple Scattering Theory (MST) is one of the methods favored to model spectroscopies such as photoemission, X-ray absorption or electron diffraction, and more generally, most of the core-level spectroscopies. In particular, as far as condensed matter is concerned, electron diffraction based techniques such as photoelectron diffraction, Auger electron diffraction or low energy electron diffraction are quite simple experimental setups yet powerful enough to infer crystallographic and structural characteristics of thin layers of materials. The flexibility of MST also makes it particularly suited to the study of the electronic structure of materials as it can describe within the same formalism both bound and continuum states.1,2 In the former case, MST is generally known as KKR theory. Far from being limited to surface or material science, MST also enjoys widespread use in several areas of physics (nuclear physics, condensed matter, acoustics, geophysics, etc.), since describing the interaction of a wave with a media composed of distinguishable objects/obstacles acting as scatterers is a more general problem.
Among the different formulations of MST, the so-called scattering path operator approach has been shown to be particularly convenient for modelling both spectroscopies and band structures. Within this approach, the scattering path operator ![[small tau, Greek, macron]](https://www.rsc.org/images/entities/i_char_e0d4.gif) ji can be identified as the operator describing all the pathways an electron can travel in order to move from atom i to atom j. As such, it contains all the information about the structural, electronic and magnetic properties of the material under consideration.
ji can be identified as the operator describing all the pathways an electron can travel in order to move from atom i to atom j. As such, it contains all the information about the structural, electronic and magnetic properties of the material under consideration.
In practice, if we denote the potential describing the interaction of the probe particle with atom i as Vi and the propagator describing the behaviour of this probe within the material by G, we can define the scattering path operator as
Here, the overbar is simply a reminder that, because atom
i and atom
j do not generally coincide with the arbitrary origin we choose, the corresponding operator contains translation operators referring to this origin.
3
The differential cross sections for many spectroscopies can then be expressed as functions of matrix elements of this scattering path operator.4 Its evaluation is thus critical in the MST approach, however the definition (1) is not very useful for practical purposes, as it contains the total Green's function or propagator for the full system. Instead, we can express the scattering path operator in terms of the free propagator G0 and transition operators ![[T with combining macron]](https://www.rsc.org/images/entities/i_char_0054_0304.gif) i for the individual scattering by the potential
i for the individual scattering by the potential ![[V with combining macron]](https://www.rsc.org/images/entities/i_char_0056_0304.gif) i centered on the atom i. The eqn (1) can then be written as
i centered on the atom i. The eqn (1) can then be written as
| |  | (2) |
known as the equation of motion of the scattering path operator, which can be expressed in matrix form as
| |  | (3) |
The elements of the matrix
τ are the individual scattering path operators between the atoms
i and
j. For spherical potentials, the matrix
T is diagonal with elements
![[T with combining macron]](https://www.rsc.org/images/entities/i_char_0054_0304.gif) i
i, while the elements of
G0 are
![[scr T, script letter T]](https://www.rsc.org/images/entities/char_e533.gif)
(−
![[R with combining right harpoon above (vector)]](https://www.rsc.org/images/entities/b_char_0052_20d1.gif) i
i)
G0![[scr T, script letter T]](https://www.rsc.org/images/entities/char_e533.gif)
(
![[R with combining right harpoon above (vector)]](https://www.rsc.org/images/entities/b_char_0052_20d1.gif) j
j).
![[scr T, script letter T]](https://www.rsc.org/images/entities/char_e533.gif)
(
![[R with combining right harpoon above (vector)]](https://www.rsc.org/images/entities/b_char_0052_20d1.gif) )
) is the translation operator which shifts position vectors by
![[R with combining right harpoon above (vector)]](https://www.rsc.org/images/entities/b_char_0052_20d1.gif)
; these translations are necessary to be able to use the transition operators for single scattering, which are determined for a potential centered on the origin. The matrix elements of
![[scr T, script letter T]](https://www.rsc.org/images/entities/char_e533.gif)
(−
![[R with combining right harpoon above (vector)]](https://www.rsc.org/images/entities/b_char_0052_20d1.gif) i
i)
G0![[scr T, script letter T]](https://www.rsc.org/images/entities/char_e533.gif)
(
![[R with combining right harpoon above (vector)]](https://www.rsc.org/images/entities/b_char_0052_20d1.gif) j
j) are also known as the KKR structure constants.
The elements of G0 can be calculated using a suitable basis (plane waves or spherical waves for example), while the individual, single scattering transition matrix elements can be obtained by matching the logarithmic derivative of the inner and outer solutions of the Schrödinger equation at the surface of the potential, using standard partial wave techniques. It is then straightforward to construct the kernel matrix G0T and compute the inverse of (I − G0T) to obtain τ. This approach, which we shall call the matrix inversion (MI) method, is in principle exact, but is limited by the size of the matrix that can be stored; in a cluster of Nat atoms, if for a given kinetic energy angular momenta up to ![[small script l]](https://www.rsc.org/images/entities/char_e146.gif) max are required to adequately represent the propagating electron, the dimension of the matrix to be inverted will be of the order of N = Nat(
max are required to adequately represent the propagating electron, the dimension of the matrix to be inverted will be of the order of N = Nat(![[small script l]](https://www.rsc.org/images/entities/char_e146.gif) max + 1)2. Since the matrix elements are complex, the amount of storage required will be 16N2 bytes; the extra work space required in matrix inversion routines for example in the LAPACK library5 can double this. Furthermore, the time required to invert the matrix increases as N3, so that calculations can quickly become very lengthy and greedy for memory, particularly for larger systems at higher electron kinetic energies, since
max + 1)2. Since the matrix elements are complex, the amount of storage required will be 16N2 bytes; the extra work space required in matrix inversion routines for example in the LAPACK library5 can double this. Furthermore, the time required to invert the matrix increases as N3, so that calculations can quickly become very lengthy and greedy for memory, particularly for larger systems at higher electron kinetic energies, since ![[small script l]](https://www.rsc.org/images/entities/char_e146.gif) max increases with increasing energy. In such cases, other approaches such as the path operator expansion6 or Lanczos techniques7 could be useful.
max increases with increasing energy. In such cases, other approaches such as the path operator expansion6 or Lanczos techniques7 could be useful.
An alternative procedure is to solve the eqn (2) iteratively by replacing ![[small tau, Greek, macron]](https://www.rsc.org/images/entities/i_char_e0d4.gif) ki on the right-hand side by its equation of motion, yielding
ki on the right-hand side by its equation of motion, yielding
| |  | (4) |
which is often referred to as the Watson series expansion for the scattering path operator. It is equivalent to a Taylor matrix series (MS) expansion of the inverse:
| |  | (5) |
where the non-Hermitian kernel matrix (
TG0 or
G0T depending on the form used) is now denoted by
K. When it comes to model complex phenomena in condensed matter physics arising from the propagation of an electron in a finite collection of hundreds of atoms at kinetic energies of hundreds of eV, the series expansion is the preferred choice. The advantage of this method is that it can be implemented without storing the full matrix, for example by recalculating the elements required when evaluating individual scattering path operators using
eqn (2). This will greatly reduce the memory requirements of a simulation to the point of rendering it feasible, at the price of increasing the computation time, especially if the series converges slowly. Even worse, the simulation may fail if the series does not converge at all.
The convergence of series expansions is an old problem in mathematical physics that has been greatly studied over several centuries, leading to the development of a number of interesting approaches (see ref. 8 for an overview of several of these methods).
The aim of this article is to explore a way of extending the boundaries of the standard series expansion implementation by improving its convergence. The technique proposed is the so-called renormalization of the MS series, which was introduced a few years ago by Sébilleau and Natoli.8
The paper is organized as follows. In the first part (Section 2), we discuss an efficient way of monitoring the convergence properties of the series expansion, namely the application of the power method to compute the spectral radius of the kernel matrix. Next (Section 3), we present three different renormalization schemes aimed at improving the convergence. Finally, in Section 4 we apply these schemes in the calculation of the photoelectron diffraction diagram of a Cu(111) cluster, demonstrating that the renormalized series expansion can reproduce very well the exact matrix inversion solution. These methods are implemented in MsSpec, a multiple scattering package for spectroscopies.9,10
2 Monitoring the convergence of the MS expansion
2.1 The spectral radius
The MS series expansion approach is only meaningful if this expansion converges. Therefore, we need a tool that can help us monitor the convergence properties of the expansion. The spectral radius is exactly the tool we need. For a given matrix K, the spectral radius is defined by| | | ρ(K) = max|λi| i ∈ [1, N], | (6) |
where λi is the ith eigenvalue of K and N is the dimension of the matrix. As was already recognized by Natoli and Benfatto,11 if ρ(K) > 1, the series expansion diverges; if ρ(K) < 1, the series converges but the number of terms required is larger the closer ρ(K) is to 1. Provided enough terms are included, the series expansion should give the same results as matrix inversion.
There is however more to the story, as the spectral radius can also be used to estimate the number of expansion terms necessary in order to reach a given accuracy. To illustrate this use, let us consider the scalar power series expansion of 1/(1 − x), where x is a real number with absolute value less than 1. Table 1 gives the largest power of x that needs to be retained in the power series in order to converge to within a given accuracy, for x between 0.4 and 0.9. We see that to converge to within a relative error of 5% with fewer than 10 terms (i.e. retaining terms up to x9) requires x ≲ 0.7, while 20 terms will give convergence to about 1% for values of x ≲ 0.8. This suggests that if we want a series expansion to converge in a reasonable number of terms, for example 10, the corresponding matrix should have a spectral radius of 0.7 or less.
Table 1 Highest power of x that needs to be retained in the power series expansion of 1/(1 − x) (x a real number) for a given relative accuracy
|
x
|
0.4 |
0.5 |
0.6 |
0.7 |
0.8 |
0.9 |
| Relative error <10% |
2 |
3 |
4 |
6 |
10 |
21 |
| Relative error <5% |
3 |
4 |
5 |
8 |
13 |
28 |
| Relative error <1% |
5 |
6 |
9 |
12 |
20 |
43 |
A more detailed analysis for the case of the kernel matrix K ≡ G0T is given in Appendix 1. In particular, eqn (40) and (42) respectively provide estimates of the expansion order required to ensure that the absolute or relative truncation errors are within a specified accuracy. The two relations provide estimates that agree exactly with the numerical values in Table 1 for the convergence of the power series expansion of 1/(1 − x).
2.2 Computing the spectral radius
Following the definition (6), the spectral radius ρ(K) may be computed by direct diagonalization of the matrix K. As an example of this, we consider a small Cu(111) cluster of 50 atoms arranged in 4 planes with the emitter of the photoelectron at the bottom (see Fig. 1). In Fig. 2 we plot the spectrum of the kernel matrix K ≡ G0T at 4 different kinetic energies, 25 eV, 54 eV, 98 eV and 181 eV, as well as the spectral radius as a function of kinetic energy from 10 to 200 eV. The photoelectron wave is usually damped due to inelastic scattering along the electron path and also due to lattice vibrations. These two damping sources are known to strongly affect the convergence of the MS series: a short electron mean free path or large thermal vibration amplitudes of the atoms in the cluster will reduce the spectral radius and thus improve the convergence of the MS series. For this study, we will only consider damping due to the electron mean free path, included through the imaginary part of the complex Hedin–Lundqvist exchange and correlation potential.12,13 Lattice vibrations can be described using a temperature-dependent Debye–Waller factor or by averaging over T-matrix elements, both of which are available in the MsSpec computer package. In this work, however, we deliberately choose to neglect vibrational damping in order to emphasize possible divergences while treating a relatively small system amenable to direct matrix inversion as well as series expansion calculations. The spectral radius may of course be greater than 1 for larger clusters, even when atomic vibrations are taken into account.
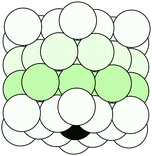 |
| | Fig. 1 A cylindrical cluster of 50 copper atoms, organized in 4 planes. The dark atom at the center of the bottom plane is the photo-electron emitter. | |
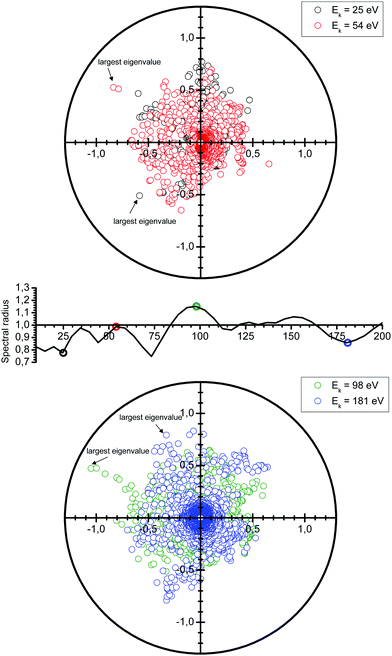 |
| | Fig. 2 Spectrum of the kernel matrix K ≡ G0T for the kinetic energies of 25 eV, 54 eV, 98 eV and 181 eV. The variations of the spectral radius are also shown (middle figure). | |
We see in Fig. 2 that the spectral radius is greater than 1 for kinetic energies around 100 eV and around 150 eV. We also observe oscillations in the spectral radius. While not fully understood yet, these oscillations are the result of a complex interplay of the electron kinetic energy, the crystal structure, the electronic structure, as well as the number and type of atoms present.
The memory required to store K increases rapidly for larger clusters and higher kinetic energies, so that it becomes unfeasible to store and directly diagonalize the full matrix. An alternative that avoids storing the whole matrix is based on the power method, an iterative approach that gives a direct approximation to the spectral radius. The method is based on the assumption that the matrix K has one dominant eigenvalue, whose magnitude is much larger than the magnitudes of the other eigenvalues. It starts by choosing an initial approximation x0 to the eigenvector associated with this dominant eigenvalue, then forms the sequence of products
These values can give a good approximation to the dominant eigenvalue and eigenvector, and so of the spectral radius. We assume that none of the N eigenvalues of K are zero. Then there are N linearly independent normalized eigenvectors {vi} with eigenvalues {λi}, with i ∈ [1, N]. We also assume that the eigenvalues are ordered so that |λ1| > |λi| for i > 1. The eigenvectors form a basis and the initial approximation x0 can be written as a linear combination of the eigenvectors:
Multiplying both sides by
K gives
Repeating
n times gives
| |  | (7) |
Introducing an appropriate vector norm ‖
x‖, such as the Euclidian norm
and comparing successive approximations, we obtain an estimate for the spectral radius of
K:
| | 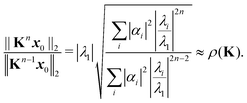 | (8) |
Another estimate of the spectral radius can be obtained from the Rayleigh quotient
| |  | (9) |
Clearly if
x is an eigenvector of
K with eigenvalue
λ, then
RK(
x) =
λ. Following the same procedure outlined above, an approximation to the spectral radius after
n iterations is then given by
| |  | (10) |
Note that there is a complex term
λi/
λ1 in the numerator, in contrast to the expression
(8).
As n increases, the sequence of approximations (8) and (10) converges to the spectral radius ρ(K). The rate of convergence depends on the initial guess x0 and on the ratio |λi/λ1| for I > 1; if this is close to 1, the convergence will be slower. Acceleration techniques such as the epsilon algorithm14 can also be used to extrapolate the sequence of approximations to obtain a better value. Several such acceleration methods are implemented in the calculation of the spectral radius in the MsSpec computer code.9
In order to implement these two approximations, we need to define a starting vector x0. Several choices have been tested,8 and the value  was found to perform particularly well in terms of the number of iterations needed in order to achieve convergence. Here, we have taken j as the cube root of unity, e2πi/3.
To better understand the behaviour of the iterative process, we present in Fig. 3 the evolution of the ratio |λ2|/|λ1| as a function of energy (upper panel), and of the approximation to the spectral radius given by eqn (8) (lower panel). We note that when the two largest eigenvalues are close, the power method as well as the Rayleigh quotient can be misled and jump to the energy trajectory of the second largest eigenvalue. More precisely, even though the power method's approximation to the spectral radius may not follow exactly the largest eigenvalue, we see that in practice this happens when the second largest eigenvalue lies within approximately 5% of |λ1|; the resulting approximate spectral radius is however still a good measure of the convergence of the matrix series expansion.
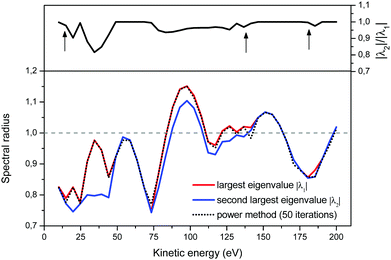 |
| | Fig. 3 The Euclidian 2-norm approximation to the spectral radius, eqn (8), after 50 iterations in the power method. Note that the spectral algorithm can jump from following the largest eigenvalue to following the second-largest eigenvalue when the ratio of their magnitudes is close to 1 (upper panel). | |
3 Simple renormalization schemes
Now that we have developed an efficient tool to monitor the behaviour of a matrix series expansion, we can apply it to the MS problem, and more particularly to the Watson expansion. Our aim in this section is to improve the convergence properties of matrix series expansions of the form| | | (I − K)−1 = I + K + K2 + K3 + … | (11) |
For this, we follow ideas developed by Janiszowski15 for deriving an algorithm for matrix inversion in processors with limited calculation abilities. The main ideas have already been outlined by Sébilleau et al.,16 but we go here into more details.
We seek a general transformation of the form
| | | (I − K)−1 = (I − M(ω, K))−1N(ω, K), | (12) |
implying
| | | M(ω, K) = I − N(ω, K)(I − K), | (13) |
where
ω is a complex scalar chosen to minimize the spectral radius of
M so that the series expansion of (
I −
M)
−1 converges rapidly. We call
N the renormalization matrix. Several renormalization schemes were investigated under the constraint provided by
eqn (12), including the Löwdin second-order iteration method,
17 or the Euler expansion,
17 but in the end, we focus on the three transformations described in detail in the following subsections.
3.1
G
n
renormalization
We set| | | M ≡ Gn = (1 − ωn)I + ωnK | (14) |
so that| |  | (15) |
The matrix N is then just ωnI.
This is the simplest renormalization scheme; the renormalized matrix M is a linear combination of the identity matrix and the kernel matrix. The renormalization parameter appears as ωn, where n is an integer. This general expression may be useful in formally deriving other renormalization schemes but is less useful for numerical work since by noting ![[small omega, Greek, tilde]](https://www.rsc.org/images/entities/i_char_e10f.gif) = ωn, we can rewrite Gn(ω) = G1(
= ωn, we can rewrite Gn(ω) = G1(![[small omega, Greek, tilde]](https://www.rsc.org/images/entities/i_char_e10f.gif) ). In the examples below, we will in general only consider the G1 renormalization.
). In the examples below, we will in general only consider the G1 renormalization.
Following the definition (14), the eigenvalues λG of Gn are related to those of the kernel matrix K by
| | | λGi= (1 − ωn) + ωnλi. | (16) |
We then have
| |  | (17) |
The condition
ρ(
Gn) <
ρ(
K) will be satisfied if
| | | |1 − ωn| + |ωn|ρ(K) < ρ(K). | (18) |
Writing
ω =
r![[thin space (1/6-em)]](https://www.rsc.org/images/entities/char_2009.gif)
exp(i
θ), the condition
(18) becomes
| | | |1 −rneinθ| < (1 − rn)ρ(K), | (19) |
and since
ρ(
K) is positive by definition, we must have
r < 1 so that
ω lies within the unit circle. Squaring both sides of
(19), rearranging and setting
x = (1 +
r2n)/2
rn, with
x > 1 when
r < 1, yields
| | cos(nθ)![[thin space (1/6-em)]](https://www.rsc.org/images/entities/char_2009.gif) > > ![[thin space (1/6-em)]](https://www.rsc.org/images/entities/char_2009.gif) x + (1 − x)ρ2(K) x + (1 − x)ρ2(K) | (20) |
as a constraint on the values of the argument of
ω to ensure that
ρ(
Gn) <
ρ(
K).
3.2 Σn renormalization
The different Gn renormalizations satisfy a recurrence relation| | | Gn(ω) = (1 − ω)I + ωGn−1, | (21) |
with G0 = K. We define the Σn renormalization scheme of order n as the average of the partial sums of Gk for k from 0 up to n:| |  | (22) |
where| |  | (23) |
We then have| | | (I − K)−1 = sn(I − Σn)−1 | (24) |
with N = snI.
The definitions (14) and (22) for Gn and Σn have the same functional form; they are both linear in the kernel matrix K, and will have the same eigenvalue spectrum if the renormalization parameter in the Σn case, ωΣ, is chosen so that sn(ωΣ) = ωnG. In particular, for n = 1, we see that Σ1(2ω − 1) = G1(ω). Mathematically, these two renormalization schemes are equivalent, giving identical smallest spectral radii so that the convergence properties of the renormalized series expansion are the same. It is however interesting to distinguish the two renormalization schemes: as we shall see later, in cases where we cannot find exactly the optimal value for ω that minimizes the spectral radius, the Σn renormalization scheme can have a wider range of ω giving acceptably small spectral radii than in the Gn scheme.
The eigenvalues λΣ of Σn are related to those of the kernel matrix K by
| | | λiΣ = (1 − sn) + snλi. | (25) |
To ensure that
ρ(
Σn) <
ρ(
K), the condition
(20) with
r < 1 still applies, where now
sn =
r![[thin space (1/6-em)]](https://www.rsc.org/images/entities/char_2009.gif)
exp(i
θ).
3.3 The Löwdin Πn renormalization
We define the Πn renormalization matrix as the product of Gk for k from 0 up to n:| |  | (26) |
For n = 1 this gives| | | M ≡ Π1 = (1 − ω)K + ωK2 | (27) |
so that| | | (I − K)−1 = (I − Π1)−1(I + ωK) | (28) |
where N = I + ωK. The eigenvalues of Π1 are| | | λΠi = (1 − ω)λi + ωλi2. | (29) |
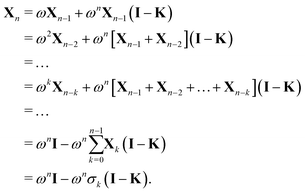
More generally, we may define
with X0 = I and
We then have
where we have used
| Gn = (1 − ωn)I + ωnK ⇒ (I − Gn) = ωn(I − K). |
We then can write
Using the definition of Xn, we finally obtain| | | (I − K)−1 = (I − Πn)−1σn, | (30) |
which agrees with eqn (28) when n = 1 since σ1 = I + ωK.
It is interesting to note from the definition (26) that18
and in particular
This shows that if the regular Taylor and
G1 series expansions both converge, then the
Π1 series will converge faster than either of them. Furthermore, the condition
ρ(
Π1) <
ρ(
K) implies that the spectral radius of
G1 must be less than 1; replacing
ρ(
K) by 1 on the right-hand side of the inequality
(18) and rearranging yields
with
r < 1/
ρ(
K) as the conditions to be respected.
3.4 Expressing the renormalization schemes as power series in K
The effect of renormalizing the Taylor expansion (11) can be seen by re-expressing the expansions of the transformed inverse as power series in the kernel matrix K:| |  | (32) |
where Ns is the truncation order of the expansion.
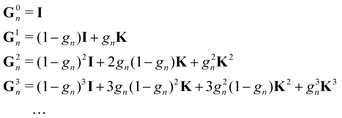
For the Gn renormalization scheme, writing gn ≡ ωn, the first few terms in the series expansion (15) are
which can be summarized as
| |  | (33) |
where

is the standard binomial coefficient. Inspecting the coefficients of
Kk gives
| | 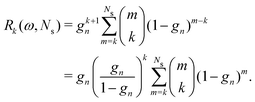 | (34) |
When
ω = 1, every coefficient
Rk(
ω,
Ns) reduces to 1, and we recover the Taylor series expansion. A similar expression holds for the
Σn renormalization scheme, with
sn replacing
gn in the relation
(34).
The corresponding expression for the Π1 renormalization scheme is more complicated. The demonstration is given in the appendix, leading to the final result
| |  | (35) |
with
| |  | (36) |
where [
k/2] represents the integer part of
k/2, and
| |  | (37) |
with the convention that

if
k < 0 or
k >
m. Since
Π1 involves a term in
K2, truncating the expansion of (
I −
Π1)
−1 at

yields a power series in
K of order 2
Ns + 1. Due to the fact that the summation over
m on the right-hand side of
(36) is truncated when
k >
Ns, the expansion
(35) coincides with the Taylor expansion
(11) up to order
KNs and differs only for powers of
K between
Ns + 1 and 2
Ns + 1 (see Appendix 2).
The characteristics of the different renormalization schemes are summarized in Table 2.
Table 2 Summary of the different renormalization schemes (I − K)−1 = (I − M)−1N
| Scheme |
Equation |
M
|
N
|
MS expansion (I − M)−1 |
Renormalized coefficient Rk(ω, Ns) |
| Taylor |
(11)
|
K
|
I
|
I + K + K2 +⋯+ KNs |
1 |
|
|
|
|
|
|
|
|
G
n
|
(15)
|
G
n
|
g
n
![[thin space (1/6-em)]](https://www.rsc.org/images/entities/char_2009.gif) I I |

|

|
|
Σ
n
|
(24)
|
Σ
n
|
s
n
![[thin space (1/6-em)]](https://www.rsc.org/images/entities/char_2009.gif) I I |

|

|
|
Π
1
|
(28)
|
Π
1
|
σ
1
|

|

|
4 Application to photoelectron diffraction by a copper cluster
As a test case for the renormalization schemes presented above, we consider photoelectron diffraction in the 50 atom Cu(111) cluster illustrated in Fig. 1. This small system can be treated by direct matrix inversion techniques, and is thus suitable for validating our matrix renormalization approaches. In particular, we suppose that photons generated by an X-ray source and incident at 55° with respect to the normal to the material surface, eject a 2p1/2 electron (ionization energy 967 eV) which is then scattered by atoms in the cluster before eventually escaping the surface. Photoelectrons with a given kinetic energy are detected in different directions (polar and azimuthal angles with respect to the normal at the surface); in the results presented below, we shall only consider polar scans, for which the azimuthal angle is fixed at zero. Inelastic effects are taken into account using a complex Hedin–Lundqvist exchange and correlation potential.12,13
The crystal structure is built using the Atomic Simulation Environment (ASE) Python package,19 while the photoelectron diffraction is treated using MsSpec,9,10 which we have extended to include the three renormalization schemes presented above. As well as treating several different types of spectrocopy, the MsSpec package can also be used to compute the spectral radius of the kernel and renormalized matrices as a function of the kinetic energy of the photoelectron and the renormalization parameter, either by direct diagonalization or iteratively using the power method combined with various acceleration techniques.
The spectral radius of the kernel matrix K as a function of the photoelectron kinetic energy from 10 to 200 eV is shown in Fig. 4. For a photoelectron energy of 95 eV, where the spectral radius is the largest, the maximum angular momentum is ![[small script l]](https://www.rsc.org/images/entities/char_e146.gif) max = 8 and the size of the matrix K is 92 × 50 = 4050. Inverting this relatively small matrix using the Lapack library took a few minutes using a modest Intel Core 8th generation i5 processor, while the power method converges after 50 iterations and took less than a minute. The spectral radius of K is 1.15, and hence the series expansion of (I − K)−1 diverges.
max = 8 and the size of the matrix K is 92 × 50 = 4050. Inverting this relatively small matrix using the Lapack library took a few minutes using a modest Intel Core 8th generation i5 processor, while the power method converges after 50 iterations and took less than a minute. The spectral radius of K is 1.15, and hence the series expansion of (I − K)−1 diverges.
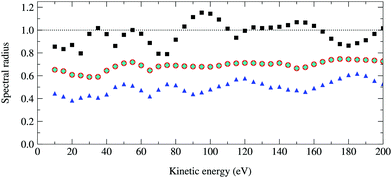 |
| | Fig. 4 Optimal spectral radius of the renormalized matrices G, Σ and Π as a function of kinetic energy for a 50 atom Cu(111) system. For each renormalization scheme, these are computed by finding at each energy the value of ω that gives the smallest spectral radius. Squares, circles, diamonds and triangles correspond to the spectral radii of K, G1, Σ1 and Π1 respectively; the results for G1 and Σ1 are identical. | |
In what follows, we shall only consider the renormalization schemes Gn, Σn and Πn with n = 1; the index n will therefore be omitted, unless otherwise stated.
If all the eigenvalues of the matrix K are known, the spectral radius of the renormalized matrices can be easily computed using the relations (16), (25) and (29) for any value of ω. Contour plots of the spectral radius as a function of ω for the three renormalized matrices are shown in Fig. 5 at 4 selected energies. The spectral radius of the original matrix K appears at ω = (1, 0) in the G scheme; it is less than 1 at 70 and 75 eV, while it is greater than 1 at 90 and 95 eV. The plots present two interesting features:
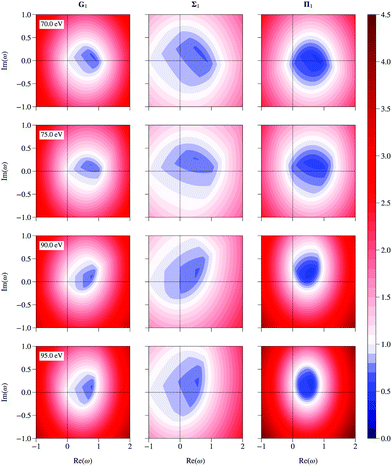 |
| | Fig. 5 Contour plots of the spectral radius as a function of the complex parameter ω for the G, Σ and Π renormalized matrices at 70, 75, 90 and 95 eV. | |
• the spectral radius of Σ is smaller than 1 over a relatively wider range of ω than for the other two schemes; in other words, the spectral radius for Σ renormalization is less sensitive to the precise value of ω than in the other two schemes, which may be an advantage in numerical work when searching for an optimal value of ω;
• the strongest reduction occurs for the Π renormalization scheme, but over a relatively restricted range of ω.
We also note that the optimal values of ω all lie within the unit circle, as expected following the arguments in section 3 above.
Also shown in Fig. 4 are the optimal spectral radii for the three renormalized matrices G, Σ and Π. The optimal spectral radius at a particular energy is obtained by finding the value of ω that minimizes the spectral radius; each point on a particular curve corresponds to a different ω. The search, performed using the Nelder–Mead simplex algorithm,20 is usually quick when the eigenvalues of the kernel matrix K have been found by direct diagonalization, since the eigenvalues and hence the spectral radii are rapidly obtained from the relations (16), (25) and (29). In contrast, the power method must be re-applied to calculate the spectral radius for each required value of ω, potentially resulting in longer search times which may dominate the overall computing time.
We first note that all spectral radii with renormalization are reduced compared to the spectral radii of the matrix K, sometimes by as much as 50%. This implies that the matrix series now converges over the whole energy range considered. As expected, the optimal spectral radii for G and Σ are identical. The Π renormalization scheme gives the smallest optimal spectral radii, and hence potentially the best convergence properties for the matrix series expansion.
In Fig. 6, we compare the cross sections obtained by direct matrix inversion and those obtained by matrix series expansion with G renormalization scheme. The optimal value of ωG is 0.790 + 0.124i, giving a spectral radius ρ(G1) = 0.68. Renormalization has thus converted a divergent series into one that converges quite well by order 8 or 9. More precisely, the maximum relative difference (MRD) between the cross sections obtained by direct matrix inversion and by a renormalized series expansion is about 6% after truncating the G expansion beyond Ns = 9; terms up to Ns = 13 are required to obtain an MRD of less than 1%. From eqn (42) in Appendix 1, however, we expect the truncation error for the series expansion of the matrix inverse to be about 2% for Ns = 9 and less than 1% for Ns = 11. The cross sections thus converge slightly more slowly with increasing series expansion order, which is understandable since the expression for the cross section involves the square of the scattering path operator. We have also noted that the MRD always seems to occur when the polar angle θ is zero, possibly due to the fact that the cross section has a deep minimum in this direction.
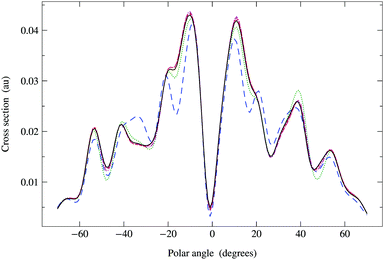 |
| | Fig. 6 Comparison of photoelectron diffraction cross sections at 95 eV. Full curve: direct matrix inversion of (I − K); series expansion with G renormalization scheme, optimal ωG = 0.790 + 0.124i giving a spectral radius ρ(G1) = 0.68: long dashed curve, truncation order 3; dotted curve, truncation order 5; dash-dotted curve, truncation order 7; dashed curve, truncation order 9. | |
The Σ renormalization scheme yields identical results for optimal ω![[thin space (1/6-em)]](https://www.rsc.org/images/entities/char_2009.gif) Σ = 2ωG − 1 = 0.581 + 0.247i, although this analytical relation might not be always verified for values determined by numerical search and tiny differences between cross sections might thus appear.
Σ = 2ωG − 1 = 0.581 + 0.247i, although this analytical relation might not be always verified for values determined by numerical search and tiny differences between cross sections might thus appear.
Since the Π renormalization scheme yields a smaller spectral radius, ρ(Π1) = 0.45, the matrix expansion should converge even faster. The results shown in Fig. 7 suggest that a truncation order as low as 4 or 5 is sufficient; the MRD for Ns = 5 is about 1.4% while for Ns = 6 it is only 0.3%. The corresponding truncation errors for the matrix inverse predicted by eqn (42) are respectively 0.8% and 0.4%. This rapid convergence is due to the fact that the Π matrix series expansion truncated at order Ns = 5 contains powers of K up to order 2Ns + 1 = 11, the truncation order at which the G renormalized series expansion also converged to within 1%.
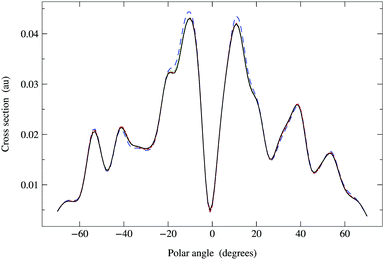 |
| | Fig. 7 Comparison of photoelectron diffraction cross sections at 95 eV. Full curve: direct matrix inversion of (I − K). Series expansion with Π1 renormalization scheme, optimal ωP = 0.637 + 0.250i giving a spectral radius ρ(Π1) = 0.45: long dashed curve, truncation order 3; dashed curve, truncation order 4; dotted curve, truncation order 5. The convergence is more rapid than for G renormalization, only requiring terms up to order 4 or 5. | |
The expected relative truncation errors in the series expansion of the inverse matrix operator (I − K) and the maximum relative difference (MRD) between the cross sections obtained by direct matrix inversion and by series expansion are summarized in Table 3.
Table 3 Comparison of the relative truncation error εrel in the renormalized series expansion of order Ns of the matrix inverse (I − K), given by eqn (42), and the maximum relative difference (MRD) between the cross sections obtained by direct matrix inversion and by series expansion. All values are percentages
|
G
1 renormalization |
|
N
s
|
3 |
5 |
7 |
9 |
11 |
13 |
|
ε
rel
|
21.4 |
9.9 |
4.6 |
2.1 |
0.98 |
0.45 |
| MRD |
34.8 |
20.3 |
13.2 |
6.01 |
2.03 |
0.65 |
|
Π
1 renormalization |
|
N
s
|
3 |
4 |
5 |
6 |
|
ε
rel
|
4.10 |
1.85 |
0.83 |
0.37 |
| MRD |
7.75 |
6.98 |
1.35 |
0.32 |
5 Conclusions
The matrix series expansion (5) converges if the spectral radius of the kernel matrix K is less than 1. This may be sufficient for further mathematical development, but the convergence may be too slow to be of use in numerical work. The idea of renormalization is to recast the series expansion in another form with faster convergence properties, by introducing a renormalized kernel matrix M with a smaller spectral radius. Multiplication by an associated matrix N is then performed to recover the exact result.
We have proposed three simple renormalization schemes involving a single complex parameter ω that can achieve this goal, yielding a convergent series even for cases where the original expansion diverges. Numerical tests on a relatively small Cu(111) cluster show that the Π1 scheme is particularly advantageous, reducing the spectral radius by up to a factor 2 in some cases. The main difficulty is determining an optimal value of the renormalization parameter ω; this can be found using standard optimization approaches such as the Nelder–Mead simplex algorithm20 combined with an iterative approach for determining the spectral radius.
When used to simulate typical X-ray photoelectron diffraction experiments with kinetic energies in the 100–1500 eV range, the standard Watson series expansion may not converge properly. Computing spectral radii by direct matrix inversion for such cases is not possible because of the large memory requirements. The power method allows the convergence properties to be predicted efficiently for such cases. However, even though the tools and methods presented here succeeded in improving the MS series convergence, the overall procedure of optimizing ω can become quite long. A dedicated study to better understand the origin of the divergence and the variation in the spectral radius is in progress to further improve the renormalization procedure.
Conflicts of interest
There are no conflicts to declare.
Appendix 1: estimate of the truncation order
To simplify the notation, let us write A = (I − K)−1. We can then approximate A by a series expansion of order n:| | | An = I + K + K2 + K3+ Kn. | (38) |
The absolute truncation error εabs introduced by this approximation is thenwhere ‖ ‖ represents any matrix norm. Using eqn (38), the previous inequality can be written as
| ‖(K)n+1(I − K)−1‖ ≤ εabs. |
We can then use the property
which is valid for any matrix norm, as well as18
Choosing the minimum norm for which21
the inequality (39) will always be satisfied if
| ρ(Kn+1)(1 − ρ(K))−1 ≤ εabs. |
This leads to the condition| |  | (40) |
For instance, choosing an accuracy εabs = 0.1, we find n ∼ 43 for ρ(K) = 0.9, n ∼ 9 for ρ(K) = 0.7, while for ρ(K) = 0.5 n drops to ∼3.
Defining the relative truncation error εrel by
| |  | (41) |
and using similar arguments, we obtain an estimate for the truncation order required for convergence to within
εrel:
| |  | (42) |
Appendix 2: the Π1 renormalization scheme as a power series in K
The Πn renormalization scheme is (cf.eqn (26)):
| (I − K)−1 = (I − Πn)−1σn, |
which for n = 1 reduces to (cf.eqn (28))| | | (I − K)−1 = (I − Π1)−1(I + ωK), | (43) |
with Π1 = (1 − ω)K + ωK2. We now show how to write the renormalized series expansion as a series of powers of K (cf.eqn (35)–(37)):| |  | (44) |
We recall that
with Π0 = G0 = K, so that for n = 1,
with G1 = (1 − ω)I + ωK. The Taylor expansion of the matrix inverse (I − Π1)−1 in eqn (43) is
Using the binomial expansion (33) with n = 1 and gn = ω gives| |  | (45) |
| |  | (46) |
We now examine the coefficients of Kn on the right-hand side of eqn (46). In the first term, we must have n = k + m or m = n − k. Since we must also have m ≤ k, the values of k can be n, n − 1, n − 2,…,[(n + 1)/2], where [p/2] is the integer part of p/2. Similarly, in the second term on the right-hand side of eqn (46), we must have m = n − k − 1 with k taking values between n − 1 and [n/2]. Combining gives the coefficient of Kn as
which can in turn be written as| |  | (47) |
with the convention that  if m < 0 or m > k.
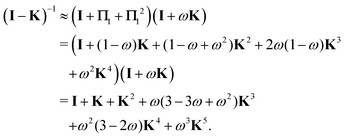
It should also be noted that if the series expansion for (I − Π1)−1 is truncated after Ns + 1 terms, the largest power of K in the series (44) will be 2Ns + 1, while the summations over k in (47) should be truncated at min(n, Ns). For example, truncating the expansion after Π12 (Ns = 2) gives:
This also illustrates that the
Π1 renormalization scheme truncated after

reproduces the Taylor series for (
I −
Π1)
−1 up to order
Ns, followed by correcting terms for powers of
K from
Ns + 1 to 2
Ns + 1.
Author contributions
D. S. and K. H. contributed to the conceptualization and supervision of this work; A. T., S. T., M. T.-D. and K. D. implemented the ideas in the MsSpec computer package and performed the calculations; all authors participated in the analysis and validation of the results, and in writing the article.
Acknowledgements
K. H. acknowledges funding by JST CREST Grant No. JPMJCR1861 and JSPS KAKENHI under Grant No. 18K05027 and 17K04980. A.T. acknowledges the award of a Tobitate scholarship from the Ministry of Education, Culture, Sports, Science and Technology (MEXT) of Japan. The calculations were performed using resources provided by the Institute of Physics of Rennes.
Notes and references
-
H. Ebert, et al., The Munich SPR-KKR package, version 7.7, 2017, https://www.ebert.cup.uni-muenchen.de/en/software-en/13-sprkkr Search PubMed
 .
.
- H. Ebert, D. Ködderitzsch and J. Minár, Rep. Prog. Phys., 2011, 74, 096501 CrossRef
 .
.
- D. Sébilleau, Phys. Rev. B: Condens. Matter Mater. Phys., 2000, 61, 14167–14178 CrossRef
 .
.
-
D. Sébilleau, in Multiple Scattering Theory for Spectroscopies, ed. D. Sébilleau, K. Hatada and H. Ebert, Springer International Publishing, 2018, ch. 1, pp. 3–34 Search PubMed
 .
.
-
E. Anderson, Z. Bai, C. Bischof, S. Blackford, J. Demmel, J. Dongarra, J. Du Croz, A. Greenbaum, S. Hammarling, A. McKenney and D. Sorensen, LAPACK Users' Guide, 3rd edn, Society for Industrial and Applied Mathematics, Philadelphia, PA, 1999 Search PubMed
 .
.
- Y. Chen, F. J. García de Abajo, A. Chassé, R. X. Ynzunza, A. P. Kaduwela, M. A. Van Hove and C. S. Fadley, Phys. Rev. B: Condens. Matter Mater. Phys., 1998, 58, 13121–13131 CrossRef CAS
 .
.
- A. L. Ankudinov, C. E. Bouldin, J. J. Rehr, J. Sims and H. Hung, Phys. Rev. B: Condens. Matter Mater. Phys., 2002, 65, 104107 CrossRef
 .
.
- D. Sébilleau and C. R. Natoli, J. Phys.: Conf. Ser., 2009, 190, 012002 CrossRef
 .
.
- D. Sébilleau, C. Natoli, G. M. Gavaza, H. Zhao, F. Da Pieve and K. Hatada, Comput. Phys. Commun., 2011, 182, 2567–2579 CrossRef
 .
.
-
https://msspec.cnrs.fr
.
- C. R. Natoli and M. Benfatto, J. Phys. C: Solid State Phys., 1986, 8, 11 Search PubMed
 .
.
-
L. Hedin and S. Lundqvist, Solid State Physics, 1969, p. 1 Search PubMed
 .
.
- L. Hedin and B. I. Lundqvist, J. Phys. C: Solid State Phys., 1971, 4, 2064–2083 CrossRef
 .
.
- P. Wynn, Math. Comput., 1956, 10, 91–96 CrossRef
 .
.
- K. B. Janiszowski, Int. J. Appl. Math. Comput. Sci., 2003, 13, 199–204 Search PubMed
 .
.
- D. Sébilleau, K. Hatada, H.-F. Zhao and C. R. Natoli, e-J. Surf. Sci. Nanotechnol., 2012, 10, 599–608 CrossRef
 .
.
- P.-O. Löwdin, J. Math. Phys., 1962, 3, 969–982 CrossRef
 .
.
- F. Kittaneh, Proc. Am. Math. Soc., 2006, 134, 385–390 CrossRef
 .
.
- A. Hjorth Larsen,
et al.
, J. Phys.: Condens. Matter, 2017, 29, 273002 CrossRef PubMed
 .
.
- J. A. Nelder and R. Mead, Comput. J., 1965, 7, 308–313 CrossRef
 .
.
- A. Czornik and P. Jurgaś, Int. J. Appl. Math. Comput. Sci., 2006, 16, 183 Search PubMed
 .
.
|
| This journal is © the Owner Societies 2022 |
Click here to see how this site uses Cookies. View our privacy policy here.  b
b
![[small tau, Greek, macron]](https://www.rsc.org/images/entities/i_char_e0d4.gif) ji can be identified as the operator describing all the pathways an electron can travel in order to move from atom i to atom j. As such, it contains all the information about the structural, electronic and magnetic properties of the material under consideration.
ji can be identified as the operator describing all the pathways an electron can travel in order to move from atom i to atom j. As such, it contains all the information about the structural, electronic and magnetic properties of the material under consideration.![[small tau, Greek, macron]](https://www.rsc.org/images/entities/i_char_e0d4.gif) ji =
ji = ![[V with combining macron]](https://www.rsc.org/images/entities/i_char_0056_0304.gif) iδij +
iδij + ![[V with combining macron]](https://www.rsc.org/images/entities/i_char_0056_0304.gif) jG
jG![[V with combining macron]](https://www.rsc.org/images/entities/i_char_0056_0304.gif) i.
i.![[T with combining macron]](https://www.rsc.org/images/entities/i_char_0054_0304.gif) i for the individual scattering by the potential
i for the individual scattering by the potential ![[V with combining macron]](https://www.rsc.org/images/entities/i_char_0056_0304.gif) i centered on the atom i. The eqn (1) can then be written as
i centered on the atom i. The eqn (1) can then be written as

![[T with combining macron]](https://www.rsc.org/images/entities/i_char_0054_0304.gif) i, while the elements of G0 are
i, while the elements of G0 are ![[scr T, script letter T]](https://www.rsc.org/images/entities/char_e533.gif) (−
(−![[R with combining right harpoon above (vector)]](https://www.rsc.org/images/entities/b_char_0052_20d1.gif) i)G0
i)G0![[scr T, script letter T]](https://www.rsc.org/images/entities/char_e533.gif) (
(![[R with combining right harpoon above (vector)]](https://www.rsc.org/images/entities/b_char_0052_20d1.gif) j).
j). ![[scr T, script letter T]](https://www.rsc.org/images/entities/char_e533.gif) (
(![[R with combining right harpoon above (vector)]](https://www.rsc.org/images/entities/b_char_0052_20d1.gif) ) is the translation operator which shifts position vectors by
) is the translation operator which shifts position vectors by ![[R with combining right harpoon above (vector)]](https://www.rsc.org/images/entities/b_char_0052_20d1.gif) ; these translations are necessary to be able to use the transition operators for single scattering, which are determined for a potential centered on the origin. The matrix elements of
; these translations are necessary to be able to use the transition operators for single scattering, which are determined for a potential centered on the origin. The matrix elements of ![[scr T, script letter T]](https://www.rsc.org/images/entities/char_e533.gif) (−
(−![[R with combining right harpoon above (vector)]](https://www.rsc.org/images/entities/b_char_0052_20d1.gif) i)G0
i)G0![[scr T, script letter T]](https://www.rsc.org/images/entities/char_e533.gif) (
(![[R with combining right harpoon above (vector)]](https://www.rsc.org/images/entities/b_char_0052_20d1.gif) j) are also known as the KKR structure constants.
j) are also known as the KKR structure constants.
![[small script l]](https://www.rsc.org/images/entities/char_e146.gif) max are required to adequately represent the propagating electron, the dimension of the matrix to be inverted will be of the order of N = Nat(
max are required to adequately represent the propagating electron, the dimension of the matrix to be inverted will be of the order of N = Nat(![[small script l]](https://www.rsc.org/images/entities/char_e146.gif) max + 1)2. Since the matrix elements are complex, the amount of storage required will be 16N2 bytes; the extra work space required in matrix inversion routines for example in the LAPACK library5 can double this. Furthermore, the time required to invert the matrix increases as N3, so that calculations can quickly become very lengthy and greedy for memory, particularly for larger systems at higher electron kinetic energies, since
max + 1)2. Since the matrix elements are complex, the amount of storage required will be 16N2 bytes; the extra work space required in matrix inversion routines for example in the LAPACK library5 can double this. Furthermore, the time required to invert the matrix increases as N3, so that calculations can quickly become very lengthy and greedy for memory, particularly for larger systems at higher electron kinetic energies, since ![[small script l]](https://www.rsc.org/images/entities/char_e146.gif) max increases with increasing energy. In such cases, other approaches such as the path operator expansion6 or Lanczos techniques7 could be useful.
max increases with increasing energy. In such cases, other approaches such as the path operator expansion6 or Lanczos techniques7 could be useful.![[small tau, Greek, macron]](https://www.rsc.org/images/entities/i_char_e0d4.gif) ki on the right-hand side by its equation of motion, yielding
ki on the right-hand side by its equation of motion, yielding


 was found to perform particularly well in terms of the number of iterations needed in order to achieve convergence. Here, we have taken j as the cube root of unity, e2πi/3.

![[small omega, Greek, tilde]](https://www.rsc.org/images/entities/i_char_e10f.gif) = ωn, we can rewrite Gn(ω) = G1(
= ωn, we can rewrite Gn(ω) = G1(![[small omega, Greek, tilde]](https://www.rsc.org/images/entities/i_char_e10f.gif) ). In the examples below, we will in general only consider the G1 renormalization.
). In the examples below, we will in general only consider the G1 renormalization.
![[thin space (1/6-em)]](https://www.rsc.org/images/entities/char_2009.gif) exp(iθ), the condition (18) becomes
exp(iθ), the condition (18) becomes![[thin space (1/6-em)]](https://www.rsc.org/images/entities/char_2009.gif) >
> ![[thin space (1/6-em)]](https://www.rsc.org/images/entities/char_2009.gif) x + (1 − x)ρ2(K)
x + (1 − x)ρ2(K)

![[thin space (1/6-em)]](https://www.rsc.org/images/entities/char_2009.gif) exp(iθ).
exp(iθ).


 is the standard binomial coefficient. Inspecting the coefficients of Kk gives


 if k < 0 or k > m. Since Π1 involves a term in K2, truncating the expansion of (I − Π1)−1 at
  yields a power series in K of order 2Ns + 1. Due to the fact that the summation over m on the right-hand side of (36) is truncated when k > Ns, the expansion (35) coincides with the Taylor expansion (11) up to order KNs and differs only for powers of K between Ns + 1 and 2Ns + 1 (see Appendix 2).
![[small script l]](https://www.rsc.org/images/entities/char_e146.gif) max = 8 and the size of the matrix K is 92 × 50 = 4050. Inverting this relatively small matrix using the Lapack library took a few minutes using a modest Intel Core 8th generation i5 processor, while the power method converges after 50 iterations and took less than a minute. The spectral radius of K is 1.15, and hence the series expansion of (I − K)−1 diverges.
max = 8 and the size of the matrix K is 92 × 50 = 4050. Inverting this relatively small matrix using the Lapack library took a few minutes using a modest Intel Core 8th generation i5 processor, while the power method converges after 50 iterations and took less than a minute. The spectral radius of K is 1.15, and hence the series expansion of (I − K)−1 diverges.
![[thin space (1/6-em)]](https://www.rsc.org/images/entities/char_2009.gif) Σ = 2ωG − 1 = 0.581 + 0.247i, although this analytical relation might not be always verified for values determined by numerical search and tiny differences between cross sections might thus appear.
Σ = 2ωG − 1 = 0.581 + 0.247i, although this analytical relation might not be always verified for values determined by numerical search and tiny differences between cross sections might thus appear.


 if m < 0 or m > k.
 reproduces the Taylor series for (I − Π1)−1 up to order Ns, followed by correcting terms for powers of K from Ns + 1 to 2Ns + 1.
.
.
.
.
.
.
.
.
.
.
.
.
.
.
.
.
.
.
.
.


