Double-layered PLGA/HA microneedle systems as a long-acting formulation of polyphenols for effective and long-term management of atopic dermatitis†
Yi-Lun
Chen
,
Chih-Chi
Chang
,
Yi-Chin
Lin
and
Mei-Chin
Chen
 *
*
Department of Chemical Engineering, National Cheng Kung University, Tainan, Taiwan. E-mail: kokola@mail.ncku.edu.tw; Fax: +886-6-234-4496; Tel: +886-6-275-7575 # 62696
First published on 13th June 2023
Abstract
Atopic dermatitis (AD) is a chronic, relapsing inflammatory disorder that requires long-term treatment to achieve optimal control. Topical corticosteroids or calcineurin inhibitors are the mainstay of treatment, but the safety and efficacy of their daily use remain a concern. Here, we report a double-layered poly(lactic-co-glycolic acid) (PLGA)/sodium hyaluronate (HA) microneedle (MN) patch as a long-acting formulation for sustained delivery of natural polyphenols, curcumin (CUR) and gallic acid (GA), into the inflamed skin. Upon insertion into the skin, the HA layer is rapidly dissolved within 5 min for triggering GA release; the PLGA tip is embedded into the dermis for sustained release of CUR for 2 months. Initially, CUR and GA are simultaneously released from the MNs to exert synergistic antioxidant and anti-inflammatory effects, thus promptly relieving AD symptoms. After the complete release of GA, the extended CUR release can maintain the improvement obtained for at least 56 days. Our results revealed that compared with the CUR-only MN and untreated AD groups, the administration of CUR/GA-loaded MNs not only rapidly reduced the dermatitis score from Day 2 but also significantly inhibited epidermal hyperplasia and mast cell accumulation, reduced serum IgE and histamine levels, and downregulated reactive oxygen species production in the skin lesions of Nc/Nga mice on Day 56. These findings demonstrated that the double-layered PLGA/HA MN patch can serve as an effective dual-polyphenol delivery system for rapid and long-term management of AD.
1. Introduction
Atopic dermatitis (AD), a common, chronic relapsing inflammatory skin disease, affects 15%–20% of children and 10% of adults worldwide, making it the 15th most common nonfatal disease.1,2 The clinical features of AD include skin dryness, recurrent eczematous skin lesions, and intense pruritus.2,3 Its pathogenesis is characterized by biphasic T-cell polarization, with increased T helper type 2 (Th2) cell infiltration in the acute phase and a switch from a Th2- to Th1-type immune response in chronic AD.4Compared with normal skin, acute AD lesions exhibit overexpression of Th2 cytokines, especially interleukin (IL)-4, IL-5, and IL-13.5,6 These cytokines activate B cells to produce immunoglobulin (Ig) E, which stimulates mast cells to release histamine, thus causing allergic symptoms.7,8 In chronic AD, skin lesions are characterized by Th1 activation or a mixed Th1/Th2 profile, associated with elevated IFN-γ expression.9–11 The histological features of chronic AD observed include marked epidermal hyperplasia, prominent hyperkeratosis, and intense mononuclear infiltrates.6
Oxidative stress may also play a vital role in AD pathogenesis. In the human body, oxidative stress occurs when the production of oxidants, including reactive oxygen species (ROS) and free radicals, exceeds antioxidant defense capacity.12,13 Oxidative stress can induce the release of proinflammatory cytokines, thereby enhancing dermal inflammation and histamine release. Additionally, high cellular ROS levels increase IL-4 production, which promotes the longevity of Th2-mediated immune responses, thus aggravating AD symptoms.14
Only a few drugs have been approved for treating chronic inflammatory skin disorders. Topical corticosteroids and topical calcineurin inhibitors are the first-line medications, but topical formulations have poor deep-tissue penetration owing to not only the stratum corneum barrier but also epidermal hyperplasia during AD. Chronic or frequent corticosteroid use leads to resistance.15–17 Additionally, topical immunosuppressants may induce skin malignancy or lymphoma.18,19 Therefore, a safer and more effective alternative is urgently required for the long-term treatment of patients with AD.
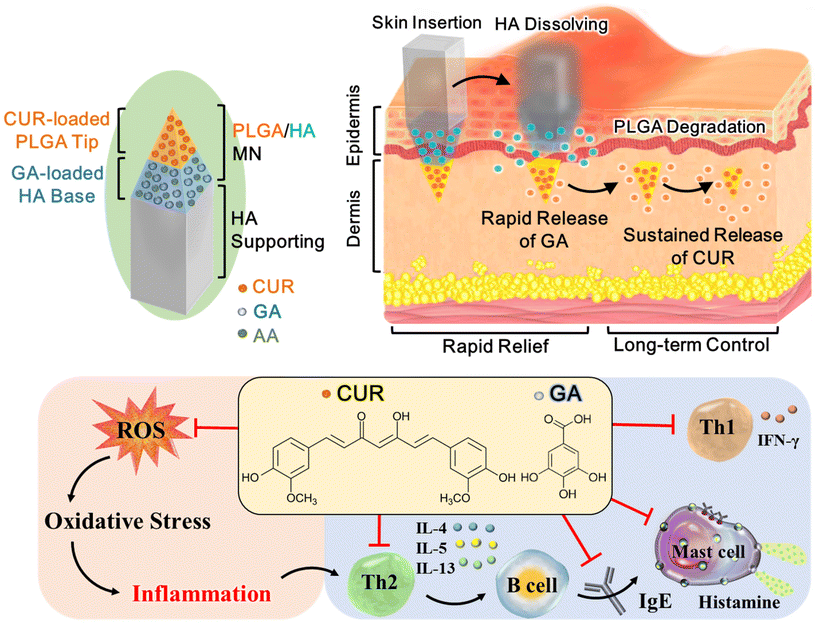
Natural polyphenols, commonly found in herbs, vegetables, and fruits, have potent antioxidant and anti-inflammatory activities that may be useful in preventing and treating neurodegenerative, cardiovascular, and inflammatory diseases.20,21 Phenolic compounds can alleviate chronic inflammation by restoring the redox balance to counteract oxidative stress and modulating inflammatory responses by suppressing proinflammatory pathways.21,22 These findings suggest that they may be useful in AD treatment. In this study, we developed a double-layered poly(lactic-co-glycolic acid) (PLGA)/sodium hyaluronate (HA) microneedle (MN) patch for the effective and sustained delivery of hydrophobic and hydrophilic polyphenols, curcumin (CUR) and gallic acid (GA), into the skin. We investigate whether our MN patch can serve as a long-acting transdermal delivery system of polyphenols for the long-term control of AD and whether codelivery of CUR and GA into the skin can exhibit a synergistic effect for ameliorating AD symptoms.
The double-layered MN patch comprised a CUR-loaded PLGA tip and a HA base layer containing GA and a stabilizer [L-ascorbic acid (AA)] that protected GA from degradation (Fig. 1). The dual-drug-loaded MNs were connected to a HA supporting structure, which can provide extra length to insert the MNs into deeper skin layers. Upon insertion into the skin, the HA layer is dissolved by the skin's interstitial fluid within 5 min to trigger GA rapid release; the PLGA tip then becomes embedded into the dermis for sustained release of CUR through PLGA degradation. We hypothesized that coadministration of the two polyphenols initially would provide quick symptomatic relief and that extended delivery of low-dose CUR would maintain the therapeutic effect and reduce dosing frequency, thus achieving long-term AD management.
In this study, we explore the skin insertion and embedding ability of the PLGA/HA MN, its in vitro drug release behavior, and the effect of MN degradation on drug release. We evaluated the feasibility of using CUR/GA-loaded MNs as a long-acting formulation to ameliorate AD pathology in Nc/Nga mice by scoring dermatitis symptoms and evaluating changes in epidermal thickness, mast cell count, serum histamine and IgE levels, and ROS and cytokine concentrations in the skin tissue. Finally, these effects were compared with those of the CUR-loaded (i.e. CUR-only) MN group to investigate whether the coadministration of CUR with GA produces a synergistic anti-inflammatory effect.
2. Materials and methods
2.1. Animals, materials, and reagents
We obtained 9–12-week-old female Nc/Nga mice from the RIKEN BioResource Center (Tsukuba, Japan). HA with a molecular weight (MW) of 7 and 250–500 kDa were purchased from Bloomage Biotechnology (Jinan, China) and Shandong Freda Biotechnology (Shangdong, China), respectively. PLGA (D,L-lactide![[thin space (1/6-em)]](https://www.rsc.org/images/entities/char_2009.gif) :
:![[thin space (1/6-em)]](https://www.rsc.org/images/entities/char_2009.gif) glycolide = 75
glycolide = 75![[thin space (1/6-em)]](https://www.rsc.org/images/entities/char_2009.gif) :
:![[thin space (1/6-em)]](https://www.rsc.org/images/entities/char_2009.gif) 25, inherent viscosity = 0.19 dL g−1), polyvinyl alcohol (PVA, MW = 6 kDa), and polyvinylpyrrolidone (PVP, MW = 10 kDa) were purchased from Green Square Material (Taoyuan, Taiwan), Polysciences (Warrington, PA, USA), and Sigma-Aldrich (St Louis, MO, USA), respectively. CUR and GA were purchased from Acros Organics (NJ, USA). Stainless steel master structures of MNs and supporting structures were produced by Hong-Da Precision Industry (New Taipei City, Taiwan).
25, inherent viscosity = 0.19 dL g−1), polyvinyl alcohol (PVA, MW = 6 kDa), and polyvinylpyrrolidone (PVP, MW = 10 kDa) were purchased from Green Square Material (Taoyuan, Taiwan), Polysciences (Warrington, PA, USA), and Sigma-Aldrich (St Louis, MO, USA), respectively. CUR and GA were purchased from Acros Organics (NJ, USA). Stainless steel master structures of MNs and supporting structures were produced by Hong-Da Precision Industry (New Taipei City, Taiwan).
2.2. Ethics statement
All animal experiments were conducted in accordance with the guidelines of the Laboratory Animal Center of National Cheng Kung University (NCKU) and approved by the Institutional Animal Care and Use Committee of NCKU (approval no.: 108069).2.3. Fabrication of CUR/GA-loaded PLGA/HA microneedles
The CUR/GA-loaded PLGA/HA MNs were fabricated by integrating the CUR-loaded PLGA tip and the GA-loaded HA supporting patch (Fig. 2). Two types of stainless steel master structures (Fig. S1†) were used to make inverse polydimethylsiloxane (PDMS) molds for preparing the double-layered MNs.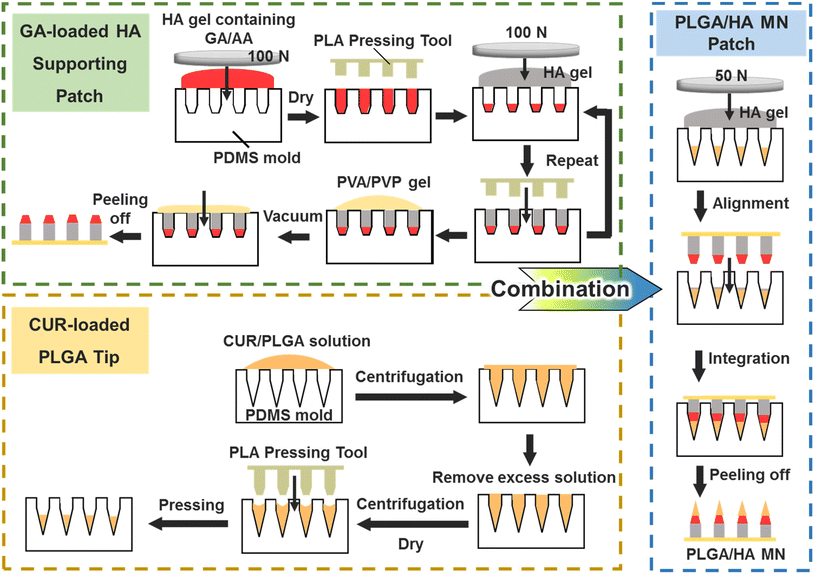 | ||
| Fig. 2 Schematic illustration of the fabrication process of the CUR/GA-loaded PLGA/HA MN, which was fabricated by integrating the CUR-loaded PLGA tip and the GA-loaded HA supporting patch. | ||
First, CUR (30 mg) was dissolved in 1 mL of ethyl acetate, and PLGA powder (200 mg) was subsequently added and stirred for 1 h. To make the CUR-loaded tip, the obtained mixture (190 μL) was added onto the PDMS mold surface and then centrifuged in a swinging bucket rotor (Z326K, Hermle Labortechnik, Germany) at 3880g for 5 min at 10 °C. After removal of the excess solution on the mold surface, the mold was centrifuged again without sealing the centrifuge tube caps for drying at 10 °C for 90 min and then placed overnight in an oven at 37 °C. A polylactic acid pressing tool was used to push the filled PLGA further into the mold cavities to form the CUR-loaded tip.
A HA gel containing drugs was prepared to fabricate the GA-loaded HA supporting patch. First, GA (180 mg), AA (180 mg), and HA (3 g, weight ratio of 7![[thin space (1/6-em)]](https://www.rsc.org/images/entities/char_2009.gif) :
:![[thin space (1/6-em)]](https://www.rsc.org/images/entities/char_2009.gif) 250–500 kDa = 2
250–500 kDa = 2![[thin space (1/6-em)]](https://www.rsc.org/images/entities/char_2009.gif) :
:![[thin space (1/6-em)]](https://www.rsc.org/images/entities/char_2009.gif) 1) were dissolved in deionized (DI) water. After freeze-drying, 3 mL of DI water was added to the obtained HA sponge to produce the HA gel (47 wt%) containing GA and AA. The gel (approximately 50 mg) was placed on the PDMS mold surface and covered with a polytetrafluoroethylene plate. A universal testing machine (AGS-500NX, Shimadzu, Japan) was used to apply a compression force of 100 N on the polytetrafluoroethylene plate for 60 s to fill the gel in the mold. After the gel that remained on the mold surface was removed, the mold was dried in an oven at 37 °C for 5 min. The filled gel was further pushed into the bottom of the mold cavities using the PLA pressing tool. Subsequently, the same filling process was repeated twice to compress a 50 wt% HA gel without drugs into the mold. Finally, a 50 wt% PVA/PVP aqueous solution (20 mg, weight ratio of PVA/PVP = 1
1) were dissolved in deionized (DI) water. After freeze-drying, 3 mL of DI water was added to the obtained HA sponge to produce the HA gel (47 wt%) containing GA and AA. The gel (approximately 50 mg) was placed on the PDMS mold surface and covered with a polytetrafluoroethylene plate. A universal testing machine (AGS-500NX, Shimadzu, Japan) was used to apply a compression force of 100 N on the polytetrafluoroethylene plate for 60 s to fill the gel in the mold. After the gel that remained on the mold surface was removed, the mold was dried in an oven at 37 °C for 5 min. The filled gel was further pushed into the bottom of the mold cavities using the PLA pressing tool. Subsequently, the same filling process was repeated twice to compress a 50 wt% HA gel without drugs into the mold. Finally, a 50 wt% PVA/PVP aqueous solution (20 mg, weight ratio of PVA/PVP = 1![[thin space (1/6-em)]](https://www.rsc.org/images/entities/char_2009.gif) :
:![[thin space (1/6-em)]](https://www.rsc.org/images/entities/char_2009.gif) 1) was filled into the mold under vacuum (10 cmHg) for 5 s, and the solution that remained on the mold surface was scraped off. The PVA/PVP solution was added to the mold to form a patch. The mold was dried in a 37 °C oven overnight, and the GA-loaded HA supporting patch was then peeled off from the mold gently.
1) was filled into the mold under vacuum (10 cmHg) for 5 s, and the solution that remained on the mold surface was scraped off. The PVA/PVP solution was added to the mold to form a patch. The mold was dried in a 37 °C oven overnight, and the GA-loaded HA supporting patch was then peeled off from the mold gently.
To combine the CUR-loaded PLGA tip with the GA-loaded HA supporting patch, the HA gel (50 wt%, 20 mg) was compressed into the PLGA-filled mold under a compression force of 50 N for 10 s. The excess gel on the mold surface was removed. Subsequently, the HA supporting patch was aligned and inserted into the mold cavities manually under a stereomicroscope for combining with the PLGA tip. The PLGA/HA MNs were peeled off from the mold after drying overnight in the 37 °C oven.
2.4. In vitro and in vivo skin insertions
The MNs were inserted into the porcine cadaver skin or mice skin for 5 min by using a custom-made applicator, which applied insertion forces of 10 and 8 N/patch for porcine and mice skin, respectively. For the in vivo insertion test, the dorsal hair of the mice was shaved first. At the indicated time points, the mice were sacrificed, and the MN-inserted skin was excised for histological and confocal microscopic analyses. Two-dimensional (2D) and three-dimensional (3D) confocal reconstruction images were created through xyz stack acquisition to observe drug distribution in the skin.2.5. Quantification of drug loading in microneedles
To determine the CUR loading amount, MNs were dissolved in 2 mL of ethyl acetate with stirring for 2 days. The resulting solution was centrifuged at 22![[thin space (1/6-em)]](https://www.rsc.org/images/entities/char_2009.gif) 370g for 5 min at 15 °C to remove the precipitate. The supernatant was collected, and the CUR content in the extract was determined using a UV-Vis spectrophotometer at 418 nm.23
370g for 5 min at 15 °C to remove the precipitate. The supernatant was collected, and the CUR content in the extract was determined using a UV-Vis spectrophotometer at 418 nm.23
To measure the GA loading amount, the HA supporting patch was dissolved in 1 mL of high-performance liquid chromatography (HPLC) mobile phase, comprising 1% acetic acid aqueous solution and acetonitrile (90![[thin space (1/6-em)]](https://www.rsc.org/images/entities/char_2009.gif) :
:![[thin space (1/6-em)]](https://www.rsc.org/images/entities/char_2009.gif) 10, v/v), and stirred for 20 min. The obtained solution was then centrifuged at 22
10, v/v), and stirred for 20 min. The obtained solution was then centrifuged at 22![[thin space (1/6-em)]](https://www.rsc.org/images/entities/char_2009.gif) 370g for 10 min, and the supernatant was analyzed using HPLC. The HPLC system was equipped with a reverse phase C18 analytical column, and the flow rate of the mobile phase was set as 0.7 mL min−1. The column temperature was maintained at 28 °C, and the UV detection wavelength was set at 272 nm.24
370g for 10 min, and the supernatant was analyzed using HPLC. The HPLC system was equipped with a reverse phase C18 analytical column, and the flow rate of the mobile phase was set as 0.7 mL min−1. The column temperature was maintained at 28 °C, and the UV detection wavelength was set at 272 nm.24
2.6. Determination of drug delivery efficiency of microneedles
After MN insertion for 5 min, the patch was removed from the porcine cadaver skin and then dissolved in ethyl acetate or DI water to extract the remaining drugs. The skin was tape-stripped 20 times using 3 M adhesive tapes to collect the drugs remaining on the skin surface. The tapes were then cut into small pieces and soaked in ethyl acetate or DI water to recover the drugs. The amounts of CUR and GA extracted from the patches or tapes were analyzed as described in Section 2.5. The efficiency of drug delivery into the skin was calculated using eqn (1): | (1) |
2.7. In vitro drug release
To evaluate in vitro CUR release profiles, MN patches were immersed in 4 mL of phosphate-buffered saline (PBS) containing 1% (v/v) tween 20. The samples were incubated in a shaking water bath with a shaking speed of 100 rpm at 37 °C. At predetermined time intervals, the release medium (2 mL) was sampled for UV-Vis analysis, and fresh release medium (2 mL) was immediately added to maintain the original volume. To observe MN degradation, the MN sample was collected at specific time points for scanning electron microscopic examination.In vitro GA transdermal delivery was evaluated using a Franz diffusion cell with a permeation area of approximately 0.66 cm2. After the MN was inserted into the porcine cadaver skin, the treated skin was cut in circles of 1.2 cm radius and clamped between the donor and the receptor chamber of the Franz diffusion cell. The receptor chamber was filled with 5 mL of PBS solution and stirred at 300 rpm. Because normal skin surface temperature is approximately 32 °C,25 the Franz diffusion cell was maintained at 32 ± 1 °C through thermostatic bath circulation.26,27 At specific time points, PBS in the receptor medium was collected and replaced with an equal volume of fresh medium. All collected samples were analyzed using HPLC, as described in Section 2.5, to determine the amount of released GA.
2.8. Induction of AD-like skin lesions in Nc/Nga mice and microneedle treatment
Nc/Nga mice were anesthetized, and their back hair was shaved and treated with a hair-removal cream. To establish an AD-induced animal model, 2,4-dinitrochlorobenzene (DNCB) dissolved in the acetone![[thin space (1/6-em)]](https://www.rsc.org/images/entities/char_2009.gif) :
:![[thin space (1/6-em)]](https://www.rsc.org/images/entities/char_2009.gif) olive oil mixture (3
olive oil mixture (3![[thin space (1/6-em)]](https://www.rsc.org/images/entities/char_2009.gif) :
:![[thin space (1/6-em)]](https://www.rsc.org/images/entities/char_2009.gif) 1, 200 μL) was repeatedly and topically applied to mice dorsal skin for 2 weeks.28 Fig. S2† illustrates the detailed AD induction protocol. Mice were randomly divided into four groups (5–6 mice each): AD, CUR, CUR/GA, and Healthy. In the AD group, the mice were painted with DNCB only. In the CUR and CUR/GA groups, two CUR-loaded and CUR/GA-loaded MN patches were applied to the dorsal skin of the mice on Day 0, respectively. In the Health group, the mice were not subjected to any treatment. In all groups except for the Health group, 0.2% (w/v) DNCB (200 μL) was painted onto the back skin twice a week during the treatment period. At specific time points, blood samples were collected, and the serum was stored at −20 °C until further analysis.
1, 200 μL) was repeatedly and topically applied to mice dorsal skin for 2 weeks.28 Fig. S2† illustrates the detailed AD induction protocol. Mice were randomly divided into four groups (5–6 mice each): AD, CUR, CUR/GA, and Healthy. In the AD group, the mice were painted with DNCB only. In the CUR and CUR/GA groups, two CUR-loaded and CUR/GA-loaded MN patches were applied to the dorsal skin of the mice on Day 0, respectively. In the Health group, the mice were not subjected to any treatment. In all groups except for the Health group, 0.2% (w/v) DNCB (200 μL) was painted onto the back skin twice a week during the treatment period. At specific time points, blood samples were collected, and the serum was stored at −20 °C until further analysis.
2.9. Scoring of AD
AD lesion severity was evaluated according to the SCORing AD (SCORAD) index,29 which is based on erythema, edema/papulation, oozing/crust formation, excoriations, and dryness. Each item was scored as 0 (no symptoms), 1 (mild symptoms), 2 (moderate symptoms), or 3 (severe symptoms). The dermatitis score was calculated as the sum of the scores for all five items.2.10. Histological examination of skin sections
Skins were embedded in the Tissue-Tek optimal cutting temperature compound and sectioned at 10 μm. Tissue sections were stained with hematoxylin and eosin (H&E) or toluidine blue (0.01%) to observe epidermal thickness and infiltration of mast cells, respectively, by light microscopy. Five randomly selected fields from each mouse were examined to calculate the mean epidermal thickness from the H&E-stained sections, and the numbers of mast cells were quantified from the toluidine blue-stained sections.2.11. Measurement of serum IgE and histamine levels
Serum IgE and histamine levels were determined using a mouse IgE enzyme-linked immunosorbent assay (ELISA) kit (Invitrogen, CA, USA) and a histamine ELISA kit (Abcam, Cambridge, UK), respectively, according to the manufacturers’ instructions.2.12. Measurement of Th1- and Th2-type cytokines from skin tissues
Th1-related (IFN-γ) and Th2-related cytokines (IL-4, IL-5, and IL-13) in proteins extracted from the skin tissue were analyzed using a Luminex multiplex assay, which was performed using Milliplex Map mouse cytokine magnetic bead panels (Merck Millipore, MA, USA). Briefly, 600 μL of lysis solution, which contains Milliplex Map lysis buffer (Merck Millipore) and protease inhibitor cocktail (Calbiochem, CA, USA) at a ratio of 1![[thin space (1/6-em)]](https://www.rsc.org/images/entities/char_2009.gif) :
:![[thin space (1/6-em)]](https://www.rsc.org/images/entities/char_2009.gif) 100 (v/v), was added to the skin tissue sample (100 mg). The samples were then homogenized and centrifuged at 18
100 (v/v), was added to the skin tissue sample (100 mg). The samples were then homogenized and centrifuged at 18![[thin space (1/6-em)]](https://www.rsc.org/images/entities/char_2009.gif) 620g and 4 °C for 15 min. The supernatant was collected and total protein concentration was determined using Pierce BCA Protein Assay Kit (Thermo Fisher Scientific, MA, USA). The extracted protein sample was diluted to a final concentration of 7 μg mL−1 by using lysis buffer for analysis. Cytokine concentrations were measured using a Luminex 200 instrument system (Luminex, TX, USA) and normalized to the total protein content of each sample (pico-gram of cytokine/milligram of total protein).
620g and 4 °C for 15 min. The supernatant was collected and total protein concentration was determined using Pierce BCA Protein Assay Kit (Thermo Fisher Scientific, MA, USA). The extracted protein sample was diluted to a final concentration of 7 μg mL−1 by using lysis buffer for analysis. Cytokine concentrations were measured using a Luminex 200 instrument system (Luminex, TX, USA) and normalized to the total protein content of each sample (pico-gram of cytokine/milligram of total protein).
2.13. Measurement of ROS from skin tissues
OxiSelect in vitro ROS Assay Kit (Cell Biolabs, CA, USA) was used to detect ROS levels in mice skin tissues. First, skin tissue (50 mg) was homogenized on ice with 1 mL of PBS and centrifuged at 10![[thin space (1/6-em)]](https://www.rsc.org/images/entities/char_2009.gif) 000g for 5 min. According to the manufacturer's protocol, the supernatant (50 μL) was added to the well with a catalyst (50 μL) that helped accelerate the oxidative reaction and incubated at room temperature for 5 min. Subsequently, dichlorodihydrofluorescin (DCFH) solution (100 μL) was added to the mixture and incubated at room temperature for 30 min. The fluorescence was read at 480 nm excitation and 530 nm emission.
000g for 5 min. According to the manufacturer's protocol, the supernatant (50 μL) was added to the well with a catalyst (50 μL) that helped accelerate the oxidative reaction and incubated at room temperature for 5 min. Subsequently, dichlorodihydrofluorescin (DCFH) solution (100 μL) was added to the mixture and incubated at room temperature for 30 min. The fluorescence was read at 480 nm excitation and 530 nm emission.
2.14. Statistical analysis
Data are expressed as means ± standard deviations and were analyzed using one-way analysis of variance. P < 0.05 was considered statistically significant.3. Results and discussion
3.1. Microneedle characterization
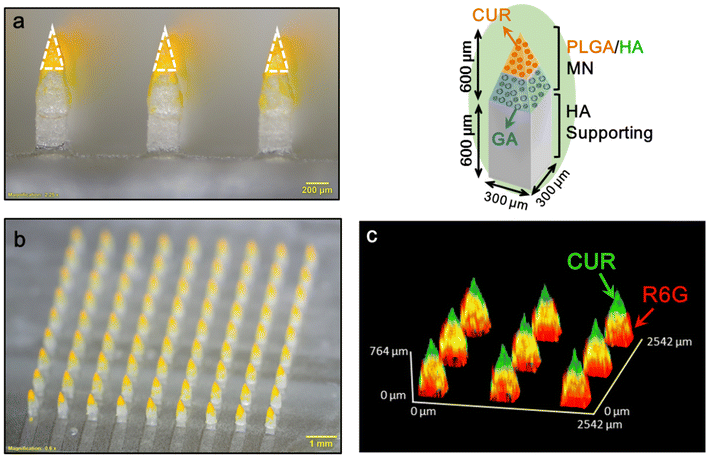
When a MN patch is applied to the skin, the MN puncture force causes remarkable skin indentation, resulting in a shallower insertion depth and incomplete drug delivery.30–32 Our double-layered MN has a supporting structure design that can offer an extended length to counteract skin indentation, thereby increasing the insertion depth and reducing drug wastage. Fig. 3a and b displays the prepared MN patch composed of CUR/GA-loaded PLGA/HA MNs (height, 600 μm; base width, 300 μm) and HA supporting structures (inset in Fig. 3). The patch (10 × 10 mm2) comprised 9 × 9 pyramidal-shaped needles (Fig. 3b) with a center-to-center spacing of 1000 μm (Fig. 3a). As presented in Fig. 3a, the length of the CUR-loaded PLGA tips (bright yellow, dotted triangle) was 355 ± 20 μm (n = 5). Because GA is transparent, we used a hydrophilic red fluorescent dye, rhodamine 6G (R6G), to assess GA distribution in the MN. A 3D reconstruction confocal image of a representative MN patch (Fig. 3c) indicates that CUR (green) and R6G (red) were located in the tip and the base layer region of the MN, respectively, to form a double-layered structure.3.2. Microneedle insertion ability and skin resealing after microneedle insertion
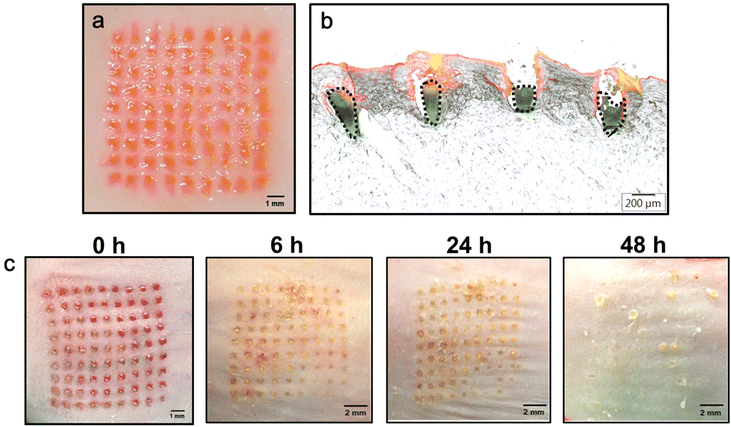
To evaluate whether the double-layered PLGA/HA MN has sufficient mechanical strength for skin insertion, the CUR/R6G-loaded MN patches were applied to a porcine cadaver or a mouse skin by using a custom-made applicator. After insertion for 5 min, the HA supporting structures can be quickly dissolved by the skin's interstitial fluid, thus leaving the drug-loaded MN within the skin. Both the surfaces of the porcine cadaver skin (Fig. 4a) and the mouse skin (Fig. 4c) displayed a complete array of red spots (9 × 9) corresponding to the MN insertion sites, demonstrating that PLGA/HA MNs can puncture the porcine or mouse skin with an insertion ratio of 100%.Histological sections of the MN-inserted porcine skins (Fig. 4b) indicate that the CUR-loaded tips (green, dotted region) were entirely embedded in the skin at a depth of 559 ± 48 μm (n = 4). The red fluorescence located above the CUR-loaded tips (Fig. 4b) represents that R6G was released from the dissolved HA layer and diffused to the surrounding tissues. These results indicated that the double-layered PLGA/HA MN can be successfully inserted into the skin for rapid release of hydrophilic drugs from the HA base layer and sustained release of hydrophobic CUR from the implanted PLGA tip.
Monitoring the resealing of micropores formed on the skin surface after MN insertion provides a preliminary indication of skin recovery. Fig. 4c presents bright-field micrographs of mouse skins at different time points after MN application. The micropores notably shrank at 6 h, and crusts/scabs were formed within 24 h, which fell off at 48 h after MN treatment. Finally, no micropores were observed on the skin surface at 48 h after insertion, indicating their complete resealing. Additionally, the values of transepidermal water loss returned to baseline values within 48 h (Fig. S3†), which also showed that the skin recovered its barrier function in 48 h after MN insertion.
3.3. Drug delivery efficiency
To determine the drug delivery efficiency of the PLGA/HA MNs, we measured the amount of drugs on the patch before and after insertion into porcine cadaver skin and the amount that remained on the skin surface. The loading amount of CUR and GA in the MN patch was 225 ± 19 and 117 ± 10 μg (n = 5), respectively. After insertion for 5 min, the percentage of CUR and GA delivered was 99.1% ± 0.2% and 67.2% ± 4.8% (n = 5), respectively. A lower delivery efficiency of GA is mainly because not all GA-containing HA layer can be fully inserted into the skin. Here, the skin insertion depth of the MN (approximately 560 μm, Fig. 4b) is shorter than the length of the drug-loaded MN (approximately 600 μm). Additionally, during insertion into the skin, the HA layer was dissolved by the skin's interstitial fluid to form a viscous gel. When the patch is removed, the viscous HA gel may carry some of the delivered GA out of the skin. We found that approximately 26.2% and 6.5% of GA remained on the patch and skin surface, respectively. Conversely, because the MN insertion depth is notably longer than the length of the CUR-loaded PLGA tip (approximately 350 μm), the PLGA tip can enter the skin completely (Fig. 4b), thus achieving nearly 100% delivery efficiency.3.4. In vitro drug release from the double-layered microneedles
The in vitro GA release from the MNs was studied using a Franz diffusion cell. Upon insertion of the PLGA/HA MN into a porcine cadaver skin, the HA layer was quickly dissolved in the skin, thus triggering GA release from the MN. Fig. 5a indicates that 26.0% ± 5.5% (n = 6) GA penetrated across the skin within 24 h. Subsequently, the dissolved HA may form a viscous gel at the insertion site. GA gradually released and diffused from the HA gel and resulted in an extended release of GA for up to 11 days (Fig. 5a).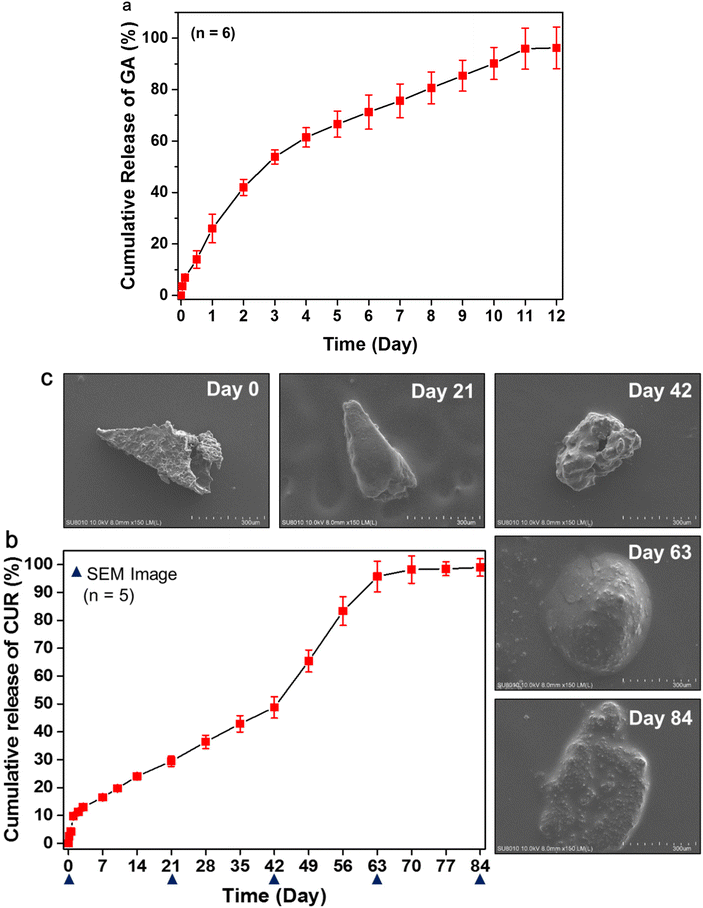 | ||
| Fig. 5 In vitro release profiles of GA (a) and CUR (b) from the MNs. SEM images (c) of the morphologies of the representative PLGA tips after immersion in PBS for various times. | ||
Fig. 5b shows the in vitro release profile of CUR from the PLGA/HA MNs. CUR release from the PLGA tip occurred in three stages:33,34 an initial burst (approximately 10% at 24 h), a slow-release period (2.1 ± 0.2 μg day−1 for up to 42 days, n = 5), and an erosion-accelerated release phase (5.0 ± 0.2 μg day−1 from Day 42 to 63, n = 5). The initial burst release may be attributed to the release of the drug localized near the surface of the PLGA tip.35 The steady-state release during Days 1–42 indicates no drastic change in the structure of the PLGA tip (Fig. 5c). During the slow-release stage, drugs diffused slowly through the relatively dense PLGA matrix, while polymer degradation and hydration gradually proceeded. Subsequently, the cumulative release of CUR increased quickly from 50% to 96% from Day 42 to Day 63 because of PLGA degradation.
To better understand the behavior of the CUR release from the PLGA tip, the morphological changes of the PLGA tip were characterized using scanning electron microscopy at predetermined times (Fig. 5c). After being immersed in aqueous medium for 21 days, the samples still maintained their intact pyramidal shape but became swollen compared with Day 0, probably due to water absorption or hydration of the polymer. The polymer degraded slowly during the slow-release period.
On Day 42, the sample size became smaller than that observed on Day 21, and pores were observed on the sample surface, indicating accelerated matrix erosion. These pores were subsequently destroyed with further PLGA degradation and CUR release.34 The remaining samples collapsed and became irregular clumps on Day 63 and Day 84 (Fig. 5c). This may explain the rapid release of CUR after Day 42. The cumulative release of CUR from PLGA tips finally reached up to 99.0% ± 3.1% (n = 5) at the end of the experiment. These results revealed that the PLGA tip can provide sustained release of hydrophobic polyphenols to the skin for at least 2 months.
3.5. Drug retention in the mouse skin
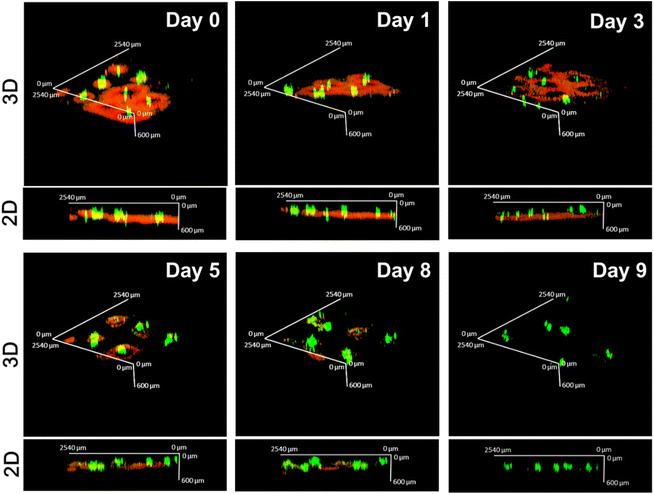
To evaluate drug distribution and retention in the skin tissue, the CUR/R6G-loaded microneedles were inserted into the dorsal skin of Nc/Nga mice, and the fluorescence of the drugs in the skin was recorded using confocal laser scanning microscopy at specific time points. Fig. 6 displays 2D and 3D reconstruction images of the MN-treated skin.On Day 0, we observed that the CUR-loaded PLGA tips (green) were located at a depth of approximately 400–500 μm, which is equivalent to the dermal layer. The red fluorescence of R6G surrounded the green one of the implanted tips, indicating that it was released from the dissolved HA layer and quickly diffused to the adjacent tissue. The red fluorescence signals gradually attenuated and were not detectable on Day 9, implying that the hydrophilic drug can be retained in the applied skin for at least 8 days. By contrast, the green fluorescence signals were relatively concentrated at the puncture site, suggesting that the majority of the drugs were still encapsulated in the PLGA tip after 9 days of release. These results are generally consistent with the observations obtained from in vitro drug release (Fig. 5).
3.6. Alleviation of DNCB-induced AD-like skin symptoms in Nc/Nga mice
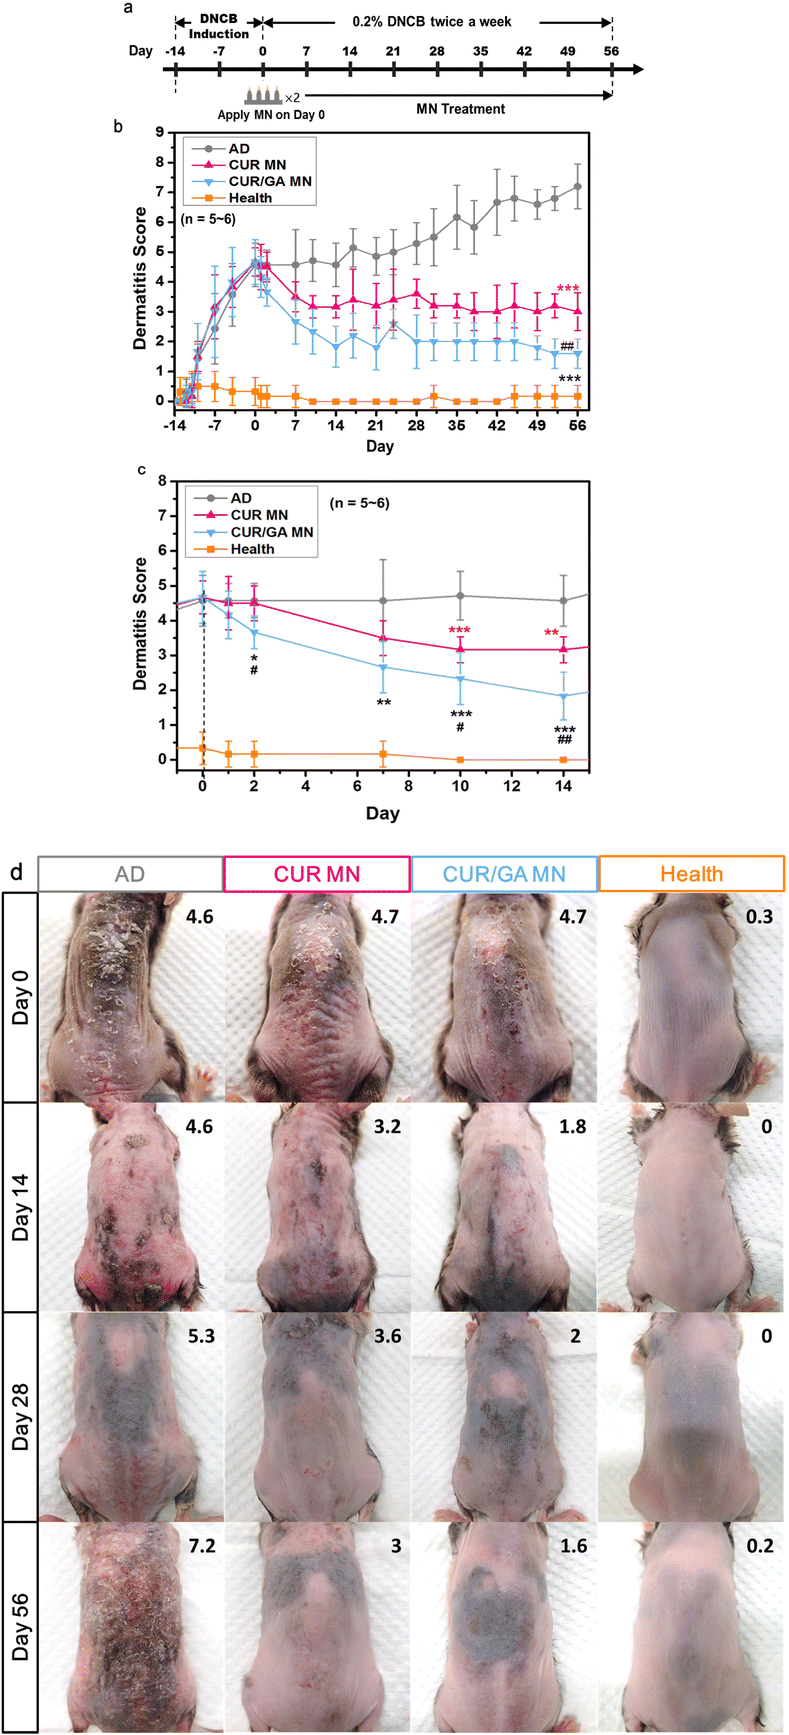
To evaluate the feasibility of using the polyphenol-loaded MN for ameliorating AD-like skin lesions, Nc/Nga mice were divided into four groups: health (no DNCB exposure), AD (repeated application of DNCB without treatment), CUR MN (CUR-loaded MN treatment), and CUR/GA MN (CUR/GA-loaded MN treatment). To provoke remarkable and stable AD-like lesions in Nc/Nga mice, DNCB was repeatedly and topically applied to the dorsal skin of mice before and during the treatment period (Fig. 7a). The efficacy of the treatment with the proposed MN was evaluated by determining the dermatitis sore (Fig. 7b and c) from the photographic image of dorsal skin lesions (Fig. 7d). After DNCB induction for 2 weeks (Day 0), the mean dermatitis score for all the DNCB-exposed mice increased to approximately 4.5.The AD group exhibited more prominent erythema, edema, crusts, excoriations, and dryness (Fig. 7d) and increased the dermatitis score from 4.6 ± 0.7 on Day 0 to 7.2 ± 0.7 on Day 56 (Fig. 7b, p < 0.001). Compared with the AD group, the dermatitis scores were significantly lower in the CUR MN (3.0 ± 0.6, p < 0.001) and CUR/GA MN (1.6 ± 0.5, p < 0.001) groups on Day 56 (Fig. 7b). These results implied that using the proposed PLGA/HA MNs for transdermal delivery of polyphenols effectively ameliorate AD-like skin lesions in mice.
CUR/GA MN-treated mice had a lower dermatitis score than CUR MN-treated mice from Day 2 until the end of the study (Fig. 7c), implying that the CUR/GA MN patch was quicker and more effective in controlling AD severity. The quick relief of AD symptoms may be attributed to the initial release of both drugs from the CUR/GA MNs. After the GA was completely released (approximately 11 days, Fig. 5a), the sustained release of CUR from the embedded PLGA tips (Fig. 5b) maintained the improvement in symptoms up to 8 weeks (Fig. 7b). Our findings demonstrated that codelivery of CUR and GA using the double-layered MN not only has a synergistic effect on reducing inflammatory skin lesions but may also serve as a fast-acting and long-lasting treatment option for patients with AD.
3.7. Suppression of epidermal thickening and mast cell infiltration
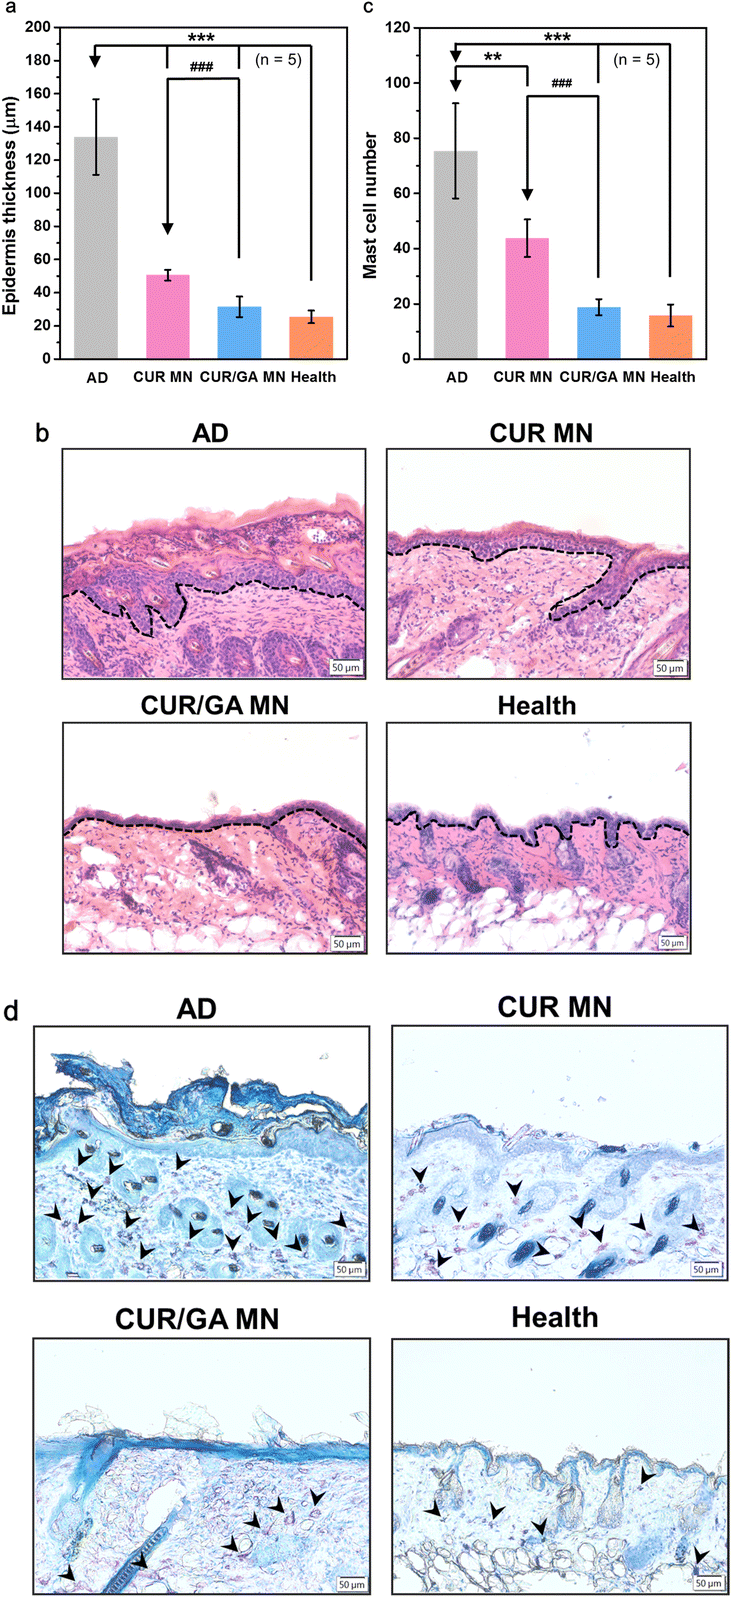
Epidermal hyperplasia and infiltration of lymphocytes and mast cells in skin lesions are typical features of the inflamed skin tissue.36 To investigate the effects of MN treatment on the amelioration of tissue inflammation, skin tissue sections were stained with H&E or toluidine blue to determine epidermal thickness (Fig. 8a) or calculate infiltrated mast cells (Fig. 8c), respectively. The AD group displayed marked epidermal thickening (134 ± 23 μm, dotted lines in Fig. 8b) and increased mast cells (75 ± 17 cells per field, arrowheads in Fig. 8d) in the dermis. However, both epidermal thickening and mast cell count were significantly suppressed in the CUR MN (51 ± 3 μm and 44 ± 7 cells per field, respectively, both p < 0.01) or CUR/GA MN groups (32 ± 6 μm and 19 ± 3 cells per field, respectively, both p < 0.001), implying that MN treatment significantly inhibited DNCB-induced epidermal hypertrophy and accumulation of immune cells (Fig. 8). Furthermore, codelivery of CUR and GA using the PLGA/HA MNs exhibited a superior anti-inflammatory effect than the CUR-only MN patch.3.8. Downregulation of serum IgE and histamine levels
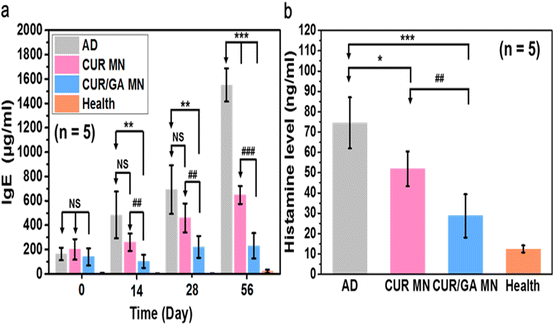
High serum IgE and elevated plasma histamine levels were commonly observed in patients with AD.37 To evaluate whether the proposed MN has a regulator effect on allergic responses, we measured serum IgE and histamine levels in Nc/Nga mice after MN treatment. In the AD group, IgE levels gradually increased with time, reaching almost 1550 μg mL−1 on Day 56, whereas those in the CUR and CUR/GA MN groups were significantly lower (648 ± 74 and 231 ± 104 μg mL−1, respectively, p < 0.001; Fig. 9a). Similarly, the CUR and CUR/GA MN groups had significantly lower plasma histamine levels (51.9 ± 8.6 and 28.8 ± 10.6 ng mL−1, respectively) than the AD group (74.5 ± 12.6 ng mL−1; p < 0.05; Fig. 9b). Notably, the CUR/GA MN group exhibited significantly lower serum IgE levels (p < 0.001; Fig. 9a) and histamine release (p < 0.01; Fig. 9b) than the CUR MN group. These results collectively indicate that the administration of polyphenol-loaded PLGA/HA MNs effectively inhibited IgE production and histamine release in DNCB-sensitized Nc/Nga mice; codelivery of CUR and GA exhibited a superior anti-allergic effect compared with CUR alone.3.9. Suppression of Th1- and Th2-type cytokine secretion
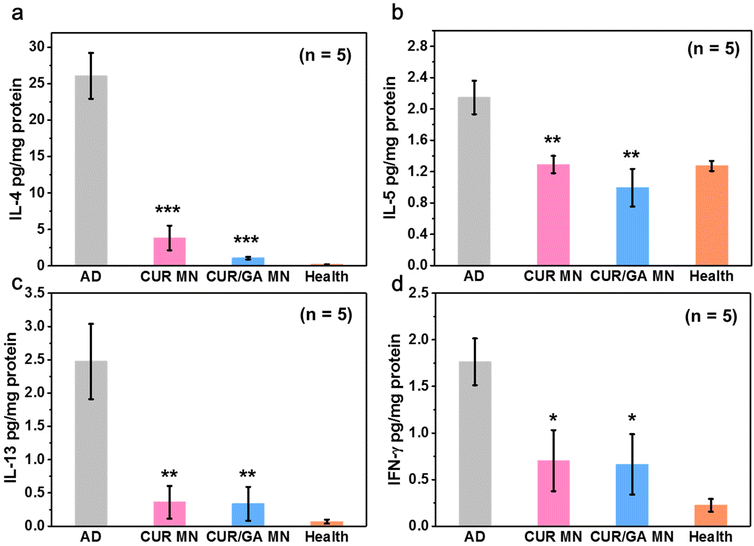
AD is a complex disease involving both chronic and acute phases. Clinically, acute and chronic lesions are often observed in the same patient and often overlap.38,39 Generally, the acute AD stage is highly associated with oversecretion of Th2 cytokines, such as IL-4, IL-5, and IL-13, whereas the chronic stage displays high IFN-γ level, a representative Th1 cytokine.40 After repeated DNCB induction, both Th1- and Th2-type cytokines were significantly elevated in the AD group compared with the healthy mice (p < 0.01, Fig. 10) on Day 56, displaying a mixed Th1/Th2-type dermatitis.41,42 However, all the four cytokines were significantly inhibited in the CUR or CUR/GA MN groups (p < 0.05). These results demonstrate that the proposed MNs can regulate immune responses and downregulate the production of Th1 and Th2 cytokines at local inflammation sites, thus alleviating AD symptoms.3.10. Reduction of ROS levels in skin lesions
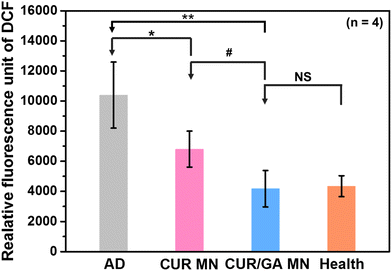
Excess ROS production results in oxidative stress, which can trigger the inflammatory cascade and induce chronic inflammatory diseases. To investigate whether the polyphenol-loaded MNs enabled protection of the skin against oxidative stress, ROS concentrations in skin tissues were measured using the ROS assay kit based on an oxidation-sensitive fluorescent dye, DCFH. ROS species can react with DCFH, which can be rapidly oxidized to 2′,7′-dichlorodihydrofluorescein (DCF) with high fluorescence. The fluorescence intensity of DCF is proportional to the amount of ROS within the tissue. Fig. 11 shows that the ROS level in cutaneous tissue was significantly increased in the AD group compared with that in the Health group (p < 0.01). This reveals that oxidative stress was elevated in DNCB-treated mice with AD-like lesions. Nonetheless, MN groups considerably reduced the oxidative stress (p < 0.05) after treatment for 56 days. Moreover, the CUR/GA MN group exhibited a significantly lower ROS level than the CUR group (p < 0.05). These results demonstrated that the antioxidant activity of the polyphenol-loaded MN system and MN delivery of CUR and GA can effectively scavenge ROS and prevent oxidative damage, thus alleviating the clinical manifestations of AD.Maintaining the stability of polyphenols in the MN is very important to guarantee its antioxidant and anti-inflammatory abilities. To evaluate the stability of polyphenols in the PLGA/HA MN patch, we measured the antioxidant activity of GA and CUR in the MNs before (i.e. the fresh group) and after storage at 25 °C for 4 weeks using a commonly used antioxidant assay, namely a 2,2′-azinobis-(3-ethylbenzothiazoline-6-sulfonic acid) (ABTS) radical cation (ABTS˙+) decolorization assay.43 We found that both GA and CUR can retain approximately 97% (radical-scavenging activity: 87 ± 3% for fresh and 84 ± 3% after 4-week storage) and 96% (radical-scavenging activity: 73 ± 2% for fresh and 70 ± 2% after 4-week storage) of their initial activity, respectively (Fig. S4†). No significant reduction in antioxidant activity of encapsulated polyphenols was observed (p > 0.05, n = 5). These results demonstrated that GA and CUR can maintain their stability in the proposed MNs at least for 4 weeks.
As a chronic inflammatory disease, AD often requires long-term treatment; however, long-term use of corticosteroids and other immunosuppressive agents is not recommended because of the risk of side effects and toxicities.44 This study is the first to propose a MN formulation that enables sustained delivery of polyphenols into the skin for 2 months (Fig. 5) and to demonstrate that the CUR/GA-loaded MN significantly improved AD symptoms (Fig. 7) and attenuated skin inflammation (Fig. 8) in mice. Notably, this improvement was sustained for at least 56 days through a single MN administration.
No significant differences were observed in body weight between the two MN-treated groups and the Health group (p > 0.05, Fig. S5 in ESI†), and no obvious abnormality was noted in any mouse during the 8-week treatment period, indicating a lack of serious side effects or remarkable toxicity with the drug-loaded MN patches. Notably, compared with traditional topical formulations, the PLGA/HA MN may greatly reduce the dosage needed and dosing frequency because the developed MN can release active ingredients directly within the skin in a sustained manner. Therefore, we believe that the CUR/GA-loaded PLGA/HA MN patch could be a feasible, safe, and effective option for long-term management of AD.
4. Conclusion
This study demonstrated that the use of the double-layered PLGA/HA microneedle patch for codelivery of CUR and GA effectively ameliorated AD-like symptoms and combated DNCB-induced oxidative stress in mice, as evidenced by a lower clinical score, less immune cell infiltration, decreased IFN-γ and Th2 cytokine production, and reduced ROS levels in skin lesions. Significant symptom improvement was observed on Day 2 of treatment and was maintained without worsening for at least 2 months after a single administration of MN. These results suggest that the double-layered MN can serve as a rapid and long-acting formulation of polyphenols and as a superior treatment for AD.Author contributions
Yi-Lun Chen: conceptualization, validation, formal analysis, investigation, visualization; Chih-Chi Chang: methodology, data curation, investigation, writing – original draft; Yi-Chin Lin: methodology, data curation; Mei-Chin Chen: project administration, supervision, conceptualization, writing – original draft, writing – review & editing, funding acquisition.Conflicts of interest
The authors declare that they have no competing interests.Acknowledgements
We are grateful for the support from the Core Research Laboratory and Laboratory Animal Center, College of Medicine, National Cheng Kung University and the technical services offered by the Bio-imaging Core Facility of the National Core Facility Program for Biopharmaceuticals, National Science and Technology Council, Taiwan. We thank the Taiwan Mouse Clinic, Academia Sinica and Taiwan Animal Consortium for the technical support in the animal experiments and Clinical Medicine Research Center, National Cheng Kung University Hospital for the equipment support. We would like to thank the financial assistance from the Ministry of Science and Technology of Taiwan (MOST 111-2628-B-006-012-MY3 and MOST 108-2314-B-006-074-MY3) and the Wallace Academic Editing for editing this manuscript. This research was also supported in part by Higher Education Sprout Project, Ministry of Education to the Headquarters of University Advancement at National Cheng Kung University (NCKU).References
- S. Ständer, Atopic dermatitis, N. Engl. J. Med., 2021, 384(12), 1136–1143 CrossRef PubMed
.
- M. R. Laughter, M. B. C. Maymone, S. Mashayekhi, B. W. M. Arents, C. Karimkhani, S. M. Langan, R. P. Dellavalle and C. Flohr, The global burden of atopic dermatitis: lessons from the global burden of disease study 1990–2017, Br. J. Dermatol., 2021, 184(2), 304–309 CrossRef CAS PubMed
.
- S. M. Langan, A. D. Irvine and S. Weidinge, Atopic dermatitis, Lancet, 2020, 396(10247), 345–360 CrossRef CAS PubMed
.
- J. K. Gittler, A. Shemer, M. Suárez-Fariñas, J. Fuentes-Duculan, K. J. Gulewicz, C. Q. F. Wang, H. Mitsui, I. Cardinale, C. de Guzman Strong, J. G. Krueger and E. Guttman-Yassky, Progressive activation of T(H)2/T(H)22 cytokines and selective epidermal proteins characterizes acute and chronic atopic dermatitis, J. Allergy Clin. Immunol., 2012, 130(6), 1344–1354 CrossRef CAS PubMed
.
- J. M. Spergel, From atopic dermatitis to asthma: the atopic march, Ann. Allergy, Asthma, Immunol., 2010, 105(2), 99–106 CrossRef CAS PubMed
.
- H. Jin, R. He, M. Oyoshi and R. S. Geha, Animal models of atopic dermatitis, J. Invest. Dermatol., 2009, 129(1), 31–40 CrossRef CAS PubMed
.
- M. Furue, T. Chiba, G. Tsuji, D. Ulzii, M. Kido-Nakahara, T. Nakahara and T. Kadono, Atopic dermatitis: immune deviation, barrier dysfunction, IgE autoreactivity and new therapies, Allergol. Int., 2017, 66(3), 398–403 CrossRef CAS PubMed
.
- S. J. Galli and M. Tsai, IgE and mast cells in allergic disease, Nat. Med., 2012, 18(5), 693–704 CrossRef CAS PubMed
.
- M. Carretero, S. Guerrero-Aspizua, N. Illera, V. Galvez, M. Navarro, F. García-García, J. Dopazo, J. L. Jorcano, F. Larcher and M. del Rio, Differential features between chronic skin inflammatory diseases revealed in skin-humanized psoriasis and atopic dermatitis mouse models, J. Invest. Dermatol., 2016, 136(1), 136–145 CrossRef CAS PubMed
.
- L. Chen, O. Martinez, L. Overbergh, C. Mathieu, B. S. Prabhakar and L. S. Chan, Early up-regulation of Th2 cytokines and late surge of Th1 cytokines in an atopic dermatitis model, Clin. Exp. Immunol., 2004, 138(3), 375–387 CrossRef CAS PubMed
.
- L. Tang, X. Li, L. Wan, H. Wang, Q. Mai, Z. Deng and H. Ding, Ameliorative effect of orally administered different linoleic acid/α-linolenic acid ratios in a mouse model of DNFB-induced atopic dermatitis, J. Funct. Foods, 2020, 65, 103754 CrossRef CAS
.
- H. Ji and X. K. Li, Oxidative stress in atopic dermatitis, Oxid. Med. Cell. Longevity, 2016, 2016, 2721469 Search PubMed
.
- T. Hussain, B. Tan, Y. Yin, F. Blachier, M. C. B. Tossou and N. Rahu, Oxidative stress and inflammation: what polyphenols can do for us?, Oxid. Med. Cell. Longevity, 2016, 2016, 7432797 Search PubMed
.
- E. L. Yarosz and C. H. Chang, The role of reactive oxygen species in regulating T cell-mediated immunity and disease, Immune Netw., 2018, 18(1), e14 CrossRef PubMed
.
- J. E. Greb, A. M. Goldminz, J. T. Elder, M. G. Lebwohl, D. D. Gladman, J. J. Wu, N. N. Mehta, A. Y. Finlay and A. B. Gottlieb, Psoriasis, Nat. Rev. Dis. Primers, 2016, 2, 16082 CrossRef PubMed
.
- S. Weidinger, L. A. Beck, T. Bieber, K. Kabashima and A. D. Irvine, Atopic dermatitis, Nat. Rev. Dis. Primers, 2018, 4(1), 1 CrossRef PubMed
.
- T. Wan, Q. Pan and Y. Ping, Microneedle-assisted genome editing: a transdermal strategy of targeting NLRP3 by CRISPR-Cas9 for synergistic therapy of inflammatory skin disorders, Sci. Adv., 2021, 7(11), eabe2888 CrossRef CAS PubMed
.
- J. A. Broeders, U. A. Ali and G. Fischer, Systematic review and meta-analysis of randomized clinical trials (RCTs) comparing topical calcineurin inhibitors with topical corticosteroids for atopic dermatitis: a 15-year experience, J. Am. Acad. Dermatol., 2016, 75(2), 410–419 CrossRef CAS PubMed
.
- E. C. Siegfried, J. C. Jaworski and A. A. Hebert, Topical calcineurin inhibitors and lymphoma risk: evidence update with implications for daily practice, Am. J. Clin. Dermatol., 2013, 14(3), 163–178 CrossRef PubMed
.
- J. Pérez-Jiménez, V. Neveu, F. Vos and A. Scalbert, Identification of the 100 richest dietary sources of polyphenols: an application of the phenol-explorer database, Eur. J. Clin. Nutr., 2010, 3(64 Suppl.), S112–S120 CrossRef PubMed
.
- H. Cory, S. Passarelli, J. Szeto, M. Tamez and J. Mattei, The Role of Polyphenols in Human Health and Food Systems: A Mini-Review, Front. Nutr., 2018, 5, 87 CrossRef PubMed
.
- H. Zhang and R. Tsao, Dietary polyphenols, oxidative stress and antioxidant and anti-inflammatory effects, Curr. Opin. Food Sci., 2016, 8, 33–42 CrossRef
.
- A. Singh and V. R. Avupati, Development and validation of UV-spectrophotometric method for the estimation of curcumin in standardised polyherbal formulations, J. Young Pharm., 2017, 9(4), 491–495 CrossRef CAS
.
- R. A. P. Purba and P. Paengkoum, Bioanalytical HPLC method of piper betle L. for quantifying phenolic compound, water-soluble vitamin, and essential oil in five different solvent extracts, J. Appl. Pharm. Sci., 2019, 9(5), 33–39 CrossRef CAS
.
- Q. Zhang, M. Murawsky, T. LaCount, J. Hao, G. B. Kasting, B. Newman, P. Ghosh, S. G. Raney and S. K. Li, Characterization of temperature profiles in skin and transdermal delivery system when exposed to temperature gradients in vivo and in vitro, Pharm. Res., 2017, 34(7), 1491–1504 CrossRef CAS PubMed
.
- C. M. Lee, S. P. Jin, E. J. Doh, D. H. Lee and J. H. Chung, Regional variation of human skin surface temperature, Ann. Dermatol., 2019, 31(3), 349–352 CrossRef PubMed
.
- M. Alberti, Y. Dancik, G. Sriram, B. Wu, Y. L. Teo, Z. Feng, M. Bigliardi-Qi, R. G. Wu, Z. P. Wang and P. L. Bigliardi, Multi-chamber microfluidic platform for high-precision skin permeation testing, Lab Chip, 2017, 17(9), 1625–1634 RSC
.
- J. H. Choi, S. W. Jin, B. H. Park, H. G. Kim, T. Khanal, H. J. Han, Y. P. Hwang, J. M. Choi, Y. C. Chung, S. K. Hwang, T. C. Jeong and H. G. Jeong, Cultivated ginseng inhibits 2,4-dinitrochlorobenzene-induced atopic dermatitis-like skin lesions in NC/Nga mice and TNF-α/IFN-γ-induced TARC activation in HaCaT cells, Food Chem. Toxicol., 2013, 56, 195–203 CrossRef CAS PubMed
.
- J. M. Hanifin, M. Thurston, M. Omoto, R. Cherill, S. J. Tofte and M. Graeber, The eczema area and severity index (EASI): assessment of reliability in atopic dermatitis, Exp. Dermatol., 2001, 10(1), 11–18 CrossRef CAS PubMed
.
- A. Hou, G. Quan, B. Yang, C. Lu, M. Chen, D. Yang, L. Wang, H. Liu, X. Pan and C. Wu, Rational design of rapidly separating dissolving microneedles for precise drug delivery by balancing the mechanical performance and disintegration rate, Adv. Healthcare Mater., 2019, 8, 1900898 CrossRef CAS PubMed
.
- E. Larrañeta, R. E. M. Lutton, A. D. Woolfson and R. F. Donnelly, Microneedle arrays as transdermal and intradermal drug delivery systems: Materials science, manufacture and commercial development, Mater. Sci. Eng., R, 2016, 104, 1–32 CrossRef
.
- M. C. Chen, S. F. Huang, K. Y. Lai and M. H. Ling, Fully embeddable chitosan microneedles as a sustained release depot for intradermal vaccination, Biomaterials, 2013, 34(12), 3077–3086 CrossRef CAS PubMed
.
- C. Wischke and S. P. Schwendeman, Principles of encapsulating hydrophobic drugs in PLA/PLGA microparticles, Int. J. Pharm., 2008, 364(2), 298–327 CrossRef CAS PubMed
.
- H. Wang, G. Zhang, H. Sui, Y. Liu, K. Park and W. Wang, Comparative studies on the properties of glycyrrhetinic acid-loaded PLGA microparticles prepared by emulsion and template methods, Int. J. Pharm., 2015, 496(2), 723–731 CrossRef CAS PubMed
.
- T. H. Kim and T. G. Park, Critical effect of freezing/freeze-drying on sustained release of FITC-dextran encapsulated within PLGA microspheres, Int. J. Pharm., 2004, 271(1–2), 207–214 CrossRef CAS PubMed
.
- M. Jang, B. M. Kang, H. Yang, J. Ohn, O. Kwon and H. Jung, High-dose steroid dissolving microneedle for relieving atopic dermatitis, Adv. Healthcare Mater., 2021, 10, 2001691 CrossRef CAS PubMed
.
- F. M. S. Badloe, S. De Vriese, K. Coolens, C. B. Schmidt-Weber, J. Ring, J. Gutermuth and I. Kortekaas Krohn, IgE autoantibodies and autoreactive T cells and their role in children and adults with atopic dermatitis, Clin. Transl. Allergy, 2020, 10(1), 34 CrossRef CAS PubMed
.
- L. C. T. soi, E. Rodriguez, D. Stölzl, U. Wehkamp, J. Sun, S. Gerdes, M. K. Sarkar, M. Hübenthal, C. Zeng, R. Uppala, X. Xing, F. Thielking, A. C. Billi, W. R. Swindell, A. Shefler, J. Chen, M. T. Patrick, P. W. Harms, J. M. Kahlenberg, B. E. Perez White, E. Maverakis, J. E. Gudjonsson and S. Weidinger, Progression of acute-to-chronic atopic dermatitis is associated with quantitative rather than qualitative changes in cytokine responses, J. Allergy Clin. Immunol., 2020, 145(5), 1406–1415 CrossRef PubMed
.
- S. Weidinger and N. Novak, Atopic dermatitis, Lancet, 2016, 387(10023), 1109–1122 CrossRef PubMed
.
- T. Biedermann, Y. Skabytska, S. Kaesler and T. Volz, Regulation of T Cell Immunity in Atopic Dermatitis by Microbes: The Yin and Yang of Cutaneous Inflammation, Front. Immunol., 2015, 6, 353 Search PubMed
.
- H. J. An, J. Y. Kim, W. H. Kim, M. G. Gwon, H. M. Gu, M. J. Jeon, S. M. Han, S. C. Pak, C. K. Lee, I. S. Park and K. K. Park, Therapeutic effects of bee venom and its major component, melittin, on atopic dermatitis in vivo and in vitro, Br. J. Pharmacol., 2018, 175(23), 4310–4324 CrossRef CAS PubMed
.
- H. Kanoh, A. Ishitsuka, E. Fujine, S. Matsuhaba, M. Nakamura, H. Ito, N. Inagaki, Y. Banno and M. Seishima, IFN-γ reduces epidermal barrier function by affecting fatty acid composition of ceramide in a mouse atopic dermatitis model, J. Immunol. Res., 2019, 2019, 3030268 Search PubMed
.
- S. Dudonné, X. Vitrac, P. Coutière, M. Woillez and J. M. Mérillon, Comparative study of antioxidant properties and total phenolic content of 30 plant extracts of industrial interest using DPPH, ABTS, FRAP, SOD, and ORAC assays, J. Agric. Food Chem., 2009, 57(5), 1768–1774 CrossRef PubMed
.
- A. Blauvelt, M. de Bruin-Weller, M. Gooderham, J. C. Cather, J. Weisman, D. Pariser, E. L. Simpson, K. A. Papp, H. C. Hong, D. Rubel, P. Foley, E. Prens, C. E. M. Griffiths, T. Etoh, P. H. Pinto, R. M. Pujol, J. C. Szepietowski, K. Ettler, L. Kemény, X. Zhu, B. Akinlade, T. Hultsch, V. Mastey, A. Gadkari, L. Eckert, N. Amin, N. M. H. Graham, G. Pirozzi, N. Stahl, G. D. Yancopoulos and B. Shumel, Long-term management of moderate-to-severe atopic dermatitis with dupilumab and concomitant topical corticosteroids (LIBERTY AD CHRONOS): a 1-year, randomised, double-blinded, placebo-controlled, phase 3 trial, Lancet, 2017, 389(10086), 2287–2303 CrossRef CAS PubMed
.
Footnote |
| † Electronic supplementary information (ESI) available: Two types of stainless steel master structures (Fig. S1) used to make inverse PDMS molds for preparing the double-layered MNs; detailed AD induction protocols (Fig. S2) for Nc/Nga mice; transepidermal water loss (TEWL) from the mouse skin after MN application (Fig. S3); free radical-scavenging activity of GA/AA in the HA layer and CUR in the PLGA tip before and after storage at 25 °C for 4 weeks (Fig. S4); body weight changes of Nc/Nga mice during induction and treatment periods (Fig. S5). See DOI: https://doi.org/10.1039/d3bm00182b |
| This journal is © The Royal Society of Chemistry 2023 |

