 Open Access Article
Creative Commons Attribution 3.0 Unported Licence
Leveraging machine learning to consolidate the diversity in experimental results of perovskite solar cells†
Wahid Hussain a,
Samina Sawarb and
Muhammad Sultan
 *c
*c
aDepartment of Physics, Quaid-i-Azam University, 45320, Islamabad, Pakistan. E-mail: wahidhussaiin@gmail.com
bDepartment of Plant Sciences, Quaid-i-Azam University, 45320, Islamabad, Pakistan
cDepartment of Physics, Kohsar University Murree, 47150, Punjab, Pakistan. E-mail: muhammad.sultan@kum.edu.pk
First published on 25th July 2023
Abstract
Perovskite solar cells offer great potential for smart energy applications due to their flexibility and solution processability. However, the use of solution-based techniques has resulted in significant variations in device fabrication, leading to inconsistent results on the same composition. Machine learning (ML) and data science offer a potential solution to these challenges by enabling the automated design of perovskite solar cells. In this study, we leveraged machine learning tools to predict the band gap of hybrid organic–inorganic perovskites (HOIPs) and the power conversion efficiency of their solar cell devices. By analyzing 42![[thin space (1/6-em)]](https://www.rsc.org/images/entities/char_2009.gif) 000 experimental datasets, we developed ML models for perovskite device design through a two-step predicting method, enabling the automation of perovskite materials development and device optimization. Additionally, band gap dependence of device parameters from experimental data is also validated, as predicted by the Shockley–Queisser model. This work has the potential to streamline the development of perovskite solar cells (PSCs) and optimize their performance without relying on time-consuming trial-and-error approaches.
000 experimental datasets, we developed ML models for perovskite device design through a two-step predicting method, enabling the automation of perovskite materials development and device optimization. Additionally, band gap dependence of device parameters from experimental data is also validated, as predicted by the Shockley–Queisser model. This work has the potential to streamline the development of perovskite solar cells (PSCs) and optimize their performance without relying on time-consuming trial-and-error approaches.
1 Introduction
Fossil based energy sources are declining along with their destructive environmental impacts. Solar cells are considered one of most sustainable sources of clean energy. The solar cells market is dominated by silicon (Si), which has reached an efficiency of 26% for single crystal solar cells and 22% for poly-crystal solar cells.1 Although the price of Si has declined substantially in recent years, this technology still has a minor share in the overall energy market. Purification chemistry, high-temperature processing, and advanced manufacturing techniques, present significant challenges for Si solar cells.2Secondly, contemporary smart applications require solar cell to be flexible, having absorber layer capable of harvesting selective part of light spectrum. Therefore, scientific community is investigating for next generation solar cells such as organic, dye-sensitized, and PSCs. The PSCs have demonstrated the rapid growth in power conversion efficiency (PCE), increasing from 3.2% in 2009 to 25.2%3 in 2021 over a 12 year period.
A variety of materials have been investigated for various types of layers in PSCs, including electrodes, electron-transport layer (ETL), hole-transport layer (HTL), and perovskites. For fabrication of PSCs one-step deposition, two-step deposition, and other synthesis procedures have also been developed and reported earlier.4 There is no other solar cell technology that enables excellent device performance while still being affordable, efficient, and flexible. Stability is still the main hindrance to the commercialization of these solar cells. In addition, other issues have also been examined such as device hysteresis, toxicity, and reproducibility.5 Significant technical and basic research efforts are being undertaken to address these issues. Numerous experimental studies have reported the mitigation of consequences caused by degradation. However, there remains a significant gap in prediction methods that can effectively guide the synthesis process. Furthermore, researchers have generated extensive amounts of experimental and simulation data to address various device problems, thereby laying the foundation for utilization of data-driven approaches in development and optimization.
With the advent of artificial intelligence (AI) and machine learning (branch of AI), remarkable progress has been made in materials science since the Materials Genome Initiative (MGI) by USA.6 To better understand the physics underlying the properties of materials and find ways to enhance them, materials scientists are constantly striving to develop tools and approaches. The trial-and-error techniques for material synthesis and characterization are time and money-consuming.7 Machine learning has been extensively used in all the domains of materials science such as superconductors,8 magnetic materials,9 crystal system prediction and design,10 and last but not the least, the materials for solar cells such as organic solar cells11 and perovskite solar cells.12
Recent advancements in perovskite solar cells have led to the introduction of ML in PSCs. Simultaneously, there has been a notable increase in publications on the use of machine learning for perovskites,13 with expanding applications across different avenues.14 In one study Andreas et al.15 used fingerprinting descriptors to estimate the efficiency of organic solar cells and discovered a mean absolute error of 0.07. Also Yuta et al.16 predict the PCE of organic solar cells using physical and fingerprinting descriptor. Fingerprinting descriptors, also known as molecular descriptors, are numerical representations of chemical compounds or molecules. For perovskite solar cells performance, Cagla et al.17 performed machine learning using various descriptors (HTL, ETL, additives, annealing time, and temperature, etc.) to see the trends in the research data by performing statistical analysis. In a recent study Jinxin et al.18 used composition of materials, band gap, and the energy difference between VBM and CBM were employed to perform predictive analysis for device efficiency and band gap. However, due to the complexity of how device performance depends on several physical properties and other factors, it is difficult for machine learning to predict the efficiency of devices.
To achieve efficient application of ML in the development and autonomous prediction of device performance, without relying on experimental and computational methodologies, substantial work is essential in terms of descriptors, quality, and quantity of data. Although the machine learning models developed by Jinxin aimed to predict PCE based on the energy differences of layers such as VBM and CBM levels, they did not include the corresponding layers such as HTL and ETL. As different HTL and ETL have been used with the same energy differences in various devices and led to different results. Therefore, it is important to include those layers in the descriptors to establish a meaningful relationship between the device structure and its PCE. For the first time, we use this technique of integrating device layers to develop ML models for perovskite solar cells. This communication aims to bridge the gap between device design and automation by using the rational strategy in choosing the descriptors. According to FIAR data principle19 the descriptor must be useful, applicable to all situations, reproducible, and easily accessible.
2 Methods
In this work we analyzed the perovskite database and exhibit the key insights. We prepare a sub-data by using the extracted knowledge from the database and leverage machine learning techniques to develop various models such as Linear Regression (LR), Ridge regression (RR) k-nearest neighbors (KNN), random forest (RF), and XGBoost. An autonomous two-step predicting method for selection of perovskites and other device layers is proposed for optimization and development of new PSCs by predicting the band gap, PCE, and other device parameters including FF, Voc, and Jsc.These models utilize descriptors such as absorber material composition, band gap, device stack layers (electron transport layer, hole transport layer, substrate layer, back-contact), device architecture (nip, pin), and device area to predict and design PSCs. Unlike other ML approaches for predicting and designing PSCs, these models eliminate the need for prior calculations or experimentation for descriptors values. Instead, one simply needs to select the desired stoichiometry ratio of perovskite composition for perovskite absorber layer to achieve a suitable band gap. Additionally, models for device parameters prediction will assist in determining the appropriate device layers (HTL, ETL), for optimal device design.
In the Perovskite Database Project, Jesper and Eva20 collated a database of about 42![[thin space (1/6-em)]](https://www.rsc.org/images/entities/char_2009.gif) 000 data samples containing perovskite devices that have been explored and studied in the literature. However, the whole data in the database is very scattered and therefore could not be able to utilize in data-driven approaches. Therefore data cleaning and data wrangling were needed to perform in order to make complex data into a refined form so that it can be utilized in ML approaches.
000 data samples containing perovskite devices that have been explored and studied in the literature. However, the whole data in the database is very scattered and therefore could not be able to utilize in data-driven approaches. Therefore data cleaning and data wrangling were needed to perform in order to make complex data into a refined form so that it can be utilized in ML approaches.
Fig. 1(a) indicates the device data of different perovskites with their count. The dataset includes devices with varying stoichiometry compositions of mixed cations and anions at each site (A, B, X) of the ABX3 perovskite structure. Most of the device data have duplicated samples with different outcomes such as MAPbI3 has almost 29![[thin space (1/6-em)]](https://www.rsc.org/images/entities/char_2009.gif) 000 device data. It has gained significant attention in research due to being one of the first perovskite materials studied for its potential application as a photovoltaic absorber. However, there are merely a few numbers of reports using MAPbI3 with an efficiency of more than 20%. Despite extensive work on MAPbI3, it has fatal shortcomings such as low stability and toxicity due to moisture sensitivity with volatile nature, and lead (Pb) respectively.21,22
000 device data. It has gained significant attention in research due to being one of the first perovskite materials studied for its potential application as a photovoltaic absorber. However, there are merely a few numbers of reports using MAPbI3 with an efficiency of more than 20%. Despite extensive work on MAPbI3, it has fatal shortcomings such as low stability and toxicity due to moisture sensitivity with volatile nature, and lead (Pb) respectively.21,22
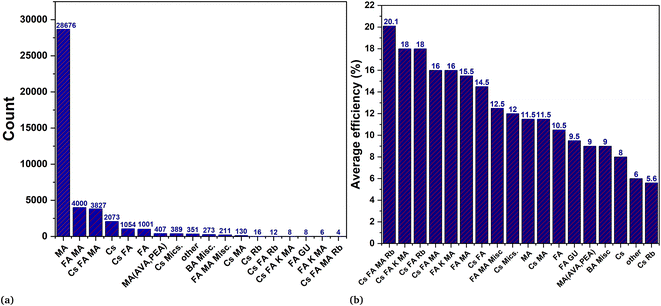 | ||
| Fig. 1 Perovskite database analysis. In figure (a) the count of respective perovskite is mentioned while figure (b) represent the average accuracy of different perovskite in descending order. | ||
Similarly, other most widely used single cation perovskites as shown in the count plot such as FA, Cs also exhibit phase stability issues at room temperature.23,24 In order to overcome these problems, the mixing of cations and halides has been an essential topic for researchers. Combinations of various monovalent cations at A-site (MA, FA, Cs, Rb, K) with divalent metal cations at B-site (Pb, Sn, Bi, Sb) and anions at X-site (Br, I, Cl) of ABX3 perovskite structure have been analyzed. These analyses are done by considering the sizes of the cations and anions with tolerance factor (t) which is empirically use to estimate the perovskite crystal structure.25
 | (1) |
Fig. 1(b) highlights the importance of mixing cation and halides on the PCE of the device. It is evident that quadruple cation and triple cation are outperforming others followed by double cation in terms of overall performance and efficiency. Cs, MA, and FA based perovskites are only examples of single-cation perovskites that exhibit a black phase and high PCE. However, it should be noted that their pristine structures are inherently unstable. Also, Rb being near to the optimal t value, can be incorporated into the feasible perovskite structure by employing the mixing of different cations.27,28 In contrast to the pure form of MA and FA perovskites, the mixing strategy of the double cation (MA, FA) elucidates that adding a modest amount of MA to the mixture, results in the best crystallization with an induced photoactive black phase.29 In the same way mixing of cations (Cs, Fa) induced photo and moisture stability along with photovoltaic performance.30,31 The inclusion of small cations such as Cs or Rb suppresses the halide segregation and causes the wide band gap perovskite for tandem solar application.32
The triple cations perovskites (MAFACsPb(I/Br)3) as indicated in the count Fig. 1(a) have been conveniently studied among all the potential combinations of various materials at various sites. These triple cation perovskites were created in order to enhance crystal quality, stability, reproducibility (mainly ignored), and efficiency.33 These investigations also pave the way for the inclusion of Rb, K, and Na as a fourth cation, leading to the formation of quadruple cation perovskites. According to Fig. 1(b), the quadruple cations (Cs, K, FA, MA) device recorded the highest average PCE.
3 Data preparation
As the machine learning approaches mainly depend on the quality and quantity of data therefore data should be free from sparsity and duplicates in order to develop generalizable machine learning models. The selected perovskites for the dataset are shown in the matrix Fig. 2. The yellow and blue boxes indicate extensively studied Pb and Sn based perovskites particularly triple cation perovskite due to their suitability of optoelectronic properties. Also, within yellow boxes, double and triple cation perovskites contain mixed ratio of Pb and Sn. The red ones are comparatively less investigated. The blank or white boxes show that these materials were never studied or least studied.The data also contains duplicated samples, therefore need to be removed and only one point can be considered otherwise duplicates samples tend to bias the machine learning models.34 The data in the database for perovskite characteristics and features inherently lack homogeneity. With this approach, it is impossible to gain insights into issues such as why perovskites with a single or a group of similar material qualities have varied electrical or optical properties.35
Constructing a model using this data would present a formidable challenge. Because inclusion of all perovskite absorber materials and device layer materials, even after eliminating duplicate samples, would result in an immense feature space. Such a vast number of features could potentially lead to the curse of dimensionality,36 further complicating the modeling process.
A thorough investigation and analysis is done to select the data with distinct and mostly investigated perovskite materials along with the most frequent device layers (electron transport layer, hole transport layer, backcontact layer, substrate layer). We use one-hot encoding method for the descriptors of all the device layers. This encoding method assigns a value of 1 to indicate the presence of a layer and 0 to indicate its absence. For the perovskite absorber layer we use compositional (A = Cs, FA, MA; B = Pb, Sn; X = Br, I, Cl) descriptors which represent the stoichiometry ratio of these materials.
4 Data insights
In Fig. 3 the statistics of device parameters (613 samples) is represented after the post processing of the original data (42![[thin space (1/6-em)]](https://www.rsc.org/images/entities/char_2009.gif) 300 samples) and summarized the insights of our data. These insights confirm that the extracted data aligns with both experimental and theoretical trends, exhibiting no outliers. This ensures the data quality and makes it suitable for the development of models.
300 samples) and summarized the insights of our data. These insights confirm that the extracted data aligns with both experimental and theoretical trends, exhibiting no outliers. This ensures the data quality and makes it suitable for the development of models.
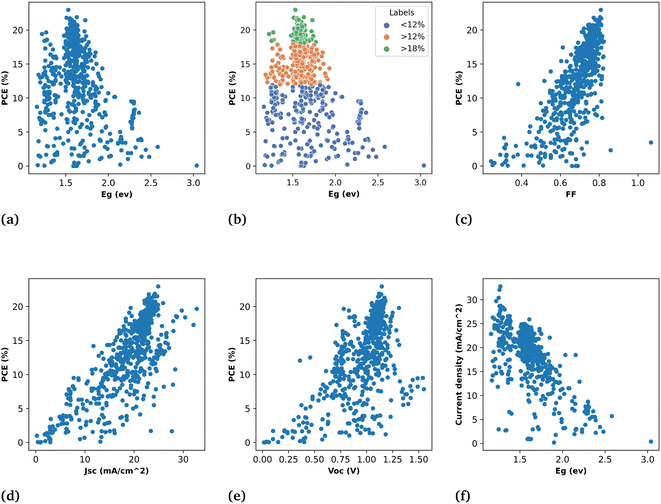
Fig. 3(a) is plotted against PCE and band gap of the perovskite materials. As it is shown that the most high-efficiency devices belong to the band gap values near to or equal to 1.51 eV which is the optimal value of band gap for perovskites. In Fig. 3(b) we exhibit the plot of PCE against band gap with efficiency labels where green dots represent the devices with efficiency >18% while blue dot represents devices with efficiency <12% and so on.
The power conversion efficiency of a solar cell device is obtained from the following expression.
 | (2) |
The FF in Fig. 3(c) shows a linear relationship with PCE from 0.4–0.81 but the colinearity between PCE and Jsc is more prominent compared to FF. The cell width has also demonstrated that fill factor and short-circuit current density are engage in a trade-off with each other. If the cell width is too small it will have less Jsc due to the small area on the other hand if the cell width is too large the resistance in the cell will diminish the FF. Therefore, the cell area plays a pivotal role in PCE.
In order to see the relationship between device parameters and perovskite properties, a Jsc plot is drawn against the band gap of perovskites in Fig. 3(f). As can be seen from the trend of the plot the increase in current density with the decrease in band gap is consistent with the expectations. The narrow band gap materials can absorb the longer wavelength of the infrared region of the solar spectrum and more energy can be harvested from the sun. Before applying ML approaches, it is crucial to analyze the data. We remove all the incorrect data points and outliers to develop the effective models.
5 Results and discussion
5.1 Band gap prediction
For the band gap prediction, we choose Cs, MA, and FA as A-site cations, Sn, and Pb as B-site cations, and Br, Cl, and I as X-site anions of the ABX3 structure of the perovskite. The different stoichiometry mixing compositions of these materials at each site is taken as input variables for the different machine learning models and band gap as the output of the corresponding perovskite. It spans almost all the possible stoichiometry concentrations of the single, double, and triple cations perovskite. This will allow us to design the optimal perovskite absorber layer with desired band gap by selecting the required stoichiometry composition. Our most ML model results resonate with the theoretically established consensus on tuning the band gap by either mixing halogen or divalent B-site metallic cations. As shown in Fig. 4(a) and (b) that the models gave the least importance to organic–inorganic cations and exhibit more dependence on halogens and B-site metallic cations for band gap prediction.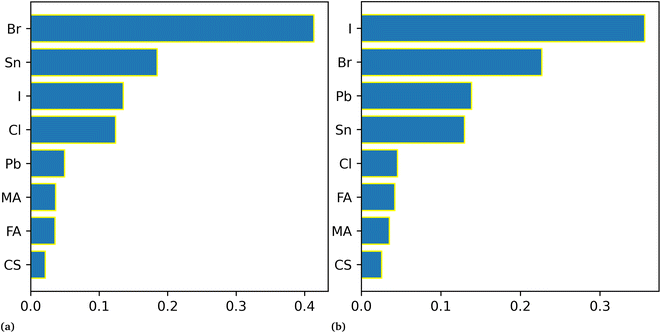 | ||
| Fig. 4 Impact of different materials on band gap prediction. (a) is for the RR model and (b) is for RF. | ||
5.2 Device parameters prediction
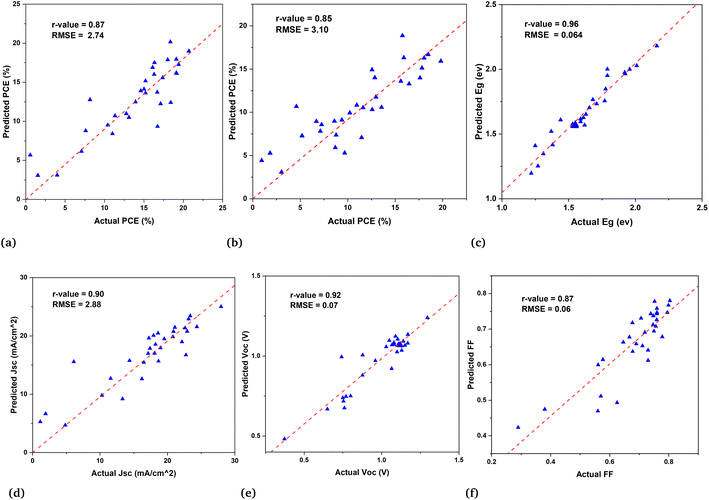
In the second subset of data the models are built to predict the PCE of PSCs along with predictions of other parameters such as current density (Jsc), fill factor (FF), and open circuit voltage (Voc). These models for device parameter prediction will help us in screening the optimal HTL and ETL. As eqn (2) shows that PCE is obtained from these parameters. Therefore, we predict the PCE directly using ML models and also calculated the PCE from the ML predicted values of Jsc, FF, and Voc in order to see the ML model's ability to generalize for various outcomes with the same input descriptors. This finding suggests that the curated data and extracted descriptors we used for ML are more accurate in representing the underlying patterns. The results of both approaches are given in Table 1. It shows that the machine learning result for both approaches is quite similar for RF and XGBoost models. Fig. 5 is a demonstration of the fact that our models were able to learn the patterns in the data and indicate their reliability to predict PCE instantly and efficiently.| Models | Band gap prediction | PCE direct prediction | PCE calculated from predicted Jsc, Voc, FF values | |||
|---|---|---|---|---|---|---|
| r-Value | RMSE (eV) | r-Value | RMSE (%) | r-Value | RMSE (%) | |
| LR | 0.80 | 0.155 | 0.77 | 3.5 | 0.58 | 5.18 |
| RR | 0.93 | 0.087 | 0.82 | 3.5 | 0.76 | 3.38 |
| KNN | 0.91 | 0.099 | 0.84 | 3.43 | 0.67 | 4.09 |
| RF | 0.94 | 0.068 | 0.86 | 2.92 | 0.83 | 3.35 |
| XGBoost | 0.96 | 0.064 | 0.88 | 2.41 | 0.85 | 3.01 |
Among 692 data samples, there are duplicates and sparse samples which we filter out to ensure the quality of data. Even though removing the duplicates causes the data to shrink to 613 samples but still the results of machine learning models have proven to be very efficient for predicting high-efficiency devices. The direct PCE prediction from the input data is shown in Fig. 5(a) and demonstrates a remarkably well match between actual PCE and predicted PCE. Despite the fact as mentioned above and also in Fig. 3(b) very few devices included in the data has PCE > 18% still it predict well with high precision almost all the devices having efficiency >18%.
The Pearson correlation matrix between input variables is shown in Fig. 1 of ESI.† The matrix gives the linear correlation between variables. More positive value mean strong positive correlation while more negative value means strong negative correlation. Also for evaluation of random forest model the SHAP value plot is given in Fig. 2 of ESI.† The plot quantifies how different features affect the model output in prediction. Figure shows that band gap is the most important feature for the PCE prediction which is well established in experiment and theory and shows the power of machine learning approach.
5.3 Autonomous layers design strategies
The autonomous perovskite solar cell device design is proposed and adopted by employing two-step prediction method. In the first step band gap prediction will help in the design of perovskite absorber layer of new PSCs. The ML model for band gap prediction will give the suitable stoichiometry composition of different materials for perovskites absorber layer.In the second step, the prediction of PCE, combined with the design of the perovskite absorber layer in the first step, aids in the screening of ETLs and HTLs. This approach eliminates the need for prior experimental or simulation values for the descriptors of these models. As a result, this method automates the design of these layers and eliminates the need for time-consuming and resource-intensive methods.
The tunable band gap is one of the important characteristics of the perovskites which can be done either by mixing of B-site metallic cations or halogens. This property makes perovskites suitable for a plethora of applications such as tandem solar cells,37–39 light emitting devices,40 laser,41 photodetector,42 and X-ray or particle detection.43 Because optoelectronic properties primarily depends on the band gap of the absorber material and PSCs require an ideal and suitable perovskite compound as an absorber. Therefore, band gap prediction is essential in the first step.
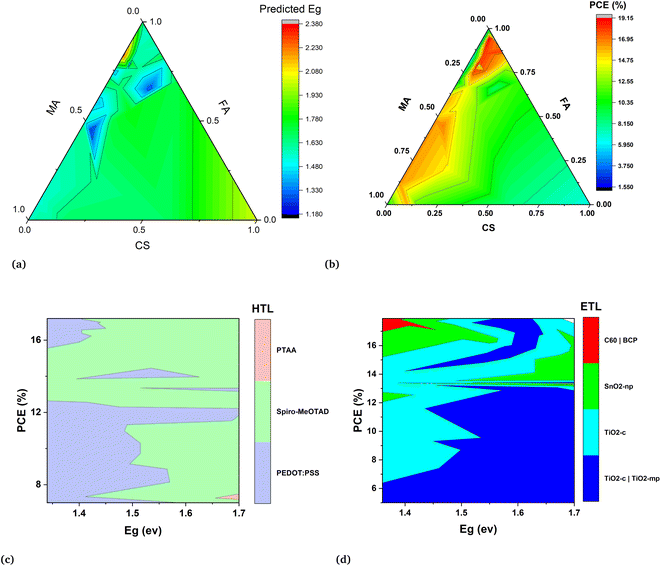
The results of the band gap prediction, as depicted in Fig. 6(a), indicate that perovskites falling within the red region of the contour are chloride-based or bromide-based perovskites. These findings align well with established experimental results. The highest band gap value is given by the chloride-based perovskite such as CsPbCl3 has Eg = 3.04. Similarly, as we increase the bromine content in the perovskite compound the band gap will increase accordingly.44 Another important point is captured by the ML prediction of the band gap values that the Sn-based perovskites have low band gap values which are shown in the blue area of the contour. As we know from previous studies band gap tuning can also be possible by mixing Pb and Sn with increased content of Sn leads to a low band gap.45 Although, A-site cations do not directly affect the band gap nature, understanding their shape, radius, and charge distribution is crucial for optimizing the overall performance of the perovskite layer in the device. This trend is also evident in machine learning predicted results.
In Fig. 6(b) the high efficiency devices are represented by the red region of contour. It shows us that these solution base devices correspond to a high mixing ratio of FA cation and small mixing of cesium cation with a range of mixing ratios of MA cation. All the red region devices are obtained by keeping the Pb = 1 and iodine as halogen with no or small mixing of bromine which resonates with the experimental studies so far. They indicate that for a more reliable device the more suitable perovskite compound should have less content of bromine and MA due to blue penalty and stability issues respectively. The low PCE of the devices in the blue region of the contour are single cations devices based on single cations either Cs, MA, or FA. Most of them have no or less iodine content which means they are mostly bromide-based single cation devices.
In the second step ETLs, and HTLs are screened out by predicting the PCE and other parameters of devices such as Jsc, Voc, and FF. The hole transport and electron transport layer play a pivotal role in optimizing the perovskite devices by reducing the surface recombination at each interface of the absorber layer. The three hole transport layers such as PTAA, PEDOT:PSS and spiro-MeOTAD are screened for the models development and these layers are also widely studied in perovskites devices. The contour in Fig. 6(c) is obtained for the optimal range (1.3–1.7 eV) of the band gap suggested in the theory for optoelectronic properties. It can be seen that PEDOT:PSS is best for low band gap perovskites while spiro-MeOTAD is optimal for band gap values >1.46 eV. The electron transport layers (ETLs) are also evaluated and their relationship with the absorber layer through the band gap is determined to optimize perovskite devices. The selection of ETL depends on the desired band gap of the perovskite material. As we know, the most optimized band gap for perovskites is 1.51 eV and TiO2-c—TiO2-mp is the ETL that has been extensively used for these devices and further confirmed by the model prediction.
5.4 Comparison of ML prediction with theory
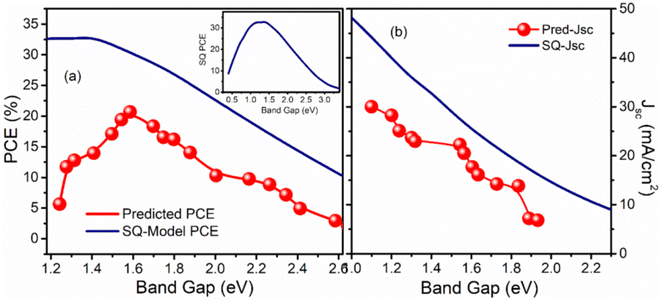
The maximum PCE of a single junction solar cell is limited by the Shockley–Queisser (S–Q) limit. A curve comparing band gap and PCE is generated in Fig. 7(a) to validate the machine learning model against the theoretical curve proposed by Shockley and Queisser.46 The ML model successfully captured the trend proposed by Shockley and Queisser in their theory.47 However, the maximum PCE and its corresponding band gap in the model do not precisely align with the theory due to practical solar cell limitations caused by non-radiative losses. Shockley and Queisser's theory is reliant on a number of assumptions, one of which is that the only type of recombination that occurs in solar cells is radiative recombination, which depicts the ideal condition of the solar cell. In real-case scenarios, solar cells have many non-radiative recombination mechanisms which causes less practical maximum PCE contrary to the proposed maximum PCE in theory.Auger recombination, Shockley–Read–Hall (SRH) recombination, and surface recombination48 are the three major non-radiative recombinations. Auger recombination49 is exist even in pure semiconductors mainly in indirect semiconductors where radiative recombination of electrons and holes requires larger momentum which cannot be provided by the emitted photon. Alternatively, the momentum along with energy is given to the other electron in the conduction band which leads it to an even more high energy state. This mechanism gains significance with an increased charge carrier density, which is less common in perovskites under illumination. However, it can restrict the performance of PSCs when exposed to concentrated light. The SRH recombination takes place due to the trap states caused by defects.50 There are various origins of these defects such as imperfect crystal, impurities in the crystal, grain boundaries, etc.
It should also be noted that the highest efficiency devices in the dataset have a band gap from 1.5 eV to 1.6 eV which might indicate the fact that perovskites devices are optimized in this range of band gap and are not fully optimized in the low band gap range suggested by the theory. This might be the reason to give the peak value at 1.51 eV by the machine learning model instead of the theoretical value of 1.3 eV.
Further, the comparison of predicted short circuit current density with the theoretical values is also displaced by the curve in Fig. 7(b) which quite astonishingly matches the trend as well as the maximum of the current density curve despite including all the non-radiative recombination. From the machine learning model results, we can argue that the recombination mechanism has little effect on current density as compared to Voc which then causes the reduction of the PCE. From the S–Q theory, we know that when we increase the band gap current density decreases assuming that there is no non-radiative recombination.
6 Conclusion
We analyzed the perovskite database in order to see the trend in data for high-efficiency perovskite solar cell devices. We concluded that the most efficient and stable devices are based on triple and quadruple cations perovskites. One of the major concerns of reproducibility from the commercialization point of view is seemed to be resolved by these devices. In particular, triple-cation HOIPs are structurally less complex compared to quadruple-cations perovskite solar cells. We established a dataset based on these devices and analyzed to validate its insights for the data quality and integrity. We screened out the unique 696 materials among 42![[thin space (1/6-em)]](https://www.rsc.org/images/entities/char_2009.gif) 300 for perovskite band gap prediction and 613 for the PCE prediction.
300 for perovskite band gap prediction and 613 for the PCE prediction.
An autonomous two-step predicting method is proposed, aiming to streamline the design process of new PSCs. This method eliminates the need for extensive experimental and simulation work, effectively reducing the time-consuming and resource-intensive aspects of PSCs design. Our work for the first time paves the way to automate the process of design and fabrication. This work is indeed endorsing the power of machine learning for the development and optimization of high-efficiency devices, otherwise it is practically impossible to analyze such vast information except through trial and error which causes high cost and slow development.
Author contributions
WH – conceptualization, methodology, validation, investigation, data curation, formal analysis, software, visualization, writing–original draft, writing – review & editing; SS – formal analysis, software, visualization; MS – conceptualization, resources, visualization, supervision.Conflicts of interest
The authors declare no competing interests.Acknowledgements
The creation of an open access database of perovskite solar cells was an effort led by Jasper and Eva at HBZ, which the authors recognize. We also thank Jesper Jacobson for assisting in understanding the terminology used inside the database in the initial stage of the project.References
- J. Liu, Appl. Phys., 2018, 51, 123001 Search PubMed.
- S. Maldonado, ACS Energy Lett., 2020, 5, 3628–3632 CrossRef CAS.
- P. Roy, R. Ghosh and K. Barclay, Coatings, 2022, 12, 1089 CrossRef CAS.
- M. Firdaus, et al., Opt. Mater., 2021, 118, 111288 CrossRef.
- A. Djurišić, et al., Prog. Quantum Electron., 2017, 53, 1–37 CrossRef.
- Z. Liu, Chin. Sci. Bull., 2014, 59, 1619–1623 CrossRef.
- A. Agrawal and A. Choudhary, APL Mater., 2016, 4, 053208 CrossRef.
- Z. L. Liu, et al., APL Mater., 2020, 8, 061104 CrossRef CAS.
- G. Katsikas, et al., Phys. Status Solidi B, 2021, 258, 2000600 CrossRef CAS.
- Y. Suzuki, et al., Sci. Rep., 2020, 10, 21790 CrossRef CAS PubMed.
- M. Asif, et al., Energy Environ. Sci., 2021, 14, 90–105 RSC.
- Y. Liu, et al., Adv. Funct. Mater., 2023, 33, 2214271 CrossRef CAS.
- B. Yılmaz and R. Yıldırım, Nano Energy, 2020, 105546 Search PubMed.
- P. Ghanshyam, Comput. Mater. Sci., 2021, 193, 110360 CrossRef.
- A. Eibeck, et al., ACS Omega, 2021, 6, 2376423775 CrossRef PubMed.
- Y. Miyake and A. Saeki, J. Phys. Chem. Lett., 2021, 12, 1239112401 Search PubMed.
- C. Odabası and R. Yıldırım, Nano Energy, 2019, 56, 770–791 CrossRef.
- J. Li, B. Pradhan, S. Gaur and J. Thomas, Adv. Energy Mater., 2019, 1901891 CrossRef CAS.
- M. D. Wilkinson, M. Dumontier and M. Aalbersberg, Sci. Data, 2016, 3, 160018 CrossRef PubMed.
- J. Jacobson and E. Unger, Nat. Energy, 2021, 107–115 CrossRef.
- J. Zhuang and J. Wang, Nano-Micro Lett., 2023, 15, 84 CrossRef CAS.
- M. Ren, X. Qian, Y. Chen, T. Wang and Y. Zhao, J. Hazard. Mater., 2022, 426, 127848 CrossRef CAS PubMed.
- H. Zhao and L. Zhao, et al., Crystals, 2022, 12, 573 CrossRef CAS.
- N. A. N. Ouedraogo, Y. Chen, Y. Y. Xiao, Q. Meng, C. B. Han, H. Yan and Y. Zhang, Nano Energy, 2020, 67, 104249 CrossRef CAS.
- V. Goldschmidt, D. G. der Krystallochemie, Naturwissenschaften, 1926, 14, 477–485 CrossRef CAS.
- Z. Li, M. Yang, J.-S. Park, S.-H. Wei, J. J. Berry and K. Zhu, Chem. Mater., 2016, 28, 284–292 CrossRef CAS.
- P. Yadav, M. I. Dar, N. Arora, E. A. Alharbi, F. Giordano and S. M. Zakeeruddin, Adv. Mater., 2017, 29, 1701077 CrossRef PubMed.
- M. Saliba, T. Matsui, K. Domanski, J.-Y. Seo, A. Ummadisingu and S. M. Zakeeruddin, Science, 2016, 354, 206–209 CrossRef CAS PubMed.
- L. K. Ono and E. Juarez-Perez, ACS Appl. Mater. Interfaces, 2017, 9, 30197–30246 CrossRef CAS PubMed.
- J. Lee, D. Kim, H. Kim, S. Seo, S. Cho and N. Park, Adv. Energy Mater., 2015, 5, 1501310 CrossRef.
- S. Maniyarasu, J. C.-R. Ke, B. F. Spencer, A. S. Walton and A. Thomas, ACS Appl. Mater. Interfaces, 2021, 13, 43573–43586 CrossRef CAS.
- D. P. McMeekin, G. Sadoughi, W. Rehman, G. E. Eperon, M. Saliba and M. T. Hörantner, Science, 2016, 351, 151–155 CrossRef CAS PubMed.
- M. Saliba, T. Matsui, J. Seo, K. Domanski, J. C. Baena and M. Nazeeruddin, Energy Environ. Sci., 2016, 9, 19891997 RSC.
- Y. Zhao, et al., ACM Trans. Softw. Eng. Methodol., 2021, 30, 1–38 Search PubMed.
- K. Goetz, et al., ACS Energy Lett., 2022, 7, 1750–1757 CrossRef CAS.
- R. Bellman, Science, 1966, 153, 34–37 CrossRef CAS PubMed.
- J. Werner, et al., Adv. Mater. Interfaces, 2017, 5, 1700731 CrossRef.
- C. Bailie and M. McGehee, MRS Bull., 2015, 40, 681–685 CrossRef CAS.
- B. Chen, X. Zheng, Y. Bai, N. P. Padture and J. Huang, Adv. Energy Mater., 2017, 7, 1602400 CrossRef.
- K. Lin and J. Xing, et al., Nature, 2018, 562, 245–248 CrossRef CAS PubMed.
- T. Khee, et al., J. Phys. D: Appl. Phys., 2021, 54, 143001 CrossRef.
- M. H. Tran, T. Park and J. Hur, ACS Appl. Mater. Interfaces, 2021, 13, 13372–13382 CrossRef CAS PubMed.
- F. Liu, R. Wu, Y. Zeng, J. Wei, H. Li, L. Manna and D. M. Aditya, Nanoscale, 2022, 14, 6743–6760 RSC.
- M. Martynow, D. Glowienka and J. Guthmuller, ACS Omega, 2020, 5, 26946–26953 CrossRef CAS PubMed.
- F. Hao, C. Stoumpos, R. P. H. Chang and M. Kanatzidis, J. Am. Chem. Soc., 2014, 136, 8094–8099 CrossRef CAS PubMed.
- T. Markvart, Energy Environ., 2022, 11, 430 Search PubMed.
- W. Shockley and H. J. Queisser, J. Appl. Phys., 1961, 32, 160 Search PubMed.
- D. Luo, R. Su, Q. G. Wei Zhang and R. Zhu, Nat. Rev. Mater., 2020, 5, 44–60 CrossRef CAS.
- J. Chantana, Y. Kawano, T. Nishimur and A. Mavlonov, Sol. Energy, 2021, 217, 342–353 CrossRef CAS.
- J. Chen and N.-G. Park, Adv. Mater., 2019, 31, 1803019 CrossRef CAS PubMed.
Footnote |
| † Electronic supplementary information (ESI) available: The perovskite database, curated data, and supporting figures. See DOI: https://doi.org/10.1039/d3ra02305b |
| This journal is © The Royal Society of Chemistry 2023 |


