 Open Access Article
A chiral fluorescent Ir(III) complex that targets the GPX4 and ErbB pathways to induce cellular ferroptosis†
Xinyang
Zhao‡
a,
Jingyi
Zhang‡
a,
Wei
Zhang
b,
Zijian
Guo
 a,
Wei
Wei
*b,
Xiuxiu
Wang
*a and
Jing
Zhao
 *a
*a
aState Key Laboratory of Coordination Chemistry, Chemistry and Biomedicine Innovation Center (ChemBIC), School of Chemistry and Chemical Engineering, Nanjing University, Nanjing, 210023, China. E-mail: wangxiuxiu@nju.edu.cn; jingzhao@nju.edu.cn
bState Key Laboratory of Pharmaceutical Biotechnology, School of Life Sciences, Nanjing University, Nanjing, 210023, China. E-mail: weiwei@nju.edu.cn
First published on 9th January 2023
Abstract
Ferroptosis has recently emerged as a non-apoptotic form of programmed cell death and promising target for anticancer treatment. However, it is challenging to discover ferroptosis inducers with both highly selective tumour targeting and low cytotoxicity to normal cells. Here, we report an Ir(III) complex, Ir1, that contains a novel chiral pyridine RAS-selective lethal ligand (Py-RSL). This complex effectively inhibits glutathione peroxidase 4 (GPX4) and ferroptosis suppressor protein 1 (FSP1) to induce ferroptosis in human fibrosarcoma (HT-1080) cells. Notably, metal coordination not only endows Ir1 with fluorescent properties for convenient cellular real-time tracking but also efficiently reduces the off-target toxicity of the Py-RSL ligand. Furthermore, label-free quantitative proteomic profiling revealed that Ir1 simultaneously inhibits the ErbB signalling pathway to enhance tumour suppression. Our work is the first to report a ferroptosis-inducing iridium complex with dual mechanisms of inhibition and provides a highly selective and efficient route to develop new ferroptosis-inducing metallodrugs.
Introduction
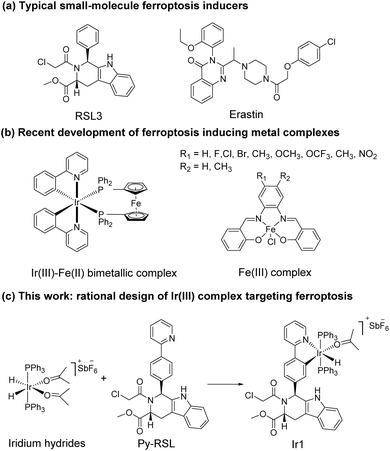
Ferroptosis was first proposed in 2012 as an iron-dependent form of regulated cell death caused by unrestricted lipid peroxidation (LPO) and increased reactive oxygen species (ROS).1–3 In the past decade, ferroptosis was shown to participate in neurodegenerative diseases,4–6 cardiovascular diseases,7 and especially cancer.8,9 Ferroptosis plays important roles in the occurrence, development, and metastasis of tumours, suggesting its great potential in the development of antitumor treatments.10–13 The reported ferroptosis inducers are mainly small organic molecules,14,15 such as RAS-selective lethal 3 (RSL3)16 and erastin (Scheme 1a).17,18 However, their off-target toxicity and short half-life restrict their further application in vivo for clinical cancer treatment. Thus, developing ferroptosis inducers with both highly selective tumour targeting and low cytotoxicity to normal cells is still challenging.In recent studies, various nanomaterials,19–22 metal–organic frameworks (MOFs),23–25 and metal complexes26–32 have been reported to be effective in inducing ferroptosis. Metal complexes, especially transition metal complexes, have been widely used in bioimaging and cancer treatment for their good optical properties, great diversity of tunable ligands, and excellent targeting ability.33–37 Specific to the metal coordination strategy, some significant breakthroughs have been made in the development of excellent metal complexes to induce ferroptosis. For example, Gust et al. pioneered a series of iron(III) complexes that generate lipid-based ROS and induce ferroptosis (Scheme 1b).27,31 The significant breakthrough made by Mao et al. showed that a cyclometalated Ir(III) complex containing a ferrocene moiety ligand is a highly efficient ferroptosis inducer, providing a powerful tool for enhancing cancer immunity (Scheme 1b).29 Chao et al. creatively designed a biodegradable Ir(III) coordination polymer that induces apoptosis and ferroptosis through photodynamic therapy.30 Mechanistically, these current design strategies introduce exogenous iron into cells for its accumulation to perform the Fenton reaction or produce an overload of lipid peroxides to induce ferroptosis. Constructing an amide or ester bond or using existing coordination sites to conjugate natural products or drugs to metals have become common methods for metal drug design, which could increase the selectivity and reduce the side effects of the metal.38,39 In addition, redesigning drug scaffolds as ligands while retaining the targeting group is an attractive strategy. Notably, reports on these strategies revealed that metal coordination could reduce toxicity and increase the pharmaceutical effect of the free drug molecules.40 Through rational design, metal complexes can simultaneously combine the advantages of both metals and drug molecules to achieve better therapeutic effects.
It is noteworthy that iridium hydrides have been demonstrated to be effective scaffolds for metal drugs due to their adjustable photophysical and chemical properties.41–44 Herein, we designed the iridium(III) complex Ir1 based on iridium hydrides. To better target the glutathione peroxidase 4 (GPX4) protein, which is enriched in the mitochondria, we first introduced triphenylphosphine as the mitochondria-targeting ligand and then Py-RSL as the ferroptosis-inducing ligand (Scheme 1c). This complex induces ferroptosis in human fibrosarcoma (HT1080) cells by significantly inhibiting GPX4 and ferroptosis suppressor protein 1 (FSP1). Notably, intracellular localization monitoring can be achieved under visible light (488 nm) excitation. Moreover, iridium coordination reduces the toxicity of the Py-RSL ligand to make this complex available for in vivo applications.
Results and discussion
Synthesis of the Ir(III) complex Ir-Py-RSL
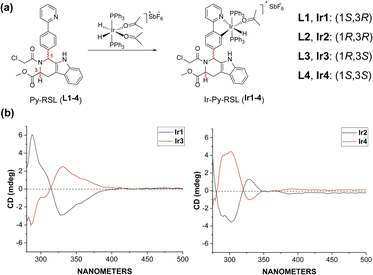
Six-coordinated hydrides of iridium provide an excellent starting point for a variety of modifications. The axial ligand triphenylphosphine gives additional mitochondrial targeting ability, while leaving coordination space in the plane for mono- or bidentate ligands. Among small molecule ferroptosis inducers, RSL3 has an ability to target GPX4,45 and chloroacetamide is essential for its activity. Therefore, we preserved the pharmaceutical scaffold and replaced the phenyl at C1 with phenylpyridine for metal coordination (Fig. 1a). Four different chiral ligands (L1–4) and the four corresponding Ir(III) complexes (Ir-Py-RSL, Ir1–4) were then synthesized. 1H two-dimensional nuclear Overhauser effect spectroscopy (NOESY) was performed to determine the identified stereochemistry of the four ligands. We also verified the chirality by circular dichroism (CD) spectra (Fig. 1b and S1†), and high-performance liquid chromatography (HPLC) was used to further prove the difference in ligand chirality (Fig. S2 and S3†). All Ir(III) complexes maintain stable at 37 °C after 48 hours (Fig. S4–S7†). We also assessed the octanol/water partition coefficients (log![[thin space (1/6-em)]](https://www.rsc.org/images/entities/char_2009.gif) PO/W) of the complexes, which show similar lipophilicities (Ir1: 0.61 ± 0.22; Ir2: 0.64 ± 0.23; Ir3: 0.67 ± 0.12; Ir4: 0.54 ± 0.23). The details of the synthesis and characterization are fully described in ESI.†
PO/W) of the complexes, which show similar lipophilicities (Ir1: 0.61 ± 0.22; Ir2: 0.64 ± 0.23; Ir3: 0.67 ± 0.12; Ir4: 0.54 ± 0.23). The details of the synthesis and characterization are fully described in ESI.†
Cytotoxicity of the iridium complexes
First, a cytotoxicity test in HT1080 cells was carried out by performing a CCK8 assay. As shown in Tables 1 and S1,†L3 (IC50 = 1.76 μM) and L1 (IC50 = 1.71 μM) displayed high cytotoxicity, whereas the IC50 values of Ir3 and Ir1 were 11.01 μM and 7.48 μM, respectively. Metal coordination reduces the toxicity of ligand by three- to fourfold. Notably, the other two chiral ligands and corresponding Ir(III) complexes did not show significant antitumor activity. Among them, Ir1 showed antitumor toxicity superior to that of cisplatin (IC50 = 9.72 μM). We then chose human lung fibroblasts (HLFs) and human embryonic kidney 293T (HEK-293T) cells to determine the selectivity of the compounds against normal cells. As shown in Table 1, in comparison to L1 and cisplatin, the Ir(III) complex showed much lower cytotoxicity towards HLFs, and the cytotoxicity to HEK-193T cells was comparable to that of cisplatin. The IC50 values confirmed that Ir coordination not only reduced the toxicity of the ligand but also provided cancer cell selectivity. We confirmed these results in human pancreatic cancer (PANC-1) cells. The cellular uptake of Ir1 was measured during 120 min (Fig. S10†). At the cellular level, compared with cisplatin, Ir1 possessed better antitumor activity and fewer side effects in normal cells.| Cell line | IC50 (μM) | ||
|---|---|---|---|
| L1 | Ir1 | Cisplatin | |
| a Cell viability was measured by CCK8 assay after 48 h incubation with different complexes (dose–response curves are shown in Fig. S9). | |||
| HT1080 | 1.71 | 7.48 | 9.72 |
| PANC-1 | 1.45 | 9.19 | 21.33 |
| HLF | 1.44 | 46.76 | 10.82 |
| HEK-293T | 8.47 | 24.79 | 30.52 |
Ferroptosis induced by Ir1
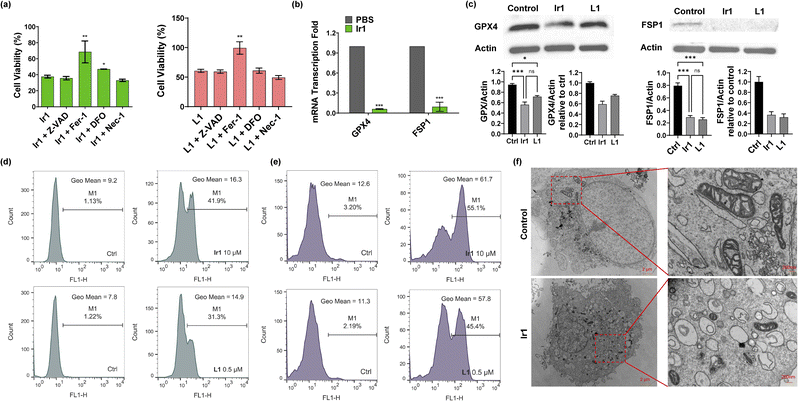
Then, we verified the mode of cell death by concomitantly incubating the complexes with different inhibitors: ferrostatin-1 (Fer-1) and deferoxamine (DFO) for ferroptosis,1 Z-VAD-FMK (Z-VAD) for apoptosis,46 and necrostatin-1 (Nec-1) for necroptosis.47 As displayed in Fig. 2a and S11,† none of the inhibitors showed clear influence on the ligand-mediated reduction in cell viability. For Ir2-treated cells, Z-VAD strongly restored cell viability, indicating that the complex caused apoptosis. Ir4 induced ferroptosis as well as necroptosis, as confirmed by the enhanced cell viability after incubation with Fer-1 and Nec-1. In addition, the inhibitors showed no effect on Ir3-induced cell death. Notably, Fer-1 and DFO rescued Ir1-induced cell death, while the other inhibitors displayed no influence, indicating that ferroptotic cell death was induced by this complex (Fig. 2a).Based on the above results, we further verified that ferroptosis was induced by Ir1. Glutathione depletion, GPX4 activity reduction, and decreased antioxidant capacity of cells resulting in increased lipid peroxidation reactions and reactive oxygen species (ROS), are common ferroptosis markers.48,49 As shown in Fig. 2e and S12,†Ir1 and the corresponding ligand both induced extensive ROS production. When compared with phosphate-buffered saline (PBS)- and L1-treated cells, Ir1 caused notably increased lipid peroxidation (Fig. 2d and S12†). Additionally, Fer-1 could restore the cell viability of L1-treated cells. To analyse the causes of lipid ROS production, we detected the expression of two key targets, GPX4 and FSP1. GPX4 and FSP1 were significantly inhibited, which was confirmed by western blot and reverse transcription-polymerase chain reaction (RT-PCR) experiments (Fig. 2b and c). Above results suggested that L1 acts as the ferroptosis-inducer, the replacement of C1 phenyl of RSL3 with phenylpyridine has no effect on the drug function. Another representative hallmark of ferroptosis is condensed mitochondrial morphology.49 The transmission electron microscopy (TEM) image in Fig. 2f shows distinct, shrunken mitochondria and collapsed mitochondrial cristae. Altogether, as evidenced by the biochemical and morphological characteristics, these results further confirmed that ferroptosis was induced by Ir1. We also verified the death pattern by ferroptosis inhibitors, LPO and ROS production in a healthy cell line (HLF). The results indicate Ir1 does not cause healthy cell to undergo ferroptosis (Fig. S13†).
Cellular imaging of Ir1
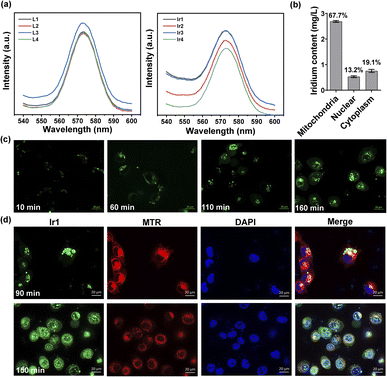
Under physiological conditions, metal complexes have better chemical and photochemical stability than organic molecules.50,51 All Ir(III) complexes show ligand-based fluorescence at ≈575 nm with 488 nm excitation in dimethyl sulfoxide (Fig. 3a). Ultraviolet-visible spectra were also detected (Fig. S8†). Having excitation and emission wavelengths in the visible range could effectively avoid photodamage and photobleaching in cells, which is suitable for tracking action processes in cells. We made observations every ten minutes for two and a half hours. As illustrated in Fig. 3c and S14,† the Ir(III) complex gradually entered the cells from the extracellular space over 60 min and then acted on different organelles over time. To further localize the complex in organelles, we performed a colocalization assay at two time points with MitoTracker Red (MTR) for mitochondrial staining and 4′,6-diamidino-2-phenylindole (DAPI) for nuclear staining (Fig. 3d). At 90 min, the Ir(III) complex had aggregated and attached to cytoplasm, not in mitochondria, for the Pearson's correlation coefficient is only 0.0749. While at 150 min, some of the complexes had entered the nucleus while the rest remained mainly on the mitochondria (Pearson's correlation coefficient is 0.4734). The fluorescence images showed that the Ir(III) complex acted on the mitochondria to exert subsequent functions. We also quantified the iridium content in different organelles by inductively coupled plasma-mass spectrometry (ICP-MS) after 24 h of treatment and found 67.7%, 13.2%, and 19.1% in the mitochondria, nucleus, and cytoplasm, respectively (Fig. 3b). The above results confirmed that Ir1 has good mitochondrial targeting ability. Notably, when the complex functions in specific organelles, a significant reduction in the off-target toxicity of the organic ligand can be achieved.Proteomic analysis of Ir1
To further understand the mechanism of Ir1 in cells, we performed a label-free quantitative proteomic profiling experiment. This mass spectrometry-based technology provides new insights into cellular responses after metal complex exposure, including the interaction and regulation of cellular pathways, which can identify the altered pathways through extensive quantification of cellular proteins.52–54 With advances in proteomic techniques, a deeper mechanistic understanding of cellular responses can be obtained, such as cellular uptake, biological distribution, and toxicity.55–58Fig. 4a and b show the significant differences in protein expression between the Ir1 group and PBS control group. It was found that 199 proteins were significantly downregulated and 280 proteins were upregulated in cells treated with Ir1 (Fig. 4c). Notably, eukaryotic translation initiation factor 2A (EIF2A), which plays a vital role in the integrated stress response of cancer cells, leading to drug resistance and poor prognosis, was the most inhibited protein.59,60 The proteomics results also showed a large number of destroyed proteins (Table S2†), including GPX4, which was confirmed above. In addition, subcellular localization, Kyoto Encyclopedia of Genes and Genomes (KEGG) pathway annotation, and group domain enrichment analysis of the differentially expressed proteins including molecular function, cellular component, and protein domain are shown in Fig. S15–S19.†Notably, Ir1 significantly affected ErbB signalling pathways, as revealed by bioinformatic analysis (Fig. 4d). The ErbB family is related to a variety of cancers, and its overexpression leads to cancer metastasis, drug resistance, poor prognosis, and a lower survival rate.61,62 Targeting the ErbB family has thus become an effective means of cancer treatment.63,64 Notably, ferroptosis is also considered to be an autophagy-dependent type of cell death, while ErbB-1 can mediate autophagy.65 Additionally, autophagy could cause histone deacetylase inhibition, which promotes high mobility group box 1 (HMGB1) acetylation and leads to HMGB1 release in ferroptosis as a damage-associated molecular pattern molecule.66 ErbB-1 inhibition was shown to contribute to ferroptosis.67 Based on our proteomic data, we further verified the ErbB-targeting ability of Ir1 by qRT-PCR. We also detected the expression of a series of ErbB signalling pathway-related proteins. As shown in Fig. 4e, the expression of a disintegrin and metalloprotease 17 (ADAM17),68 Huntingtin interacting protein 1 (HIP1),69 Casitas B-lineage lymphoma (CBL),70 nucleoporin 62 (NUP62),71 short hairpin kinesin-binding protein (SHKBP),72 docking protein 1 (DOK1),73 and recombination signal binding protein (RBPJ)74 was significantly suppressed. Coiled-coil domain containing 88 (CCD C88)75 and angiotensin II type 1 receptor-associated protein (ARAP1)76 were also inhibited to varying degrees. These results verified that Ir1 could inhibit the ErbB signalling pathway, which could further enhance anticancer activity and contribute to ferroptosis. Such dual-targeting abilities makes this Ir(III) complex a promising agent for future anticancer applications in vivo.
Toxicity of Ir1in vivo
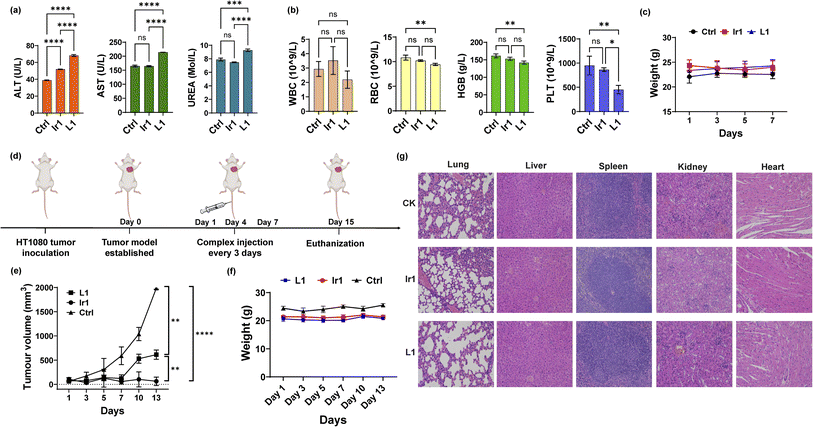
To further apply the Ir1 complex in vivo, we first detected its toxicity in mice to evaluate its safety. Blood biochemical and haematological analyses were performed 7 days after injection of Ir1, with L1 and PBS used for comparison. For blood biochemical tests, the indices of aspartate transaminase (AST), alanine transaminase (ALT), and blood urea nitrogen (BUN) are shown in Fig. 5a. Compared with PBS-treated mice, the ALT values significantly increased in Ir1- and L1-treated group, and only L1 induced a significant increase in the AST levels. L1-induced raise in ALT and AST level are extremely significant compared to Ir1 treatment. These results indicate L1 causes more damage to the hepatocyte organelles. Higher level of UREA caused by L1 also shows that there is a certain kidney damage. From the haematological analysis, the values of white blood cells (WBCs), red blood cells (RBCs), haemoglobin (HGB), and platelets (PLTs) showed no statistical difference between Ir1 and control group (Fig. 5b). But the RBC, HGB, and PLT levels of L1 all have a statistically significant decrease compared to the control group. Ir1 is therefore safer than L1in vivo according to the above indices. Furthermore, there were no significant effects on the body weight among each group (Fig. 5c). These results indicated that Ir1 does not trigger hepatic or kidney toxicity, while L1 could cause severe liver damage, which further illustrates the detoxification ability of Ir(III) coordination.Antitumor activity of Ir1 in mice
Finally, we conducted antitumor experiments in mice. HT-1080 cells were first implanted into three groups of mice. After the tumour-bearing mouse model was constructed, Ir1 (5 mg kg−1), L1 (5 mg kg−1), and PBS were injected through the tail vein on Days 1, 4, and 7 (Fig. 5d). Tumour volumes and mouse body weights were recorded for 15 days. As shown in Fig. 5e, compared with PBS group, the Ir1 and the L1 treatment could both inhibit tumour volume, and the Ir1 group exhibited greater tumour suppression. This is probably due to the tumour-targeting ability of the iridium complex, a property that the off-targeted ligand molecule lacks. t test results also showed a significant difference between these two treatments (p < 0.0001). Additionally, there was no clear loss in mouse body weight in any of the groups (Fig. 5f). All mice were sacrificed after 15 days for organ slicing. Haematoxylin and eosin (H&E) staining showed that the Ir(III) complex did not cause toxic damage to any organ, while the ligand damaged the lung and kidney (Fig. 5g). Although L1 is more toxic in vitro, Ir1 showed better antitumor ability in vivo. The iridium complex provided better targeting capabilities, and the dual-targeting effect makes Ir1 a promising anticancer agent for future cancer treatment.Conclusions
In summary, we synthesized a novel iridium complex, Ir1, which contains a Py-RSL ligand, and found that this complex could induce ferroptosis and overcome the disadvantages of small organic molecules. In detail, Ir1 induced ferroptosis in cancer cells by inhibiting the critical proteins GPX4 and FSP1 (Fig. 6). In vitro and in vivo experiments demonstrated that metal coordination could reduce the off-target toxicity of the Py-RSL ligand in vivo, and visible light-excited fluorescence enabled real-time imaging to determine compound localization in vitro. Notably, the ErbB signalling pathway was also inhibited by Ir1, which further contributed to its anticancer activity and ferroptosis induction, making the complex more suitable for cancer treatment. Here, we introduced a dual-targeting ferroptosis inducer through rational design, which provides new insights into the design of multifunctional anticancer complexes.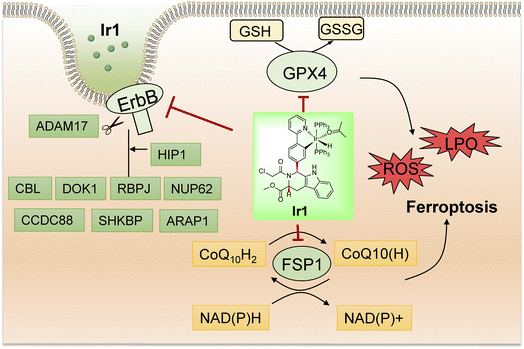 | ||
| Fig. 6 Schematic illustration of the biological mechanism of Ir1 in cancer cells based on the experiment results and proteomic analysis of Ir1. | ||
Ethical statement
All animal studies were performed in accordance with the Guidelines for the Care and Use of Laboratory Animals of the Chinese Animal Welfare Committee and approved by The Institutional Animal Care and Use Committee (Nanjing University, IACUC-2109009).Data availability
The data that support the findings of this study are available in the ESI† or on request from the corresponding author.Author contributions
Prof. Zi-Jian Guo and Prof. Jing Zhao conceived and designed the study. Xin-Yang Zhao carried out the synthesis. Xin-Yang Zhao, Jing-Yi Zhang, Wei Zhang, and Xiu-Xiu Wang performed the in vitro and in vivo experiments. Xin-Yang Zhao, Xiu-Xiu Wang, Prof. Wei Wei, Prof. Jing Zhao, and Prof. Zi-Jian Guo wrote the manuscript. All authors reviewed, provided suggestions, and approved the final version. Xin-Yang Zhao and Xiu-Xiu Wang contributed equally.Conflicts of interest
There are no conflicts to declare.Acknowledgements
Financial support was provided by the National Natural Science Foundation of China (22025701, 22207053 and 22177048), the Natural Science Foundation of Jiangsu Province (BK20202004 and BK20220764), and the Fundamental Research Funds for the Central Universities.Notes and references
- S. J. Dixon, K. M. Lemberg, M. R. Lamprecht, R. Skouta, E. M. Zaitsev, C. E. Gleason, D. N. Patel, A. J. Bauer, A. M. Cantley, W. S. Yang, B. Morrison and B. R. Stockwell, Cell, 2012, 149, 1060–1072 CrossRef CAS.
- X. Jiang, B. R. Stockwell and M. Conrad, Nat. Rev. Mol. Cell Biol., 2021, 22, 266–282 CrossRef PubMed.
- B. R. Stockwell, J. P. Friedmann Angeli, H. Bayir, A. I. Bush, M. Conrad, S. J. Dixon, S. Fulda, S. Gascón, S. K. Hatzios, V. E. Kagan, K. Noel, X. Jiang, A. Linkermann, M. E. Murphy, M. Overholtzer, A. Oyagi, G. C. Pagnussat, J. Park, Q. Ran, C. S. Rosenfeld, K. Salnikow, D. Tang, F. M. Torti, S. V. Torti, S. Toyokuni, K. A. Woerpel and D. D. Zhang, Cell, 2017, 171, 273–285 CrossRef CAS.
- B. Do Van, F. Gouel, A. Jonneaux, K. Timmerman, P. Gelé, M. Pétrault, M. Bastide, C. Laloux, C. Moreau, R. Bordet, D. Devos and J.-C. Devedjian, Neurobiol. Dis., 2016, 94, 169–178 CrossRef CAS.
- R.-P. Zhou, Y. Chen, X. Wei, B. Yu, Z.-G. Xiong, C. Lu and W. Hu, Theranostics, 2020, 10, 11976–11997 CrossRef CAS.
- T. Zhao, X. Guo and Y. Sun, Aging Dis., 2021, 12, 529–551 CrossRef.
- J. Ju, Y.-n. Song and K. Wang, Aging Dis., 2021, 12, 261–276 CrossRef PubMed.
- B. Hassannia, P. Vandenabeele and T. Vanden Berghe, Cancer Cell, 2019, 35, 830–849 CrossRef PubMed.
- X. Chen, R. Kang, G. Kroemer and D. Tang, Nat. Rev. Clin. Oncol., 2021, 18, 280–296 CrossRef PubMed.
- J. Li, F. Cao, H.-l. Yin, Z.-j. Huang, Z.-t. Lin, N. Mao, B. Sun and G. Wang, Cell Death Dis., 2020, 11, 88 CrossRef PubMed.
- C. M. Bebber, F. Müller, L. Prieto Clemente, J. Weber and S. von Karstedt, Cancers, 2020, 12, 164 CrossRef.
- J. P. Friedmann Angeli, D. V. Krysko and M. Conrad, Nat. Rev. Cancer, 2019, 19, 405–414 CrossRef PubMed.
- Z. Shen, J. Song, B. C. Yung, Z. Zhou, A. Wu and X. Chen, Adv. Mater., 2018, 30, 1704007 CrossRef PubMed.
- G. Greco, E. Catanzaro and C. Fimognari, Cancers, 2021, 13, 304 CrossRef.
- C. Liang, X. Zhang, M. Yang and X. Dong, Adv. Mater., 2019, 31, 1904197 CrossRef PubMed.
- W. S. Yang, R. SriRamaratnam, M. E. Welsch, K. Shimada, R. Skouta, V. S. Viswanathan, J. H. Cheah, P. A. Clemons, A. F. Shamji, C. B. Clish, L. M. Brown, A. W. Girotti, V. W. Cornish, S. L. Schreiber and B. R. Stockwell, Cell, 2014, 156, 317–331 CrossRef.
- S. Dolma, S. L. Lessnick, W. C. Hahn and B. R. Stockwell, Cancer Cell, 2003, 3, 285–296 CrossRef.
- M. Sato, R. Kusumi, S. Hamashima, S. Kobayashi, S. Sasaki, Y. Komiyama, T. Izumikawa, M. Conrad, S. Bannai and H. Sato, Sci. Rep., 2018, 8, 968 CrossRef PubMed.
- S. Xu, H. Zheng, R. Ma, D. Wu, Y. Pan, C. Yin, M. Gao, W. Wang, W. Li, S. Liu, Z. Chai and R. Li, Nat. Commun., 2020, 11, 3484 CrossRef.
- H. Zheng, J. Jiang, S. Xu, W. Liu, Q. Xie, X. Cai, J. Zhang, S. Liu and R. Li, Nanoscale, 2021, 13, 2266–2285 RSC.
- L. Luo, H. Wang, W. Tian, X. Li, Z. Zhu, R. Huang and H. Luo, Theranostics, 2021, 11, 9937–9952 CrossRef.
- H. Liang, X. Wu, G. Zhao, K. Feng, K. Ni and X. Sun, J. Am. Chem. Soc., 2021, 143, 15812–15823 CrossRef.
- E. Ploetz, A. Zimpel, V. Cauda, D. Bauer, D. C. Lamb, C. Haisch, S. Zahler, A. M. Vollmar, S. Wuttke and H. Engelke, Adv. Mater., 2020, 32, 1907267 CrossRef.
- X. Meng, J. Deng, F. Liu, T. Guo, M. Liu, P. Dai, A. Fan, Z. Wang and Y. Zhao, Nano Lett., 2019, 19, 7866–7876 CrossRef.
- H. He, L. Du, H. Guo, Y. An, L. Lu, Y. Chen, Y. Wang, H. Zhong, J. Shen, J. Wu and X. Shuai, Small, 2020, 16, 2001251 CrossRef PubMed.
- X. Wang, F. Chen, J. Zhang, J. Sun, X. Zhao, Y. Zhu, W. Wei, J. Zhao and Z. Guo, Sci. China: Chem., 2020, 63, 65–72 CrossRef.
- J. Sagasser, B. N. Ma, D. Baecker, S. Salcher, M. Hermann, J. Lamprecht, S. Angerer, P. Obexer, B. Kircher and R. Gust, J. Med. Chem., 2019, 62, 8053–8061 CrossRef.
- H. Yuan, Z. Han, Y. Chen, F. Qi, H. Fang, Z. Guo, S. Zhang and W. He, Angew. Chem., Int. Ed., 2021, 60, 8174–8181 CrossRef.
- W.-J. Wang, Y.-Y. Ling, Y.-M. Zhong, Z.-Y. Li, C.-P. Tan and Z.-W. Mao, Angew. Chem., Int. Ed., 2022, 61, e202115247 Search PubMed.
- L. Ke, F. Wei, L. Xie, J. Karges, Y. Chen, L. Ji and H. Chao, Angew. Chem., Int. Ed., 2022, e202205429 Search PubMed.
- D. Baecker, Ö. Sesli, L. Knabl, S. Huber, D. Orth-Höller and R. Gust, Eur. J. Med. Chem., 2021, 209, 112907 CrossRef PubMed.
- M. Hreusova, V. Novohradsky, L. Markova, H. Kostrhunova, I. Potočňák, V. Brabec and J. Kasparkova, Bioinorg. Chem. Appl., 2022, 2022, 3095749 Search PubMed.
- E. J. Anthony, E. M. Bolitho, H. E. Bridgewater, O. W. L. Carter, J. M. Donnelly, C. Imberti, E. C. Lant, F. Lermyte, R. J. Needham, M. Palau, P. J. Sadler, H. Shi, F.-X. Wang, W.-Y. Zhang and Z. Zhang, Chem. Sci., 2020, 11, 12888–12917 RSC.
- N. P. E. Barry and P. J. Sadler, Chem. Commun., 2013, 49, 5106–5131 RSC.
- A. Casini, A. Vessières and S. M. Meier-Menches, Metal-based anticancer agents, Royal Society of Chemistry, 2019 Search PubMed.
- X. Wang and Z. Guo, Chem. Soc. Rev., 2013, 42, 202–224 RSC.
- L. Zeng, P. Gupta, Y. Chen, E. Wang, L. Ji, H. Chao and Z.-S. Chen, Chem. Soc. Rev., 2017, 46, 5771–5804 RSC.
- D.-L. Ma, C. Wu, S.-S. Cheng, F.-W. Lee, Q.-B. Han and C.-H. Leung, Int. J. Mol. Sci., 2019, 20, 341 CrossRef.
- L. B. Heras, Á. Amesty, A. Estévez-Braun and S. Hortelano, Anti-Cancer Agents Med. Chem., 2019, 19, 48–65 CrossRef PubMed.
- S. Pattan, S. Pawar, S. Vetal, U. Gharate and S. Bhawar, Indian Drugs, 2012, 49, 5–12 Search PubMed.
- X. Song, Y. Qian, R. Ben, X. Lu, H.-L. Zhu, H. Chao and J. Zhao, J. Med. Chem., 2013, 56, 6531–6535 CrossRef CAS PubMed.
- X. Wang, M. Zhu, F. Gao, W. Wei, Y. Qian, H.-K. Liu and J. Zhao, J. Inorg. Biochem., 2018, 180, 179–185 CrossRef CAS PubMed.
- X. Wang, J. Zhang, X. Zhao, W. Wei and J. Zhao, Metallomics, 2019, 11, 1344–1352 CrossRef CAS.
- S. Roy, M. Mohanty, R. G. Miller, S. A. Patra, S. Lima, A. Banerjee, N. Metzler-Nolte, E. Sinn, W. Kaminsky and R. Dinda, Inorg. Chem., 2020, 59, 15526–15540 CrossRef CAS PubMed.
- T.-J. Park, J. H. Park, G. S. Lee, J.-Y. Lee, J. H. Shin, M. W. Kim, Y. S. Kim, J.-Y. Kim, K.-J. Oh, B.-S. Han, W.-K. Kim, Y. Ahn, J. H. Moon, J. Song, K.-H. Bae, D. H. Kim, E.-W. Lee and S. C. Lee, Cell Death Dis., 2019, 10, 835 CrossRef PubMed.
- E. A. Slee, H. Zhu, S. C. Chow, M. MacFarlane, D. W. Nicholson and G. M. Cohen, Biochem. J., 1996, 315, 21–24 CrossRef CAS PubMed.
- A. Degterev, Z. Huang, M. Boyce, Y. Li, P. Jagtap, N. Mizushima, G. D. Cuny, T. J. Mitchison, M. A. Moskowitz and J. Yuan, Nat. Chem. Biol., 2005, 1, 112–119 CrossRef CAS PubMed.
- Y. Xie, W. Hou, X. Song, Y. Yu, J. Huang, X. Sun, R. Kang and D. Tang, Cell Death Differ., 2016, 23, 369–379 CrossRef CAS.
- J. Y. Cao and S. J. Dixon, Cell. Mol. Life Sci., 2016, 73, 2195–2209 CrossRef CAS.
- Q. Zhao, C. Huang and F. Li, Chem. Soc. Rev., 2011, 40, 2508–2524 RSC.
- R. J. Mortimer and N. M. Rowley, in Comprehensive Coordination Chemistry II, ed. J. A. McCleverty and T. J. Meyer, Pergamon, Oxford, 2003, pp. 581–619 Search PubMed.
- X. Wang, Y. Hu, J. Mo, J. Zhang, Z. Wang, W. Wei, H. Li, Y. Xu, J. Ma, J. Zhao, Z. Jin and Z. Guo, Angew. Chem., Int. Ed., 2020, 59, 5151–5158 CrossRef CAS.
- T. Verano-Braga, R. Miethling-Graff, K. Wojdyla, A. Rogowska-Wrzesinska, J. R. Brewer, H. Erdmann and F. Kjeldsen, ACS Nano, 2014, 8, 2161–2175 CrossRef CAS.
- S. Gioria, H. Chassaigne, D. Carpi, A. Parracino, S. Meschini, P. Barboro and F. Rossi, Toxicol. Lett., 2014, 228, 111–126 CrossRef CAS PubMed.
- L. M. Wang, J. Y. Li, J. Pan, X. M. Jiang, Y. L. Ji, Y. F. Li, Y. Qu, Y. L. Zhao, X. C. Wu and C. Y. Chen, J. Am. Chem. Soc., 2013, 135, 17359–17368 CrossRef CAS.
- R. Cai and C. Y. Chen, Adv. Mater., 2019, 31, 1805740 CrossRef CAS.
- M. J. Cao, R. Cai, L. N. Zhao, M. Y. Guo, L. M. Wang, Y. C. Wang, L. L. Zhang, X. F. Wang, H. D. Yao, C. Y. Xie, Y. L. Cong, Y. Guan, X. Y. Tao, Y. L. Wang, S. X. Xu, Y. Liu, Y. L. Zhao and C. Y. Chen, Nat. Nanotechnol., 2021, 16, 708–716 CrossRef CAS PubMed.
- M. Y. Guo, L. N. Zhao, J. Liu, X. F. Wang, H. D. Yao, X. L. Chang, Y. Liu, J. M. Liu, M. You, J. Y. Ren, F. H. Wang, L. M. Wang, Y. L. Wang, H. B. A. Liu, Y. L. Li, Y. L. Zhao, R. Cai and C. Y. Chen, Nano Lett., 2021, 21, 6005–6013 CrossRef CAS.
- L. Chen, J. He, J. Zhou, Z. Xiao, N. Ding, Y. Duan, W. Li and L.-Q. Sun, J. Cell. Mol. Med., 2019, 23, 6060–6071 CrossRef CAS.
- A. A. Komar and W. C. Merrick, Int. J. Mol. Sci., 2020, 21, 2054 CrossRef CAS.
- C. L. Arteaga and J. A. Engelman, Cancer Cell, 2014, 25, 282–303 CrossRef.
- N. E. Hynes and H. A. Lane, Nat. Rev. Cancer, 2005, 5, 341–354 CrossRef PubMed.
- Y. Yarden and G. Pines, Nat. Rev. Cancer, 2012, 12, 553–563 CrossRef PubMed.
- N. Tebbutt, M. W. Pedersen and T. G. Johns, Nat. Rev. Cancer, 2013, 13, 663–673 CrossRef PubMed.
- B. Zhou, J. Liu, R. Kang, D. J. Klionsky, G. Kroemer and D. Tang, Semin. Cancer Biol., 2020, 66, 89–100 CrossRef PubMed.
- Q. Wen, J. Liu, R. Kang, B. Zhou and D. Tang, Biochem. Biophys. Res. Commun., 2019, 510, 278–283 CrossRef PubMed.
- X. Wu, H. Sheng, L. Zhao, M. Jiang, H. Lou, Y. Miao, N. Cheng, W. Zhang, D. Ding and W. Li, Cell Death Dis., 2022, 13, 557 CrossRef CAS.
- C. P. Blobel, Nat. Rev. Mol. Cell Biol., 2005, 6, 32–43 CrossRef CAS PubMed.
- D. S. Rao, S. V. Bradley, P. D. Kumar, T. S. Hyun, D. Saint-Dic, K. Oravecz-Wilson, C. G. Kleer and T. S. Ross, Cancer Cell, 2003, 3, 471–482 CrossRef CAS.
- L. M. Grøvdal, E. Stang, A. Sorkin and I. H. Madshus, Exp. Cell Res., 2004, 300, 388–395 CrossRef.
- Y. Leng, C. Cao, J. Ren, L. Huang, D. Chen, M. Ito and D. Kufe, J. Biol. Chem., 2007, 282, 19321–19330 CrossRef CAS.
- L. Feng, J.-T. Wang, H. Jin, K. Qian and J.-G. Geng, Cell Biochem. Funct., 2011, 29, 589–596 CrossRef CAS.
- J.-G. Némorin and P. Duplay, J. Biol. Chem., 2000, 275, 14590–14597 CrossRef.
- Y. Chen, W. H. Fischer and G. N. Gill, J. Biol. Chem., 1997, 272, 14110–14114 CrossRef CAS PubMed.
- P. Ghosh, A. O. Beas, S. J. Bornheimer, M. Garcia-Marcos, E. P. Forry, C. Johannson, J. Ear, B. H. Jung, B. Cabrera, J. M. Carethers and M. G. Farquhar, Mol. Biol. Cell, 2010, 21, 2338–2354 CrossRef CAS PubMed.
- T. Daniele, G. Di Tullio, M. Santoro, G. Turacchio and M. A. De Matteis, Traffic, 2008, 9, 2221–2235 CrossRef CAS.
Footnotes |
| † Electronic supplementary information (ESI) available. See DOI: https://doi.org/10.1039/d2sc06171f |
| ‡ Equal contribution. |
| This journal is © The Royal Society of Chemistry 2023 |

