 Open Access Article
Effect of NaOH-treated sawdust incorporated in geopolymer matrix on compressive strength and adsorption property†
Gaëlle
Ngnie
a,
Rock
Ambela Atangana
b,
Grace Ingrid
Tomou-Mbahim
b,
Lionel Magellan
Sambang
b,
Gustave Kenne
Dedzo
 *b,
Hervé Kouamo
Tchakoute
*b,
Claus Henning
Rüscher
c and
Emmanuel
Ngameni
b
*b,
Hervé Kouamo
Tchakoute
*b,
Claus Henning
Rüscher
c and
Emmanuel
Ngameni
b
aUniversity Institute of Wood Technology of Mbalmayo, University of Yaoundé I, P.O. Box 306, Mbalmayo, Cameroon
bLaboratoire d'électrochimie Analytique et Génie des Matériaux, University of Yaoundé 1, P.O. Box 812, Yaoundé, Cameroun. E-mail: kennegusto@yahoo.fr
cInstitut für Mineralogie, Leibniz Universität Hannover, Callinstrasse 3, D-30167 Hannover, Germany
First published on 28th June 2024
Abstract
Sawdust is a multifunctional renewable biomaterial that can be incorporated into several materials to improve their properties. In the present work, the effect of sawdust incorporation in a geopolymer matrix on the compressive strength and porosity of the synthesized composite was investigated. A prior chemical treatment of sawdust with sodium hydroxide was performed to improve its compatibility with the geopolymer matrix obtained from reaction between metakaolin and sodium waterglass. Characterizations revealed an effective geopolymerization regardless the amount of sawdust added (from 0% to 10%). Compared to untreated sawdust which causes a decrease of the compressive strength, an increase of the compressive strength of the geopolymer was observed in the presence of the treated lignocellulosic material (63.04 MPa at 0% to a maximum of 75.22 MPa at 2%) followed by a decrease for higher sawdust percentage (48.48 MPa at 10%). This result confirmed the beneficial effect of the alkaline treatment of sawdust. Methylene blue (MB) was used as model cation in order to evaluate geopolymer composite porosity for cationic pollutants adsorption. Adsorption rate was found to increase with sawdust percentage in the composite, highlighting the positive effect of sawdust particles in pollutant diffusion within the network of composite materials. The diffusion coefficients increased with the percentage of sawdust in the composite materials. Preliminary work on cobalt(II) adsorption revealed good performances marked by higher and comparable adsorption capacities (in the range 0.82 to 0.90 mmol g−1) regardless the amount of sawdust used in the composite.
Introduction
Geopolymer materials, especially those synthesized in alkaline medium, are increasingly considered as an interesting alternative to Portland cements, because of their low environmental footprint.1 Regarding their structure and facile production, geopolymer materials are also increasingly used as adsorbents for the removal of pollutants in aqueous solution.2–4 These materials are characterized by an anionic aluminosilicate backbone compensated by exchangeable cations (mainly sodium).5 They are therefore generally used for the adsorption of cationic compounds.4,6–8 Unfortunately, because of their poor porosity, their use as adsorbent requests significant treatment times because of the high adsorption equilibrium times. This drawback also represents a significant limitation for application in water filtration because of fast occlusion of the membrane.9,10 To solve this problem, it is common to use pore-forming agent (hydrogen peroxide, calcium carbonate, etc.) added during the synthesis of geopolymer materials in order to increase the porosity.11–13 Unfortunately, most of these additives strongly alter the structure of resulting materials with a negative impact on mechanical properties.14,15 The use of organic additives (such as cellulose and organic polymers) less reactive with the geopolymer materials precursors allows surface interactions without deep structural modification of the geopolymer matrix.13,15–17 Porosity can thus be generated without significant alteration of the structure of the matrix.Forestry industries and carpentries produce every year large amounts of sawdust generally poorly managed in African countries. This by-product of wood exploitation is indeed considered as waste in several African countries, and most often destroyed by combustion or dumped in nature. To overcome this environmental issue, many uses of these materials are increasingly developed in various fields (adsorption, electrochemical sensors, composite panels, energy sources and activated carbon and biochar production amongst others).18–23 The chemical composition of this multifunctional material consisting essentially of 3 interconnected macromolecules (cellulose, hemicelluloses and lignin) allows a wide range of chemical interactions which explain these diverse applications. Recent work reveals that it is also possible to incorporate sawdust into cements and other geopolymer matrices to obtain porous and lighter materials with low thermal conductivity.10,13,24–30 Moreover, in the specific case of geopolymer materials, the incorporation of sawdust resulted in minor modification of the mechanical resistance of the composite materials obtained. This was explained by the good dispersion of sawdust particles within the geopolymer matrix.13 Sawdust possess many hydrogen bonds donors and acceptors functional groups (alcohol, ether, esters, phenols, etc.), likely to interact with the abundant oxygen atoms (hydrogen bonds acceptors) of the geopolymer matrix (Al–O–Si–O–…). According to recent works the treatment of sawdust with concentrated sodium hydroxide results in partial dissolution of lignin, followed by substantial increases of surface OH functions.18,19 Such treatment should therefore improve the dispersion of sawdust particles within the geopolymer matrix and thus promotes favorable impact on the reinforcement of the structure of the resulting composite material while improving the diffusion of chemical species through the structure.
The dual objective of the present work is first to evaluate the role of sodium hydroxide-treated sawdust on the reinforcement of the structure of geopolymer materials. Secondly, study the impact of this additive on the porosity of the resulting composite materials for an application as an adsorbent, for cationic pollutants in aqueous media.
Practically, pristine or sodium hydroxide-treated sawdust were added at different percentages in geopolymer formulation (metakaolin and sodium waterglass). After characterization and compressive strength measurements of the composite materials, pollutants diffusion through composite materials was evaluated by adsorption of methylene blue used as a model cationic pollutant. This method consisted in exploiting the adsorption kinetics data of this cationic dye to determine the diffusion parameters (based on appropriate kinetic models) depending on the formulations considered. Methylene blue (MB) was used as the model compound because of its positive charge which ensures good adsorption by the negative geopolymer matrix. The stability in a large pH range and the easy quantification of this cationic dye were also important parameters. The study was performed on three different particle sizes (400–250 μm, 1000–400 μm and 2000–1000 μm) in order to ensure that the trends observed will remain valid regardless the particle sizes of the composite materials considered. It would thus be possible to extrapolate the results obtained to larger particles of composite materials. The most efficient materials were finally applied for cobalt ions adsorption in aqueous solution.
Materials and experimental methods
Chemicals
Sodium waterglass (molar ratio SiO2/Na2O of 1.6) was provided by Ingessil and cobalt nitrate hexahydrate (99%) from Aldrich. 2,2′-Bipyridine (99%), NaOH (96%) and methylene blue hydrate (MB) (≥97.0%) were purchased from Sigma-Aldrich. All other chemicals were of analytical grade.Sawdust preparation
Sawdust was obtained from Ayous, a tropical soft wood. An Ayous sample was finely grounded and the fraction with particles diameter ranging between 100 μm and 200 μm (named S) were collected. The alkaline pre-treatment was adapted from the experimental procedure described in literature.23 Typically, 50 g of the lignocellulosic material was dispersed in 1 L of NaOH 3 M and the mixture stirred for 18 h. The solid was recovered by filtration and thoroughly washed with deionized water until a neutral filtrate obtained. After drying in open air and then in an oven at 105 °C, the alkaline treated sawdust (TS) was stored in a sealed bag.Metakaolin preparation
The kaolin used in this work was collected in the locality of Mayouom (West region of Cameroon) and ground for 30 min using a ball mill (MGS, Srl). The powder was sieved to obtained particles with diameter less than 125 μm. The obtained powder was calcined in an electric furnace (MGS, Srl) up to 700 °C at heating rate of 5 °C min−1. An isotherm was held at 700 °C for 4 h to ensure the complete conversion of kaolin into metakaolin (named MK).Synthesis of geopolymer composites
Geopolymer reference (named G) was prepared by mixing sodium waterglass and MK (mass ratio sodium waterglass/MK of 0.83) in a mortar for about 5 min. The homogenous paste obtained was moulded in cubic moulds (40 mm × 40 mm × 40 mm) in triplicate and cured at ambient temperature (28 °C) for 24 h. The solid samples were demoulded and sealed in a plastic bag for a 28 days curing. In the case of geopolymers–sawdust composites, a fraction of MK was replaced by S or TS to obtain mass percentages of 1, 2, 4, 7 and 10 wt%. Waterglass was added to this mixture and the geopolymers synthesised as described above. Samples obtained were named according to the type (S or TS) or the amount of the additive: G–Sx or G–TSx. Where x (0, 1, 2, 4, 7 and 10 wt%) represents the amount of additive.Characterization methods
The compressive strength of the geopolymer composites samples were determined according to the DIN 1164 standard on a Impact Test Equipment Limited (UK KA20 3LR), using an automatic hydraulic press with a 250 kN capacity at a constant loading rate of 0.500 MPa s−1.The XRD analyses were performed on the Bruker D8 Advance, equipped with LynXeye XE T detector detecting CuKα1,2 in Bragg–Brentano geometry with 2θ ranging from 5 to 80° (2θ). The crystalline phases were identified using X'Pert HighScore Plus software.
Fourier Transform Infrared Spectra were collected on a Bruker Vertex 80v using the KBr method. The spectra were collected on pellets prepared by mixing proper amounts of samples and KBr. The spectral resolution was set at 2 cm−1.
For scanning electron microscopy (SEM) observation, the samples were first coated with gold before analysis on a Jeol XFlash 6160 Bruker Scanning Electron Microscope, operating on the secondary electron imaging (SEI) with acceleration voltage of 15.0 kV and emission current of 56.6 μA.
For optical microscope images, sawdust particles and fragments of geopolymer composites were observed using an AB instrument optical microscope equipped with a digital camera.
Points of zero charges (PZC) were determined as follow. In series of vials, 10 mL of aqueous solutions of NaNO3 0.1 M at pHs ranging between 2 and 11 were introduced. These initial pHs (pHi) were controlled by adding sodium hydroxide or nitric acid aqueous solutions in vials and monitored using a pH-meter. 20 mg of treated sawdust or geopolymer materials were added in each vial, stirred for 2 h and stored at ambient. The pHs of the supernatants (pHf) were recorded after two days. The PZC represents the intercept of the curve pHi − pHf = f(pHi) with the abscissa.
Adsorption experiments
 | (1) |
The kinetic experimental data obtained were fitted using the non-linearized forms of the pseudo-first and pseudo-second order kinetic models. The contribution of diffusion to the adsorption processes was investigated by analyzing experimental data with the external diffusion model coupled to the pore and surface mass diffusion model.
For desorption experiments, HCl 0.01 M, NaCl 0.01 M and BiPy (0.01 M) were used as desorption media. Typically, 25 mg of the adsorbent loaded with the metal was dispersed in 5 mL of desorption solution. The vial was sealed and stirred for 24 h at 250 rpm on an orbital shaker. The desorbed Co(II) was quantified and the desorption percentage (Des%) determined using eqn (2).
 | (2) |
Results and discussion
Characterization of geopolymer composites
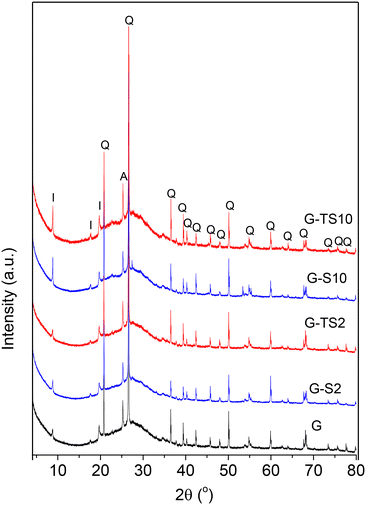
These results are a proof that the presence of sawdust does not significantly modify the reaction between metakaolin and sodium waterglass. Sawdust thus mainly act as a simple additive with minor contribution on the chemical processes that occurred during geopolymerization.
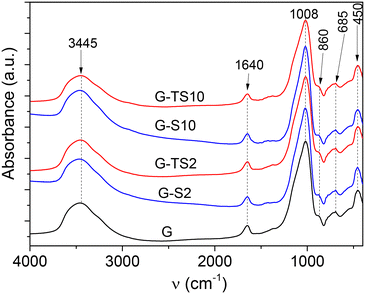
The FTIR spectra of pristine and sodium hydroxide treated sawdust (Fig. S3†) showed the typical bands reported in literature and assigned to the presence of the main lignocellulosic material macromolecules (cellulose, hemicelluloses and lignin).19,23 The broad band at 2891 cm−1 was assigned to C–H bonds of aliphatic groups, the intense band at 1027 cm−1 attributed to C–O bonds of alcohol groups and ether bonds.
The bands at 3340 cm−1 and 1648 cm−1 were assigned to physisorbed water molecules. These bands were not present in the spectra of composite material, certainly because of the law relative abundance of additive in the materials. Meanwhile, almost perfectly superimposed FTIR spectra of composite materials regardless the nature and the percentage of incorporated lignocellulosic material once again confirmed that the geopolymerization process was poorly affected by the presence of the organic compound.
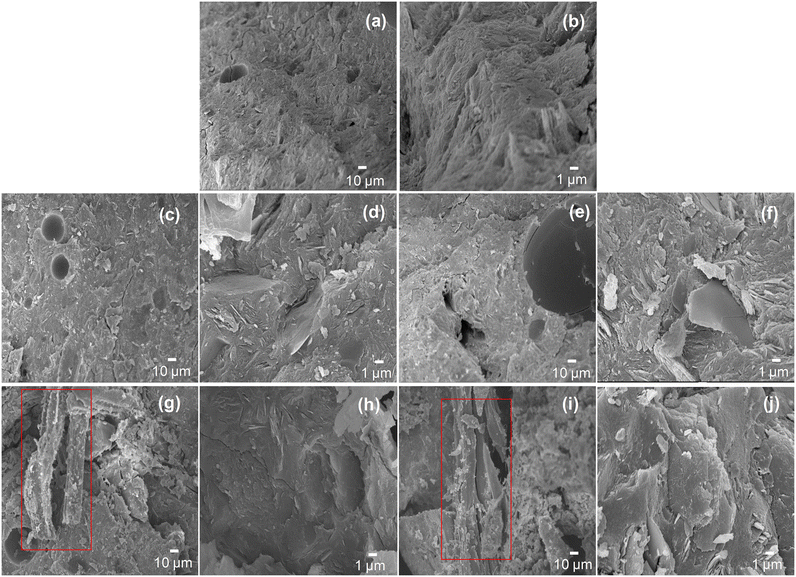
It can be observed that the geopolymer material without sawdust addition showed a coarse microstructure while the images of geopolymer composites after incorporation of 2 wt% of untreated or treated sawdust displayed a more homogeneous, compact and denser matrices. Samples containing 10 wt% of additive showed heterogeneous microstructures, certainly due to the excess of sawdust that prevents long range geopolymerization. These sawdust particles (highlighted by red rectangles in Fig. 3) appeared as thin fibers, reminiscent of vegetal cells.
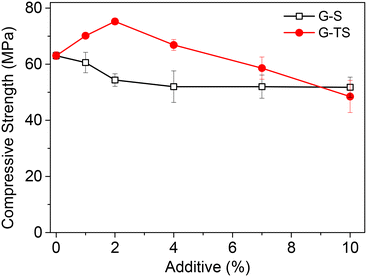
The compressive strengths of metakaolin-based geopolymer composites using untreated sawdust as an additive decreased when the amount of the lignocellulosic material in the formulation (from 63.04 MPa at 0% to 52.01 MPa at 7%) was increased. These results indicate the loss of this mechanical property, certainly due to the less important compressive strength of Ayous sawdust (36.62 MPa parallel to fibers)36 compared to that of the geopolymer matrix. When NaOH-treated sawdust was used as an additive, the compressive strength first increased with the amount of filler (from 63.04 MPa at 0% to 75.22 MPa at 2%). This was followed by the lowering of the compressive strength (48.48 MPa) at 10%. The increase of compressive strength could be due to the strong interactions between sawdust particles and the geopolymer matrix. These interactions could be of hydrogen bonding type between the hydroxyl functionalities of sawdust particles (hydrogen-bonds donor and acceptors) and the oxygen atoms (hydrogen bonds acceptors) of the –Si–O–Si–O–Si–O–Al– chains.
Compared to untreated sawdust particles, the NaOH treatment resulted in an increase of the surface OH groups, due to partial delignification of the lignocellulosic material. These interactions favoured the homogenous distribution of sawdust particles in the matrix and then promote the increase of the compressive strength. The optical microscope images of the composite materials presented in Fig. S4† confirmed the good dispersion of sawdust particles in the geopolymer matrix. Despite these favourable interactions, a significant amount of sawdust in the composite resulted in a decrease of the compressive strength probably because of the poor long-range polymerization observed.
The compressive strengths obtained in this work were compared with those of some geopolymer–biomass composites found in the literature (Table 1).
These composites generally present lower compressive strength values compared to those recorded in this work. This could be due not only to the alkaline treatment, but also to the small size of the sawdust particles used as additive.
Effect of the amount of sawdust on methylene blue diffusion through composites
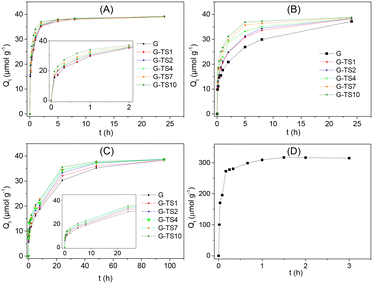
Only the composites obtained with NaOH-treated sawdust was used in this section, due to the excellent mechanical properties displayed.The decrease of the adsorption rate was assigned to the implication of the less available inner adsorption sites. The formation of the plateau indicates the achievement of the equilibrium marked by the saturation of the entire adsorption sites. The shape of these different domains depends both on the sawdust amounts in the composite materials and on the particle size. Thus, regarding the amount of sawdust in the composite, adsorption on the pure geopolymer was the slowest process. The presence of increasing amounts of sawdust facilitates the adsorption process, marked by a faster formation of the plateau. The presence of sawdust therefore seems to accelerate the adsorption process. The increase of particles size resulted in the increase of the time required to reach equilibrium. In the case of G, 10 h, 24 h and 92 h were necessary to reach equilibrium for particles sizes 400–250 μm, 1000–400 μm and 2000–1000 μm respectively.
The kinetic curve obtained using only sawdust (0.2 g L−1) equivalent to that present in G–TS10 is presented in Fig. 5(D). This curve showed a fast adsorption process (equilibrium reached after only 1 hour) and maximum adsorption capacity at least 9 times greater than that obtained with composite materials. The difference observed compared to composite materials was explained by the higher performance of sawdust compared to geopolymer, for the adsorption of this dye.
For efficient analysis of the experimental data, classical kinetic models (pseudo-first and pseudo-second order kinetic models) and those allowing the interpretation of the diffusion processes (surface diffusion and surface and internal diffusion models) were applied.
| Qt = Qe(1 − e−k1t) | (3) |
 | (4) |
The non-linear fitting obtained from the experimental data recorded on different composites of different particles size, are presented as ESI† (Fig. S5). The constants extracted from these curves were summarized in Table S1.† The pseudo-second-order model was found more suitable for data analysis (R2 in the range 0.84 to 0.99) compared to the pseudo-first order model (R2 in the range 0.77 to 0.87). Initial adsorption rates (h determined from eqn (5)) obtained from this model was compared to evaluate the impact of the particles size and the percentage of sawdust within the composite material on the adsorption process.
| h = K2qe2 | (5) |
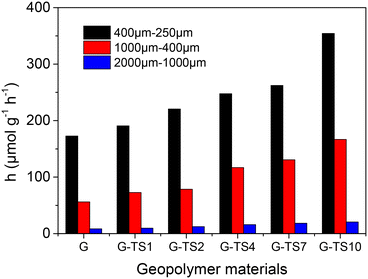 | ||
| Fig. 6 Variation of initial adsorption rate as a function of particles size and the amount of sawdust in the composites. | ||
The initial adsorption rates decreased when particles size was increased. This trend was due to the poor availability of adsorption sites when the particle sizes of adsorbents increase. The adsorption sites close to the surface of the particles were easily accessible because of the fast diffusion of the adsorbate. This phenomenon was confirmed by the important equilibrium time recorded for the larger particles (Fig. 5). Furthermore, the initial adsorption rates increased with the amount of sawdust in the composites. The presence of sawdust improved the accessibility of adsorption sites to MB. This result can be rationalized by considering the greater porosity of sawdust compared to geopolymer that facilitates the diffusion of the adsorbate within the composite materials. The high value of the initial adsorption rate recorded on sawdust (8789 μmol g−1 h−1) at least 25 times greater than those obtained on composite materials confirmed this hypothesis.
Considering the importance of the adsorbate diffusion process towards variable particles size and different composite materials formulations, the experimental kinetic data were analyzed using kinetic models essentially based on diffusion.
 | (6) |
 | (7) |
 | (8) |
The plots obtained by applying linear transformations of these models on experimental data are presented as ESI† (Fig. S6). The constants obtained from these curves were summarized in Table S2.†
To facilitate the analysis of the results obtained, the values of the surface diffusion equilibrium constants and the diffusion coefficients were plotted in Fig. 7 as a function of particles size and the amount of sawdust in the composite materials. The surface mass transfer does not seem to be strongly affected by the presence of sawdust in the geopolymer or by the particle size of the composites. Regardless the particles size, minor variations were observed (kf values were in the range 3.55 × 10⁻³ cm s−1 and 4.82 × 10⁻³ cm s−1). This could be explained by the fact that kf is determined from experimental data obtained during surface adsorption of MB.
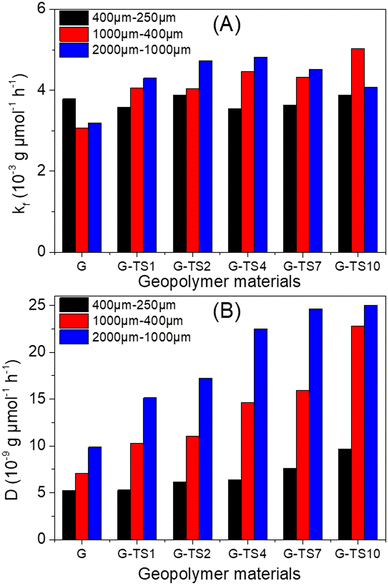 | ||
| Fig. 7 Variations of (A) surface diffusion equilibrium constants and (B) diffusion coefficients as function of particles size and the amount of sawdust in the composite materials. | ||
In the present case, small amounts of an additive should have almost no effect on the adsorption at surface sites. Therefore, only the geopolymer matrix was expected to dominate the surface mass transfer. This hypothesis was confirmed when considering the kf value of Ayous sawdust alone (17.64 × 10⁻³ cm s−1), at least 3 times higher than that of composite materials.
Regarding the values of diffusion coefficient (D), there was a strong increase when considering both the particles size and the amount of sawdust in the composites. The presence of sawdust therefore promotes the diffusion of the adsorbate within the materials. Since the lignocellulosic material was less compact than the geopolymer phase, its particles dispersed within the materials facilitate MB diffusion within the materials. This diffusion was also improved by the good distribution of the sawdust particles within the geopolymers (even GP-S10 showed no sawdust particles agglomeration) as showed by optical microscope images (Fig. S4†).
The increase of the value of D with the particles size was due to the greater contribution of internal diffusion when the particle size increases. Indeed, D is the sum of the contributions of the surface and internal diffusions.
B N (Biot number) values (eqn (9)) were determined from kf and D values (Table S2†) to identify the type of diffusion that controls the adsorption process.
 | (9) |
Application for cobalt(II) removal
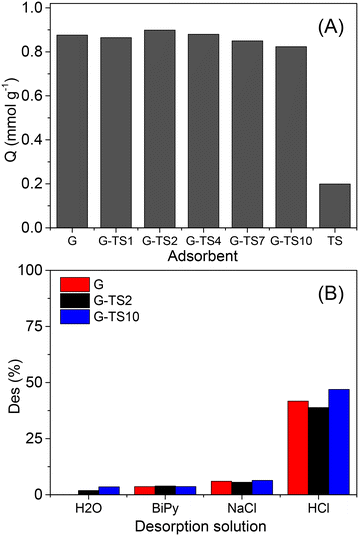
The management of water pollution by heavy metals represents an actual environmental concern. Cobalt holds an important place among this class of contaminants regarding its implication in several technological and industrial fields such as electronics, batteries, production of specialized alloys, pigments synthesis amongst other.45–47 Cobalt mining, metal production followed by these diverse applications naturally results in environmental pollution. The development of effective depollution processes thus represents a major challenge.48–51 The ability of the composite materials synthesized in this work to adsorb cations has been exploited for the adsorption of Co(II) ions in aqueous solution.The variation of Co(II) adsorption capacity as a function of adsorbent type (treated sawdust, geopolymer or geopolymer composites) is depicted in Fig. 8(A). Only the geopolymer composites with particle size 400–250 μm were used for these experiments. Minor variations were observed on the performances of composite materials as the adsorption capacities values were ranging between 0.82 mmol g−1 (for G–TS10) to 0.90 mmol g−1 (for G–TS2). These performances even not fully optimized were relatively highest compared to low-cost adsorbent presented in the literature. Meanwhile adsorbent based on slag geopolymer or modified graphene, showed comparable or higher adsorption capacities (see Table 2).
| Adsorbent | Q (mg g−1) | Ref. |
|---|---|---|
| γ-Alumina | 75.78 | 49 |
| Multi-walled carbon nanotubes | 78.94 | 49 |
| Modified polymeric adsorbents | 61.34 | 52 |
| Pre-treated 2-Hypnea valentiae algae | 16.66 | 53 |
| Montmorillonite | 6.92 | 54 |
| Aminated graphene oxide | 116.35 | 55 |
| Mesoporous silica composite | 185.23 | 56 |
| Raw shrimp shells | 7.692 | 57 |
| NaOH activated slag based geopolymer | 91.21 | 58 |
| KOH activated slag based geopolymer | 192.31 | 58 |
| Pyrophyllite based geopolymer | 7.18 | 59 |
| Metakaolin based geopolymer | 69.23 | 60 |
| Sawdust | 11.74 | This work |
| Sawdust–geopolymer composite | 48.51–51.84 | This work |
Surprisingly, the adsorption capacity reported in the case of treated sawdust (0.20 mmol g−1) was at least 4 times less important. These results showed poor correlation with MB adsorption data, where the opposite trend was observed, marked by the highest performance with TS. This indicates that the adsorption of the two cationic compounds on geopolymer and geopolymer-composite materials occurs through different mechanisms. Thus, the ion exchange between the exchangeable cations of the geopolymer and the Co(II) in solution could not solely explain the high performance obtained. It is well-known that geopolymers synthesized with alkaline activators are generally basic. This property was confirmed in the present work by experimental values of points of zero charge (PZC) ranging between 9.67 (for G) and 10.29 (for G–TS10) (see ESI,† Fig. S7), confirming the presence of basic surface groups. During adsorption, these basic groups certainly favored the microprecipitation of Co(II) as hydroxides (Co(OH)2) (with solubility constant (Ks) of 13 × 10−15) inside the pores of the geopolymers, and thus explained the significant adsorption capacities obtained. Similar mechanism during heavy metals removal by adsorption was reported in the literature.61,62 TS on the other hand showed the lowest PZC (7.62) that could not allow Co(II) surface precipitation.
The desorption of adsorbed Co(II) was performed in order to evaluate the potential reuse of the adsorbents. 0.01 M aqueous solutions of HCl, NaCl and BiPy were used as desorption media. For comparison purposes, deionized water was also used as desorption medium. The results obtained are presented in Fig. 8(B). Deionized water, NaCl and BiPy solutions showed minor Co(II) desorption as indicated by the values of desorption percentages, lower than 6.5%. These results indicate the strong adsorption of Co(II) on geopolymer materials. Moreover, the poor performance of NaCl solution confirmed that Co(II) adsorption onto geopolymer was not a simple cation exchange process. The use of HCl solution, on the other hand afforded higher desorption percentages (around 40%). This result can be explained by the solubilization of the cobalt hydroxide present at the surface of the geopolymer materials, by the acidic solution. This result therefore confirmed the adsorption of Co(II) on geopolymer materials as hydroxides. However, the desorption percentages recorded remained low to justify the reuse of adsorbents. The use of a more concentrated acid solution could be required, but would result in the degradation of the geopolymer materials.
Conclusion
The dual objective of the present work was to evaluate the effect of sodium hydroxide-treated sawdust on the reinforcement of the structure of a geopolymer material (obtained from reaction between metakaolin and sodium waterglass) and to study the contribution of this natural and renewable additive on the porosity of the resulting composite materials Series of geopolymer materials containing varying amounts of sawdust were first successfully synthesized as indicated by the good dispersion of sawdust particles and the formation of sialate and siloxo bonds. An improvement of the compressive strength was observed for small amounts of pretreated sawdust (maximum value obtained at 2%) added in the formulations. Methylene blue adsorption was used efficiently to evaluate the impact of sawdust on the diffusion of cationic compounds within the geopolymer structure. The presence of treated-sawdust increases the porosity of the geopolymer as indicated by the increase of MB adsorption rate and diffusion coefficients. A preliminary work on Co(II) ions adsorption revealed good performances marked by higher and comparable adsorption capacities regardless the amount of sawdust used in the composite. The present work therefore demonstrates that sawdust can be effectively used as reinforcing material to improve not only the compressive strength but also to enhance and control the porosity of geopolymers for applications in adsorption. In the future, it would be interesting to study the effects of pretreated sawdust on other essential mechanical properties of geopolymers as well as adsorption of other heavy metals. Interestingly, the difficult desorption of the adsorbed Co(II) ions suggests a potential use for the sequestration (immobilization) of radioactive waste and other harmful metal cations.Data availability
The data supporting this article have been included as part of the ESI.†Conflicts of interest
There are no conflicts to declare.Acknowledgements
The authors acknowledge the International Science Program (ISP) – Sweden through funding provided to the African Network of Electroanalytical Chemists (ANEC).Notes and references
- M. F. Noor-ul-Amin, K. Muhammad and S. Gul, J. Cleaner Prod., 2016, 129, 491–495 CrossRef CAS.
- L. Li, S. Wang and Z. Zhu, J. Colloid Interface Sci., 2006, 300, 52–59 CrossRef CAS PubMed.
- İ. Kara, D. Yilmazer and S. T. Akar, Appl. Clay Sci., 2017, 139, 54–63 CrossRef.
- K. Liang, X. Q. Wang, C. L. Chow and D. Lau, J. Environ. Manage., 2022, 322, 116066 CrossRef CAS.
- J. L. Provis and J. S. J. Van Deventer, Geopolymers: structures, processing, properties and industrial applications, Woodhead, Oxford, 2009 Search PubMed.
- T. Cheng, M. Lee, M. Ko, T. Ueng and S. Yang, Appl. Clay Sci., 2012, 56, 90–96 CrossRef CAS.
- F. J. López, S. Sugita and T. Kobayashi, Chem. Lett., 2013, 43, 128–130 CrossRef.
- F. J. López, S. Sugita, M. Tagaya and T. Kobayashi, J. Mater. Sci. Chem. Eng., 2014, 02, 07 Search PubMed.
- A. Naveed, S. F. Noor-ul-Amin, M. Khraisheh, M. Al Bakrid and S. Gul, Desalin. Water Treat., 2019, 161, 126–131 CrossRef CAS.
- M. Youmoue, R. T. T. Fongang, A. Gharzouni, R. C. Kaze, E. Kamseu, V. M. Sglavo, I. K. Tonle, B. Nait-Ali and S. Rossignol, SN Appl. Sci., 2020, 2, 642 CrossRef CAS.
- X. Zang, C. Bai, Y. Qiao, X. Wang, D. Jia, H. Li and P. Colombo, Composites, Part A, 2021, 150, 106629 CrossRef.
- B. Panda, S. C. Paul, L. J. Hui, Y. W. D. Tay and M. J. Tan, J. Cleaner Prod., 2017, 167, 281–288 CrossRef CAS.
- L. Yan, B. Kasal and L. Huang, Composites, Part B, 2016, 92, 94–132 CrossRef CAS.
- H. R. Rasouli, F. Golestani-Fard, A. R. Mirhabibi, G. M. Nasab, K. J. D. MacKenzie and M. H. Shahraki, Ceram. Int., 2015, 41, 7872–7880 CrossRef CAS.
- M. C. Acar, A. I. Celik, R. Kayabası, A. Sener, N. Özdöner and Y. O. Özkılıc, J. Mater. Res. Technol., 2023, 24, 81–89 CrossRef CAS.
- P. Duan, C. Yan, W. Zhou and W. Luo, Constr. Build. Mater., 2016, 111, 600–610 CrossRef CAS.
- N. Ranjbar and M. Zhang, Cem. Concr. Compos., 2020, 107, 103498 CrossRef CAS.
- C. P. Nanseu-Njiki, G. K. Dedzo and E. Ngameni, J. Hazard. Mater., 2010, 179, 63–71 CrossRef CAS PubMed.
- G. K. Dedzo, C. P. Nanseu-Njiki and E. Ngameni, Talanta, 2012, 99, 478–486 CrossRef PubMed.
- C. B. Njine-Bememba, G. K. Dedzo, C. P. Nanseu-Njiki and E. Ngameni, Holzforschung, 2015, 69, 347–356 CrossRef CAS.
- B. N. Ngana, G. K. Dedzo, C. P. Nanseu-Njiki and E. Ngameni, Electroanalysis, 2019, 31, 383–389 CrossRef CAS.
- B. N. Ngana, P. M. T. Seumo, L. M. Sambang, G. K. Dedzo, C. P. Nanseu-Njiki and E. Ngameni, J. Environ. Chem. Eng., 2021, 9, 104984 CrossRef CAS.
- L. M. Sambang, G. K. Dedzo, S. Rigolet and E. Ngameni, Sustainable Chem. Pharm., 2023, 33, 101068 CrossRef CAS.
- E. P. Aigbomian and M. Fan, Constr. Build. Mater., 2013, 40, 361–366 CrossRef.
- D. Dai and M. Fan, Ind. Crops Prod., 2015, 74, 417–424 CrossRef CAS.
- V. Corinaldesi, A. Mazzoli and R. Siddique, Constr. Build. Mater., 2016, 123, 281–289 CrossRef CAS.
- D. C. Pereira, G. Amaral-Labat and G. F. B. S. Lenze, Ceramica, 2019, 65, 104–109 CrossRef CAS.
- H. Ye, B. Asante, G. Schmidt, A. Krause, Y. Zhang and Z. Yu, J. Cleaner Prod., 2023, 420, 138381 CrossRef CAS.
- A. Sales, F. R. Souza, W. N. Santos, A. M. Zimer and F. C. R. Almeida, Constr. Build. Mater., 2010, 24, 2446–2453 CrossRef.
- A. Sales, F. R. Souza and F. C. R. Almeida, Constr. Build. Mater., 2011, 25, 2793–2798 CrossRef.
- S. Jurado-Contreras, E. Bonet-Martínez, P. J. Sánchez-Soto, O. Gencel and D. Eliche-Quesada, Arch. Civ. Mech. Eng., 2022, 22, 121 CrossRef.
- A. Tironi, M. A. Trezza, A. N. Scian and E. F. Irassar, Constr. Build. Mater., 2012, 28, 276–281 CrossRef.
- H. K. Tchakouté, C. H. Rüscher, J. N. Y. Djobo, B. B. D. Kenne and D. Njopwouo, Appl. Clay Sci., 2015, 107, 188–194 CrossRef.
- A. K. Kronenberg, H. F. B. Hasnan, C. W. Holyoke III, R. D. Law, Z. Liu and J. B. Thomas, Solid Earth, 2017, 8, 1025–1045 CrossRef.
- Z. Ghasemi and H. Younesi, Waste Biomass Valoriz., 2012, 3, 61–74 CrossRef CAS.
- E. Gennari, R. Picchio, D. Tocci and A. L. Monaco, Environ. Sci. Proc., 2021, 3, 27 Search PubMed.
- E. Agnoli, R. Ciapponi, M. Levi and S. Turri, Materials, 2019, 12, 1004 CrossRef CAS PubMed.
- A. Sudagar, S. Andrejkovičová, C. Patinha, A. Velosa, A. McAdam, E. F. da Silva and F. Rocha, Appl. Clay Sci., 2018, 152, 196–210 CrossRef CAS.
- R. A. J. Malenab, J. P. S. Ngo and M. A. B. Promentilla, Materials, 2017, 10, 579 CrossRef PubMed.
- H. Ye, Y. Zhang, Z. Yu and J. Mu, Constr. Build. Mater., 2018, 173, 10–16 CrossRef CAS.
- Y. S. Ho and G. Mckay, Resour., Conserv. Recycl., 1999, 25, 171–193 CrossRef.
- Y. Liu and Y. J. Liu, Sep. Purif. Technol., 2008, 61, 229–242 CrossRef CAS.
- Q. Li, L. Chai, Z. Yang and Q. Wang, Appl. Surf. Sci., 2009, 255, 4298–4303 CrossRef CAS.
- N. Dizge, C. Aydiner, E. Demirbas, M. Kobya and S. Kara, J. Hazard. Mater., 2008, 150, 737 CrossRef CAS PubMed.
- J. Edel, G. Pozzi, E. Sabbioni, R. Pietra and S. Devos, Sci. Total Environ., 1994, 150, 233–244 CrossRef CAS PubMed.
- D. Barałkiewicz and J. Siepak, Pol. J. Environ. Stud., 1999, 8, 201–208 Search PubMed.
- B. L. Finley, A. D. Monnot, S. H. Gaffney and D. J. Paustenbach, J. Toxicol. Environ. Health, 2012, 15, 493–523 CrossRef CAS PubMed.
- T. Dewangan, A. Tiwari and A. Bajpai, J. Dispersion Sci. Technol., 2009, 30, 56–60 CrossRef CAS.
- M. H. Dehghani, K. Yetilmezsoy, M. Salari, Z. Heidarinejad, M. Yousefi and M. Sillanpää, J. Mol. Liq., 2020, 299, 112154 CrossRef CAS.
- P. Yang, J. Wang, S. Wang, C. Yang, P. Zhao, B. Huang, Q. Wang and H. Wang, ACS Omega, 2022, 7, 37452–37464 CrossRef CAS PubMed.
- A. Irshad, M. Atif, A. Ghani, B. Ali, S. A. Ahmad and M. Alex, Sci. Rep., 2023, 13, 7356 CrossRef CAS PubMed.
- F. Maleki, M. Gholami, R. Torkaman, M. Torab-Mostaedi and M. Asadollahzadeh, Environ. Technol. Innovation, 2021, 24, 102054 CrossRef CAS.
- L. Vafajoo, R. Cheraghi, R. Dabbagh and G. Mckay, Chem. Eng. J., 2018, 331, 39–47 CrossRef CAS.
- W. Hu, S. Lu, W. Song, T. Chen, T. Hayat, N. S. Alsaedi, C. Chen and H. Liu, Appl. Clay Sci., 2018, 157, 121–129 CrossRef CAS.
- F. Fang, L. Kong, J. Huang, S. Wu, K. Zhang, X. Wang, B. Sun, Z. Jin, J. Wang, X. Huang and J. Liu, J. Hazard. Mater., 2014, 270, 1–10 CrossRef CAS PubMed.
- R. Awual, M. Hasan, A. Islam, A. M. Asiri and M. M. Rahman, J. Mol. Liq., 2020, 298, 112035 CrossRef.
- G. Gök, H. Kocyigit, O. Gök and H. Celebi, Chem. Eng. Res. Des., 2022, 186, 229–240 CrossRef.
- Q. Su, L. Deng, Q. Ye, Y. He and X. Cui, ACS Omega, 2020, 5, 23898–23908 CrossRef CAS PubMed.
- L. Panda, S. S. Rath, D. S. Rao, B. B. Nayak, B. Das and P. K. Misra, J. Mol. Liq., 2018, 263, 428–441 CrossRef CAS.
- I. Kara, D. Tunc, F. Sayin and S. T. Akar, Appl. Clay Sci., 2018, 161, 184–193 CrossRef CAS.
- N. A. A. Qasem, R. H. Mohammed and D. U. Lawal, npj Clean Water, 2021, 4, 36 CrossRef CAS.
- P. Arokiasamy, M. M. A. B. Abdullah, S. Z. A. Rahim, M. Sadique, L. Y. Ming, M. A. A. M. Salleh, M. R. R. M. A. Zainol and C. M. R. Ghazali, J. Mater. Res. Technol., 2023, 22, 126–156 CrossRef CAS.
Footnote |
| † Electronic supplementary information (ESI) available: Characterization (XRD and FTIR) of precursors; optical images of composites and adsorption experiments for porosity determination. See DOI: https://doi.org/10.1039/d4lf00176a |
| This journal is © The Royal Society of Chemistry 2024 |

