 Open Access Article
Creative Commons Attribution 3.0 Unported Licence
Li2MnCl4 single crystal: a new candidate for a red-emitting neutron scintillator†
Vojtěch
Vaněček‡
 *ab,
Robert
Král
a,
Kateřina
Křehlíková
a,
Romana
Kučerková
a,
Vladimir
Babin
 a,
Petra
Zemenová
a,
Jan
Rohlíček
a,
Zuzana
Málková
a,
Petra
Zemenová
a,
Jan
Rohlíček
a,
Zuzana
Málková
 a,
Terézia
Jurkovičová
a and
Martin
Nikl
 a
a
aInstitute of Physics of the Czech Academy of Sciences, Cukrovarnicka 10/112, Prague, 16200, Czech Republic. E-mail: vanecekv@fzu.cz
bIMR, Tohoku University, 2-1-1, Katahira, Aoba-ku, Sendai, Miyagi 980-8577, Japan
First published on 18th September 2024
Abstract
A novel red-emitting scintillator Li2MnCl4 is proposed as a candidate for thermal neutron detection. It features high Li content, low density, a low effective atomic number, and emission in the red-NIR region. These characteristics make it an interesting candidate for long-distance neutron detection in harsh environments e.g. decommissioning of nuclear power plants. The absorption is thoroughly investigated in the scope of the Tanabe–Sugano diagram. The luminescence mechanism in undoped Li2MnCl4 is studied in depth using steady-state and time-resolved photoluminescence. Doping with Eu2+ and Ce3+ is introduced as a trial to improve the scintillation efficiency. We show that in the Eu2+ and Ce3+ doped Li2MnCl4 the luminescence mechanism involves energy transfer from the dopants to Mn2+, and propose the local lattice distortion around the dopant and possible charge compensation mechanisms.
Introduction
Detection and spectroscopy of neutrons is crucial for applications ranging from large spallation sources1 to nuclear non-proliferation.2 The 3He shortage3 limits the future use of 3He proportional counters which are currently the most commonly used neutron detectors. The main source of 3He is radioactive decay for tritium. After World War 2 both USA and USSR kept large reserves of tritium for military uses. Therefore, an abundance of 3He was available as a byproduct of nuclear warfare. However, after the end of the Cold War, both the USA and USSR significantly lowered their tritium reserves and, as a result, production of 3He drastically dropped. Decreasing production of 3He together with increasing demand results in the inevitable depletion of 3He reserves and a steep increase in the price, which is becoming unaffordable for non-USA industry. Therefore, it is necessary to develop novel neutron detectors that would be able to replace 3He proportional counters in some applications. One of the fields where not only the replacement of 3He detectors but also advances in neutron detection are necessary are neutron scattering experiments at large spallation sources4 and decommissioning of nuclear power plants.5This work reports on the optical, luminescence and scintillation characteristics of undoped and Eu2+ and Ce3+ doped Li2MnCl4 single crystals. These materials are an interesting candidate for thermal neutron detection due to the high content of Li, low density, and a low effective atomic number. This combination of material properties is a prerequisite for an effective n/γ discrimination in mixed radiation fluxes which is a necessity in many applications. Moreover, emission in the red-infrared spectral region is favourable for pairing with modern semiconductor photodetectors.
Experimental
As starting materials powders of LiCl (99+%, Merck) and MnCl2 (97%, Thermo Fisher Scientific), EuS (99.99%, Changsha Easchem), and Ce2S3 (99.99%, Changsha Easchem) were used. Both LiCl and MnCl2 were further purified by the introduction of halogenating agents (HCl and COCl2) into the melt and successive zone refining (>20 passes of the melted zone) according to ref. 6 and 7. Material from the middle section of the zone refined ingot was selected for crystal growth for both LiCl and MnCl2. In the case of LiCl, the zone refined ingot was transparent and colourless. In the case of MnCl2, the zone refined ingot was deep red and formed flakes upon mechanical stress. Such behaviour is typical for divalent halides with layered crystal structures e.g. MgCl2, CdCl2, CdBr2, CdI2, or PbI2. Stoichiometric amounts of purified LiCl and MnCl2 (and EuS or Ce2S3) were weighed into fused silica ampoules and sealed under vacuum using an oxygen–hydrogen torch. The crystals were grown using a single zone inductively heated vertical Bridgman furnace as described in ref. 8. During the entire growth, the furnace was continuously evacuated using a rotary vane pump to minimize heat transfer via convection and therefore prevent the unwanted chimney effect. This results in a steeper temperature gradient and a more stable temperature profile. The pressure was maintained at approx. 1 Pa during the entire growth. The growth rate was 0.6 mm h−1, and the cooling time was 40 hours.For the X-ray powder diffraction (XRPD) analysis, the crystal samples were powdered in an alumina mortar and pestle and placed in the ∅ 0.5 mm borosilicate-glass capillary in an atmosphere-controlled glovebox (concentration of O2 and H2O < 1 ppm). The capillary was sealed with rubber to prevent the degradation of the sample during the measurement. Powder diffraction data were collected using the Debye–Scherrer transmission configuration on an Empyrean, PANalytical powder diffractometer (λCu,Kα = 1.54184 Å) that was equipped with a focusing mirror, a capillary holder, and a PIXcel3D detector.
Radioluminescence (RL) spectra, measured in the spectral range of 190–800 nm at room temperature, were obtained using a custom-made spectrofluorometer 5000 M, Horiba Jobin Yvon. Tungsten-cathode X-ray tube Seifert was used as the excitation source (at 40 kV, 15 mA). The detection part of the set-up consisted of a single grating monochromator and photon-counting detector TBX-04, Horiba, or an Ocean Optical CCD detector (based on the spectral range). The measured spectra were corrected for the spectral response of the setup. Photoluminescence decays were measured at 5000 M using multichannel scaling and time-correlated single photon counting techniques under the excitation of a microsecond flashlamp (μs-ms time scale) and nanosecond nanoLED (sub-μs time scale) excitation sources, respectively. To extract the true decay times, the measured decays were fitted by a sum of exponential terms convoluted with the instrumental response to the excitation pulse.
Non-isothermal DSC was carried out using the Setaram Themys 24 apparatus. The nominal charge of 65 mg of the powder Li2MnCl4 material was sealed in a quartz ampule under vacuum. Sealing the Li2MnCl4 powder under vacuum in a small quartz ampule enabled the simulation and monitoring of heat conditions similar to those present during the Li2MnCl4 crystal growth by the Bridgman method. All DSC experiments were carried out with a heating rate of 10 K min−1 in the temperature range of 25–650 °C and with an empty sealed quartz ampule in alumina crucible as a reference. The DSC apparatus was calibrated in the temperature range of 25–1300 °C using the following standards (In, Sn, Zn, Al, Ag, and Au). The standard deviation of performed calibrations was in the range of ±1 K. Processing of the obtained data was carried out using the Calisto Processing software.
The ratio of lithium and manganese in the Li2MnCl4 monocrystal samples was determined by flame atomic absorption spectrometry (FAAS). Samples with weights ranging from 5.8 mg to 8.5 mg were slowly heated in 3 mL HCl (1![[thin space (1/6-em)]](https://www.rsc.org/images/entities/char_2009.gif) :
:![[thin space (1/6-em)]](https://www.rsc.org/images/entities/char_2009.gif) 1) (HCl purchased from P-Lab, Czech Republic) and fully decomposed. When the temperature of the samples decreased, they were transferred into 100 mL volumetric flasks and 7 mL of KCl (with a concentration of 6 g of KCl in 100 mL) was added to decrease the ionization of lithium. Finally, distilled water was added to the volume of 100 mL in a volumetric flask. The calibration curve was prepared by combining both elements using lithium and manganese standard solutions in the same way as sample solutions. A Varian AA240 FAAS (Varian Inc., Palo Alto, California, US) equipped with Li and Mn hollow cathodes (Varian Inc., Palo Alto, California, US) was used for the elemental concentration determination. The instrument conditions, such as wavelengths (670.8 nm for Li and 403.1 nm for Mn, respectively), 1.0 nm slit width, 10 cm burner, and the air-acetylene flame were employed according to the standard recommendations for both elements.9 All the solutions were manually injected. The concentration of Li and Mn were determined from the concentration curves and subsequently, the ratio of Li and Mn in the samples was calculated. The relative standard deviation of determination was 2%.
1) (HCl purchased from P-Lab, Czech Republic) and fully decomposed. When the temperature of the samples decreased, they were transferred into 100 mL volumetric flasks and 7 mL of KCl (with a concentration of 6 g of KCl in 100 mL) was added to decrease the ionization of lithium. Finally, distilled water was added to the volume of 100 mL in a volumetric flask. The calibration curve was prepared by combining both elements using lithium and manganese standard solutions in the same way as sample solutions. A Varian AA240 FAAS (Varian Inc., Palo Alto, California, US) equipped with Li and Mn hollow cathodes (Varian Inc., Palo Alto, California, US) was used for the elemental concentration determination. The instrument conditions, such as wavelengths (670.8 nm for Li and 403.1 nm for Mn, respectively), 1.0 nm slit width, 10 cm burner, and the air-acetylene flame were employed according to the standard recommendations for both elements.9 All the solutions were manually injected. The concentration of Li and Mn were determined from the concentration curves and subsequently, the ratio of Li and Mn in the samples was calculated. The relative standard deviation of determination was 2%.
Due to the hygroscopic nature of used materials, great care was taken to prevent degradation via reaction with moisture. Whenever possible handling of all hygroscopic materials (starting materials, zone refined ingots, grown crystals, etc.) was performed in the atmosphere-controlled glovebox using dry nitrogen (concentration of O2 and H2O < 1 ppm) as the protective atmosphere. When manipulation outside of the glovebox was necessary the materials were placed inside fused silica ampoules closed with a vacuum-tight valve or seal. However, due to technical limitations, most of the optical characterization was performed under ambient conditions. Whenever possible samples were immersed in/coated by luminescence-free immersion oil (Fluka) to suppress the degradation process.
Results and discussion
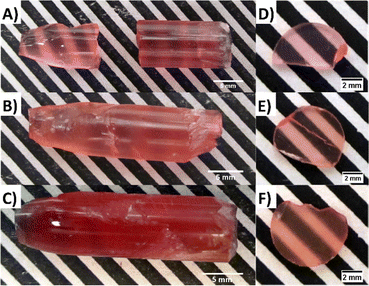
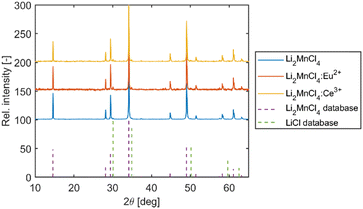
The crystal growth under optimized conditions resulted in homogeneous boules with no macroscopic defects. The undoped crystal is transparent and pink in colour while both Eu2+ and Ce3+ doped samples are deep red, which limits their transparency (see Fig. 1A–C). Cut and polished disc-like samples with dimensions of ∅ 7 × 1.5 mm were prepared for all three crystals (see Fig. 1D–F).The XRD measurement was performed on the powder Li2MnCl4 (LMC) samples (selected from the middle of the as-grown crystal) confirming the presence of the Li2MnCl4 phase (see Fig. 2). Li2MnCl4 exhibits a spinel crystal structure (space group Fd![[3 with combining macron]](https://www.rsc.org/images/entities/char_0033_0304.gif) m, no. 227, phase prototype MgAl2O4). Using a general spinel formula:
m, no. 227, phase prototype MgAl2O4). Using a general spinel formula:
| (A1−xBx)tet[Ax/2B1−x/2]oct2X4, |
| (Li)tet[Li0.5Mn0.5]oct2Cl4, |
To further elucidate the composition of the grown crystals, the Li![[thin space (1/6-em)]](https://www.rsc.org/images/entities/char_2009.gif) :
:![[thin space (1/6-em)]](https://www.rsc.org/images/entities/char_2009.gif) Mn molar ratio was measured using flame atomic absorption spectroscopy (FAAS). Samples from the start (conic part) and the end (cylindrical part) of the grown undoped crystals were analysed. The FAAS results revealed that in the samples taken from the start (first-to-freeze) and the end (last-to-freeze) of the as-grown undoped Li2MnCl4 the atomic ratio of Li
Mn molar ratio was measured using flame atomic absorption spectroscopy (FAAS). Samples from the start (conic part) and the end (cylindrical part) of the grown undoped crystals were analysed. The FAAS results revealed that in the samples taken from the start (first-to-freeze) and the end (last-to-freeze) of the as-grown undoped Li2MnCl4 the atomic ratio of Li![[thin space (1/6-em)]](https://www.rsc.org/images/entities/char_2009.gif) :
:![[thin space (1/6-em)]](https://www.rsc.org/images/entities/char_2009.gif) Mn is close to the ideal stoichiometry (see Table 1). However, the results point toward the slight depletion of Li towards the end of the growth. This could be caused by high lithium mobility in Li2MnCl4 crystals. The ionic mobility of Li+ in several chloride spinels with composition Li2BX4 where B = Mn, Cd, Mg, and Fe and X = Cl or Br11–13 was investigated in the 1980s for application as solid Li electrolytes. The temperature-dependent conductivity measurements showed that the conductivity of the melt is only twice as high as the conductivity of the solid sample just below the melting point.12 Such a high ionic conductivity could result in significant Li+ migration in the solid phase during crystal growth.
Mn is close to the ideal stoichiometry (see Table 1). However, the results point toward the slight depletion of Li towards the end of the growth. This could be caused by high lithium mobility in Li2MnCl4 crystals. The ionic mobility of Li+ in several chloride spinels with composition Li2BX4 where B = Mn, Cd, Mg, and Fe and X = Cl or Br11–13 was investigated in the 1980s for application as solid Li electrolytes. The temperature-dependent conductivity measurements showed that the conductivity of the melt is only twice as high as the conductivity of the solid sample just below the melting point.12 Such a high ionic conductivity could result in significant Li+ migration in the solid phase during crystal growth.
| Sample | m [mg] | m(Mn) [mg] | m(Li) [mg] | Li![[thin space (1/6-em)]](https://www.rsc.org/images/entities/char_2009.gif) : :![[thin space (1/6-em)]](https://www.rsc.org/images/entities/char_2009.gif) Mn Mn |
|---|---|---|---|---|
| s1 | 8.1 | 2.12 | 0.54 | 2.02![[thin space (1/6-em)]](https://www.rsc.org/images/entities/char_2009.gif) : :![[thin space (1/6-em)]](https://www.rsc.org/images/entities/char_2009.gif) 1.00 1.00 |
| s2 | 6.5 | 1.71 | 0.42 | 1.95![[thin space (1/6-em)]](https://www.rsc.org/images/entities/char_2009.gif) : :![[thin space (1/6-em)]](https://www.rsc.org/images/entities/char_2009.gif) 1.00 1.00 |
| e1 | 8.5 | 2.2 | 0.54 | 1.95![[thin space (1/6-em)]](https://www.rsc.org/images/entities/char_2009.gif) : :![[thin space (1/6-em)]](https://www.rsc.org/images/entities/char_2009.gif) 1.00 1.00 |
| e2 | 6.8 | 1.78 | 0.43 | 1.91![[thin space (1/6-em)]](https://www.rsc.org/images/entities/char_2009.gif) : :![[thin space (1/6-em)]](https://www.rsc.org/images/entities/char_2009.gif) 1.00 1.00 |
The DSC measurement revealed two endothermic effects at onset temperatures of 442 ± 3 °C and 573 ± 1 °C (see Fig. S1a, ESI†) on the heating curve and 459 ± 1 °C and 570 ± 1 °C (see Fig. S1b, ESI†) on the cooling curve. Both effects were reproducibly detected in four heating–cooling cycles. Therefore, it is assumed that the effects are reversible. The endothermic effect at around 450 °C was reported by several authors,11,14,15 Lutz et al.15 ascribed this effect to the phase transition from spinel to the defect rock salt structure. Such phase transition might result in residual stress in the as-grown crystals. However, no cracking of the crystals during processing was observed. The second effect at 573 ± 1 °C is ascribed to congruent melting of the high-temperature Li2MnCl4 phase and corresponds well with the values reported in the literature.14,15 Interestingly, undercooling of only 3 °C was observed. This effect is probably caused by the low volume-to-surface ratio of the sample and the large contact surface of the melt with the quartz ampule which serves as a heterogeneous nucleation centre.
Absorption spectra
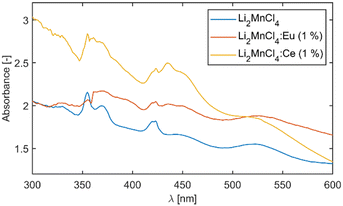
The measurement of absorption was complicated due to the continuous degradation of the sample during measurement. The degradation results in the formation of a structured surface which leads to a strong scattering of light. Such scattering manifests as a diffuse background which is non-linearly increasing towards shorter wavelengths. Therefore, reliable estimation of the optical band gap from the absorption edge was impossible. This effect is also responsible for the atypical shape of the absorption spectra at longer wavelengths. Since the measurements proceeded from the long wavelength side of the spectrum the beginning of the measurement is heavily affected by ongoing degradation of the sample. Nevertheless, distinct absorption bands could be observed for all three samples (see Fig. 3).The absorption spectrum of the undoped sample was analysed in the scope of the Tanabe–Sugano diagram. The positions of the absorption bands were extracted via fitting. To suppress the influence of the diffuse background on the position of the absorption bands the first derivative of the absorption spectrum was fitted assuming the Gaussian shape of the absorption bands (see Fig. S2, ESI†). The use of six Gaussian components resulted in a satisfactory fit in the range from 2 eV (620 nm) to 4 eV (310 nm). The vast majority of the experimental points are within 95% prediction bounds of the used model. Although the peak centred around 3.36 eV (370 nm) is quite asymmetric which results in lower accuracy of the fit, the goodness of fit is still satisfactory. The asymmetric shape of the absorption band might be caused by the superposition of two bands. For illustration, Fig. S3 (ESI†) shows a comparison between the measured absorption spectra and the normalized spectrum reconstructed from the first derivative fitting. The positions of all six bands were compared to the d5 Tanabe–Sugano diagram. The best agreement (least squares) was at Dq/B = 9.1 which corresponds to a value of Racah parameter B = 725 ± 7 cm−1. The decrease of B compared to free ion value Bfree(Mn2+) = 860 cm−1 (ref. 16) is due to the nephelauxetic effect. The value B/Bfree of 0.84 is reasonable compared to 0.95 for MnF2, 0.90 for NaCl:Mn2+,16 or 0.88 for CaCl2:Mn2+.17
Fig. 4 depicts the absorption spectra of undoped Li2MnCl4 with an indication of band positions and their assignment based on the d5 Tanabe–Sugano diagram. The double peak with maxima around 420 nm is due to coinciding 6A1g (6S) → 4A1g (4G) and 6A1g (6S) → 4Eg (4G) transitions and no direct assignment between the two can be currently made. The mean maxima position was used for the calculation of the B Racah parameter.
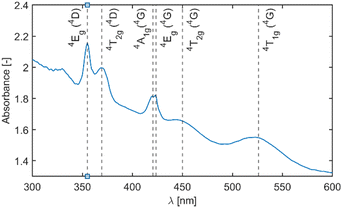 | ||
| Fig. 4 Absorption spectra of undoped Li2MnCl4 with indication of band positions and their assignment based on the d5 Tanabe–Sugano diagram. | ||
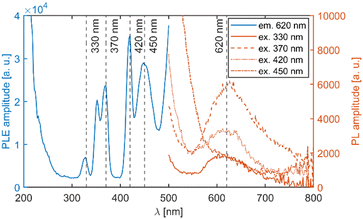
Fig. 5 depicts a section of the d5 Tanabe–Sugano diagram18 with an indication of the Dq/B = 9.1. Transitions from the ground sextet to all quartets can be observed in the absorption spectra. The only exception is transition 6A1g (6S) → 4T1g (4P) which should be positioned around 320 nm. The position roughly correlates with a weak deformed peak at 330 nm. Therefore, we assume that the absorption band centred at 330 nm corresponds to the 6A1g (6S) → 4T1g (4P) transition. The PLE measurements are in agreement with this assumption (see Fig. 6 below).
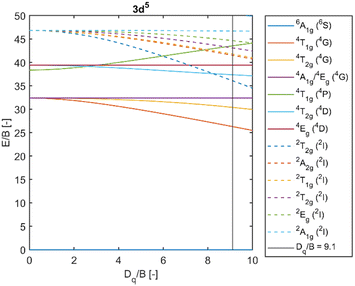 | ||
| Fig. 5 Section of the d5 Tanabe–Sugano diagram with indication of the Dq/B = 9.1. Doublet levels are in dashed lines. Reproduced from ref. 18. | ||
Transitions from the ground sextet to the doublet levels (2I) exhibit very low oscillator strength due to high difference in spin number, i.e. strongly spin/forbidden transitions. Therefore, these transitions should not be observable. However, the overlap of the 6A1g (6S) → 4T2g (4D) and 6A1g (6S) → 2T2g (2I) transitions might be the reason for the asymmetry of the 6A1g (6S) → 4T2g absorption band. The ascription is consistent with the available literature.19–22
Photoluminescence spectra
Photoluminescence decay kinetics
Photoluminescence decays were evaluated to get a better insight into the luminescence mechanism in Li2MnCl4:X (X = Eu2+, Ce3+).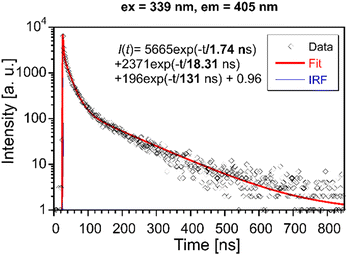 | ||
| Fig. 9 PL decay curve of Li2MnCl4:Eu (λex = 339 nm, λem = 405 nm). Red solid line is convolution of function I(t) and instrumental response function IRF. | ||
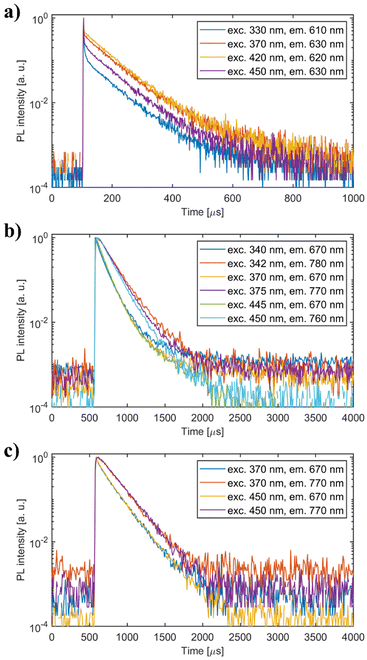 | ||
| Fig. 10 PL decay curves of (a) undoped Li2MnCl4 (b) Li2MnCl4:Eu2+ and (c) Li2MnCl4:Ce3+. Excitation and emission wavelengths are noted in the legend. | ||
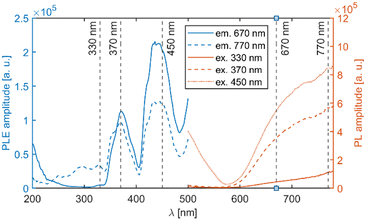
The mean decay time is 53 ns. Such a value is much lower than expected (and reported for Eu2+ in chloride matrices27–29) for 5d → 4f emission of Eu2+ (∼1 μs) due to partial violation of the spin selection rule. However, the acceleration of PL decay kinetics is consistent with the presence of energy transfer from Eu2+ to Mn2+. The PL decay kinetics of the red emission band was monitored at 670 nm and 770 nm for both Eu2+ and Ce3+ doped samples (see Fig. 10). The excitation wavelengths were 340, 370, and 450 nm for Li2MnCl4:Eu (see Fig. 10b and Fig. S7, ESI†) and 370 and 450 for Li2MnCl4:Ce (see Fig. 10c and Fig. S8, ESI†). The results are summarized in Table 2. Generally, the PL decay times are longer for Ce doping. For both Eu and Ce doping the PL decay times are longer for emission at 770 nm compared to 670 nm. Moreover, the decay curves measured at 770 nm exhibit an observable rise time. This is a sign of a relatively slow (∼μs) energy transfer towards the emission centre with lower energy of emission. The results suggest that the red emission band in doped Li2MnCl4 is composed of at least two components with different decay kinetics. The prolongation of the decay times is attributed to (i) an increase of emission lifetime with emission wavelength30 and (ii) partial suppression of concentration quenching resulting from a larger Stokes shift.
| Mean decay time [μs] | |||||
|---|---|---|---|---|---|
| Li2MnCl4:Eu | Li2MnCl4:Ce | ||||
| em\ex | 340 nm | 370 nm | 450 nm | 370 nm | 450 nm |
| 670 nm | 129 | 131 | 115 | 172 | 171 |
| 770 nm | 171 | 162 | 151 | 209 | 215 |
Radioluminescence spectra
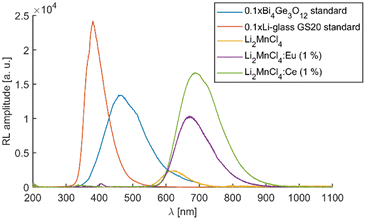
Similarly to the PL measurements, the RL emission of the doped samples exceeds the sensitive region of the used PMT. Therefore, the RL spectra were measured using both PMT and CCD-based photodetectors (see Fig. S9, ESI†). Fig. 11 depicts the RL spectra of all three samples in the range from 200 to 1100 nm together with the Bi4Ge3O12 reference sample and commercially available Li glass neutron scintillator GS20. The spectra were constructed by “glueing” data from PMT (200–800 nm) and CCD (400–1100 nm). The RL peak amplitude of undoped Li2MnCl4 was used to calculate amplitude ratios of both RL spectra (measured with PMT and CCD) because it is well reproduced in both ranges. The RL spectrum of Li2MnCl4:Eu shows a low-intensity band centred at 405 nm (see Fig. 11 and Fig. S10, ESI†). The position coincides very well with the PL band of Eu2+ 5d → 4f emission. A very weak structured band centred at around 350 nm is observed in all three samples (see Fig. S10, ESI†). In the Ce doped sample it seems to be overlapped with a different broad band. This could be due to the 5d → 4f emission of Ce3+. However, the extremely low intensity does not allow precise assignment of either of the bands. The RL efficiencies (integral of RL spectra) are 1.2, 6.6, and 12.2% of the BGO reference sample for undoped Li2MnCl4, Li2MnCl4:Eu, and Li2MnCl4:Ce respectively.The RL spectra of all three samples were fitted assuming a Gaussian band shape (see Fig. S11–S13, ESI†). For undoped Li2MnCl4 the spectrum is well fitted using single Gaussian centred at 1.97 eV (629 nm). This is in agreement with the assumption of single emission pathway 4T1g (4G) → 6A1g (6S). On the other hand, two Gaussians were necessary for a satisfactory fit of RL spectra of Eu2+ and Ce3+ doped samples (see Fig. S12 and S13, ESI†). The centres of the Gaussians coincide very well for both Eu2+ (1.88 eV and 1.76 eV) and Ce3+ (1.88 eV and 1.74 eV) doped samples. However, their relative contribution differs significantly. For the Eu2+ doped sample, the contributions are 32.4% and 67.6% for 1.88 eV (660 nm) and 1.76 eV (705 nm) respectively. For the Ce3+-doped sample, the contributions are 12.4% and 87.6% for 1.88 eV (660 nm) and 1.74 eV (713 nm) respectively. This would suggest that the nature of the luminescence centre is similar in both Eu2+ and Ce3+-doped samples. However, in the Ce3+ doped sample, the lower energy centre is excited more efficiently.
Luminescence mechanism in doped samples
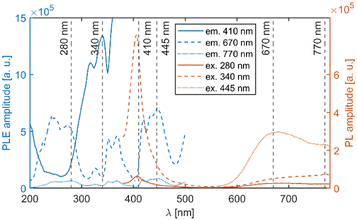
Based on the presented results we suggest a hypothesis explaining luminescence mechanisms in the Eu2+ and Ce3+ doped Li2MnCl4. The structure of Li2MnCl4 has two cationic crystallographic positions: tetrahedral one occupied by Li and octahedral one equally occupied by Li+ and Mn2+ (see XRPD results above). Due to the large size of Eu2+ and Ce3+ cations, they should preferentially occupy the octahedral position. The crystal radius of Eu2+ (1.31 Å) and Ce3+ (1.15 Å) is 35 and 18% larger than Mn2+ (0.97 Å) in 6-coordination respectively. Therefore, the substitution of Eu2+ or Ce3+ for Mn2+ (possibly even octahedrally coordinated Li+) results in the expansion of the substituted octahedra and consequentially compression of its neighbouring MnCl6 octahedra. Such compression results in a redshift of the 4T1g (4G) → 6A1g (6S) emission due to a stronger crystal field experienced by Mn2+ (see Fig. 5). The emission from compressed MnCl6 octahedra is less susceptible to concentration quenching due to larger Stokes shift. This effect could be further increased by the substitution of Cl− with S2− from the starting materials (EuS or Ce2S3). A higher negative charge of sulphur compared to chlorine increases the crystal field and therefore contributes to the redshift of the Mn2+ emission. Even though the segregation coefficient of sulphur should be very low it could incorporate into lattice as a charge compensation centre i.e. following charge compensated octahedra could be present in the Eu2+ or Ce3+ Li2MnCl4: (EuLiCl5S)5−,(EuMnCl6)4−, (CeLiCl4S2)5−, and (CeMnCl5S)4−. If such a charge compensation effect occurs a higher concentration of S2− is expected for Ce3+ doped samples. Of course, other charge-compensating defects like lithium vacancy or Cl− interstitial could also occur in the doped samples. The proposed effect together with efficient energy transfer from Eu2+ and Ce3+ to Mn2+ would explain both redshift and increased intensity of Mn2+ emission in Eu2+ and Ce3+ doped Li2MnCl4. However, further study is necessary to confirm or disprove the incorporation of sulphur into Li2MnCl4.Even though the PL decay kinetics of Mn2+ in Li2MnCl4 are too slow to be used as a scintillator in photon counting applications its emission matches very well an interval of 650–1000 nm which was identified by Matsukura et al.5 as a target for emission of scintillation for long-distance dose monitoring. This technique is being developed to monitor the dose under harsh conditions, e.g. during the decommissioning of the Fukushima nuclear powerplant site. Li2MnCl4:Ce could be used in a similar system for real-time monitoring of neutron flux. Encapsulation of Li2MnCl4:Ce in a polymer with a high hydrogen content could serve three purposes at once: a protective casing to prevent air exposure, a neutron moderator, and a light guide to limit light losses. Moreover, low density (ρ = 2.4 g cm−3) and effective atomic number (Zeff = 17.1) of Li2MnCl4 will result in a very low gamma detection efficiency, i.e., a low gamma background. However, the feasibility of such a device would have to be tested in the high-intensity mixed neutron gamma field ideally using fully enriched 6Li to maximize neutron detection efficiency.
Conclusions
We presented a novel red-emitting scintillator Li2MnCl4 which combines high Li content (28.5%at), low density (ρ = 2.4 g cm−3), and low effective atomic number (Zeff = 17.1). This makes Li2MnCl4 a promising candidate for remote neutron flux monitoring with low gamma background. In particular, for measurements in high flux mixed neutron-gamma fields. The luminescence mechanism in undoped Li2MnCl4 was investigated in detail and all the absorption and emission bands were assigned according to the Tanabe–Sugano diagram. Doping with Eu2+ and Ce3+ was investigated to improve the scintillation performance. Doping with Eu2+ and Ce3+ resulted in a 5.5 and 10 times increase in radioluminescence efficiency respectively which points to the dopant-enhanced energy transfer towards the Mn sublattice in the scintillation mechanism taking into account that the increase of the photoluminescence mean decay time of Mn2+ is less than 2.5 in doped samples compared to the undoped one (Table 2 and Table S3, ESI†). However, even for the best sample the RL efficiency is only 12.2% of the Bi4Ge3O12 reference sample which is presumably due to strong concentration quenching in the Mn-sublattice. The Mn2+ emission lifetime of about 21–22 ms17 was measured in the CaCl2 host at room temperature which is about 107× longer than the mean decay time measured for the Ce-doped Li2MnCl4 sample (Table 2). In the absence of concentration quenching, we could thus expect the integral efficiency of 107 × 12.2% > 1300% of BGO. Considering a typical BGO scintillation light yield of 8000 ph per MeV it provides an intrinsic light yield limit of LI2MnCl4-based material above 100![[thin space (1/6-em)]](https://www.rsc.org/images/entities/char_2009.gif) 000 ph per MeV.
000 ph per MeV.
Based on the presented data we propose a luminescence mechanism in Eu2+ and Ce3+ doped Li2MnCl4 involving energy transfer from the dopants to Mn2+, a local lattice distortion around the dopant and a possible charge compensation in case of the Ce3+ dopant. Distorted/perturbed Mn2+ sites near dopants show more red-shifted emission and lower susceptibility to concentration quenching. It consistently results in higher Mn2+ emission intensity in RL spectra and slower PL decay. Concentration quenching in the Mn2+ sublattice appears to be the main reason for the rather low scintillation efficiency of Li2MnCl4 -based materials in this study. Future work will be focused on diminishing this deteriorating process through the introduction of suitable near-infrared emitting dopants.
Author contributions
Vojtěch Vaněček – conceptualization, data curation, formal analysis, investigation, validation, visualization, writing – original draft, and writing – review & editing. Robert Král – conceptualization, funding acquisition, project administration, investigation, validation, supervision, and writing – review & editing. Kateřina Křehlíková – data curation, formal analysis, investigation, validation, visualization, and writing – review & editing. Kučerková Romana – data curation, formal analysis, investigation, and visualization. Vladimir Babin – data curation, formal analysis, investigation, and visualization. Petra Zemenová – data curation, formal analysis, and investigation. Jan Rohlíček – data curation, formal analysis, and investigation. Málková Zuzana – data curation, formal analysis, and investigation. Jurkovičová Terézia – data curation, formal analysis, and investigation. Martin Nikl – conceptualization, funding acquisition, project administration, supervision, and writing – review & editing.Data availability
Data for this article are available at “ASEP – Repository of the Czech Academy of Sciences” at https://doi.org/10.57680/asep.0587383.Conflicts of interest
There are no conflicts to declare.Acknowledgements
The work is supported by the Operational Programme Johannes Amos Comenius financed by the European Structural and Investment Funds and the Czech Ministry of Education, Youth and Sports Project No. SENDISO - CZ.02.01.01/00/22_008/0004596. This work was supported by JSPS KAKENHI Grant Number K24KF00040. This research was conducted in the scope of the Japanese Society for Promotion of Science standard fellowship.Notes and references
- I. Stefanescu, M. Christensen, J. Fenske, R. Hall-Wilton, P. F. Henry, O. Kirstein, M. Müller, G. Nowak, D. Pooley, D. Raspino, N. Rhodes, J. Šaroun, J. Schefer, E. Schooneveld, J. Sykora and W. Schweika, J. Instrum., 2017, 12, P01019 CrossRef.
- B. M. van der Ende, L. Li, D. Godin and B. Sur, Nat. Commun., 2019, 10, 1959 CrossRef CAS PubMed.
- R. T. Kouzes, A. T. Lintereur and E. R. Siciliano, Nucl. Instrum. Methods Phys. Res., Sect. A, 2015, 784, 172–175 CrossRef CAS.
- R. G. Cooper, Nucl. Instrum. Methods Phys. Res., Sect. A, 2004, 529, 394–398 CrossRef CAS.
- D. Matsukura, S. Kurosawa, C. Fujiwara, A. Yamaji, Y. Ohashi, Y. Yokota, K. Kamada, H. Sato, Y. Masao, T. Hanada, R. Murakami, T. Horiai, A. Yoshikawa, T. Takata and H. Tanaka, J. Instrum., 2024, 19, C02053 CrossRef.
- K. Nitsch, A. Cihlář, Z. Málková, M. Rodová and M. Vaněček, J. Cryst. Grow., 1993, 131, 612–615 CrossRef CAS.
- K. Nitsch, M. Dušek, M. Nikl, K. Polák and M. Rodová, Prog. Cryst. Growth Charact. Mater., 1995, 30, 1–22 CrossRef CAS.
- V. Vanecek, R. Kral, J. Paterek, V. Babin, V. Jary, J. Hybler, S. Kodama, S. Kurosawa, Y. Yokota, A. Yoshikawa and M. Nikl, J. Cryst. Grow., 2020, 533, 125479 CrossRef CAS.
- Flame Atomic Absorption Spectrometry Analytical methods, Agilent Technologies, Inc., Printed in Australia, 8th edn, 2010 Search PubMed.
- H. D. Lutz and M. Schneider, Z. Naturforsch. B, 1990, 45, 1543–1547 CrossRef CAS.
- R. Kanno, Y. Takeda and O. Yamamoto, Mater. Res. Bull., 1981, 16, 999–1005 CrossRef CAS.
- H. D. Lutz, W. Schmidt and H. Haeuseler, J. Phys. Chem. Solids, 1981, 42, 287–289 CrossRef CAS.
- W. Schmidt and H. D. Lutz, Ber. Bunsenges. Phys. Chem., 1984, 88, 720–723 CrossRef CAS.
- M. M. E. Jacob, S. Rajendran, R. Gangadharan, M. S. Michael and S. R. S. Prabaharan, Solid State Ionics, 1996, 86–88, 595–602 CrossRef CAS.
- H. D. Lutz, W. Schmidt and H. Haeuseler, Z. Anorg. Allg. Chem., 1979, 453, 121–126 CrossRef CAS.
- P. J. Alonso and R. Alcalá, J. Lumin., 1981, 22, 321–333 CrossRef CAS.
- U. Caldiño G. and J. Rubio O., Radiat. Eff. Defects Solids, 1993, 127, 83–91 CrossRef.
- Tanabe-Sugano diagrams via spreadsheets, https://wwwchem.uwimona.edu.jm/courses/Tanabe-Sugano/TSspread.html, (accessed 14 June 2024).
- R. Cao, Y. Rong, Y. Cao, B. Lan, C. Liao, J. Nie, F. Cheng and J. Wang, Mater. Res. Bull., 2023, 166, 112344 CrossRef CAS.
- G. K. B. Costa, S. S. Pedro, I. C. S. Carvalho and L. P. Sosman, Opt. Mater., 2009, 31, 1620–1627 CrossRef CAS.
- L. Qin, C. Chen, J. Wang, S. Bi, Y. Huang and H. J. Seo, Mater. Res. Bull., 2019, 118, 110494 CrossRef CAS.
- D. Castañeda, G. Muñoz H. and U. Caldiño, Opt. Mater., 2005, 27, 1456–1460 CrossRef.
- P. Dorenbos, J. Lumin., 2003, 104, 239–260 CrossRef CAS.
- P. Dorenbos, J. Phys.: Condens. Matter, 2003, 15, 575–594 CrossRef CAS.
- P. Dorenbos, J. Lumin., 2013, 135, 93–104 CrossRef CAS.
- E. Song, X. Jiang, Y. Zhou, Z. Lin, S. Ye, Z. Xia and Q. Zhang, Adv. Opt. Mater., 2019, 7, 1901105 CrossRef CAS.
- V. L. Cherginets, N. V. Rebrova, A. Y. Grippa, Y. N. Datsko, T. V. Ponomarenko, V. Y. Pedash, N. N. Kosinov, V. A. Tarasov, O. V. Zelenskaya, I. M. Zenya and A. V. Lopin, Mater. Chem. Phys., 2014, 143, 1296–1299 CrossRef CAS.
- M. Zhuravleva, B. Blalock, K. Yang, M. Koschan and C. L. Melcher, J. Cryst. Grow., 2012, 352, 115–119 CrossRef CAS.
- J. Selling, M. D. Birowosuto, P. Dorenbos and S. Schweizer, J. Appl. Phys., 2007, 101, 034901 CrossRef.
- B. Di Bartolo, Optical interactions in solids, World Scientific Publishing Company, 2010 Search PubMed.
Footnotes |
| † Electronic supplementary information (ESI) available. See DOI: https://doi.org/10.1039/d4ma00697f |
| ‡ JSPS International research fellow. |
| This journal is © The Royal Society of Chemistry 2024 |

