High-throughput screening of bifunctional catalysts for oxygen evolution/reduction reaction at the subnanometer regime†
Rahul Kumar
Sharma
,
Harpriya
Minhas
 and
Biswarup
Pathak
 *
*
Department of Chemistry, Indian Institute of Technology Indore, Indore 453552, India. E-mail: biswarup@iiti.ac.in
First published on 28th October 2024
Abstract
The development of low-cost, stable, and highly efficient electrocatalysts for the bifunctional oxygen evolution reaction (OER) and oxygen reduction reaction (ORR) is crucial for advancing future renewable technologies. In this study, we systematically investigated the OER and ORR performance of subnano clusters across the 3d, 4d, and 5d transition metal (TM) series of varying sizes using first-principles calculations. The fluxional identity of these clusters in the subnanometer regime is reflected in their non-monotonic catalytic activity. We established a size-dependent scaling relationship between OER/ORR intermediates, leading to a reshaping of the activity volcano plot at the subnanometer scale. Our detailed mechanistic investigation revealed a shift in the apex of the activity volcano from the Pt(111) and IrO2 surfaces to the Au11 clusters for both OER and ORR. Late transition metal subnano clusters, specifically Au11, emerged as the best bifunctional electrocatalyst, demonstrating significantly lower overpotential values. Furthermore, we categorized our catalysts into three clusters and employed the Random Forest Regression method to evaluate the impact of non-ab initio electronic features on OER and ORR activities. Interestingly, d-band filling emerged as the primary contributor to the bifunctional activity of the subnano clusters. This work not only provides a comprehensive view of OER and ORR activities but also presents a new pathway for designing and discovering highly efficient bifunctional catalysts.
1. Introduction
Developing sustainable and green technologies for efficient energy conversion is essential to meet the growing energy demands and ensure a secure, sustainable future.1,2 In this context, electrochemical energy conversion technology is the most promising technology, with applications in metal–air batteries, hydrogen-producing devices, and fuel cells.3–5 Notably, catalysts play a crucial role in these devices, facilitating a series of complex multistep reactions at the different electrodes. For instance, the oxygen evolution reaction (OER) and oxygen reduction reaction (ORR) are two core reactions in these energy storage devices that occur at the anode and cathode, respectively, determining the electrochemical reaction rates of these devices.6,7 However, these electrode reactions typically exhibit high overpotential values and sluggish kinetics owing to the multi-electron transfer process, which impedes their widespread commercialization.8,9 Therefore, developing suitable catalysts with high activity is essential for the practical application of energy-related devices. Currently, state-of-the-art electrocatalysts for OER and ORR primarily rely on precious metals such as Pt and IrO2.10–12 However, these precious metals’ scarcity, low selectivity, and high costs restrict their large-scale application, motivating researchers to develop low-cost electrocatalysts with excellent activity and stability under electrochemical conditions.13–15 In particular, designing efficient bifunctional electrocatalysts that facilitate both the OER and ORR in the same electrolyte is indispensable for the rapid development of regenerative fuel cells.Due to their unique electronic and structural properties, subnano clusters have emerged as an important class of electrocatalysts in heterogeneous catalysis.16 At finite temperatures, these molecular units possess a relatively flat potential energy surface (PES), leading to dynamic and non-Arrhenius behavior.17 Additionally, their multiple under-coordinated sites result in a fluxional identity, causing a non-monotonic catalytic activity relative to cluster size and element. Previously, Zandkarimi et al. demonstrated a breaking of the scaling relationship for ORR at the subnanometer regime, attributed to the fluxionality of bare and graphene-supported Ptn clusters (n = 1–6).18 Similarly, our group has also reported significant variations in ORR activity of graphene-supported Pt7,8 subnano clusters compared to their bulk counterparts.19 Additionally, theoretical investigations have focused on the computational screening of trimetallic clusters for OER and ORR.20 Recently, Zhang et al. observed a shift in the apex of the volcano peak from Pt to Au with transition metal (TMn) clusters (M = Pt, Pd, Au, and Ag, n = 1–6) for ORR.21 Despite the significance of these findings, a systematic exploration of high-performance subnanometer TMn clusters with varying elemental compositions and sizes is still lacking. Furthermore, the development of active bifunctional catalysts and the correlation between their catalytic activity and electronic descriptors of clusters in the subnanometer regime remain elusive.
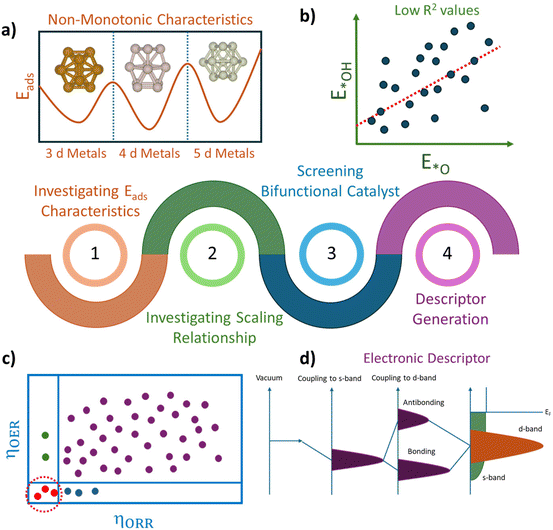
In this work, we focus on screening bifunctional electrocatalysts for the OER and ORR in the subnanometer regime using density functional theory (DFT). We characterized the fluxional identity of the subnano catalysts by systematically investigating the adsorption energy characteristics across 3d, 4d, and 5d transition metal clusters (TMn), where n = 7–15. The size-dependent scaling relationship between the adsorption energies indicates that the catalytic activity of subnano clusters significantly differs from their bulk counterparts. Furthermore, our systematic exploration of the four-electron OER and ORR mechanism in an acidic medium reveals a shift in the apex of the activity volcano plots for OER/ORR activity. Further, to understand the origins of bifunctional activity, we categorized the clusters into three groups and analyzed the impact of the electronic properties of the local chemical environment on the OER/ORR activity. Our study screens potential bifunctional catalysts and establishes a correlation between electronic properties and catalytic activities of subnano clusters, providing valuable guidance for designing efficient catalysts for OER and ORR activities (Scheme 1).
2. Results and discussion
2.1. Adsorption characteristics of OER/ORR intermediates
To understand the OER/ORR activity of the subnano clusters, we analyzed the adsorption characteristics of the principal intermediates (*O, *OH, and *OOH) within the subnanometer regime. Identifying the most stable geometries and adsorption positions for these intermediates is challenging owing to the diverse distribution and vast chemical space of subnano clusters. To address this, we extracted the previously reported optimized global minima (GM) geometries for 3d, 4d, and 5d transition metal subnano clusters, denoted as TMn (where n = 7–15).22 Tc and La were excluded from our investigation due to their radioactivity and toxicity.23 TMn clusters in this size regime predominantly exhibit non-bulk-like facets, with diverse coordination environments and electronic properties, distinguishing them from bulk counterparts like the Pt (111) surface. Unlike the highly symmetric configurations of larger TMn clusters (n = 38, 55, 79),24,25 their stable geometries show extensive structural diversity, including non-planar, planar, pentagonal bipyramidal, Mackay icosahedral, distorted icosahedral, pentagonal antiprism, and capped square or triangular bipyramids, among others. The irregular facets provide both saturated (highly coordinated) and unsaturated (low-coordinated) sites, contributing to fluxional behavior and disrupting conventional scaling relationships due to varying binding affinities.18 These structural variations lead to a non-monotonic change in catalytic activity with size and composition, offering opportunities to reshape conventional ORR volcano plots.Given the fluxionality of subnano clusters, resulting from multiple heterogeneous sites, we optimized multiple geometries of the single-intermediate adsorbed onto different active sites (top and bridge) of the clusters (>2000 configurations). Subsequently, using the Bell–Evans–Polanyi (BEP) principle, which states that a lower activation energy accompanies the most stable adsorption energy (Ea),26,27 we have extracted the most stable configurations for the further investigation of the OER/ORR reaction mechanism. Notably, 3-fold hollow positions are unstable adsorption sites for OER/ORR intermediates at the subnanometer regime and were excluded from our investigation.19,28 All calculations were performed for optimization using density functional theory (DFT) with the Vienna ab initio simulation (VASP) package.29 A detailed description of the computational method is provided in Text S1, ESI.† The adsorption energy of each intermediate (Eads) on the TMn is computed as follows:
| Eads = E(TMnX) − E(TMn) − E(X) | (1) |
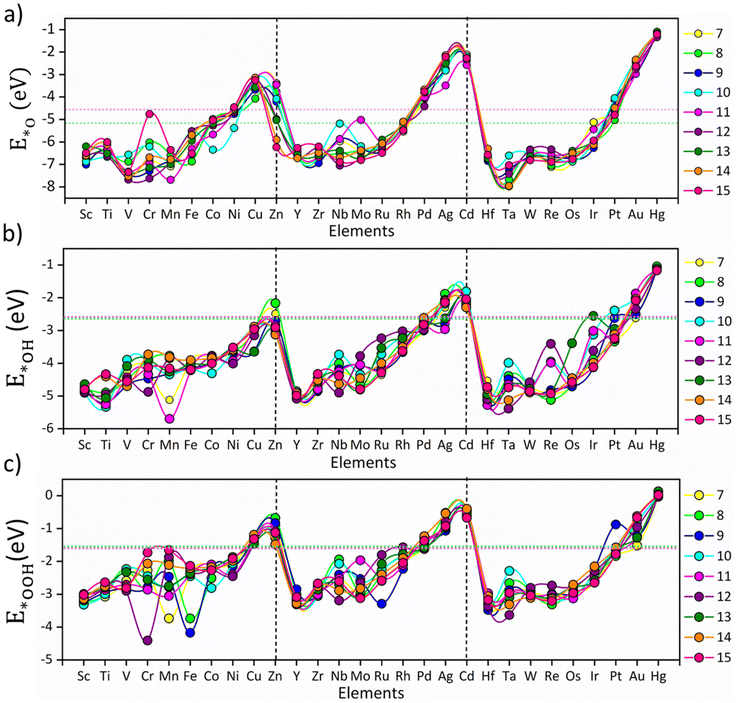
The size-specific values of Eads for *O, *OH and *OOH intermediates across the different TM series are summarized in Fig. 1. The non-monotonic distribution of E*O, E*OH, and E*OOH represents the fluxional behavior of the subnano clusters, contributing to their variable OER/ORR activity; however, a periodic pattern is observed for each intermediate across different TM series (Fig. 1). Specifically, E*O, E*OH, and E*OOH generally decrease upon transition from v1 (metals with one valence electron in the d-orbitals) to v10, indicating that strong electronic repulsion weakens the coupling between the cluster and the intermediates. Compared to the bulk Pt (111) surface and Pt79 nanoclusters,25 the majority of the subnano clusters exhibited a shift towards more negative Eads, indicative of stronger binding affinities due to their under-coordinated sites, except for TMn clusters with v10 configurations. The highest Eads are observed for Ta13 (−7.96 eV for E*O), Mn11 (−5.69 eV for E*OH), and Cr12 (−4.41 eV for E*OOH), while the lowest are found for Hg13 (−1.09 eV for E*O), Hg8 (−1.04 eV for E*OH), and Hg14 (+0.03 eV for E*OOH). These extremes represent a non-Sabatier range, where catalysts with very strong or weak Eads may lead to either poisoning or physisorption, thus reducing the overall catalytic activity. Overall, the distribution of Eads in the subnanometer regime demonstrates a strong dependence on the valence electrons in the d-orbitals.
2.2. Analyzing scaling relationship at subnanometer regime
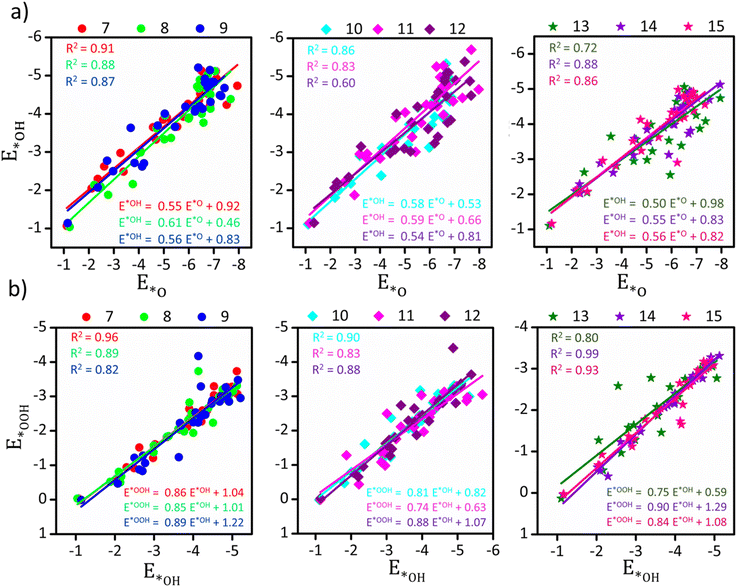
Scaling relationships are simple linear correlations between the thermodynamic properties of intermediates across different surfaces. However, these relationships impose intrinsic limitations on the maximum activity of the catalyst. Zandkarimi et al. previously demonstrated the breaking of the conventional scaling relationship between the ORR intermediates, attributed to the isomeric diversity and fluxional behavior of subnano clusters.18 Similarly, in our study, we examined the correlation between OER/ORR for our subnano catalysts, as depicted in Fig. 2.From Fig. 2, it is evident that the scaling relationship in the non-scalable regime is size-dependent across different TM series, with TM7 and TM12 representing the highest and lowest values of the coefficient of determination (R2 = 0.91 and 0.60 for E*Ovs. E*OH, respectively). Observing the overall distribution (Fig. S1†), we note a scaling relationship for subnano clusters with R2 = 0.84 and 0.88 (compared to R2 = 0.91 for bulk surfaces)18 between E*Ovs. E*OH and E*OHvs. E*OOH intermediates, respectively. The variable correlation across different sizes could be attributed to differences in the adsorption sites and changes in the electronic structure, resulting in varying Eads across different surfaces. In the investigation of scaling relationship, the slope of the best-fit line indicates the optimal electron density contribution from the clusters to the bound intermediates, specifically oxygen in our case.30 The computed slopes of E*Ovs. E*OH and E*OHvs. E*OOH varied from the expected values of 0.5 and 1.0, reflecting a decreased electron contribution to the bound oxygen atom (Fig. 2).30 This also signifies the inadequacy of the effective medium theorem for small clusters in generalizing Eads across subnano clusters.18 These results demonstrate the potential of size and transition metal variation to modify the scaling relationship and reshape the activity volcano plots in the subnanometer regime.
2.3. Evaluating the OER/ORR electrocatalytic performance
Next, we derived the OER and ORR reaction mechanism to screen for active electrocatalysts by simulating a four-electron reaction at 0 V (without any external potential) and 1.23 V (equilibrium potential) in an acidic medium.31 The elementary steps of both reactions are as follows:In an acidic medium, the OER is considered a four-step process as follows:
| * + H2O(l) → OH* + (H+ + e−) (ΔR1) |
| OH* → O* + (H+ + e−) (ΔR2) |
| O* + H2O(l) → OOH* + (H+ + e−) (ΔR3) |
| OOH* → O2(g) + (H+ + e−) + * (ΔR4) |
And the 4e− ORR is the reverse reaction of the OER with four-step as follows:
| O2 (g) + (H+ + e−) + * → OOH* (ΔR5) |
| OOH* + (H+ + e−) → O* + H2O(l) (ΔR6) |
| O* + (H+ + e−) → OH* (ΔR7) |
| OH* + (H+ + e−) → H2O(l) + * (ΔR8) |
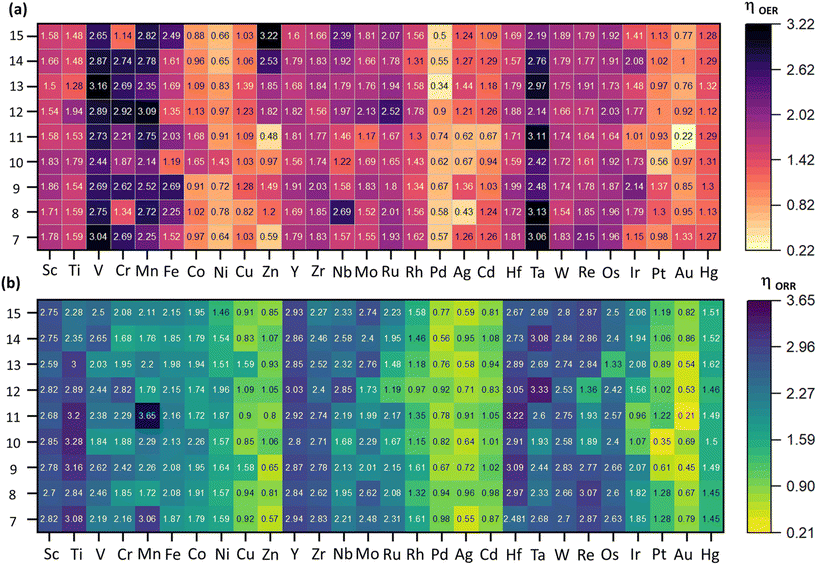
To compare the catalytic activity of the TMn subnano clusters, the overpotential values (η) of the rate-determining step (RDS) at 1.23 V were utilized to evaluate the OER/ORR performance of the catalyst,31 as depicted in Fig. 3. The theoretical overpotential at 1.23 V is calculated by the equation:
The two-electron pathway leading to peroxide formation was not investigated because of the unstable adsorption (breaking) of the H2O2 intermediates on subnano clusters, as reported in our previous investigations.19,28 The OER/ORR activity with respect to the size and element in the subnanometer regime is summarized in Fig. 3.
As depicted in Fig. 3, catalytic activity varies non-monotonically with size and elemental composition in the subnanometer regime. For the OER, Au11, Pd13, and Ag8 emerged as active electrocatalysts with lower ηOER values of 0.22, 0.34, and 0.43 V, respectively, with the RDS involving *OH → *O (ΔR2) formation (Fig. 3, Fig. S2†). These ηOER values are lower (or comparable) to traditional active OER catalysts, such as RuO2 (ηOER = 0.42 V) and IrO2 (ηOER = 0.56 V).32 Interestingly, Au11 also exhibits superior OER activity compared to previously theoretically reported carbon-based single-atom catalysts like N/C-coordinated graphene (Co-doped), C2N (Ni-doped), C3N4 (Ni-doped), graphdiyne (Co-doped), covalent organic framework (Cu-doped), and metal–organic framework (Co-doped), which show ηOER values of 0.46 V, 0.34 V, 0.96 V, 0.64 V, 0.69 V, and 0.29 V, respectively.33 In contrast, Zn15, V13, and Ta8 are identified as inactive OER electrocatalysts with significantly higher ηOER values of 3.22 V, 3.16 V, and 3.13 V respectively, with the RDS of *O → *OOH (ΔR3) formation. For the ORR, Au11, Pt10, and Au9 have emerged as active electrocatalysts with lower ηORR values of 0.21, 0.35, and 0.45 V, respectively. In contrast, Mn11, Ta12, and Ti10 are categorized as the poor electrocatalysts with higher ηORR values of 3.65 V, 3.33 V, and 3.28 V, respectively. For most electrocatalysts, the RDS for the ORR involves of *OH → H2O(l) (ΔR8) formation. However, for Ag8, Ag10, Au12, and Au15, the RDS is O2(g) → *OOH formation (ΔR5). Compared to an ideal system such as Pt (111) surface with ηORR = 0.45 V,34 these catalysts exhibit enhanced ORR activity. Conversely, for Au13, Au7, and Au11, the RDS involves the *OOH → *O + H2O(l) (ΔR6) formation, while for Ir11, Ru12, Pt10 and Ir13, the RDS constitutes the *O → *OH (ΔR7) formation. Interestingly, we observe size-dependent reshaping of the OER/ORR activity volcano in the subnanometer regime, where the apex of the plot shifts from benchmarked systems such as RuO2 and Pt (111) surface to the Au9, Au11, and Au8 subnano clusters. Apart from Au11 clusters, Pd13 and Pt10 clusters have also emerged as active catalysts for OER and ORR activity, respectively. For each active OER/ORR electrocatalysts in the subnanometer regime, the adsorption energy for each intermediate lies within −4.10 < Eads < −1.23 eV range (Table 1). This range of Eads could potentially be utilized to extract subnano clusters exhibiting optimal adsorption energetics and higher activity in the subnanometer regime.
| Reaction | Activity | Catalysts | *O (eV) | *OH (eV) | *OOH (eV) | Overpotential values (η) |
|---|---|---|---|---|---|---|
| OER | Active | Au11 | −2.97 | −1.87 | −1.28 | 0.22 |
| Pd13 | −3.79 | −2.81 | −1.58 | 0.34 | ||
| Ag8 | −2.77 | −1.88 | −0.52 | 0.43 | ||
| Inactive | Zn15 | −6.23 | −2.90 | −1.12 | 3.22 | |
| V13 | −7.36 | −4.08 | −2.32 | 3.16 | ||
| Ta8 | −7.67 | −4.39 | −2.66 | 3.13 | ||
| ORR | Active | Au11 | −2.97 | −1.87 | −1.28 | 0.21 |
| Pt10 | −4.05 | −2.39 | −1.61 | 0.35 | ||
| Au9 | −2.97 | −2.49 | −1.22 | 0.45 | ||
| Inactive | Mn11 | −7.68 | −5.69 | −3.05 | 3.65 | |
| Ta12 | −7.41 | −5.38 | −3.63 | 3.33 | ||
| Ti10 | −6.66 | −5.33 | −2.99 | 3.28 |
From Fig. 3, it is evident that TMn clusters with v1–v5 electronic configurations exhibited higher ηOER/ηORR values, rendering them unsuitable for both reactions in the subnanometer regime. Interestingly, compared to the early transition metal subnano clusters, the late transition metal subnano with v8–v10 configurations exhibited a significant decrease in ηOER and ηORR values (Fig. 3), making them suitable for fuel cell electrocatalysis.
2.4. Screening of potential bifunctional OER/ORR subnano catalysts
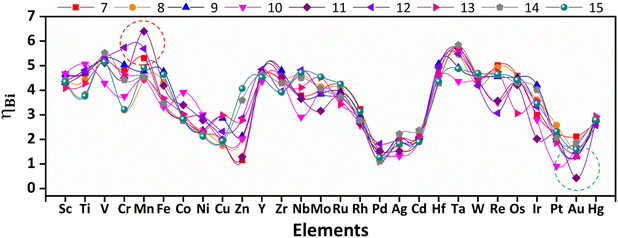
In fuel cells, OER corresponds to the charging process, while the ORR is associated with the battery discharge process. Therefore, to screen bifunctional subnano catalysts that facilitate both the OER and ORR in the subnanometer regime, we computed a widely accepted descriptor ηBi = ηOER + ηORR,35 where catalysts with lower ηBi exhibit high electrocatalytic performance, as shown in Fig. 4. The bifunctional catalytic activity demonstrates nonlinear variation with size and elemental composition, with subnano clusters featuring v9/v10 configuration exhibit lower ηBi values. Conversely, subnano clusters with v1–v5 configuration exhibit significantly higher ηBi values, indicating their inactivity as electrocatalysts in the subnanometer regime. Interestingly, Au11 emerged as the best bifunctional electrocatalysts with a low ηBi = 0.43 V. This value is even lower than the 1.01 V of Ru/C,36 which has been reported as the best bifunctional electrocatalyst. In contrast, Mn11 emerged as an inactive bifunctional electrocatalysts with a high ηBi = 6.40 V.2.5. Descriptors for bifunctional catalytic activity
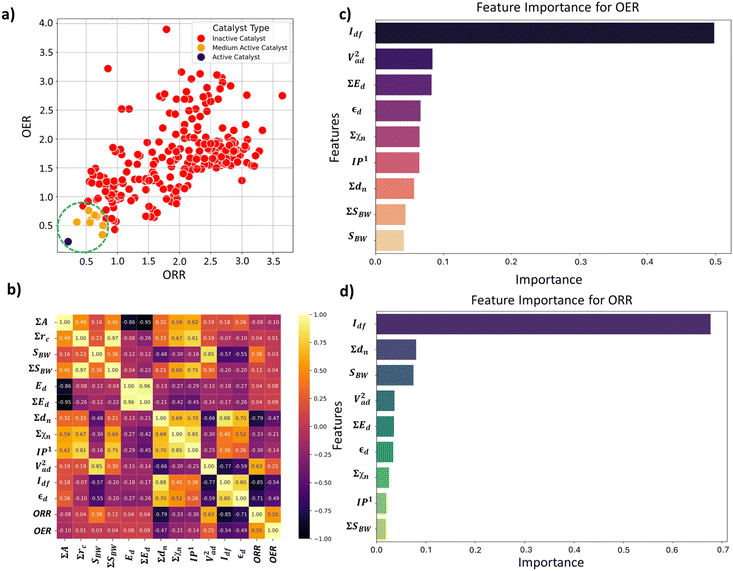
Furthermore, to screen the potential bifunctional electrocatalysts and gain deeper insights into the electronic descriptors affecting their activity, we categorized the bifunctional catalysts into three clusters: active, medium active, and inactive catalysts based on the η ranges listed in Table 2. The higher and lower limits of the ηOER and ηORR values were approximated based on the results of previous literature.4,19,28,35–41| Cluster | OER range (V) | ORR range (V) | Instances |
|---|---|---|---|
| Cluster 1 | 0.00 < η < 0.40 | 0.00 < η < 0.45 | 1 |
| Cluster 2 | 0.45 < η < 0.80 | 0.45 < η < 0.80 | 10 |
| Cluster 3 | 0.80 < η | 0.80 < η | 251 |
Furthermore, to elucidate the origin of bifunctional activities in our investigation, it is crucial to evaluate the descriptors that significantly influence OER and ORR activities. Therefore, to encode the electronic characteristics of TMn in our investigation, we extracted descriptors into three different categories: (1) elemental, (2) electronic, and (3) d-band specific features, as tabulated in Table 3. The elemental features provide a physical description of the TM. However, the electronic descriptors pertain to the electron acceptance/donation capability of different TM. Previous investigations have evidenced the d-band center (εd) as an effective descriptor to relate the catalysts’ electronic structure to the intermediates’ adsorption strength.24,42–44 However, considering the vast chemical space in our investigations, it becomes prohibitively expensive to extract εd with self-consistent quantum calculations. To circumvent this, we attempted to encode the elemental-specific numeric values of the d-band characteristics from the Solid State Table (relative to Cu) provided for the surfaces.45 Each feature regulates the inherent d-band electronic characteristics, which can be substituted without expensive DFT calculations. Note that the individual features (SBW, Ed, IP1, Vad2, Idf, and εd) correlates with the single metal atoms of the subnano clusters; however, the summation features (∑A, ∑rc, ∑SBW, ∑Ed, ∑dn, and ∑χn) are included to differentiate between the different-sized metal clusters.
| Category | Features | Symbol |
|---|---|---|
| Elemental | Sum of atomic weight | ∑A |
| Sum of covalent radii | ∑rc | |
| Bulk Wigner Seitz radii | S BW | |
| Sum of bulk Wigner Seitz radii | ∑SBW | |
| Electronic | d orbital energy | E d |
| Sum of d orbital energy | ∑Ed | |
| Sum of d electrons | ∑dn | |
| Sum of electronegativity | ∑χn | |
| First ionization potential (eV) | IP1 | |
| d-Band specific | Coupling matrix | V ad 2 |
| Idealized d band filling (size dependent) | I df | |
| Size-dependent d-band center | ε d |
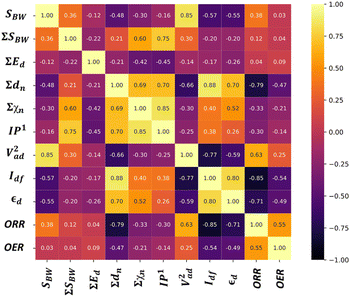
We analyzed the correlation plots of OER/ORR catalysts after categorizing them into active, medium active, and inactive catalysts, as shown in Fig. 5a. The linear correlation between the feature-feature and feature-OER/ORR activity can be assessed using the Pearson correlation coefficient (PCC).46,47 Most pairwise feature distributions, as shown in Fig. 5b, exhibited low correlation (|PCC| < 0.8), indicating their independent influence on catalytic activity, and were allowed to coexist. Note that features such as ∑A, ∑rc, Ed, and ∑Ed exhibited a significantly low correlation with the OER and ORR activity (|PCC| ∼ 0), suggesting they do not predict the changes in OER and ORR activity. Consequently, we removed highly correlated features that exhibited a low impact on ORR/OER activity from our final dataset to avoid data redundancy. The final list of features and their correlations is provided in Table 4. Overall, the OER and ORR activities of the subnano clusters can be described as follows:
| ηOER/ORR = f(SBW, ∑SBW, ∑Ed, ∑dn, ∑χn, IP1, Idf, εd) | (2) |
Following the feature selection process, we employed the Random Forest regression (RFR) to assess the feature importance towards OER and ORR activity, as shown in Fig. 5c and d. The RFR method is based on an ensemble of decision trees from which the prediction of a continuous variable is provided as the average of the prediction of all trees.48 Most importantly, the RFR model evaluates the significance of descriptors in the model by sequentially replacing each descriptor with random noise and observing the resulting decline in model performance, which is measured by the change in the mean-square-error (MSE) for the out-of-bag (OOB) validation data when the descriptor is replaced.48 Interestingly, Idf demonstrates the highest and equal contribution towards the OER and ORR activities, suggesting its effectiveness in identifying bifunctional active catalysts in the subnanometer regime. However, the contributions of the other features are low and offset each other, reflecting their unidirectional utilization towards either OER or ORR activity. Note that the d-band model developed by Hammer and Nørskov systematically correlates the perturbations in the adsorbate to the position of the εd relative to the Fermi level (Ef), is limited to pure transition metals and certain alloys; however, it fails to describe interactions on more complex metal surfaces adequately.49–52 In contrast, the Idf outperformed the εd at the subnanometer regime, effectively capturing the elemental-specific d-state contributions of the unique local coordination environment while accounting for the perturbations introduced by the complex chemical environment of subnano clusters. Upon closer examination of the active bifunctional catalyst Au11, a higher Idf value (1.0) resulted in weak coupling between the metal and intermediates, driving the Eads values of intermediates towards lower levels, leading to optimum binding energetics (Fig. S3†). In contrast, lower Idf values (0.6) observed for inactive bifunctional catalysts, such as Mn11, resulted in stronger binding, which ultimately increased the η values. Similar trends were observed for high values of εd, which reduced binding strength and consequently lowered η values (Fig. S3†). The feature ∑SBW consistently appeared at the bottom of the plots with its minimal impact, demonstrating its lowest contribution to the OER and ORR activities. For enhanced OER/ORR bifunctional activity, catalysts at the apex of activity volcano plots should exhibit near-optimal adsorption energetics for each reaction intermediate. Similarly, Au11 bifunctional catalyst achieves optimal adsorption energies for *O, *OH, and *OOH within the range of −4.92 eV < Eads < −1.23 eV, suggesting weaker binding than the Pt (111) surface. Additionally, to understand electronic structures during the OER/ORR intermediate adsorption on Au11 subnano clusters, we performed a partial density of states (PDOS) analysis, represented in Fig. 6. The narrow distribution of 5d states near the Fermi level (Ef) indicates weaker coupling between Au (5d) and O (2p) states, further driving the Eads values towards the optimal range. Overall, our study emphasizes the significant contribution of idealized d-band filling while encoding the complex relations of OER/ORR activities at the subnanometer regime, presenting a new pathway for designing efficient bifunctional electrocatalysts.
3. Conclusions
In summary, we demonstrate a breaking of conventions for OER and ORR activity across 3d, 4d, and 5d transition metal TMn subnano clusters. Owing to the fluxionality and non-monotonic catalytic activity at the subnanometer regime, we observe a shift in the apex of the activity volcano from Pt(111)/IrO2 to Au11 clusters. Compared to early transition metal clusters (with v1–v5 configurations), the late transition metal clusters (with v8–v10 configurations) exhibited significantly reduced overpotential values for OER/ORR activity, highlighting their potential in the theoretical and experimental screening of bifunctional catalysts. Interestingly, Au11 emerged as a top bifunctional electrocatalyst exhibiting low bifunctional overpotential values (ηBi) of 0.43 V. Further, impinging on the non-ab initio electronic descriptors, we demonstrate the significant contribution of the idealized d-band filling (Idf) feature towards the bifunctional activity at the subnanometer regime. Additionally, our observations also align with the d-band theory where higher values of Idf and d-band center (εd) lead to optimal reaction energetics, thereby reducing the ηBi values due to weak intermediate binding strengths. Thus, our work correlates the electronic descriptors of the subnano clusters with their OER and ORR activities, opening new avenues for effectively designing and screening efficient bifunctional cluster catalysts.Data availability
The data supporting the findings of this study can be found at https://github.com/Rahul2101131005/Bifunctional-Active-Subnano-Clusters-08-07-2024-.git.Conflicts of interest
There are no conflicts to declare.Acknowledgements
We acknowledge IIT Indore for providing the lab/computational facilities and CSIR (01(3046)/21/EMR-II), DST-SERB (CRG/2022/000836) and BRNS (2023-BRNS/12356) projects for funding. R.K.S. thanks UGC for the research fellowship, and H.M. thanks PMRF for the research fellowship.References
- N. S. Lewis, Science, 2016, 351(6271), aad1920 CrossRef PubMed.
- Z. W. She, J. Kibsgaard, C. F. Dickens, I. Chorkendorff, J. K. Nørskov and T. F. Jaramillo, Science, 2017, 355(6321), eaad4998 CrossRef PubMed.
- S. S. Shinde, C. H. Lee, J. Y. Jung, N. K. Wagh, S. H. Kim, D. H. Kim, C. Lin, S. U. Lee and J. H. Lee, Energy Environ. Sci., 2019, 12(2), 727–738 RSC.
- Z. F. Huang, J. Wang, Y. Peng, C. Y. Jung, A. Fisher and X. Wang, Adv. Energy Mater., 2017, 7(23), 1700544 CrossRef.
- Z. Shi, J. Li, Y. Wang, S. Liu, J. Zhu, J. Yang, X. Wang, J. Ni, Z. Jiang, L. Zhang, Y. Wang, C. Liu, W. Xing and J. Ge, Nat. Commun., 2023, 14(1), 843 CrossRef CAS PubMed.
- X. Cui, P. Ren, D. Deng, J. Deng and X. Bao, Energy Environ. Sci., 2016, 9(1), 123–129 RSC.
- L. Bai, C. S. Hsu, D. T. L. Alexander, H. M. Chen and X. Hu, Nat. Energy, 2021, 6(11), 1054–1066 CrossRef CAS.
- Y. Wang, D. Wang and Y. Li, SmartMat, 2021, 2(1), 56–75 CrossRef CAS.
- L. Zhang, L. T. Roling, X. Wang, M. Vara, M. Chi, J. Liu, S. Il Choi, J. Park, J. A. Herron, Z. Xie, M. Mavrikakis and Y. Xia, Science, 2015, 349(6246), 412–416 CrossRef CAS PubMed.
- R. Gao, J. Wang, Z. F. Huang, R. Zhang, W. Wang, L. Pan, J. Zhang, W. Zhu, X. Zhang, C. Shi, J. Lim and J. J. Zou, Nat. Energy, 2021, 6(6), 614–623 CrossRef CAS.
- Z. Liu, Y. Ma, W. Gu, C. Yuan and F. Teng, J. Phys. Chem. Solids, 2020, 147, 109578 CrossRef CAS.
- Y. J. Wang, N. Zhao, B. Fang, H. Li, X. T. Bi and H. Wang, Chem. Rev., 2015, 115(9), 3433–3467 CrossRef CAS PubMed.
- Q. Fu and C. Draxl, Phys. Rev. Lett., 2019, 122(4), 046101 CrossRef CAS PubMed.
- Z. Fu, B. Yang and R. Wu, Phys. Rev. Lett., 2020, 125(15), 156001 CrossRef CAS PubMed.
- B. Jiang, F. Zhang, Y. Wang, X. Xue, J. Shi, X. Zhao, L. Zhang, R. Pang, X. Ren, S. Li and Z. Zhang, Phys. Rev. B, 2023, 107(20), 205421 CrossRef CAS.
- E. J. Peterson, A. T. DeLaRiva, S. Lin, R. S. Johnson, H. Guo, J. T. Miller, J. H. Kwak, C. H. F. Peden, B. Kiefer, L. F. Allard, F. H. Ribeiro and A. K. Datye, Nat. Commun., 2014, 5(1), 4885 CrossRef CAS PubMed.
- H. Zhai and A. N. Alexandrova, ACS Catal., 2017, 7(3), 1905–1911 CrossRef CAS.
- B. Zandkarimi and A. N. Alexandrova, J. Phys. Chem. Lett., 2019, 10(3), 460–467 CrossRef PubMed.
- R. K. Sharma, H. Minhas and B. Pathak, J. Phys. Chem. C, 2024, 128(18), 7504–7517 CrossRef CAS.
- X. Shi, Y. Li, S. Zhang, R. Hu, S. Gao, P. Jin, J. Shang and J. Shui, Nano Res., 2023, 16(5), 8042–8050 CrossRef CAS.
- Z. Zhang, B. Zandkarimi, J. Munarriz, C. E. Dickerson and A. N. Alexandrova, ChemCatChem, 2022, 14(15), e202200345 CrossRef CAS.
- A. S. Chaves, M. J. Piotrowski and J. L. F. Da Silva, Phys. Chem. Chem. Phys., 2017, 19(23), 15484–15502 RSC.
- L. Zhang, X. Guo, S. Zhang and S. Huang, J. Mater. Chem. A, 2022, 10(21), 11600–11612 RSC.
- M. O. J. Jäger, Y. S. Ranawat, F. F. Canova, E. V. Morooka and A. S. Foster, ACS Comb. Sci., 2020, 22(12), 768–781 CrossRef PubMed.
- A. S. Nair and B. Pathak, J. Phys. Chem. C, 2019, 123(6), 3634–3644 CrossRef CAS.
- T. Bligaard, J. K. Nørskov, S. Dahl, J. Matthiesen, C. H. Christensen and J. Sehested, J. Catal., 2004, 224(1), 206–217 CrossRef CAS.
- P. Ferrin, D. Simonetti, S. Kandoi, E. Kunkes, J. A. Dumesic, J. K. Nørskov and M. Mavrikakis, J. Am. Chem. Soc., 2009, 131(16), 5809–5815 CrossRef CAS PubMed.
- R. K. Sharma, A. S. Nair, N. Bharadwaj, D. Roy and B. Pathak, J. Phys. Chem. C, 2023, 127(1), 127–228 CrossRef.
- J. P. Perdew, J. A. Chevary, S. H. Vosko, K. A. Jackson, M. R. Pederson, D. J. Singh and C. Fiolhais, Phys. Rev. B: Condens. Matter Mater. Phys., 1992, 46(11), 6671 CrossRef CAS PubMed.
- M. M. Montemore and J. W. Medlin, Catal. Sci. Technol., 2014, 4(11), 3748–3761 RSC.
- J. K. Nørskov, J. Rossmeisl, A. Logadottir, L. Lindqvist, J. R. Kitchin, T. Bligaard and H. Jónsson, J. Phys. Chem. B, 2004, 108(46), 17886–17892 CrossRef.
- I. C. Man, H. Y. Su, F. Calle-Vallejo, H. A. Hansen, J. I. Martínez, N. G. Inoglu, J. Kitchin, T. F. Jaramillo, J. K. Nørskov and J. Rossmeisl, ChemCatChem, 2011, 3(7), 1159–1165 CrossRef CAS.
- Y. Wang, X. Huang, H. Fu and J. Shang, J. Mater. Chem. A, 2022, 10(45), 24362–24372 RSC.
- J. Zhang, Z. Zhao, Z. Xia and L. Dai, Nat. Nanotechnol., 2015, 10(5), 444–452 CrossRef CAS PubMed.
- B. Wei, Z. Fu, D. Legut, T. C. Germann, S. Du, H. Zhang, J. S. Francisco and R. Zhang, Adv. Mater., 2021, 33(40), 2102595 CrossRef CAS PubMed.
- M. Prabu, K. Ketpang and S. Shanmugam, Nanoscale, 2014, 6(6), 3173–3181 RSC.
- A. Kulkarni, S. Siahrostami, A. Patel and J. K. Nørskov, Chem. Rev., 2018, 118(5), 2302–2312 CrossRef CAS PubMed.
- T. Zhang, B. Zhang, Q. Peng, J. Zhou and Z. Sun, J. Mater. Chem. A, 2021, 9(1), 433–441 RSC.
- H. Niu, X. Wan, X. Wang, C. Shao, J. Robertson, Z. Zhang and Y. Guo, ACS Sustainable Chem. Eng., 2021, 9(9), 3509–3599 CrossRef.
- A. S. Nair, A. Mahata and B. Pathak, ACS Appl. Energy Mater., 2018, 1(8), 3890–3899 CrossRef CAS.
- A. S. Nair, A. Anoop, R. Ahuja and B. Pathak, J. Comput. Chem., 2021, 42(27), 1944–1958 CrossRef CAS PubMed.
- B. Hammer and J. K. Nørskov, Adv. Catal., 2000, 45, 71–129 CAS.
- H. Xin and S. Linic, J. Chem. Phys., 2010, 132(22), 221101 CrossRef PubMed.
- A. Vojvodic, J. K. Nørskov and F. Abild-Pedersen, Top. Catal., 2014, 57, 25–32 CrossRef CAS.
- A. Ruban, B. Hammer, P. Stoltze, H. L. Skriver and J. K. Nørskov, J. Mol. Catal. A: Chem., 1997, 155(3), 421–429 CrossRef.
- B. Li, P. Zhang, S. Liang and G. Ren, in International Conference on Signal Processing Proceedings, ICSP, 2008.
- N. N. Wang, J. Dong, Y. H. Deng, M. F. Zhu, M. Wen, Z. J. Yao, A. P. Lu, J. B. Wang and D. S. Cao, J. Chem. Inf. Model., 2016, 56(4), 763–773 CrossRef CAS PubMed.
- D. S. Palmer, N. M. O'Boyle, R. C. Glen and J. B. O. Mitchell, J. Chem. Inf. Model., 2007, 47(1), 150–158 CrossRef CAS PubMed.
- S. Saini, J. Halldin Stenlid, S. Deo, P. N. Plessow and F. Abild-Pedersen, ACS Catal., 2024, 14(2), 874–885 CrossRef CAS.
- S. Saini, J. Halldin Stenlid and F. Abild-Pedersen, npj Comput. Mater., 2022, 8, 163 CrossRef CAS.
- W. Gao, Y. Chen, B. Li, S.-P. Liu, X. Liu and Q. Jiang, Nat. Commun., 2020, 11, 1196 CrossRef CAS PubMed.
- B. Li, X. Li and W. Gao, J. Mater. Chem. A, 2022, 10(12), 6731–6739 RSC.
Footnote |
| † Electronic supplementary information (ESI) available: Computational details, scaling relationships, reaction energy diagrams, and Pearson correlation coefficient plots. See DOI: https://doi.org/10.1039/d4nr02787f |
| This journal is © The Royal Society of Chemistry 2024 |

