 Open Access Article
Thermoelectrically polarized amorphous silica promotes sustainable carbon dioxide conversion into valuable chemical products†
Marc
Arnau
 ab,
Isabel
Teixidó
a,
Jordi
Sans
 *ab,
Pau
Turon
 *c and
Carlos
Alemán
 *abd
*abd
aIMEM-BRT Group, Departament d'Enginyeria Química, EEBE, Universitat Politècnica de Catalunya – BarcelonaTech, C/Eduard Maristany, 10-14, 08019, Barcelona, Spain. E-mail: jordi.sans.mila@upc.edu; carlos.aleman@upc.edu
bBarcelona Research Centre in Multiscale Science and Engineering, Universitat Politècnica de Catalunya – BarcelonaTech (UPC), Av. Eduard Maristany, 16, Barcelona 08019, Spain
cB. Braun Surgical, S.A.U. Carretera de Terrassa 121, 08191 Rubí, Barcelona, Spain. E-mail: pau.turon@bbraun.com
dInstitute for Bioengineering of Catalonia (IBEC), The Barcelona Institute of Science and Technology, Baldiri Reixac 10-12, 08028 Barcelona, Spain
First published on 19th November 2024
Abstract
Electrically polarized amorphous silica (aSiO2) is demonstrated to be an efficient and viable metal-free heterogeneous catalyst for the conversion of CO2 into valuable chemical products. The catalyst was prepared applying a thermoelectric polarization process in air to commercially available aSiO2 nanoparticles. Four polarization temperatures were assayed (150, 500, 800 and 1000 °C), the larger structural and chemical changes induced by the polarization treatment being observed at 150 and 500 °C. The polarization at such temperatures reduced considerably the electrical resistance of calcined aSiO2, while no significant change was detected at 800 and 1000 °C. Polarized aSiO2 was tested as heterogeneous catalysts for the reaction of CO2 with water at mild reaction conditions (120 °C, 6 bar of CO2, 40 mL of water, 72 h). The highest catalytic activity was observed with aSiO2 polarized at 150 °C, which was attributed to the structural defects induced during the thermoelectric polarization treatment. Thus, CO2 was converted into a mixture of formic acid (39.9%), acetic acid (44.4%) and dioxane (15.7%). Although the catalytic process was not selective, the yields were not only very high but also allowed obtaining a significant amount of dioxane, a product with four carbon atoms, which is very unusual in processes catalyzed by polarized ceramics. In summary, polarized aSiO2 can be used as a sustainable and low-cost raw material to prepare metal-free catalysts by means of a thermoelectric polarization process at 150 °C. This catalyst is capable of capturing CO2 to produce valuable chemical products by applying mild reaction conditions.
Introduction
Hydroxyapatite (HAp) is a naturally occurring calcium phosphate, Ca10(PO4)6(OH)2, and a major component of bones and teeth. Among other applications, HAp has been long used in hard tissue engineering applications (e.g. to repair bone defects, to promote bone augmentation, and to coat human body metallic implants)1–4 and as catalyst support material.5–8 Semi-permanently and permanently polarized HAp (sp-HAp and p-HAp, respectively), which were obtained by applying a constant voltage at high temperature to samples with previously generated vacancies (i.e. thermoelectric polarization), were found to enhance the electrical properties of HAp by promoting cell activity in tissue engineering applications9–11 and by converting the mineral support into a real catalyst,12,13 respectively. The main difference between sp-HAp and p-HAp comes from the conditions used for the thermoelectric polarization process and the previous calcination step.14 Thus, a water vapor atmosphere during the calcination step and the application of relatively low temperatures (<800 °C) and/or low voltages (≤300 V) result in reversible structural distortions,15 while the calcination in air and the polarization using a high temperature (≥800 °C) and a high voltage (≥500 V) result in structural reorganizations and re-orientations that remain for a long time (>3 months).15,16Thermoelectric polarization has also been applied to other ceramics and, even, to plastics for energy storage and sensing.17–19 In the field of catalysis, some attempts have been performed to improve the behavior of electrocatalysts. For example, Xia et al.20 used a multi-electric field polarization method to produce nitrogen–iron functionalized carbon nanocatalyst electrodes. In another example, Vijay et al.21 used polarized Bi–Fe–O electrocatalysts to improve the performance of the oxygen evolution reaction. However, thermoelectric polarization has not been used to generate new catalysts from non-catalytic materials. In this work, we are focused on the transformation of a conventional non-catalytic material, amorphous silica (aSiO2), into a powerful permanently polarized catalyst able to promote the fixation of carbon dioxide (CO2), as we did with HAp.22 Thus, the properties of aSiO2, are expected to be modifiable by altering the atomic arrangement through physical treatments, as has been observed for other amorphous nanomaterials.23,24
aSiO2 is a commonly used material due to its low-cost, exceptional thermal stability, high melting point, and insulating properties.25 Although aSiO2 can be extracted from natural sources, synthetic aSiO2 is one of the most produced nanomaterials, with a worldwide production in millions of tons per year.26 It has wide application in glass manufacturing,27,28 electronics,29,30 ceramics,31,32 food industry,33 cosmetics,34 and as a filler in various materials.35,36 Although aSiO2 has also been extensively used as catalyst support,37–42 only metal-doped aSiO2 shows catalytic properties.43–46 In this work, we transform aSiO2 into an intrinsic metal-free catalyst applying the thermoelectric polarization process. This latter process promotes the catalytic activity of this naturally-occurring ceramic at moderate temperatures and pressures (120 °C and 6 bar), allowing the conversion of CO2 into formic acid, acetic acid and dioxane.
The work is organized as follows. After the Methods section, the first part of the Results and discussion section has been aimed to ascertain the influence of the calcination and polarization temperatures (T) in the properties of calcined and thermoelectrically polarized aSiO2 samples. For this purpose, the following temperatures were considered: T = 150, 500, 800 or 1000 °C. Distinctive properties have been found for aSiO2 polarized at T = 150 °C and, to a lesser extent, for aSiO2 polarized at T = 500 °C, suggesting that such materials may behave as catalysts. In the second part of the Results and discussion section, the catalytic activity of the aSiO2 polarized at T = 150, 500, 800 or 1000 °C has been evaluated. Results show that aSiO2 polarized at T = 150 °C presents the highest efficiency to convert CO2 into valuable chemical products, indicating that such material can be considered a high performance, sustainable and low-cost metal-free catalyst.
Methods
Sample preparation
aSiO2 nanopowder (Sigma Aldrich; spherical, 5–20 nm particle size, and 99.5% trace metal basis) was dry at 150 °C for 1 h and, subsequently, was compressed into discs (13 and 0.7 mm of diameter and thickness, respectively) using a Specac Manual hydraulic press of 15 tons equipped with an Specac Evacuable Pellet Die. The discs obtained were brittle and consequently were handled with great care for the characterization and catalysis tests.A half of the prepared aSiO2 discs were introduced into a ceramic holder and calcined using a Carbolite ELF11/6B/301 muffle furnace with a temperature range from 0 °C to 1100 °C. Hereafter, the calcined samples have been denoted c-T/aSiO2, where T values of 150 °C (c-150/aSiO2), 500 °C (c-500/aSiO2), 800 °C (c-800/aSiO2) and 1000 °C (c-1000/aSiO2) were considered. The calcination process took 2 h![[thin space (1/6-em)]](https://www.rsc.org/images/entities/char_2009.gif) :
:![[thin space (1/6-em)]](https://www.rsc.org/images/entities/char_2009.gif) 1 h to heat the system to the desired temperature and 1 h in which the system was maintained at that temperature. Finally, samples were allowed to cool down without applying any control ramp.
1 h to heat the system to the desired temperature and 1 h in which the system was maintained at that temperature. Finally, samples were allowed to cool down without applying any control ramp.
The rest of the prepared aSiO2 discs were subjected to the thermoelectric polarization process. For this purpose, samples were placed inside the muffle furnace that was heated at the desired temperature value, while an electric voltage of 500 V was applied by connecting a GAMMA voltage source (with a voltage range of 0 kV to 50 kV) to two stainless steel AISI 304 electrodes using platinum wires. Electrodes were separated by a 2 cm ceramic piece. The thermoelectric polarization process took 2 h![[thin space (1/6-em)]](https://www.rsc.org/images/entities/char_2009.gif) :
:![[thin space (1/6-em)]](https://www.rsc.org/images/entities/char_2009.gif) 1 h to heat the system to the desired temperature and 1 h in which the system was maintained at that temperature. After that time, polarized samples were allowed to cool down maintaining the applied electric field for 30 min, and finally, all the system was powered off and left to cool down overnight without applying any control ramp. Hereafter, polarized samples, have denoted p-T/aSiO2, where T values of 150 °C (p-150/aSiO2), 500 °C (p-500/aSiO2), 800 °C (p-800/aSiO2) and 1000 °C (p-1000/aSiO2) were considered.
1 h to heat the system to the desired temperature and 1 h in which the system was maintained at that temperature. After that time, polarized samples were allowed to cool down maintaining the applied electric field for 30 min, and finally, all the system was powered off and left to cool down overnight without applying any control ramp. Hereafter, polarized samples, have denoted p-T/aSiO2, where T values of 150 °C (p-150/aSiO2), 500 °C (p-500/aSiO2), 800 °C (p-800/aSiO2) and 1000 °C (p-1000/aSiO2) were considered.
The calcination and polarization temperatures were carefully chosen. The temperature of 150 °C was selected to facilitate the evaporation of the considerable amount of absorbed water present in aSiO2 nanopowder, while the temperatures of 500 °C, 800 °C and 1000 °C were specifically settled on because they are close to the transition temperatures between SiO2 polymorphs.
N2-physisorption measurements were conducted in the TriStar II3020-Micrometrics analyzer at liquid nitrogen temperature. Prior to the measurements, the samples were degassed at 90 °C for 1 h. The Brunauer–Emmett–Teller (BET) method was applied to calculate the BET surface area for a relative pressure (P/P0) range of 0.05–0.3. The average pore size was determined by applying the Barrett–Joyner–Halenda (BJH) method to the desorption branch of the isotherms. The total pore volume was determined from the máximum adsorption value at P/P0 = 0.997. Temperature-programed reduction.
Characterization
Raman analyses of c-T/aSiO2 and p-T/aSiO2 discs were performed using an inVia Qontor confocal Raman microscope (Renishaw) equipped with a Renishaw Centrus 2957T2 detector and a 532 nm laser. In order to obtain representative data, 32 single point spectra were averaged.FTIR spectra of nanopowder samples were recorded on a FTIR Nicolet 6700 spectrophotometer from Thermo Scientific through transmission accessory. Potassium Bromide (KBr) pellets mixed with grinded c-T/aSiO2 or p-T/aSiO2 powder were assembled. Samples were evaluated using the spectra manager software. For each sample, 64 scans were performed between 4000 and 400 cm−1 with a resolution of 4 cm−1.
Ultraviolet-visible (UV-vis) absorption spectra of the prepared discs were obtained using a Shimadzu UV-3600 equipment. The UV-vis spectra presented a total wavelength range of 185–3300 nm with a resolution of 0.1 nm. The equipment was operated using an integrating sphere ISR-3100 accessory with an inner diameter of ∼60 mm PMT and PbS sensors. The optical range of the accessory was 200–2600 nm.
Detailed inspection of calcined and polarized samples was conducted by scanning electron microscopy (SEM). A Focus Ion Beam Zeiss Neon 40 instrument (Carl Zeiss, Germany) equipped with an energy dispersive X-ray (EDX) spectroscopy system and operating at 5 kV was used. The diameter of the nanoparticles was measured with the ImageJ software (n = 100).
X-ray photoelectron spectroscopy (XPS) analyses were conducted to determine the chemical state and atom composition of samples using a SPECS ultra-high vacuum multi-chamber system. The spectrometer was equipped with a high-intensity twin-anode XR-50 X-ray source of Mg/Al (1253 eV/1487 eV) operating with the Al anode at 150 W, positioned perpendicular to the analyzer axis, and utilizing a Phoibos 150 EP hemispherical energy analyzer with a MCD-9 detector. The stage position was digitally controlled to ensure consistency throughout the analysis. The pass energy of the hemispherical analyzer was set at 25 eV, and the energy step for high-resolution spectra was set at 0.1 eV. The pressure in the analysis chamber was maintained below 10–7 Pa, and binding energy (BE) values were referred to the C 1s peak at 284.5 eV. Data were processed using CasaXPS software (Casa Software Ltd, UK).
Wide angle X-ray diffraction (XRD) patterns were obtained using a Brucker D8 Advance model with Bragg–Brentano 2θ configuration and Cu Kα radiation (λ = 0.1542 nm). A one-dimensional Lynx Eye detector was employed. Measurements were performed in a 2θ range of 5–70° in steps of 0.02°, and scan speed of 2 s.
Electrochemical impedance spectroscopy (EIS) studies were performed using a VIONIC Autolab from Metrohm connected to a conductivity meter cell by means of two stainless steel electrodes AISI 304 isolated by a resin holder.47 Measurements were performed in the 100 kHz to 10 mHz frequency range and applying a 100 mV sinusoidal voltage.
Theoretical calculations
n-Membered-tetrahedral SiO2 rings/chains were assembled and pre-optimized using Avogadro software48 auto optimization tool with MMFF94 force field and steepest descent algorithm to ensure structural conformation energy minimization before Density Functional Theory (DFT) optimization. DFT calculations were performed using Gaussian 16 software suite49 with the B3LYP50 functional and 6-311G++(d,p)51,52 basis set for accurately describing Si atoms. After structure optimization, enthalpies for the different compounds were calculated based on harmonic vibrational frequencies and used for strain energy (Estrain) estimation following the formula: | (1) |
More specifically, the processes used to estimate Estrain, which involved n-membered-tetrahedral SiO2 rings/chains with n = 3, 4 and 6 (eqn (2)–(4)), were:
| Si3O10H8 → Si3O9H6 + H2O | (2) |
| Si4O13H10 → Si4O12H8 + H2O | (3) |
| Si6O19H14 → Si6O18H12 + H2O | (4) |
CO2 conversion reactions
The batch CO2 conversion into valuable chemicals was carried out using a reactor that consisted of an inert reaction chamber (120 mL) coated with a perfluorinated polymer where both the catalyst and water were placed. All surfaces were coated with a thin film of perfluorinated polymer in order to avoid any contact between the reactants and catalyst and the stainless steel reactor surfaces, in order to discard other catalytic effects. The reactor was equipped with an inlet valve for the entrance of gases and an outlet valve to recover the gaseous reaction products.Both the p-T/aSiO2 catalysts and de-ionized liquid water (40 mL) were introduced into the reactor. After exhaustive purge with CO2, the chamber pressure was increased up to 6 bar of CO2 (measured at room temperature). The reaction was conducted for 72 h (3 days) at 120 °C. Control reactions were performed using c-T/aSiO2 discs as catalysts. All processes were performed in triplicate.
Analysis of the reaction products
The reaction products dissolved in the liquid water and the reaction products adsorbed on the catalyst were analyzed by 1H NMR spectroscopy. In order to desorb the reaction products from the catalyst, samples were dissolved in 1 mL of a solution containing 100 mM of HCl and 50 mM of NaCl with the final addition of deuterated water. All 1H NMR spectra were acquired with a Bruker Ascend 400 spectrometer operating at 400.1 MHz. The chemical shift was calibrated using tetramethylsilane as internal standard. 256 scans were recorded in all cases. In order to compare the different products obtained from the studied reactions, the areas associated to the proton contribution were normalized and calibrated through external references.Results and discussion
Characterization of c-T/aSiO2 and p-T/aSiO2
Fig. 1a shows the Raman spectra of c-T/aSiO2 samples prepared using T = 150 °C, 500 °C, 800 °C and 1000 °C. Samples display broad bands at 800 cm−1 (O–Si–O asymmetric vibrations), 980 cm−1 (superficial Si–OH group), and 1179 cm−1 (SiO4 asymmetric vibrations).53–55 The bands below 650 cm−1, which are typically ascribed to the structural defects of the aSiO2 matrix in the form of n-membered-tetrahedral rings (D2, D1 and R bands for n = 3, 4 and 6 respectively), appear at 607, 493 and 445 cm−1, respectively.56 According to the literature,54 the relative amplitudes of both the 980 and 493 cm−1 bands decreases with the decrease of the specific surface area. As it can be seen, the intensity and amplitude of such bands in c-T/aSiO2 decreased with increasing calcination temperature, being practically inexistent for c-1000/aSiO2. On the other hand, the intensity of the bands at 607 and 445 cm−1, which were shoulders for c-150/aSiO2 increased with the calcination temperature. All such variations suggested that, after the initial dehydration process at 150 °C, the calcination at higher temperatures tended to re-organize the structural network promoting rings with n = 3 and 6.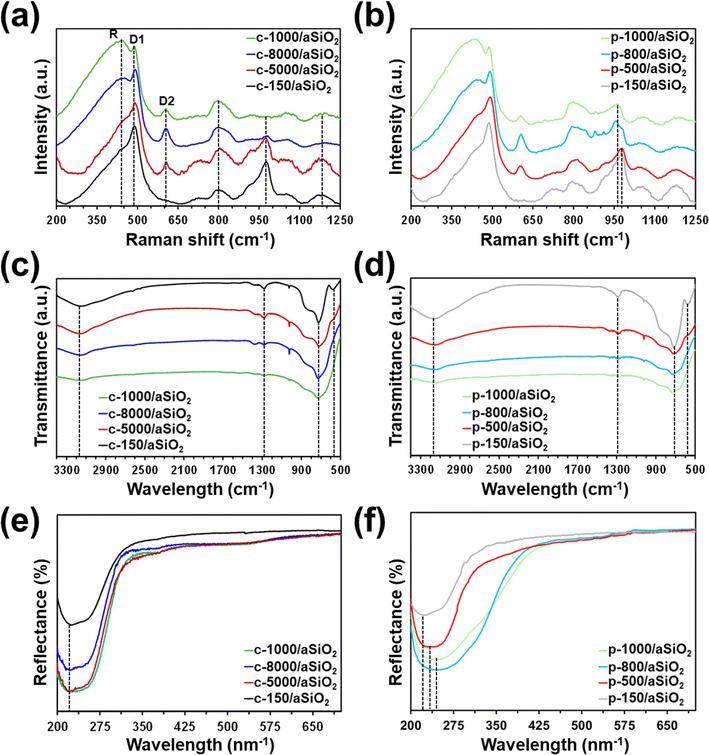 | ||
| Fig. 1 (a and b) Raman, (c and d) FTIR and (e and f) UV-vis spectra of (a, c and e) c-T/aSiO2 and (b, d and f) p-T/aSiO2 prepared using T = 150 °C, 500 °C, 800 °C and 1000 °C. | ||
The Raman spectra collected for p-T/aSiO2 for T = 150 °C, 500 °C, 800 °C and 1000 °C are shown in Fig. 1b. For all the considered temperatures, the spectrum was similar to that achieved for the corresponding c-T/aSiO2 sample (Fig. 1a). The most noticeable difference between the spectra of p-T/aSiO2 and c-T/aSiO2 was detected in the symmetric stretch vibrations of silanols (Si–OH group). While this band practically disappeared in c-800/aSiO2 and c-1000/aSiO2, suggesting that the superficial silanol groups transformed into superficial siloxane bridges (Scheme 1a), it shifted to approximately 960 cm−1 in p-800/aSiO2 and p-1000/aSiO2, suggesting a structural reorganization of the hydroxyls, as observed for p-HAp.15 This blue shift may be due to the effect of such rearrangement in the hydrogen bonding structure, which changed from a vicinal silanol groups to geminal silanol groups (Scheme 1b).
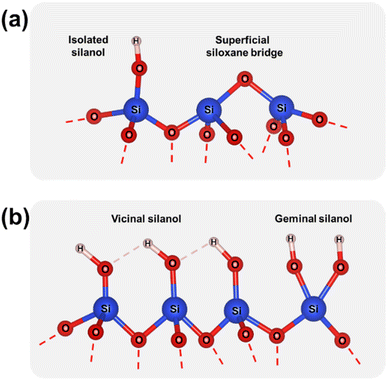 | ||
| Scheme 1 (a) Superficial silanol groups and siloxane bridges. (b) Vicinal and geminal silanol groups. | ||
DFT calculations on systems involving n-membered-tetrahedral SiO2 rings/chains with n = 3, 4 and 6, which are depicted in Fig. 2a, allowed us to determine the strain energy (eqn (1)) as a function of the size of the ring by using the isodesmic reactions displayed in eqn (2)–(4). The lowest strain energy (5.0 kcal mol−1) was obtained for n = 4 (Fig. 2b), which is consistent with the fact that the intensity of the D1 band is much higher than those of D2 and R bands for c-150/aSiO2 and p-150/aSiO2. The strain energy of the rings with n = 3 and 6 was predicted to be 18% and 54% higher than the one obtained for n = 4. These results are in good agreement with the fact that the D2 band gains intensity for samples prepared using T ≥ 500 °C, while the R band is only clearly identified for samples obtained using T ≥ 800 °C. Accordingly, the thermal energy provided during the calcination and polarization processes allowed to overcome the energy threshold that defines the strain of the rings, which depends on the size of the ring.
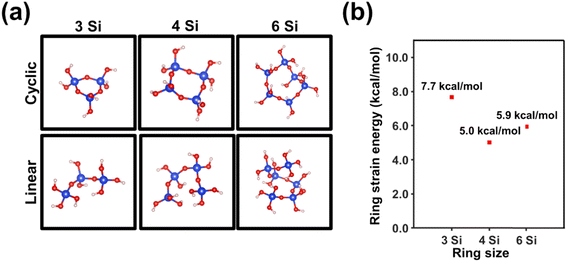 | ||
| Fig. 2 (a) DFT optimized structures of systems involving n-membered-tetrahedral SiO2 rings/chains with n = 3, 4 and 6. (b) Variation of the strain energy with the size of the ring. | ||
Unfortunately, FTIR spectra of c-T/aSiO2 and p-T/aSiO2 samples (Fig. 1c and d) only showed broad bands and did not provide unambiguous information. The spectra of c-T/aSiO2 reflected the presence of surface Si–OH groups by the hydroxyl band at 3150 cm−1. However, the intensity of such band drastically decreased with increasing calcination temperature (Fig. 1c), confirming Raman observations. The Si–O bond appeared at 1287 cm−1, the broad band at 725 was attributed at the O–Si–O and Si–O–Si vibration.57,58 The peak at 575 cm−1, which consistently decreases with increasing temperature, was ascribed to the Si–OH stretching.57,58 Bands at the same positions and similar trends (i.e. the bands associated to Si–OH groups decreased with increasing polarization temperature) were observed for p-T/aSiO2 (Fig. 1d).
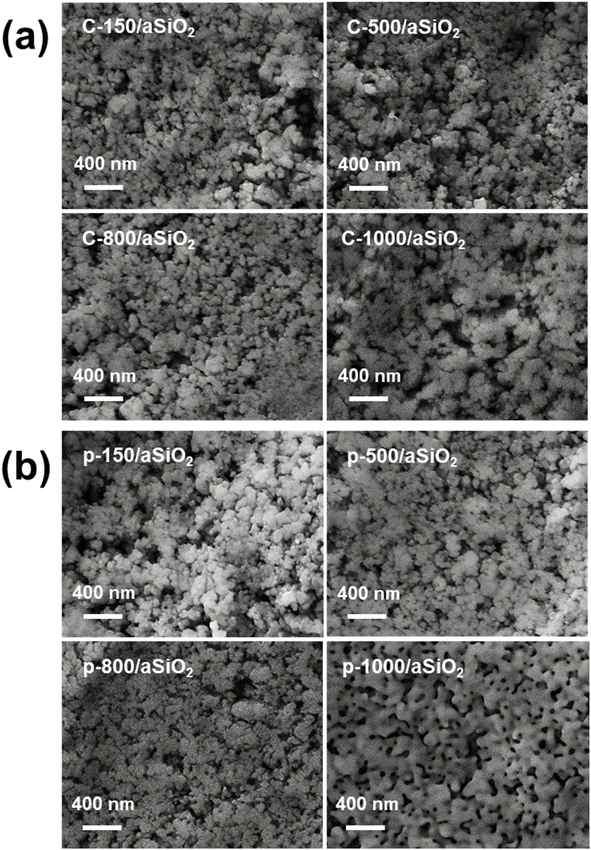
UV-vis spectra evidenced that the absorbance of c-T/aSiO2 at λ = 223 nm increased when T > 150 °C (Fig. 1e), suggesting a change in the in the size and/or morphology of the SiO2 nanoparticles. However, although changes in nanoparticle size of calcined c-T/aSiO2 were confirmed by SEM micrographs (Fig. 3a and S1†), inspection to the average size (Table 1; histograms shown in Fig. S2†) did not provide any clear correlation with the absorbance. On the other hand, the absorption peak of p-T/aSiO2 not only increased with the polarization temperature but also shifted from λ = 223 nm (p-150/aSiO2) to λ = 235 nm (p-500/aSiO2) and 247 nm (p-800/aSiO2 and p-1000/aSiO2). Similarly, although the size of p-T/aSiO2 nanoparticles changed with the polarization temperature (Fig. 3b and S3†), no correlation between the average size (Table 1) and the absorbance was found. Accordingly, the change in absorbance, including the absorption at lower λ values, cannot be due only to a variation in the size of the nanoparticles but is possibly accompanied by a chemical restructuring.
| Calcined samples | Average size (nm) | Polarized samples | Average size (nm) |
|---|---|---|---|
| c-150/aSiO2 | 67.6 ± 12.4 | p-150/aSiO2 | 51.0 ± 12.3 |
| c-500/aSiO2 | 58.2 ± 8.8 | p-500/aSiO2 | 46.1 ± 8.8 |
| c-800/aSiO2 | 48.8 ± 9.0 | p-800/aSiO2 | 31.0 ± 9.2 |
| c-1000/aSiO2 | 54.7 ± 12.1 | p-1000/aSiO2 | 65.4 ± 12.1 |
To further investigate changes in absorbance, possible chemical changes induced by the calcination and polarization treatments were studied by XPS. The acquired survey scans, which are displayed in Fig. S4,† allowed us to identify well-defined peaks of Si 2p, O 1s and C 1s for all studied samples. The atomic composition determined from XPS measurements is shown in Table 2. Carbon residues result from impurities in commercial aSiO2 nanoparticles and from hydrocarbon impurities adsorbed during their manipulation. The intensity of the C 1s peak decreased with increasing calcination and polarization temperatures, indicating that carbon impurities were eliminated during such processes. This peak does not affect the interpretation of the results. Indeed, the C 1s peak was actually used for binding energy calibration by setting it value to 284.8 eV to correct surface charging.
| Sample | Si 2p | O 1s | C 1s | O 1s/Si 2p |
|---|---|---|---|---|
| c-150/aSiO2 | 26.9 | 43.6 | 29.5 | 1.62 |
| c-500/aSiO2 | 34.9 | 51.6 | 13.5 | 1.48 |
| c-800/aSiO2 | 36.5 | 53.7 | 9.8 | 1.43 |
| c-1000/aSiO2 | 40.3 | 54.5 | 5.2 | 1.35 |
| p-150/aSiO2 | 26.3 | 44.5 | 29.2 | 1.69 |
| p-500/aSiO2 | 35.5 | 54.9 | 9.6 | 1.54 |
| p-800/aSiO2 | 35.4 | 52.7 | 11.9 | 1.49 |
| p-1000/aSiO2 | 37.8 | 53.5 | 8.7 | 1.42 |
Interestingly, the O 1s/Si 2p ratio, was systematically found to decrease with increasing calcination and polarization temperatures for c-T/aSiO2 and p-T/aSiO2, respectively (Table 2). For both c-T/aSiO2 and p-T/aSiO2 such ratio decreased by around 16% when the temperature increased from 150 °C to 1000 °C, which evidenced significant chemical changes during the calcination and polarization processes. These chemical changes, which may go beyond the change in size of the tetrahedral n-membered rings and the reduction of superficial Si–OH groups observed by Raman microscopy, suggest the elimination of oxygen atoms and their potential replacement by silicon atoms.
Fig. 4 shows the high resolution XPS spectra for Si 2p of c-T/aSiO2 and p-T/aSiO2. From the Si 2p spectra of c-T/aSiO2 and a-T/aSiO2 four sub-peaks centered at 106.8, 106.1, 104.5, and 103.8 eV are observed (named A–D in Fig. 4). According to the literature, such peaks may be assigned to the partial replacement of the oxygen atoms from the tetrahedral structure by Si atoms.59,60 Thus, A–D sub-peaks could be associated to Si4+ (Si–O from Si–O4), Si3+ (Si–O from Si–Si–O3), Si2+ (Si–O from Si2–Si–O2) and Si1+ (Si–O from Si3–Si–O), respectively.59,60 This interpretation is consistent with the O 1s peak, which does not display any broadening (as the Si–O bond is not directly affected by such substitution) but only a shift with increasing calcination and polarization temperatures (Fig. S5†). Another explanation for the four peaks derived from the Si 2p signal, and which would be in agreement with the Raman spectra shown in Fig. 1a and b, would be the formation of structural defects involving n-membered tetrahedral rings. This could also explain the shift of the O 1s signal from 533.2 eV (c-150/aSiO2 and p-150/aSiO2) to 531.7/531.9 eV (c-500/aSiO2/p-500/aSiO2), 533.5/532.9 eV (c-800/aSiO2/p-800/aSiO2) and 531.7/531.4 eV (c-1000/aSiO2/p-1000/aSiO2). Thus, since the change in ring size, as determined by Raman spectroscopy, affects the neighboring chemical environment but not directly the Si–O bond, there would be a shift of the O 1s peak without broadening.
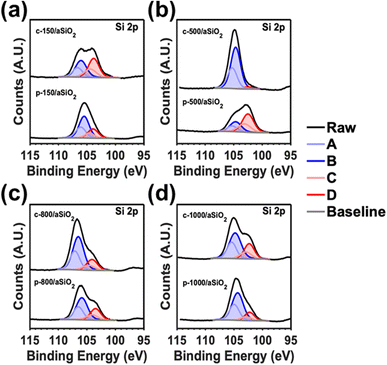 | ||
| Fig. 4 High resolution Si 2p spectra of: (a) c-150/aSiO2 and p-150/aSiO2; (b) c-500/aSiO2 and p-500/aSiO2; (c) c-800/aSiO2 and p-800/aSiO2; and (d) c-1000/aSiO2 and p-1000/aSiO2. | ||
The variation in the distributions of the four deconvoluted Si 2p peaks with calcination and polarization temperatures (Table S1†) suggests that the c-T/aSiO2 and p-T/aSiO2 samples follow a pattern resembling that observed in the Raman spectra (Fig. 1a and b). For example, while D showed the highest percentage for c-150/aSiO2, p-150/aSiO2 and p-500/aSiO2, B was the most populated for the rest of the samples. This similarity between the results obtained by XPS and Raman spectroscopy supports the hypothesis that, after dehydration, the distribution of n-membered tetrahedral rings tends to reorganize. According to the literature, such re-organizations are crucial to reach a thermodynamically stable configuration resulting in the permanently polarized state.19 Certainly, this work reports one of the first experimental evidences supporting the polarization mechanism proposed. Overall, the non-systematic variation of the absorbance in c-T/aSiO2 and p-T/aSiO2 samples as a function of the calcination and polarization temperatures (Fig. 1e and f) was due to a combination of two factors: (1) the change in the size of the nanoparticles due to the calcination and polarization treatment, described above (Fig. 3; Table 1); and (2) the change in the chemical structure associated to the reorganization of n-membered rings.
Fig. 5a and b shows the XRD patterns of c-T/aSiO2 and p-T/aSiO2. The characteristic diffraction broad peak centered at around 24° confirmed that nanoparticles remained amorphous after the calcination and polarization treatments, independently of the temperature applied during such treatments. Thus, while the thermoelectric polarization process was found to increase the crystallinity of calcined HAp (c-HAp), even inducing the appearance of new crystalline calcium phosphate phases,14,61 the conditions used in this work for such aggressive physical treatment did not practically alter the amorphous organization of aSiO2.
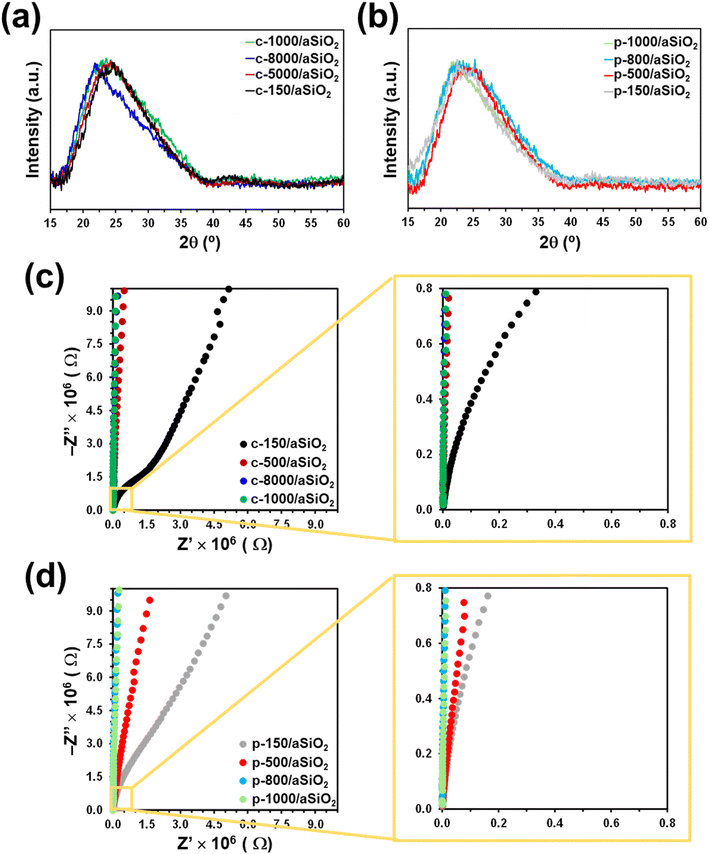 | ||
| Fig. 5 (a and b) XRD pattern and (c and d) Nyquist plots obtained for (a and c) c-T/aSiO2 and (b and d) p-T/aSiO2. | ||
Electrochemical impedance spectra of c-T/aSiO2 samples are shown in Fig. 5c. The resistance of calcined samples increases with the calcination temperature. While the Nyquist plot of c-150/aSiO2 is dominated by a depressed semicircle and a straight line, which correspond to the resistance and the capacitance, respectively, the resistance of the discs calcined using temperatures equal or higher than 500 °C suffered a significant increase. A similar effect was observed for p-T/aSiO2 (Fig. 5d), even though in this case the semicircle was observed for p-150/aSiO2 and p-500/aSiO2 while p-800/aSiO2 and p-1000/aSiO2 displayed the highest resistance. Considering that in this work the objective of the thermoelectric treatment was to polarize the aSiO2 so that it acts as a catalyst, the EIS spectra indicate that this was only achieved when the polarization temperature is 150 °C and, to a lesser extent, at 500 °C.
The thermoelectric polarization of HAp to produce p-HAp resulted not only in significant structural changes (i.e. the crystallinity increased and a brushite-like domains appeared at the outer surface layer due to the re-orientation of the OH− groups61) but also in an enhancement of the electrical properties, which was attributed to the controlled generation of vacancies, the specific orientation of the remaining OH− groups and the surface charge accumulation.15 Both structural and electrical changes were maximum when p-HAp was obtained using a calcination and polarization temperature of 1000 °C, the material derived from such conditions showing the best performance as catalyst in CO2 conversion reactions. Although the structure and polarization mechanisms of HAp and aSiO2 are very different and, consequently, not comparable, it is expected that in both cases the greatest catalytic efficiency corresponds to the conditions in which the mineral has experienced greater structural and electrical changes. In this work, the maximum changes have been obtained when aSiO2 has been treated using calcination and polarization temperatures of 150 °C and, to a lesser extent, of 500 °C. According to these observations, it can be anticipated that the catalytic performance of p-150/aSiO2 should be better than that of p-500/aSiO2, which in turn should be much better than those of p-800/aSiO2 and p-1000/aSiO2.
Catalytic fixation of CO2 using p-T/aSiO2
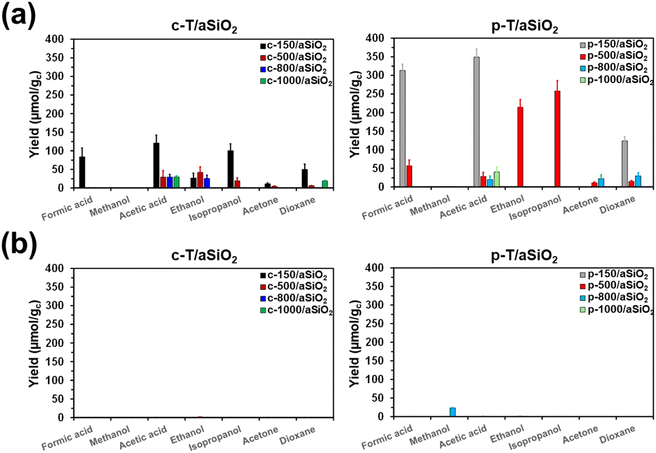
The efficiency of c-T/aSiO2 (control) and p-T/aSiO2 as catalysts to convert CO2 into valuable chemical products was examined using a batch reaction with 6 bar of CO2 and 40 mL at 120 °C for 72 h. The reaction products were evaluated by 1H-NMR, quantifying the amount of product dissolved in the liquid water (hereafter named “supernatant”) and adsorbed on the catalyst. Blank reactions were conducted using pristine aSiO2 (i.e. without applying any calcination and/or thermoelectric polarization process) and without any material as catalyst. Reactions were conducted without applying any external electrical field and UV radiation, as is usual for electrocatalysts and photocatalysts, respectively.Fig. 6 represents the yield (expressed in μmol of product per gram of catalyst; μmol gc−1) in the supernatant and the catalyst for each reaction product from CO2 conversion identified in the processes catalyzed by c-T/aSiO2 and p-T/aSiO2, while yield values are listed in Table S2.† It is worth noting that a variety of reactions products with one, two, three and four carbon atoms (usually denoted C1, C2, C3 and C4, respectively) were identified by 1H NMR: (i) formic acid and methanol as C1; (ii) acetic acid and ethanol as C2; (iii) isopropanol and acetone as C3; and (iv) dioxane as the only C4 product. For both, c-T/aSiO2 and p-T/aSiO2, and regardless of the calcination and polarization temperatures, the amount of reaction products dissolved in the supernatant (Fig. 6a) was much higher than the amount of chemicals adsorbed on the solid catalyst (Fig. 6b), where only residual amounts were found.
No reaction product was detected from the blank reaction without catalyst, while the blank reaction using untreated aSiO2 as catalyst produced residual amounts of acetic acid and acetone (i.e. 2.3 ± 0.2 and 0.4 ± 0.2 μmol gc−1, respectively) in comparison to c-T/aSiO2 and p-T/aSiO2, as is shown in Table S2.† On the other hand, the yields obtained in the supernatant were significantly lower for c-T/aSiO2 controls than for p-T/aSiO2, even though in both cases the yields were drastically affected by the calcination and polarization temperatures (Fig. 6). These features are clearly evidenced in Fig. 7, which compares the total reaction yields (expressed as the sum of the yields for all the reaction products) for c-T/aSiO2 and p-T/aSiO2 catalysts.
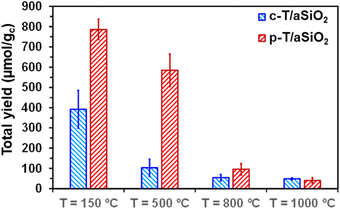 | ||
| Fig. 7 Total yield (i.e. sum of the yields for all the reaction products dissolved in the supernatant and adsorbed on the catalyst) for c-T/aSiO2 and p-T/aSiO2 catalysts. | ||
The highest total reaction yield (786.3 ± 50.5 μmol gc−1) was obtained for p-150/aSiO2 (Fig. 7), with the values obtained for c-150/aSiO2, c-500/aSiO2, c-800/aSiO2 and c-1000/aSiO2 being lower by 50%, 87%, 93% and 94%, respectively. It is worth noting that the drop in the total reaction yield observed for the c-T/aSiO2 samples with increasing calcination temperature was fully consistent with the EIS results, which reflected that the electrical resistance was much higher for the samples prepared using calcination temperatures of 500, 800 and 1000 °C than for c-150/aSiO2 (Fig. 5c). Similarly, comparison of the results obtained for the different polarized samples indicates that the total yield decreased with increasing polarization temperature (Fig. 7), following the increasing trend of the electrical resistance of the polarized material as observed by EIS. Thus, the total yields obtained for p-500/aSiO2, p-800/aSiO2 and p-1000/aSiO2 were lower than that achieved for p-150/aSiO2 by 26%, 88% and 95%, respectively (Fig. 7). It should be remarked that, as predicted in the previous sub-section, p-150/aSiO2 and p-500/aSiO2 were the ones that behaved as catalysts, even though the former was more efficient than the latter lower (i.e. 786.3 ± 50.5 μmol gc−1vs. 584.9 ± 80.8 μmol gc−1).
Analysis of the reaction products obtained using p-150/aSiO2 as catalyst reveals the formation of C1 (formic acid), C2 (acetic acid) and C4 (dioxane) with yields of 313.5 ± 16.9, 349.1 ± 21.8 and 123.7 ± 11.7 μmol gc−1 (i.e. 39.9%, 44.4% and 15.7%, respectively). It is worth mentioning that, although p-150/aSiO2 behaves as a non-selective catalyst, it is able to promote the formation of C4 products. This was never achieved with p-HAp, independently of the reaction conditions. However, p-HAp was tuned to be selective towards the formation of ethanol and acetic acid (C2), regardless of the reactions parameters, by adapting the set-up used for the thermoelectric polarization.14,62 More specifically, the formation of a brushite-like phase was induced at the surface of p-HAp, preferentially giving C2 products, even though a significant amount of C1 (formic acid) and a residual yield of C3 (acetone) were also detected (see below).
On the other hand, the variety of reaction products derived from the process with p-500/aSiO2 was much higher than that obtained using p-150/aSiO2. Specifically, formic acid and dioxane were the only C1 and C4 product, respectively, produced by the reaction with such two catalysts, even though the reaction yields were 5.5 and 8.3 times higher for p-150/aSiO2 than for p-500/aSiO2. However, p-500/aSiO2 promoted the production of acetic acid and ethanol as C2 and isopropanol and acetone as C3. Interestingly, the maximum yields were obtained for ethanol (215.2 ± 20.8 μmol gc−1) and isopropanol (258.0 ± 28.4 μmol gc−1), which were not observed for the reaction catalyzed by p-150/aSiO2.
Overall, results show that p-150/aSiO2 is a free-metal efficient and, as consequence of both its natural abundance and the relatively low temperature required for its polarization, low-cost and sustainable catalyst. This material is capable of catalyzing the formation of C–C bonds, leading not only to the formation of C2 and C3, but also C4. Although selectivity is still pending, this issue will be addressed in future work following a strategy similar to that followed for p-HAp, which consisted in the activation of the surface by inducing the formation of a more ordered phase during the thermoelectric polarization process.14,63
Comparison between p-150/aSiO2 and p-HAp
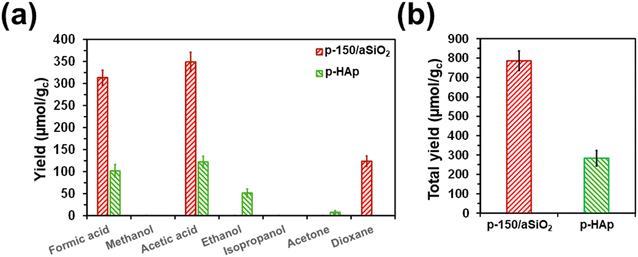
The aim of this sub-section is to quantitatively compare the activity and selectivity of p-150/aSiO2 and p-HAp catalysts in the conversion of CO2 to valuable chemical products. For this purpose, batch reactions using experimental conditions identical to those described above for p-150/aSiO2 (6 bar of CO2 and 40 mL of water at 120 °C for 72 h) were conducted for p-HAp. It is worth noting that such conditions were never used before for p-HAp catalyst, which was prepared following the procedure reported in the literature.63 The yields of the individual reaction products are displayed in Fig. 8a and Table S3,† while the total yields are compared in Fig. 8b.In general, the yields were much higher for p-150/aSiO2 than for p-HAp (i.e. around 2.8 times in terms of total yield). While the reaction with p-150/aSiO2 produced similar amounts of formic acid (C1) and acetic acid (C2), the sum of the yields of acetic acid and ethanol was higher than the yield of formic acid in the reaction catalyzed by p-HAp. Thus, the C2![[thin space (1/6-em)]](https://www.rsc.org/images/entities/char_2009.gif) :
:![[thin space (1/6-em)]](https://www.rsc.org/images/entities/char_2009.gif) C1 yields ratio was 1.11 and 1.70 for p-150/aSiO2 and p-HAp, respectively. On the other hand, the amount of acetone (C3) produced by p-HAp was very low in comparison to the yield of dioxane (C4) in the reaction catalyzed by p-150/aSiO2, indicating that the C–C coupling is more favored in the latter than in the former.
C1 yields ratio was 1.11 and 1.70 for p-150/aSiO2 and p-HAp, respectively. On the other hand, the amount of acetone (C3) produced by p-HAp was very low in comparison to the yield of dioxane (C4) in the reaction catalyzed by p-150/aSiO2, indicating that the C–C coupling is more favored in the latter than in the former.
The main structural and surface characteristics of p-150/aSiO2 and p-HAp are summarized in Table 3. The BET surface area and the pore size were much higher and smaller (i.e. two and one orders of magnitude, respectively) for p-150/aSiO2 than for p-HAp, which is consistent with the yields displayed in Fig. 8.
| p-150/aSiO2 | p-HAp | |
|---|---|---|
| BET surface area (m2 g−1) | 445.91 | 3.87 |
| Pore volume (cm3 g−1) | 0.413 | 0.014 |
| Pore diameter (nm) | 3.71 | 14.6 |
In conclusion, the application of thermoelectric treatment to aSiO2 to convert it into a compound with catalytic activity revealed significant differences with respect to Hap. Thus, catalytic properties of permanently polarized Hap were obtained by orienting the OH− groups and accumulating charge at the intergranular regions,14,15 while when applied to aSiO2 the thermoelectric treatment mainly affects to the superficial Si–OH groups, suggesting a different mechanism for the catalytic transformation of CO2 in valuable chemical products. The polarization of aSiO2 was only achieved when the temperature was 150 °C and, to a lesser extent, 500 °C. Future studies will be addressed to compare the catalytic stability of p-150/aSiO and p-HAp, the latter being known to be very stable and easily regenerable.64 Although the energy required to polarize aSiO2 at 150 °C is much lower than that necessary for p-HAp (ideally 1000 °C), the lack of selectivity needs also to be addressed. Thus, p-150/aSiO2 performs better than p-Hap, in terms of CO2 fixation but shows a worse performance when selectivity is involved. Therefore, the assessment of the sustainability of p-150/aSiO2 as a catalyst will depend on the total mass and energy balance specific to each process, as it is necessary to consider the energy required to separate the products derived from said catalytic process. On the other hand, the abundance of aSiO2 and the fact that no precious or heavy metals need to be added represent a clear advantage in terms of sustainability with respect to metal-based catalysts proposed for CO2 fixation.
Conclusions
For the first time, the thermoelectric polarization was applied to aSiO2 to produce catalysts capable of converting CO2 into valuable chemical products. Unlike what was observed for p-HAp, which required a higher polarization temperature to induce chemical and structural changes large enough to produce catalytic activity, in the case of p-T/aSiO2 the greatest changes were obtained when the polarization temperature was 150 °C. Although p-500/aSiO2 also presented some catalytic activity, much lower than that of p-150/aSiO2, the activity of p-800/aSiO2 and p-1000/aSiO2 was practically null.The catalytic selectivity of p-150/aSiO2 under the studied conditions (batch reaction with 6 bar of CO2 and 40 mL of water at 120 °C) was low in the sense that produced C1 (formic acid), C2 (acetic acid) and C4 (dioxane) products with high yields. Thus, the selectivity towards C1, C2 and C4 was 39.9%, 44.4% and 15.7%, respectively. However, no other products, such as ethanol and acetone, which are typically obtained using p-HAp, were detected. Additionally, it is worth mentioning that no C4 product was ever obtained using p-Hap as catalyst, even though for the latter the number of reaction conditions tested was very extensive.
Overall, this work should be considered as a proof of concept in which we demonstrate that p-150/aSiO2 is a promising catalyst for the efficient CO2 catalytic conversion into valuable chemical products and, by extension, also shows the potential of the thermoelectrically polarization treatment towards new material candidates. The most important advantages of this catalyst are the abundance and low cost of the source material, aSiO2, and the mild conditions required to transform aSiO2 to p-150/aSiO2. Thus, the latter should be considered a priori as a sustainable catalyst. Future work will be aimed to refine the properties of p-T/aSiO2 by examining the influence of the voltage and the process used in the calcination step (i.e. water vapor atmosphere vs. air) to obtain not only the maximum efficiency in continuous reactions but also the optimum selectivity and maximum stability.
Data availability
The data supporting this article have been included as part of the ESI.†Conflicts of interest
The authors declared that there is no conflict of interest in this work.Acknowledgements
Authors acknowledge the Agència de Gestió d'Ajuts Universitaris i de Recerca (2021 SGR 003879). This publication and other research outcomes are supported by the predoctoral program AGAUR-FI ajuts (2023 FI-100056) Joan Oró to M. A., which is backed by the Secretariat of Universities and Research of the Department of Research and Universities of the Generalitat of Catalonia, as well as the European Social Plus Fund. This work is part of Maria de Maeztu Units of Excellence Programme CEX2023-001300-M/funded by MCIN/AEI/10.13039/501100011033. Support for the research of C. A. was also received through the prize “ICREA Academia” for excellence in research funded by the Generalitat de Catalunya. J. S. is a Margarita Salas Fellow.References
- A. Rogina, M. Antunović and D. Milovac, J. Biomed. Mater. Res., Part B, 2019, 107, 197–204 CrossRef CAS PubMed.
- J. Park, B. J. Kim, J. Y. Hwang, Y. W. Yoon, H. S. Cho, D. H. Kim, J. K. Lee and S. Y. Yoon, J. Nanosci. Nanotechnol., 2018, 18, 837–841 CrossRef CAS PubMed.
- P. Shi, M. Liu, F. Fan, C. Yu, W. Lu and M. Du, Mater. Sci. Eng., C, 2018, 90, 706–712 CrossRef CAS PubMed.
- F. Barbosa, F. F. F. Garrudo, P. S. Alberte, L. Resina, M. S. Carvalho, A. Jain, A. C. Marques, F. Estrany, F. J. Rawson, C. Alemán, F. C. Ferreira and J. C. Silva, Sci. Technol. Adv. Mater., 2023, 24, 2242242 CrossRef PubMed.
- Y. Wang, B.-b. Chen, M. Crocker, Y.-j. Zhang, X.-b. Zhu and C. Shi, Catal. Commun., 2015, 59, 195–200 CrossRef CAS.
- R. Monjezi, A. Bouriakova, A. Bjelić, P. M. Heynderickx, G. J. Heynderickx, D. Poelman, J.-M. Giraudon, J.-F. Lamonier, R. Morent and J. W. Thybaut, Chem. Eng. J., 2024, 489, 151324 CrossRef CAS.
- A. Pérez Alonso, A. Serrano-Maldonado, J.-B. Ledeuil, L. Madec, D. P. Minh, D. Pla and M. Gómez, ACS Sustainable Resour. Manage., 2024, 1, 451–461 CrossRef.
- T. Q. Tran, D. P. Minh, T. S. Phan, Q. N. Pham and H. N. Xuan, Chem. Eng. Sci., 2020, 228, 115975 CrossRef CAS.
- K. Yamashita, N. Oikawa and T. Umegaki, Chem. Mater., 1996, 8, 2697–2700 CrossRef CAS.
- S. Itoh, S. Nakamura, M. Nakamura, K. Shinomiya and K. Yamashita, Biomaterials, 2006, 27, 5572–5579 CrossRef CAS PubMed.
- S. Ohba, W. Wang, S. Itoh, Y. Takagi, A. Nagai and K. Yamashita, J. Biomed. Mater. Res., Part A, 2012, 100, 3167–3176 CrossRef PubMed.
- M. Arnau, J. Sans, P. Turon and C. Alemán, J. Mater. Chem. A, 2023, 11, 1324–1334 RSC.
- J. Sans, M. Arnau, V. Sanz, P. Turon and C. Alemán, Chem. Eng. J., 2022, 446, 137440 CrossRef CAS.
- J. Sans, J. Llorca, V. Sanz, J. Puiggalí, P. Turon and C. Alemán, Langmuir, 2019, 35, 14782–14790 CrossRef CAS PubMed.
- J. Sans, M. Arnau, V. Sanz, P. Turon and C. Alemán, Adv. Mater. Interfaces, 2022, 9, 2101631 CrossRef CAS.
- M. Rivas, L. J. del Valle, E. Armelin, O. Bertran, P. Turon, J. Puiggalí and C. Alemán, ChemPhysChem, 2018, 19, 1746–1755 CrossRef CAS PubMed.
- X. Dong, X. Li, X. Chen, J. Wu and H. Zhou, Chem. Eng. J., 2021, 409, 128231 CrossRef CAS.
- W. Qin, M. Zhao, Z. Li, D. Zhang, M. Zhang, Y. Xu, L. Jin and Y. Yan, Chem. Eng. J., 2022, 443, 136505 CrossRef CAS.
- J. Sans, M. Arnau, A. Fontana-Escartín, P. Turon and C. Alemán, Chem. Mater., 2023, 35, 3765–3780 CrossRef CAS.
- J. Xia, K. Li and G. L. Zhao, ACS Appl. Energy Mater., 2020, 3, 1484–1495 CrossRef CAS.
- A. Vijay, K. V. Ramanujachary, S. E. Lofland and S. Vaidya, Electrochim. Acta, 2022, 407, 139887 CrossRef CAS.
- J. Sans, G. Revilla-López, V. Sanz, J. Puiggalí, P. Turon and C. Alemán, Chem. Commun., 2021, 57, 5163–5166 RSC.
- L. Yi, Y. Zhang, K. Nie, B. Li, Y. Yuan, Z. Liu and W. Huang, Coord. Chem. Rev., 2024, 501, 215569 CrossRef CAS.
- Z. Liu, K. Nie, Y. Yuan, B. Li, P. Liu, S. Chong, Y. Du and W. Huang, CCS Chem., 2022, 4, 3391–3401 CrossRef CAS.
- M. C. Wingert, J. Zheng, S. Kwon and R. Chen, Sci. Technol., 2016, 31, 113003 Search PubMed.
- O. W. Flörke, H. A. Graetsch, F. Brunk, L. Benda, S. Paschen, H. E. Bergna, W. O. Roberts, W. A. Welsh, C. Libanati, M. Ettlinger, D. Kerner, M. Maier, W. Meon, R. Schmoll, H. Gies and D. Schiffmann, Silica, in Ullmann's Encyclopedia of Industrial Chemistry, Wiley Verlag & Co., Weinheim, Germany, 2008, p. 23, ISBN 978-3-527-30673-2 Search PubMed.
- Y. Sagawa, Y. Masubuchi and S. Kikkawa, J. Am. Ceram. Soc., 2019, 102, 109–117 CrossRef CAS.
- Z. Xiao, F. Tan, W. Wang, F. Sun, H. Lu, X. Qiu, J. Chen and X. Qiao, Ceram. Int., 2014, 40, 3503–3509 CrossRef CAS.
- J. Tang, H. Hu, X. He, Y. Xu, Y. Zhang, Z. Guan, S. Zhang and H. Xu, Adv. Opt. Mater., 2021, 9, 2100191 CrossRef CAS.
- S. Choudhary, J. Mater. Sci.: Mater. Electron., 2018, 29, 10517–10534 CrossRef CAS.
- Q. Chen, M. Lei, Y. Chen, Y. Deng and M. Chen, Ceram. Int., 2023, 49, 32679–32693 CrossRef CAS.
- S. Niu, Z. Liu, Y. Luo, X. Li, T. Zhou, Y. Si, Y. Liu, S. Zheng, X. Zhao and X. Xu, Ceram. Int., 2023, 49, 31378–31384 CrossRef CAS.
- C. Fruijtier-Pölloth, The safety of nanostructured synthetic amorphous silica (SAS) as a food additive (E 551), Arch. Toxicol., 2016, 90, 2885–2916 CrossRef PubMed.
- J. R. Costa, A. P. Capeto, C. F. Pereira, S. S. Pedrosa, I. F. Mota, J. d. S. Burgal, A. I. Pintado, M. E. Pintado, C. S. S. Oliveira, P. Costa and A. R. Madureira, Valorization of sugarcane by-products through synthesis of biogenic amorphous silica microspheres for sustainable cosmetics, Nanomaterials, 2022, 12, 4201 CrossRef CAS PubMed.
- K. Nishikawa, K. Yamaguchi, T. Suzuki, S. Hashimoto and S. Rossignol, Effect of Amorphous Silica Fume as Active Filler for Rapid Densification of the Geopolymer Products Formed by Warm Pressing, Ceram. Int., 2022, 48, 36917–36924 CrossRef CAS.
- N. Dishovsky, P. Malinova and I. Uzunov, Biogenic amorphous silica as filler for elastomers, J. Renewable Mater., 2018, 6, 402–412 CrossRef CAS.
- P. Castro-Fernández, A. I. Serykh, A. V. Yamikov, I. P. Prosvirin, A. V. Bukhtiyarov, P. M. Abdala, C. Copéret, A. Fedorov and C. R. Müller, Catal. Sci. Technol., 2022, 12, 3957–3968 RSC.
- H. Fujitsuka, T. Kobayashi and T. Tago, J. CO2 Util., 2021, 53, 101707 CrossRef CAS.
- J. Xu, R. Wang, L. Zheng, J. Ma, W. Yan, X. Yang, J. Wang, X. Su and Y. Huang, Catal. Sci. Technol., 2021, 11, 1510–1518 RSC.
- C. S. Ewing, G. Veser, J. J. McCarthy, J. K. Johnson and D. S. Lambrecht, J. Phys. Chem. C, 2015, 119, 19934–19940 CrossRef CAS.
- N. M. Ha, T. T. Huong and N. T. Son, J. Environ. Sci. Health, Part A: Toxic/Hazard. Subst. Environ. Eng., 2023, 58, 506–514 CrossRef CAS PubMed.
- Y. Xu, N. J. LiBretto, G. Zhang, J. T. Miller and J. Greeley, ACS Catal., 2022, 12, 5416–5424 CrossRef CAS.
- P. Reif, N. K. Gupta and M. Rose, Green Chem., 2023, 25, 1588–1596 RSC.
- F. Tielens, M. Gierada, J. Handzlik and M. Calatayud, Catal. Today, 2020, 354, 3–18 CrossRef CAS.
- G. Uzcátegui and A. de Klerk, Fuel, 2021, 293, 120479 CrossRef.
- F. J. A. G. Coumans, E. Demiröz, N. Kosinov and E. J. M. Hensen, ChemCatChem, 2022, 14, e202200266 CrossRef CAS.
- F. Müller, C. A. Ferreira, D. S. Azambuja, C. Alemán and E. Armelin, J. Phys. Chem. B, 2014, 118, 1102–1112 CrossRef PubMed.
- M. D. Hanwell, D. E. Curtis, D. C. Lonie, T. Vandermeersch, E. Zurek and G. R. Hutchison, J. Cheminf., 2012, 4, 17 CAS.
- Gaussian 16, Revision B.01, M. J. Frisch, G. W. Trucks, H. B. Schlegel, G. E. Scuseria, M. A. Robb, J. R. Cheeseman, G. Scalmani, V. Barone, G. A. Petersson, H. Nakatsuji, X. Li, M. Caricato, A. V. Marenich, J. Bloino, B. G. Janesko, R. Gomperts, B. Mennucci, H. P. Hratchian, J. V. Ortiz, A. F. Izmaylov, J. L. Sonnenberg, D. Williams-Young, F. Ding, F. Lipparini, F. Egidi, J. Goings, B. Peng, A. Petrone, T. Henderson, D. Ranasinghe, V. G. Zakrzewski, J. Gao, N. Rega, G. Zheng, W. Liang, M. Hada, M. Ehara, K. Toyota, R. Fukuda, J. Hasegawa, M. Ishida, T. Nakajima, Y. Honda, O. Kitao, H. Nakai, T. Vreven, K. Throssell, J. A. Montgomery Jr, J. E. Peralta, F. Ogliaro, M. J. Bearpark, J. J. Heyd, E. N. Brothers, K. N. Kudin, V. N. Staroverov, T. A. Keith, R. Kobayashi, J. Normand, K. Raghavachari, A. P. Rendell, J. C. Burant, S. S. Iyengar, J. Tomasi, M. Cossi, J. M. Millam, M. Klene, C. Adamo, R. Cammi, J. W. Ochterski, R. L. Martin, K. Morokuma, O. Farkas, J. B. Foresman and D. J. Fox, Gaussian, Inc., Wallingford CT, 2016 Search PubMed.
- A. D. Becke, J. Chem. Phys., 1993, 98, 5648–5652 CrossRef CAS.
- A. D. McLean and G. S. Chandler, J. Chem. Phys., 1980, 72, 5639–5648 CrossRef CAS.
- R. C. Binning and L. A. Curtiss, J. Comput. Chem., 1990, 11, 1206–1216 CrossRef CAS.
- Y. Li, Z. Feng, Y. Lian, K. Sun, L. Zhang, G. Jia, Q. Yang and C. Li, Microporous Mesoporous Mater., 2005, 84, 41–49 CrossRef CAS.
- A. Alessi, S. Agnello, G. Buscarino and F. M. Gelardi, J. Non-Cryst. Solids, 2013, 362, 20–24 CrossRef CAS.
- P. Makreski, G. Jovanovski and A. Gajovic, Vib. Spectrosc., 2006, 40, 98–109 CrossRef CAS.
- T. Uchino, Y. Kitagawa and T. Yoko, Phys. Rev. B: Condens. Matter Mater. Phys., 2000, 61, 234–240 CrossRef CAS.
- S. C. Feifel and F. Lisdat, J. Nanobiotechnol., 2011, 9, 59 CrossRef CAS PubMed.
- K. M. Li, J.-G. Jiang, S.-C. Tian, X.-J. Chen and F. Yan, J. Phys. Chem. C, 2014, 118, 2454–2462 CrossRef CAS.
- S. Kim, M. C. Kim, S.-H. Choi, K. J. Kim, H. N. Hwang and C. C. Hwang, Appl. Phys. Lett., 2007, 91, 103113 CrossRef.
- Y. Zhong, X. Qiu, J. Gao and Z. Guo, ISIJ Int., 2019, 59, 1098–1104 CrossRef CAS.
- J. Sans, M. Arnau, V. Sanz, P. Turon and C. Alemán, Chem. Eng. J., 2022, 433, 133512 CrossRef CAS.
- J. Sans, M. Arnau, P. Turon and C. Alemán, Mater. Horiz., 2022, 9, 1566–1576 RSC.
- J. Sans, M. Arnau, J. J. Roa, P. Turon and C. Alemán, ACS Appl. Nano Mater., 2022, 5, 8526–8536 CrossRef CAS PubMed.
- M. Arnau, J. Sans, J. L. Tamarit, M. Romanini, P. Turon and C. Alemán, Adv. Mater. Interfaces, 2024, 2400422 CrossRef.
Footnote |
| † Electronic supplementary information (ESI) available. See DOI: https://doi.org/10.1039/d4se01389a |
| This journal is © The Royal Society of Chemistry 2024 |

