 Open Access Article
Creative Commons Attribution 3.0 Unported Licence
Physically crosslinked polyacrylates by quadruple hydrogen bonding side chains†
Jente
Verjans
a,
Alexis
André
bc,
Tomáš
Sedlačík
 a,
Resat
Aksakal
 d,
Evelyne
van Ruymbeke
 *b and
Richard
Hoogenboom
 *a
*a
aSupramolecular Chemistry Group, Centre of Macromolecular Chemistry (CMaC), Department of Organic and Macromolecular Chemistry, Ghent University, B-9000 Ghent, Belgium. E-mail: Richard.Hoogenboom@ugent.be
bBio- and Soft Matter, Institute of Condensed Matter and Nanosciences, Université catholique de Louvain, B-1348 Louvain-la-Neuve, Belgium. E-mail: evelyne.vanruymbeke@uclouvain.be
cSoft Matter, Rheology and Technology (SMaRT), Department of Chemical Engineering, Katholieke Universiteit Leuven, B-3001 Leuven, Belgium
dPolymer Chemistry Research Group, Centre of Macromolecular Chemistry (CMaC), Department of Organic and Macromolecular Chemistry, Ghent University, B-9000 Ghent, Belgium
First published on 18th October 2024
Abstract
Dynamic polymer materials can be obtained by introducing supramolecular interactions between the polymer chains. Here we report on the preparation and mechanical properties of poly(methyl acrylate) (PMA) and poly(n-butyl acrylate) (PBA) funcionalized with ureidopyrimidinone (UPy) in the side chains. In contrast to the traditional UPy with a methyl group, the selected UPy motif contained a branched alkyl side chain, which enhances solubility, compatibility with the polymer matrix and potentially prevents stacking of UPy dimers. Low molar mass PMA and PBA were synthesized via Cu(0)-mediated radical polymerization and allyl bonds were introduced with different degrees of functionalization by stoichiometrically controlled transesterification with allyl alcohol. The allyl esters served as functional handles for UPy attachment via UV-initiated radical thiol–ene coupling. The PMA–UPy materials displayed a more glassy appearance, in contrast to the rubbery PBA–UPy polymer networks, associated to its higher glass transition temperature. The mechanical properties of the resulting hydrogen bonded polymer networks were assessed by thermogravimetric analysis, differential scanning calorimetry, dynamic mechanical thermal analysis and tensile testing, followed by rheological analysis of the network dynamics. Furthermore, the effect of associative groups on the linear viscoelastic response is discussed based on a modified sticky Rouse model indicating the absence of significant aggregation or phase separation of the UPY units.
1. Introduction
Polyacrylates are amongst the most widely used polymer platforms owing to their facile customization potential and they are used in a vast amount of application fields, including medicine,1–3 energy storage,4–6 stimuli-responsive sensors7–9 and self-healing materials.10–12 Many of these interesting properties can be achieved by the introduction of supramolecular interactions, such as hydrophobic forces, electrostatic interactions,11,13,14 metal–ligand coordination,15–17 host–guest interactions12,18,19 and hydrogen bonding.20–22 When focusing more on the latter, one of the most popular hydrogen bonding motifs is the quadruple hydrogen bonding ureidopyrimidinone (UPy) unit developed by Meijer and coworkers.23 Numerous materials have been synthesized where the self-complementary UPy molecules were used to form supramolecular polymers,24–26 or to create supramolecular polymer networks with dynamic properties.27–36 The most employed UPy variant contains a methyl side chain, which can be easily obtained from the commercial 6-methylisocytosine.37 However, due to its high polarity and the formation of flat dimers, it may induce the formation of phase-separated dimer stacks resulting in a hard phase in the material.38,39 As demonstrated in our previous work for polybutadiene (PB), introducing a UPy molecule with a branched alkyl chain into the polymer side chains dramatically enhanced the solubility in organic solvents and provided a better compatibility with the PB polymer matrix.40Generally, there are two main strategies to introduce functionality into a polymer. The first one is the use of a functional comonomer that is copolymerized with one or more other monomers. The incorporation of a functional monomer can be controlled by variation of the polymerization conditions. Although this strategy works in many situations, it also has its limitations. Some envisioned monomers containing reactive groups susceptible to side reactions that interfere with the polymerization system (e.g. reactive alkenes or alkynes) cannot be used and other monomers with slow polymerization kinetics can be difficult to incorporate in large amounts and uniformly along the polymer chains. These issues can be solved by applying the second main strategy towards functional polymers, i.e. post-polymerization modification. The synthesis of the starting polymer is often already optimized to produce defined polymers or the desired polymer can even be bought commercially. Recently, our group developed a transesterification protocol which allows facile modification of polymers with side-chain esters, yielding functional copolymers while maintaining the dispersity of the starting polymer.41
In this work, we explored the formation of hydrogen bonded poly(alkyl acrylate)s by introducing UPy side-chains into the widely investigated poly(methyl acrylate) (PMA) and poly(n-butyl acrylate) (PBA) polymers. Compared to our previous work on PB with UPy side-chains, the ester side-chains of the polyacrylates increase the polarity of the polymers, which is expected to lead to competing hydrogen bonding interactions with the UPy units and less hydrophobic enforcement of the hydrogen bonds in this more polar matrix. In analogy to the PB–UPy materials, we opted for the introduction of allyl groups in the polyacrylates through partial transesterification of the ester side-chains with allylalcohol. The resulting allyl-functionalized polymers, were used for coupling of the thiolated UPy units (UPy-SH) via radical thiol–ene chemistry. Subsequently, the obtained crosslinked materials were characterized to assess the thermal and mechanical properties of the obtained materials. In addition, modelling of the rheological behavior of these materials was performed to gain deeper insights into the network dynamics of the supramolecular polymer networks. More specifically, we investigated and predicted the effect of associative groups on the linear viscoelastic response of the hydrogen bonded polyacrylate networks using the model developed by Liu et al. in which they took into account that the associated supramolecular entities have the ability to diffuse over a certain distance, thereby partially relieving the stress. Subsequently, they integrated these non-affine spatial fluctuations into the sticky Rouse model using a phenomenological approach.42
2. Results and discussion
2.1 Synthesis and characterization of the supramolecular polymer networks
At first, well-defined PMA and PBA were prepared via Cu(0)-mediated radical polymerization. The subsequent synthetic steps towards the final supramolecular polymer networks are depicted in Scheme 1. First, the desired amount of allyl ester side chains are introduced on the polyacrylates via organocatalyzed partial transesterification, followed by thiol–ene coupling of the thiol-functional UPy motifs. The utilized UPy motifs have a branched ethylpentyl group aiming to enhance compatibilization within the polymer networks and to suppress phase separation. The synthesis of the polymers and the post-polymerization modification procedures is discussed in more detail in the following sections.As a first polyacrylate platform, PMA was chosen and a degree of polymerization of 50 monomer units per initiator was targeted (DP50) to obtain a low molar mass polymer (PMA50). The monomer was polymerized at room temperature initiated by ethyl α-bromoisobutyrate (EBiB) with tris[2-(dimethylamino)ethyl]amine (Me6-Tren) as a ligand to form the copper complexes.45 After precipitation in cold diethyl ether, the end group was converted to a thioether with butanethiol (no specific reason for chosen these reagents rather than their availability in the lab) to prevent potential side reactions due to the bromide in the subsequent post-polymerization modification steps.46 The 1H-NMR spectra of the purified polymers in Fig. S1 (ESI†) show the upfield shift of proton g from the terminal monomer unit from 4.20 ppm to 3.16 ppm, confirming complete conversion of the bromide end groups to thioethers. Additionally, the SEC traces before and after end group modification displayed in Fig. S2 (ESI†) further demonstrate that the dispersity and molar mass were not affected by the thio–bromo reaction.
As a second polyacrylate precursor, PBA was selected to investigate the influence of the polyacrylate matrix on the resulting hydrogen bonded networks. Therefore, PBA with a DP50 chain length was prepared via Cu(0)-mediated controlled radical polymerization to be consistent with the previously synthesized PMA50. To polymerize n-butyl acrylate (BA), the polymerization system had to be slightly adjusted. Since the polymer precipitated in DMSO after a certain chain length was reached, the solvent was changed to DMF.47 However, this also implied that the reaction conditions had to be changed, as the polymerization conditions used for methyl acrylate don’t allow complete conversion of butyl acrylate and reduce chain end fidelity when the solvent is changed from DMSO to DMF. Therefore, PBA was synthesized via UV mediated Cu(0)-mediated controlled radical polymerization, which is known to work well in DMF.48,49
Subsequently, the end group was end-capped by an ethanethiol. Here, the volatile ethanethiol was selected over the high boiling 1-butanethiol to improve purification and to be able to better differentiate the thioether peaks from the polymer signals via1H NMR spectroscopy. Ultimately, the purified PBA was analyzed by 1H NMR spectroscopy (Fig. S3, ESI†) and SEC (Fig. S4, ESI†), confirming successful end group modification, as well as retention of the polymer structure after thiol end-capping, respectively.
After successful transesterification, the TBD had to be removed from the polymers as it could cause side reactions in the next modification step. This was realized for both PMA and PBA-based materials by addition of an acidic exchange resin to the crude reaction mixture followed by filtration, after which the signals associated with TBD disappeared from the 1H NMR spectra, as exemplified in Fig. 1 for PMA-U5. Fig. 1 also shows the 1H NMR spectra of all purified PMA-allyl polymers. The 1H NMR spectra of the purified PBA-allyl polymers are shown in Fig. S6 (ESI†). A more detailed description of the development of the purification procedure of these polymers can be found in the ESI† (Section 3).
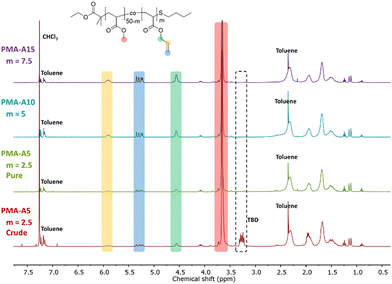 | ||
| Fig. 1 1H NMR spectra recorded in CDCl3 of the crude PMA-A5 with observable TBD impurity at 3.25 ppm, and of all PMA-allyl polymers after treatment with Dowex 50 W X8. | ||
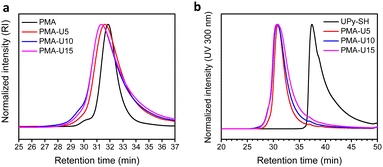
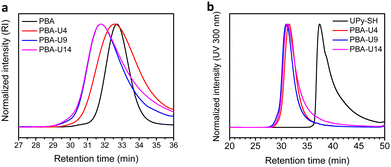
Finally, the polymer structure was analyzed by SEC, and the respective results for the PMA-allyl and PBA-allyl polymers are summarized in Fig. 2. For the PMA-allyl materials, good retention of the molar mass and narrow dispersity was observed. The almost identical molar mass of the PMA-allyl polymers to PMA indicates a similar hydrodynamic radius of the allyl ester and the methyl ester side chains and is also related to the rather low DF. To highlight the importance of end group modification of the bromide chain-ends after polymerization, a transesterification reaction was performed on PMA-Br. As seen in Fig. S7 (ESI†), a double molar mass shoulder appeared and the dispersity increased considerably. In contrast, the SEC traces of the transesterified polymers starting from the chain-end modified PMA (PMA-SR) (Fig. 2, left) show the absence of a double molar mass shoulder and the retention of the narrow dispersity. For the PBA-allyl polymers (Fig. 2, right), a moderately increased dispersity and lower molar mass was observed (as displayed in Table 1), which can be explained by the combined effects of the lower hydrodynamic volume of the allyl groups compared to the n-butyl groups that they replace and a difference in the interactions with stationary phase of the SEC columns, as the used columns are mostly designed to measure relatively polar polymers.
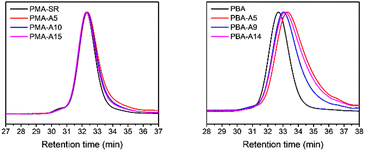 | ||
| Fig. 2 Normalized SEC traces of PMA and PBA before and after transesterification with allyl alcohol in DMA. | ||
| Polymer | M n (kg mol−1) | M w (kg mol−1) | Đ |
|---|---|---|---|
| PMA-SR | 8.4 | 8.9 | 1.05 |
| PMA-A5 | 7.6 | 8.2 | 1.08 |
| PMA-A10 | 7.8 | 8.5 | 1.09 |
| PMA-A15 | 8.0 | 8.6 | 1.08 |
| PBA | 3.8 | 4.4 | 1.15 |
| PBA-A5 | 2.2 | 3.0 | 1.41 |
| PBA-A9 | 2.8 | 3.6 | 1.29 |
| PBA-A14 | 2.4 | 4.0 | 1.35 |
| Polymer | Remaining allyl esters (%) | UPy on polymer (%) | Conversion allyl esters (%) |
|---|---|---|---|
| PMA-U5 | 0.0 | 5.4 | 100 |
| PMA-U10 | 0.0 | 10.5 | 100 |
| PMA-U15 | 0.0 | 15.2 | 100 |
| PBA-U4 | 1.0 | 4.1 | 81 |
| PBA-U9 | 1.2 | 8.6 | 88 |
| PBA-U14 | 0.0 | 14.2 | 100 |
By using a slight excess of UPy-SH, complete conversion of the allyl esters was targeted. Indeed, the 1H NMR spectra in Fig. 3 after the thiol–ene reactions show complete disappearance of the allyl protons for the PMA–UPy materials (red regions, with PMA-A15 as a reference) and the introduction of broad UPy related peaks (yellow and blue regions), indicating covalent attachment of UPy onto the polymer. Additionally, the obtained UPy content as determined from the NMR data are similar to the allyl content of the precursor polymers (Fig. S5, ESI†), confirming efficient post-polymerization modification. It should be noted that the 1H NMR spectra are shown for the purified and dried materials, as they were more suited to show the signals without overlapping solvent traces. The purification of these polymers was found to be rather difficult. The purification of the polymers and associated challenges are discussed in more detail in the ESI† (Section 3). Full removal of the excess of UPy-SH was finally achieved by preparative SEC in DMF followed by thorough drying or 24 hours under high vacuum at 80 °C to remove residual DMF as it could influence the material properties.50,51
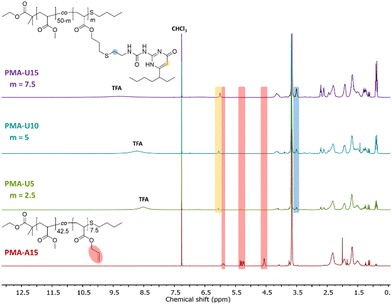 | ||
| Fig. 3 1H NMR spectra of the purified and dried PMA–UPy polymers with PMA-U15 as a reference for the allyl ester signals, recorded in CDCl3. | ||
Fig. 4 displays the SEC traces of the PMA–UPy polymers after purification, where Fig. 4b shows that the purified polymers do not contain free UPy in the UV spectrum at 300 nm.
For the final step in the synthesis of the supramolecular PBA networks, the same conditions were applied as described for the PMA–UPy networks and are summarized in Table 2. Although the reactions were carried out in the exact same manner, the thiol–ene coupling did not achieve complete conversion for PBA-U4 and PBA-U9, evidenced by the minor remaining allyl signals (red regions) in the 1H NMR spectra of these polymers after the thiol–ene reaction shown in Fig. 5. It may be speculated that the fact that the allyl bonds are in a more sterically hindered environment when surrounded by butyl esters compared to methyl esters slows down the coupling of the thiyl radicals. Nevertheless, good conversion of the allyl esters were achieved and the DF was sufficient to have enough variation in the material properties and, therefore, we proceeded with these polymers that were purified by preparative SEC in DMF followed by thorough drying to remove the DMF. In addition, the UV signal associated with free UPy disappeared in the UV traces of the SEC chromatogram (Fig. 6) confirming that pure PBA–UPy polymers were obtained.
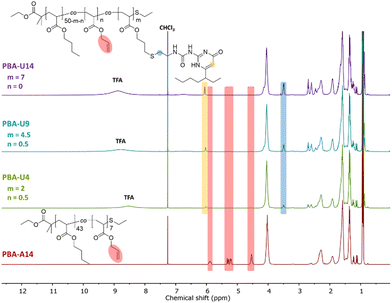 | ||
| Fig. 5 1H NMR spectra of the purified and dried PBA–UPy polymers with PBA-U14 as a reference for the allyl ester signals, recorded in CDCl3. | ||
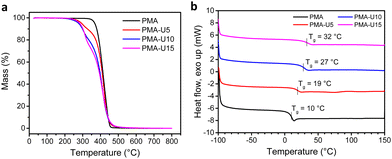
To have an indication of the thermal stability of the PMA–UPy materials, TGA was performed. The results in Fig. 7a show a thermal stability under nitrogen atmosphere up to 250 °C and an increased thermal degradation when more UPy is attached to the polymers, consistent with the observation for the PB–UPy samples reported previously.40 Next, DSC measurements were carried out to identify the glass transition temperature (Tg) of the networks and to detect potential crystallization. As seen in Fig. 7b, a gradual increase of the Tg can be observed with increasing UPy incorporation, although the observed changes are smaller compared to the previously reported PB–UPy materials.40 A possible explanation can be that because of the higher Tg of PMA, the relative effect of the incorporated UPy crosslinks on the chain mobility is smaller compared to the more flexible PB.
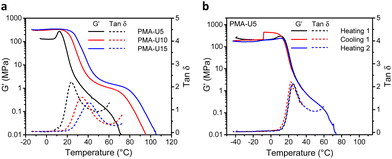
To evaluate the thermomechanical properties of the obtained PMA–UPy networks, DMTA was carried out (Fig. 8). Therefore, the materials were compression molded in a hot press to attain disks with a diameter of 6 mm for the measurements. The storage moduli (G′) of the materials range from around 130 MPa for PMA-U5 to 330 MPa for the more crosslinked PMA-U10 and PMA-U15 in the glassy region below 10 °C, indicating that these supramolecular polymer networks are rather strong for such low molar mass polymers (Fig. 8a). Remarkably, PMA-U5 develops a maximum in G′ at 12 °C, which seems to correspond with the Tg determined by DSC, while the physical networks with a higher crosslink density lack this peak. This was further investigated by measuring a second sample. Here, the polymer was heated to the rubbery region to erase potential thermal history, cooled back down to the glassy state and heated back beyond the failure temperature (Fig. 8b). Interestingly, the maximum in G′ returns in the second heating run, although less pronounced. The cause for this observation is not understood at the moment. When comparing the polymers in the rubbery region, the low amount of crosslinks of PMA-U5 without enforcement of chain entanglements of the low molar mass PMA backbone results in a faint and narrow rubbery plateau. With increasing UPy incorporation, the plateau is becoming more pronounced and is slightly shifting towards higher temperatures, indicating the presence of a stronger network. Additionally, the temperatures at failure follow the same trend, increasing from 56 °C for PMA-U5 to 76 °C and 83 °C for PMA-U10 and PMA-U15, respectively. In Fig. 8a, the maximum in the tan![[thin space (1/6-em)]](https://www.rsc.org/images/entities/char_2009.gif) δ curves also shifts to higher temperatures with increasing crosslink density and can be used as an alternative to determine the Tg of the supramolecular networks. The values from the tan
δ curves also shifts to higher temperatures with increasing crosslink density and can be used as an alternative to determine the Tg of the supramolecular networks. The values from the tan![[thin space (1/6-em)]](https://www.rsc.org/images/entities/char_2009.gif) δ maxima are 10 °C higher compared to the ones derived from DSC, which is a common anomaly related to the thermal lag between the sample and the temperature sensor.52
δ maxima are 10 °C higher compared to the ones derived from DSC, which is a common anomaly related to the thermal lag between the sample and the temperature sensor.52
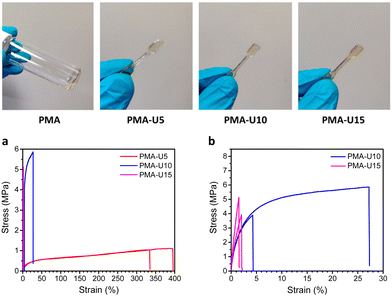
Fig. 9, top, shows the physical appearance of the PMA starting material (viscous liquid) and the PMA–UPy materials that are compression molded into small dog bones for tensile testing. By heating the PMA–UPy samples, the hydrogen bonds become increasingly more dynamic and ultimately completely dissociate, resulting in material flow. After pressing the viscous polymer melt into a mold, the material is allowed to cool down, decreasing the hydrogen bond dynamics again, which restores the physical crosslinks. Based on the DMTA results, all samples were pressed at 80 °C.
To quantify the mechanical strength at room temperature, tensile tests were performed (Fig. 9 bottom). The limited amount of material available only allowed the measurement of two samples per polymer, which gives a sufficient first indication of the mechanical properties. When looking at the stress–strain curves in Fig. 9a, the higher elongation of PMA-U5 stands out compared to the other, more crosslinked samples. The Tg of this polymer lays around room temperature due to its relatively low crosslink density, giving more mobility to the polymer chains during elongation of the sample. In contrast, the more crosslinked PMA-U10 and PMA-U15 have Tg values above room temperature and are measured in the glassy state, which is translated in brittle failure accompanied with a high modulus as depicted in Fig. 9b and Table 3.
| Polymer | Young's modulus (MPa) | Ultimate stress (MPa) | Elongation (%) |
|---|---|---|---|
| a The error is larger than the average value due to the large difference between the two measured samples and limited amount of material. | |||
| PMA-U5 | 20.7 ± 5.5 | 1.08 ± 0.04 | 364 ± 43 |
| PMA-U10 | 322 ± 27 | 4.88 ± 1.39 | 15.7 ± 16.2a |
| PMA-U15 | 404 ± 75 | 4.53 ± 0.85 | 1.78 ± 0.36 |
Finally, the network dynamics were investigated by rheological measurements using compression molded disks with a diameter of 8 mm (Fig. S13, ESI†). With increasing crosslink density, a more stable network is formed as evidenced by the frequency sweeps of the three supramolecular networks at 60 °C (Fig. S13a, ESI†). With only 5% UPy, PMA-U5 still shows a frequency dependence by the absence of a plateau in the storage modulus (G′), while PMA-U10 and PMA-U15 with 10 and 15% UPy, respectively, clearly develop a plateau value in G′ at frequencies between 0.3 and 6 rad s−1. The plateau of PMA-U15 is slightly shifted to a higher G′ value compared to PMA-U10, indicating a stronger network, which is in accordance with higher crosslink density.
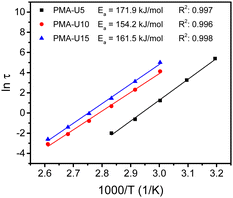
By performing frequency sweeps at different temperatures (Fig. S13b–d, ESI†), the relaxation times (τ) could be approximated by the crossover points between the storage and loss modulus (G′ and G′′, respectively). From the relaxation times, the Arrhenius plot was made for each supramolecular polymer network (Fig. 10). However, this method could not be used for PMA-U5 at high temperature as above 100 °C the crossover frequency is influenced by both the high-frequency Rouse relaxation of the molecular segment Ms and the sticker dynamics. Consequently, it cannot be considered as representative of the sticker dynamics only. Nevertheless, a reliable linear fitting could be made with the data measured from 40 °C to 80 °C. For PMA-U10 and PMA-U15, a similar behavior was observed at high temperatures and the data from 50 °C to 110 °C were used for the linear fit. From these fitting curves, the apparent activation energy (Ea) could be calculated. Interestingly, PMA-U5 seems to have a higher Ea than the more tightly crosslinked PMA-U10 and PMA-U15. However for a better understanding of the rheological behavior, a more in-depth investigation of the data is needed as will be discussed further on based on modeling of the data (Section 2.2).
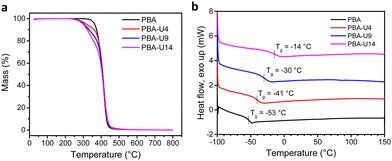
The PBA–UPy networks were analyzed by the same methods as described above for the PMA–UPy materials. First, TGA was performed to investigate the thermal stability of the networks (Fig. 11a). Compared to the PMA–UPy polymers, the PBA–UPy exhibit a similar thermal stability up until 250 °C, the UPy units are the most thermolabile moieties present on the polymer and, therefore, determine the thermal stability of the networks. Next, the Tg values of the PBA–UPy networks were determined by DSC (Fig. 11b). Like for the previously discussed PMA–UPy networks, the Tg increases with increasing crosslink density. Compared to PMA–UPy, the PBA-based materials show a slightly higher difference between the different functionalization degrees. This is probably due to the lower Tg of PBA leading to a larger effect of UPy dynamic crosslinking on the chain mobility of the polymers.
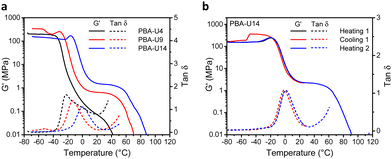
The thermomechanical properties of the PBA–UPy were evaluated by DMTA (Fig. 12). In the glassy region, PBA-U9 reached a storage modulus (G′) of 330 MPa while the more crosslinked PBA-U14 only reached 130 MPa (Fig. 12a). The G′ value of PBA-U4 is not reliable as the sample could not be pressed into a defined shape due to its more liquid-like behavior, which prevented the instrument to accurately calculate the moduli. Nevertheless, the shape of the curve is still valid for the evaluation of the thermomechanical behavior. When the samples of PBA-U9 and PBA-U14 were heated past their Tg, the storage modulus develops an unexpected and not yet understood maximum, similar to the one observed for PMA-U5. This was further investigated by measuring a second sample of PBA-U14 by heating the polymer to the rubbery plateau, cooling down and heating up until material failure (Fig. 12b). Apart from the artefact appearing in the glassy region of the cooling run, all curves nicely overlap and the maximum in G′ is reproduced in both heating runs, suggesting that it is a material property rather than thermal history. When comparing the polymers in the rubbery region, the low amount of crosslinks of PBA-U4, without enforcement of chain entanglements of the low molar mass PBA backbone, results in a faint and narrow rubbery plateau. With increasing UPy incorporation, the plateau is becoming more pronounced and is slightly shifting towards higher temperatures, indicating the presence of a stronger network. Additionally, the temperatures at failure follow the same trend, increasing from 32 °C for PBA-U4 to 52 °C and 62 °C for PBA-U9 and PBA-U14, respectively. In Fig. 12a, the maximum in the tan![[thin space (1/6-em)]](https://www.rsc.org/images/entities/char_2009.gif) δ curves also shifts to higher temperatures with increasing crosslink density and can be used as an alternative method to determine the Tg or the supramolecular networks. Again, the values from the tan
δ curves also shifts to higher temperatures with increasing crosslink density and can be used as an alternative method to determine the Tg or the supramolecular networks. Again, the values from the tan![[thin space (1/6-em)]](https://www.rsc.org/images/entities/char_2009.gif) δ maxima are 10 °C higher compared to the ones derived from DSC due to the thermal lag between the sample and the temperature sensor.52 Comparison of the DMTA of the PMA–UPy and PBA–UPy networks reveals very similar behavior, whereby the change from PMA to PBA mostly leads to a shift of the curves to lower temperatures without changing the shape of the curves.
δ maxima are 10 °C higher compared to the ones derived from DSC due to the thermal lag between the sample and the temperature sensor.52 Comparison of the DMTA of the PMA–UPy and PBA–UPy networks reveals very similar behavior, whereby the change from PMA to PBA mostly leads to a shift of the curves to lower temperatures without changing the shape of the curves.
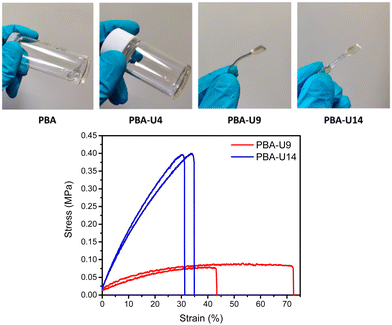
In Fig. 13, top, the physical appearance of the PBA precursor (viscous liquid) and the PBA–UPy networks is shown. For PBA-U4, the hydrogen bond crosslinks led to a more solid like behavior, but there was still some viscous flow on a larger time scale when kept at room temperature. This could be an indication that the crosslink density was too low to obtain a stable network. PBA-U9 and PBA-U14 on the other hand led to rubbery materials at room temperature, indicating the presence of a stable network. These polymers could be compression molded into dog bones for tensile testing under comparable conditions as described for the PMA–UPy materials.
The mechanical strength of the materials was quantified by tensile testing (Fig. 13, bottom). Only two test specimens could be pressed due to the limited amount of material available for mechanical testing. Additionally, PBA-U4 could not be pressed in a measurable shape as it was too liquid-like and started to flow when in rest at room temperature. The stress–strain curves in Fig. 13 bottom, show a clear increase in tensile strength when increasing the crosslink density from 9% in PBA-U9 to 14% in PBA-U14. Consequently, this also leads to a decreased elongation at break of the polymer. As the experiments were performed at room temperature which is above the respective Tg values, both polymers are in their rubbery region and behave like soft elastomers. The tensile test results are summarized in Table 4.
| Polymer | Young's modulus (MPa) | Ultimate stress (MPa) | Elongation (%) |
|---|---|---|---|
| PBA-U8 | 0.346 ± 0.095 | 0.085 ± 0.008 | 57.7 ± 20.8 |
| PBA-U13 | 1.73 ± 0.03 | 0.471 ± 0.100 | 32.9 ± 2.5 |
Finally, the network dynamics were studied by rheological measurements (Fig. S14, ESI†). With increasing crosslink density, a more stable network is formed as evidenced in the frequency sweeps of the three supramolecular networks at 40 °C (Fig. S14a, ESI†). With only 4% UPy, PBA-U4 does not show a clear plateau in the storage modulus (G′) however part of the sample relaxes slower, probably due to the formation of larger supramolecular assemblies. On the other hand, PBA-U9 and PBA-U14 with 9 and 14% UPy, respectively, clearly develop a plateau value in G′ at frequencies between 1 and 100 rad s−1. The plateau of PBA-U14 is slightly shifted to a higher G′ value compared to PBA-U9, indicating a stronger network, which is in accordance with higher crosslink density.
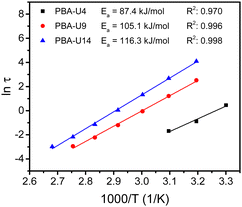
By performing frequency sweeps at different temperatures (Fig. S14b–d, ESI†), the relaxation times (τ) could be determined by the crossover points between the storage and loss modulus (G′ and G′′, respectively). From the relaxation times, the Arrhenius plot was made for each supramolecular polymer network (Fig. 14). As for the PMA–UPy materials, the data at higher temperatures, especially with lower UPy contents were not considered, due to the similarity of the Rouse dynamics of the chains and the dynamics of the stickers. Nevertheless, a reliable linear fitting could be made for all functionalization degrees. From these fitting curves, the apparent activation energy (Ea) could be calculated. As opposed to the PMA–UPy networks, the PBA-based materials show increasing Ea when the UPy content is increased. However, for a better understanding of the rheological behavior, a more in-depth theoretical assessment of the data was performed, which is described below.
2.2 Modeling of linear rheology
In this section, we discuss modeling of the linear viscoelastic behavior of UPy polymers using a bead-spring model developed by Liu et al.42 A detailed description of the models can be found in the ESI,† Section 2.We first investigated the linear viscoelastic responses of the reference samples. As further discussed here below, the data measured at different temperatures were shifted onto a single master curve as shown in Fig. 15.
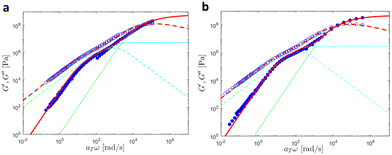 | ||
| Fig. 15 Linear viscoelastic mastercurves of (a) PMA at Tref = 30 °C and (b) PBA at Tref = −30 °C. Red lines correspond to the model predictions obtained with the values shown in Tables 1 and 2. The contributions from the KWW model (in green) and the Rouse model (in cyan) are also presented. | ||
In this Figure, the high frequency parts correspond to the glass-to-rubber transition region, which persists until ω ∼ 4κ0/ζ0, where ζ0 is the monomeric friction coefficient and ζ0/4κ0 represents the characteristic relaxation time of a Rouse segment. Subsequently, the chains relax through the Rouse process. The expected slope of 0.5 that G′and G′′ should follow in the Rouse regime is barely noticeable due to the low molar mass of the samples. Finally, at frequencies equal to ω ∼ 1/τR, where τR is the Rouse relaxation time, the chains relax completely, resulting in G′and G′′ following a slope of 2 and 1 respectively.
A good agreement between experimental and theoretical data was achieved by the bead-spring model, indicating that the supramolecular junctions do not form aggregates as this would lead to deviation from the model. The number of beads N was estimated by dividing the molar mass of the chains by the molar mass of one Kuhn segment MK. In the case of PBA, a Kuhn segment molar mass MK of 700 g mol−1 was used following the work of Liu et al.42 For PMA, a MK of 450 g mol−1 was determined using a persistence length lp = 0.64 nm obtained from atomistic MD simulations in ref. 53. Moreover, a density of ρ = 1000 kg m−3 was assumed for both systems. The values of the fitting parameters are detailed in Table 5.
| ζ 0/κ0 [s] | ζ 1/κ1 [s] | P | G g [GPa] | τ KWW [s] | β [−] | |
|---|---|---|---|---|---|---|
| PB-U6 | 6.5 × 10⁻⁵ | 3.5 | 0.085 | — | — | — |
| PB-U8 | 3.5 × 10⁻⁴ | 4 | 0.11 | — | — | — |
| PB-U13 | 4 × 10⁻³ | 13 | 0.15 | 0.3 | 0.4 × 10⁻⁵ | 0.35 |
| PMA | 2.5 × 10⁻³ | — | — | 0.6 | 0.5 × 10⁻⁵ | 0.39 |
| PMA-U10 | 2.8 × 10⁻³ | 4 | 0.29 | 0.5 | 1 × 10⁻⁶ | 0.33 |
| PMA-U15 | 1 × 10⁻² | 7 | 0.44 | 0.5 | 2 × 10⁻⁶ | 0.31 |
| PBA | 1.65 × 10⁻² | — | — | 0.5 | 1 × 10⁻⁵ | 0.4 |
| PBA-U8 | 3 × 10⁻⁴ | 4.9 | 0.33 | — | — | — |
| PBA-U13 | 15 × 10−4 | 14 | 0.47 | — | — | — |
Then, the linear viscoelastic data of the supramolecular polymers were shifted to build pseudo-mastercurves, as illustrated Fig. 16. To construct these pseudo-mastercurves, an approach inspired by Zhang et al.54 was employed. In this approach, the linear responses acquired for temperatures below the reference temperature Tref are shifted by shift factors aT similar to the shift factors used for the reference sample, focusing particularly on achieving superposition in the high-frequency region, i.e. accounting for the influence of temperature on the segmental dynamics. On the other hand, the linear responses obtained for temperatures above Tref are shifted by  with a specific emphasis on achieving superposition in the low-frequency region. In this way, the shift factors account for both the segmental dynamics and the dynamics of the stickers. For the systems poor in UPy moieties (i.e. PMA-U5 and PBA-U4), pseudo-mastercurves could not be built, possibly due to the proximity between the fast and the slow relaxation.
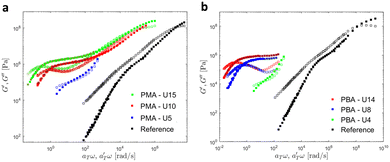 | ||
| Fig. 16 Pseudo-mastercurves, mastercurve or curves of (a) PMA systems at Tref = 70 °C and of (b) PBA systems at Tref = 40 °C. The mastercurves of the references were shifted using the WLF equation (see eqn (1)). | ||
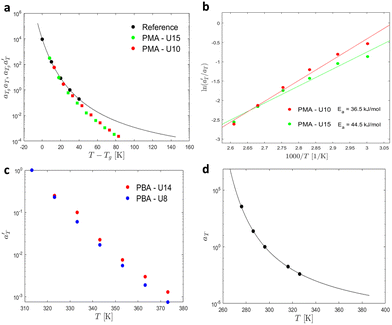
Fig. 17 compares the shift factors aT and  used to build the mastercurves and the pseudo-mastercurves shown in Fig. 15 and 16, respectively. The shifts presented in Fig. 17a are scaled by a free volume correction factor denoted as aTg, akin to ref. 40.
As observed, the shifts aT align closely with the Williams–Landel–Ferry (WLF) equation55 which can be expressed as follows.
 | (1) |
In contrast, the relationship of  with temperature can be expressed as follows:56
 | (2) |
 is plotted against 1000/T. By following this procedure, an Ea ranging from 36.5 to 44.5 kJ mol−1 was obtained for PMA–UPy materials. These values can be compared to the values obtained by Zhang et al.54 who found an activation energy of Ea = 33–37 kJ mol−1 for PBA–UPy polymer with a molar mass of 9.8 kg mol−1. Additionally, Verjans et al.40 reported an Ea ranging from 31.6 to 36 kJ mol−1 for the PB–UPy system with a molar mass of approximately 5 kg mol−1. The small differences in activation energy among the supramolecular polymers based on UPy groups are not sufficient to conclude any significant effect of the backbone on the strength of the physical bonds.
Fig. 18 and 19 show the theoretical fits of the pseudo-mastercurves using the model detailed here above. Linear viscoelastic data of PB–UPy polymers reported by Verjans et al.40 were also fitted, and the corresponding figures can be found in ESI.† The fitting parameters obtained from the analysis are listed in Table 5.
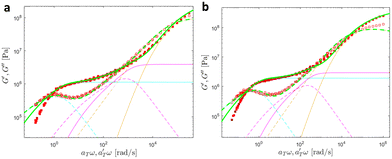 | ||
| Fig. 18 Linear viscoelastic mastercurves of (a) PMA-U10 and (b) PMA-U15 (b) at Tref = 70 °C. Green corresponds to the model predictions obtained with the parameters shown in Tables 1 and 2. The contributions from the KWW model (in orange), the Rouse model (in magenta), and the slow modes (in cyan) are also presented. | ||
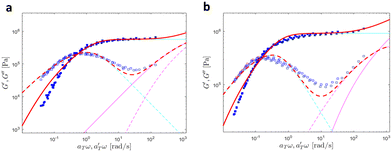 | ||
| Fig. 19 Linear viscoelastic mastercurves of (a) PBA-U8 and (b) PBA-U13 at Tref = 40 °C. Red lines correspond to the model predictions obtained with the values shown in Tables 1 and 2. The contributions of the Rouse model (in magenta) and the slow modes (in cyan) are also presented. | ||
At high and intermediate frequencies, the model effectively captures the flow behavior of the associative polymers. However, in the terminal regime, it fails to accurately fit the experimental data, especially at timescales larger than the sticker lifetime τS ( see Table 5). Notably, G′ exhibits a more rapid decrease than predicted by the model. This discrepancy suggests that the amount of active stickers along the chain is slightly lower than predicted. This may be due to the presence of defects such as internal loops.
In Table 5, it can be observed that the characteristic time for the segmental motion of the chains, represented by ζ0/κ0, tends to decrease as the amount of UPy groups increases. This is because the incorporation of the UPy groups tends to increase the Tg and thus slows down the segmental motion of the chains. To evaluate the evolution of the intrinsic sticker lifetime, a comparison of the ratio  can be made. As observed, this ratio decreases with the addition of UPy moieties, leading to shorter sticker lifetime. One possible explanation for the decrease of
  could be related to the presence of a larger amount of stickers, which would facilitate the exchanges of partners and thus decrease the sticker lifetime.57,58
3. Conclusion
In this work, the functionalization of conventional poly(alkyl acrylate) platforms with the quadruple hydrogen bonding UPy moiety with a branched alkyl side-chain was demonstrated. PMA and PBA were synthesized via Cu(0)-mediated radical polymerization, followed by an end group modification to convert the reactive bromide to a more chemically resistant thioether. Building on the results of previous research of our group, a catalyzed transesterification of the alkyl esters was employed to partially introduce allylOH in a stoichiometrically controlled way, resulting in a tailored conversion of methyl and n-butyl esters into allyl esters. The synthesis of the supramolecular polymer networks was concluded by thiol–ene coupling of the branched UPy-SH units to the previously incorporated allyl esters. On PMA-allyl, a complete conversion of the allyl esters was achieved for all functionalization degrees, while for the PBA alternatives only PBA-U14 was fully functionalized and PBA-A5 and PBA-A9 were left with 1% allyl esters. Nonetheless, sufficient conversion of allyl groups was achieved to characterize the materials. Although challenging, the purification of the materials from excess UPy-SH was achieved through preparative SEC in DMF.The mechanical properties of the supramolecular materials were further analyzed by TGA, DSC, DMTA, tensile testing and rheology. In TGA, a good thermal stability up to 250 °C was observed, followed by an increased thermal degradation with higher UPy content in the polymer, while DSC showed a consistent increase of Tg with elevated physical crosslinking density, indicating that no UPy stacking took place. The DMTA data demonstrated an increase of the failure temperatures with higher crosslinking densities combined with a shift of the rubbery plateau towards higher temperatures and G′. The tensile measurements at room temperature showed an increase in the modulus and a decrease in maximum elongation with increasing UPy crosslinking, which is correlated with the increase of the Tg with crosslinking density. The change from PMA–UPy to PBA–UPy mostly led to shift in thermal transition temperatures while the DMTA curves had similar shapes.
The evaluation of the network dynamics by rheology showed the development of a stable network when the UPy content is increased. Its terminal regime follows an Arrhenius dependence. We then fitted the linear responses of the supramolecular polymers using a modified version of the sticky Rouse model proposed by Liu et al.42 This modified model includes a random placement of the stickers and a phenomenological correction for the spatial fluctuations of the supramolecular junctions in their associated states. Despite some deviations observed in the terminal regime, the model effectively captures the experimental data, suggesting that the supramolecular junctions do not form aggregates. From this analysis, it was found that an increase of the sticker density has a larger influence on the segmental dynamics characteristic time than on the sticker lifetime. This relative decrease of the sticker lifetime was attributed to the facilitation of the exchanges of partners with increasing the sticker density.
Data availability
The data supporting this article have been included as part of the ESI.†Conflicts of interest
There are no conflicts to declare.Acknowledgements
R. H. thanks FWO and Ghent University for financial support of this work. A. A. and E. V. R. acknowledge the French Community of Belgium through ARC project no. 16/21-076. E. V. R. is Senior Research Associate of the FRS-FNRS.References
- J. Undin, A. Finne-Wistrand and A.-C. Albertsson, Biomacromolecules, 2014, 15, 2800–2807 CrossRef CAS PubMed.
- K. Jankova, I. Javakhishvili, S. Kobayashi, R. Koguchi, D. Murakami, T. Sonoda and M. Tanaka, ACS Appl. Bio Mater., 2019, 2, 4154–4161 Search PubMed.
- A. K. Mittal, R. Bhardwaj, R. Arora, A. Singh, M. Mukherjee and S. K. Rajput, ACS Omega, 2020, 5, 24239–24246 CrossRef CAS PubMed.
- N. P. W. Pieczonka, V. Borgel, B. Ziv, N. Leifer, V. Dargel, D. Aurbach, J.-H. Kim, Z. Liu, X. Huang, S. A. Krachkovskiy, G. R. Goward, I. Halalay, B. R. Powell and A. Manthiram, Adv. Energy Mater., 2015, 5, 1501008 Search PubMed.
- Y. Huang, J. Liu, J. Wang, M. Hu, F. Mo, G. Liang and C. Zhi, Angew. Chem., Int. Ed., 2018, 57, 9810–9813 Search PubMed.
- S. Zhang, Y. Huang, Y. NuLi, B. Wang, J. Yang and J. Wang, J. Phys. Chem. C, 2020, 124, 20712–20721 Search PubMed.
- Y. Tian, B. R. Shumway and D. R. Meldrum, Chem. Mater., 2010, 22, 2069–2078 Search PubMed.
- L.-N. Chen, C.-C. Kuo, Y.-C. Chiu and W.-C. Chen, RSC Adv., 2014, 4, 45345–45353 RSC.
- A. J. Wang, S. Maharjan, K.-S. Liao, B. P. McElhenny, K. D. Wright, E. P. Dillon, R. Neupane, Z. Zhu, S. Chen, A. R. Barron, O. K. Varghese, J. Bao and S. A. Curran, ACS Appl. Nano Mater., 2020, 3, 2288–2301 CrossRef CAS.
- H. Ying, Y. Zhang and J. Cheng, Nat. Commun., 2014, 5, 3218 CrossRef PubMed.
- L. Voorhaar, M. M. Diaz, F. Leroux, S. Rogers, A. M. Abakumov, G. Van Tendeloo, G. Van Assche, B. Van Mele and R. Hoogenboom, NPG Asia Mater., 2017, 9, e385 CrossRef CAS.
- S. Nomimura, M. Osaki, J. Park, R. Ikura, Y. Takashima, H. Yamaguchi and A. Harada, Macromolecules, 2019, 52, 2659–2668 CrossRef CAS.
- R. K. Bose, N. Hohlbein, S. J. Garcia, A. M. Schmidt and S. van der Zwaag, Polymer, 2015, 69, 228–232 CrossRef CAS.
- J. Zheng, P. Xiao, W. Liu, J. Zhang, Y. Huang and T. Chen, Macromol. Rapid Commun., 2016, 37, 265–270 CrossRef CAS PubMed.
- A. C. Jackson, F. L. Beyer, S. C. Price, B. C. Rinderspacher and R. H. Lambeth, Macromolecules, 2013, 46, 5416–5422 CrossRef CAS.
- D. Mozhdehi, S. Ayala, O. R. Cromwell and Z. Guan, J. Am. Chem. Soc., 2014, 136, 16128–16131 CrossRef CAS PubMed.
- X. Cui, Y. Song, J.-P. Wang, J.-K. Wang, Q. Zhou, T. Qi and G. L. Li, Polymer, 2019, 174, 143–149 CrossRef CAS.
- E. A. Appel, F. Biedermann, U. Rauwald, S. T. Jones, J. M. Zayed and O. A. Scherman, J. Am. Chem. Soc., 2010, 132, 14251–14260 CrossRef CAS PubMed.
- A. Harada, Y. Takashima and M. Nakahata, Acc. Chem. Res., 2014, 47, 2128–2140 CrossRef CAS PubMed.
- T. Kawakami and T. Kato, Macromolecules, 1998, 31, 4475–4479 CrossRef CAS.
- J. Courtois, I. Baroudi, N. Nouvel, E. Degrandi, S. Pensec, G. Ducouret, C. Chanéac, L. Bouteiller and C. Creton, Adv. Funct. Mater., 2010, 20, 1803–1811 CrossRef CAS.
- Y. J. Wang, X. N. Zhang, Y. Song, Y. Zhao, L. Chen, F. Su, L. Li, Z. L. Wu and Q. Zheng, Chem. Mater., 2019, 31, 1430–1440 CrossRef CAS.
- R. P. Sijbesma, F. H. Beijer, L. Brunsveld, B. J. B. Folmer, J. H. K. K. Hirschberg, R. F. M. Lange, J. K. L. Lowe and E. W. Meijer, Science, 1997, 278, 1601–1604 Search PubMed.
- A. T. Ten Cate, P. Y. W. Dankers, H. Kooijman, A. L. Spek, R. P. Sijbesma and E. W. Meijer, J. Am. Chem. Soc., 2003, 125, 6860–6861 CrossRef CAS PubMed.
- G. B. W. L. Ligthart, H. Ohkawa, R. P. Sijbesma and E. W. Meijer, J. Am. Chem. Soc., 2005, 127, 810–811 CrossRef CAS PubMed.
- D. W. R. Balkenende, C. A. Monnier, G. L. Fiore and C. Weder, Nat. Commun., 2016, 7, 10995 CrossRef PubMed.
- K. Yamauchi, J. R. Lizotte and T. E. Long, Macromolecules, 2003, 36, 1083–1088 CrossRef CAS.
- H. M. Keizer, R. P. Sijbesma, J. F. G. A. Jansen, G. Pasternack and E. W. Meijer, Macromolecules, 2003, 36, 5602–5606 Search PubMed.
- D. J. M. van Beek, M. A. J. Gillissen, B. A. C. van As, A. R. A. Palmans and R. P. Sijbesma, Macromolecules, 2007, 40, 6340–6348 CrossRef CAS.
- K. E. Feldman, M. J. Kade, E. W. Meijer, C. J. Hawker and E. J. Kramer, Macromolecules, 2009, 42, 9072–9081 Search PubMed.
- C. Heinzmann, U. Salz, N. Moszner, G. L. Fiore and C. Weder, ACS Appl. Mater. Interfaces, 2015, 7, 13395–13404 Search PubMed.
- S. Chen, X. Bi, L. Sun, J. Gao, P. Huang, X. Fan, Z. You and Y. Wang, ACS Appl. Mater. Interfaces, 2016, 8, 20591–20599 CrossRef CAS PubMed.
- L. F. Scherz, S. Costanzo, Q. Huang, A. D. Schlüter and D. Vlassopoulos, Macromolecules, 2017, 50, 5176–5187 CrossRef CAS.
- D. K. Hohl, A.-C. Ferahian, L. Montero de Espinosa and C. Weder, ACS Macro Lett., 2019, 8, 1484–1490 CrossRef CAS PubMed.
- A. Zych, A. Verdelli, M. Soliman, R. Pinalli, J. Vachon and E. Dalcanale, Polym. Chem., 2019, 10, 1741–1750 Search PubMed.
- E. A. Mol, Z. Lei, M. T. Roefs, M. H. Bakker, M. Goumans, P. A. Doevendans, P. Y. W. Dankers, P. Vader and J. P. G. Sluijter, Adv. Healthcare Mater., 2019, 8, 1900847 CrossRef CAS PubMed.
- B. J. B. Folmer, R. P. Sijbesma, R. M. Versteegen, J. A. J. van der Rijt and E. W. Meijer, Adv. Mater., 2000, 12, 874–878 CrossRef CAS.
- N. E. Botterhuis, D. J. M. van Beek, G. M. L. van Gemert, A. W. Bosman and R. P. Sijbesma, J. Polym. Sci., Part A: Polym. Chem., 2008, 46, 3877–3885 CrossRef CAS.
- W. P. J. Appel, G. Portale, E. Wisse, P. Y. W. Dankers and E. W. Meijer, Macromolecules, 2011, 44, 6776–6784 CrossRef CAS.
- J. Verjans, A. André, E. Van Ruymbeke and R. Hoogenboom, Macromolecules, 2022, 55, 928–941 CrossRef CAS.
- J. F. R. Van Guyse, Y. Bernhard and R. Hoogenboom, Macromol. Rapid Commun., 2020, 41, 2000365 CrossRef CAS PubMed.
- H. Liu, G. Ianniruberto and G. Marrucci, J. Rheol., 2022, 66, 1183–1190 CrossRef CAS.
- V. Percec, A. V. Popov, E. Ramirez-Castillo, M. Monteiro, B. Barboiu, O. Weichold, A. D. Asandei and C. M. Mitchell, J. Am. Chem. Soc., 2002, 124, 4940–4941 Search PubMed.
- V. Percec, T. Guliashvili, J. S. Ladislaw, A. Wistrand, A. Stjerndahl, M. J. Sienkowska, M. J. Monteiro and S. Sahoo, J. Am. Chem. Soc., 2006, 128, 14156–14165 CrossRef CAS PubMed.
- S. Aksakal, V. P. Beyer, R. Aksakal and C. R. Becer, Polym. Chem., 2019, 10, 6622–6629 RSC.
- A. Anastasaki, J. Willenbacher, C. Fleischmann, W. R. Gutekunst and C. J. Hawker, Polym. Chem., 2017, 8, 689–697 RSC.
- C. Boyer, A. Atme, C. Waldron, A. Anastasaki, P. Wilson, P. B. Zetterlund, D. Haddleton and M. R. Whittaker, Polym. Chem., 2013, 4, 106–112 Search PubMed.
- A. Anastasaki, V. Nikolaou, N. W. McCaul, A. Simula, J. Godfrey, C. Waldron, P. Wilson, K. Kempe and D. M. Haddleton, Macromolecules, 2015, 48, 1404–1411 CrossRef CAS.
- A. Anastasaki, V. Nikolaou, F. Brandford-Adams, G. Nurumbetov, Q. Zhang, G. J. Clarkson, D. J. Fox, P. Wilson, K. Kempe and D. M. Haddleton, Chem. Commun., 2015, 51, 5626–5629 RSC.
- D. G. Mackanic, W. Michaels, M. Lee, D. Feng, J. Lopez, J. Qin, Y. Cui and Z. Bao, Adv. Energy Mater., 2018, 8, 1800703 CrossRef.
- B. Wang, Y. Wu, S. Zhuo, S. Zhu, Y. Chen, C. Jiang and C. Wang, J. Mater. Chem. A, 2020, 8, 5968–5974 RSC.
- W. Sun, A. P. Vassilopoulos and T. Keller, Int. J. Adhes. Adhes., 2014, 52, 31–39 CrossRef CAS.
- M. S. Sulatha and U. Natarajan, Ind. Eng. Chem. Res., 2012, 51, 10833–10839 CrossRef CAS.
- Z. Zhang, C. Liu, X. Cao, L. Gao and Q. Chen, Macromolecules, 2016, 49, 9192–9202 CrossRef CAS.
- M. L. Williams, R. F. Landel and J. D. Ferry, J. Am. Chem. Soc., 1955, 77, 3701–3707 CrossRef CAS.
- Z. Zhang, Q. Chen and R. H. Colby, Soft Matter, 2018, 14, 2961–2977 RSC.
- A. N. Semenov and M. Rubinstein, Macromolecules, 2002, 35, 4821–4837 CrossRef CAS.
- M. Golkaram and K. Loos, Macromolecules, 2019, 52, 9427–9444 CrossRef CAS PubMed.
Footnote |
| † Electronic supplementary information (ESI) available. See DOI: https://doi.org/10.1039/d4tb01702a |
| This journal is © The Royal Society of Chemistry 2024 |


