 Open Access Article
Film thickness dependence of nanoscale arrangement of a chiral electron donor in its blends with an achiral electron acceptor†
Giulia
Pancotti‡
 a,
C. Elizabeth
Killalea‡§
 b,
Thomas W.
Rees‡¶
 b,
Letizia
Liirò-Peluso‡
 b,
Sergi
Riera-Galindo
 a,
Peter H.
Beton
 c,
Mariano
Campoy-Quiles
 a,
Giuliano
Siligardi
 d and
David B.
Amabilino
 *a
*a
aInstitut de Ciència de Materials de Barcelona (ICMAB-CSIC), Carrer dels Til·lers, Bellaterra, 08193, Spain. E-mail: amabilino@icmab.es
bSchool of Chemistry and GSK Carbon Neutral Laboratories for Sustainable Chemistry, University of Nottingham, Triumph Road, Nottingham, NG7 2TU, UK
cSchool of Physics and Astronomy, The University of Nottingham, University Park, Nottingham, NG7 2RD, UK
dDiamond Light Source, Harwell Science and Innovation Campus, Didcot, Oxfordshire OX11 0DE, UK
First published on 9th December 2024
Abstract
The nanoscale chiral arrangement in a bicomponent organic material system comprising donor and acceptor small molecules is shown to depend on the thickness of a film that is responsive to chiral light in an optoelectronic device. In this bulk heterojunction, a previously unreported chiral bis(diketopyrrolopyrrole) derivative was combined with an achiral non-fullerene acceptor. The optical activity of the chiral compound is dramatically different in the pure material and the composite, showing how the electron acceptor influences the donor's arrangement compared with the pure molecule. Mueller matrix polarimetric imaging shows the authenticity of this effect and the homogeneity of short range chiral orientations between the molecules, as well as more heterogeneous short and longer range arrangements in the films observed in linear dichroic and birefringent effects. The two-dimensional circular dichroism (CD) maps and spectra show the uniformity of the short range supramolecular interactions both in spun-cast films on quartz and blade-coated films on photovoltaic device substrates, where evidence for the chiral arrangement is uniquely provided by the synchrotron CD measurements. The external quantum efficiency of the devices depends upon the handedness of the light used to excite them and the film thickness, that influences the supramolecular arrangement and organization in the film, and determines the selectivity for left or right circularly polarised light. The difference in external quantum efficiency of the photovoltaic devices between the two handedness’ of light correlates with the apparent differential absorbance (g-factor) of the films.
Introduction
There is an increasing interest in chiral π-functional organic materials because of the unique properties they provide, including the detection of circularly polarized light1–4 and circularly polarized luminescence.5–7 Their supramolecular organization in mixtures with complementary compounds that form materials with particular properties is important in many areas of science and technology, perhaps most significantly in the preparation of photovoltaic devices.8,9 Thin films made of this kind of material show physical properties intimately dependent on their supramolecular architecture, from first order relative arrangement in dimers or stacks, across a hierarchy of organization,10–13 to the mesoscale, and also upon phase separation.14–19 There is very little known, however, about how parallel (also referred to as orthogonally) assembled systems affect one another's organization in thin films.Studying the nature of this type of organization in chiral systems20–26 using electronic circular dichroism (CD) spectroscopy reveals the optically active supramolecular arrangements,27–30 and the use of Mueller matrix polarimetry (MMP) at B23 beamline of Diamond light source reveals the homogeneity and nature of the optical activity at high resolution through scanning and mapping thin films of chiral materials.31 The MMP tower is incorporated into the spectrometer and measures the sample in transmission mode with the beam vertically incident on the horizontal sample. For non- or modestly de-polarising thin films of chiral materials, the MMP is the only spectroscopic instrument capable of separating from each other the linear dichroism (LD), linear birefringence (LD), circular dichroism (CD) and circular birefringence (CB). The B23 MMP can also be used in CD-mode, like a conventional CD spectropolarimeter, to highlight the linear anisotropies (LD and LB) effects on the CD spectral shape, intensity magnitude, and sign. Therefore, the MMP measurements can show the distinct optical activities that arise from different length scales of organization: dichroism at the scale of a few molecules and birefringence from longer range organization. The decomposed CD from the MMP analysis reflects the chiral structure that is of paramount importance as it dictates the material properties.32–35
Among the many families of donors used as part of the active layer of bulk heterojunction photovoltaic devices (BHJ PVs), derivatives of 1,4-diketopyrrolo[3,4-c]pyrrole (DPP) are particularly versatile thanks to their tuneability through chemical substitution.36,37 DPP derivatives show interesting solid state properties thanks to the organisation of their principally planar molecular structure, which allows intermolecular π–π interactions forming specific supramolecular arrangements,38–41 that can be made chiral.42–48
In this work, an extended bis-DPP 1 was synthesised (Fig. 1), where stereogenic centres were introduced at the ends of the long axis of the molecule and the extended π-system guaranteed a highly conjugated system, to emulate those seen in polymers of this general type.49
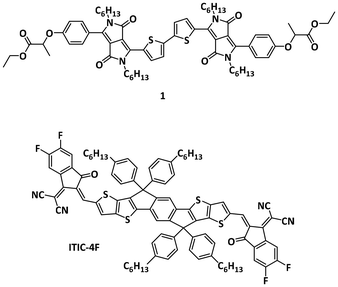 | ||
| Fig. 1 Chemical structures of the donor (1) and acceptor (ITIC-4F) compounds used to make the mixtures in this paper. | ||
The work presented here focuses on mixtures (Fig. 1) of the new bis-DPP molecule 1 and the electron acceptor 3,9-bis(2-methylene-((3-(1,1-dicyanomethylene)-6,7-difluoro)-indanone))-5,5,11,11-tetra-kis-(4-hexylphenyl)-dithieno[2,3-d:2′,3′-d′]-s-indaceno-[1,2-b:5,6-b′]dithiophene (ITIC-4F), widely used in high performance BHJ PVs.50–52
Study of the chiroptical response of organic films can be achieved using CD spectroscopy.53–56 The use of CD of thin films of chiral DPP derivatives has been used to study their supramolecular structure, and the advantages that CD has over absorption spectroscopy has been demonstrated.57,58 Notwithstanding, for optical imaging, conventional spectropolarimeters are limited in their spatial resolution, typically being a few millimetres. Furthermore, solid state samples can have a non-trivial CD response compared to isotropic solutions, mainly because of local anisotropies that lead to various other contributions to the spectrum (LD, LB and CB). For non-depolarising and moderate depolarizing materials the Mueller matrix analysis allows disentanglement of the CD response of thin films (and solid-state samples in general).59,60 The highly collimated microbeam, generated at Diamond light source (beamline B23), can be used to assess the homogeneity of supramolecular structures in the preparation of thin films mapping the area of interest with a spatial resolution of at least 50 μm2. The facility is coupled with a Mueller matrix polarimeter (MMP) which allows fine study of film's optical activity (see ESI† for set-up).61
It will be shown that this chiroptical tool reveals important information about the organisation of the mixture of homochiral 1 and ITIC-4F, and that the acceptor material significantly alters the chiral organisation of the donor. First, the preparation of the new material and its characteristics will be described, and then the intriguing optical activity of the blends will be discussed.
Results and discussion
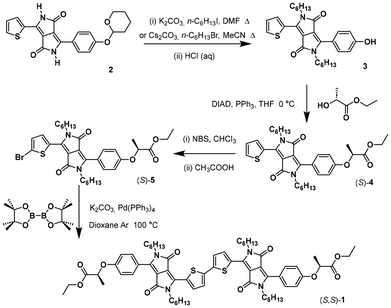
Synthesis and characterization
The new chiral electron donor based on a bis-DPP was prepared by the route shown in Scheme 1 for one of the enantiomers (see ESI† for details). The synthesis starts with the preparation of compound 2, as before,57 that was alkylated at the lactam and deprotected with acid to generate phenol 3. Introduction of the stereogenic centre, coming from ethyl lactate (which proceeds with a high stereoselectivity62–65), was achieved using a Mitsunobu protocol, and bromination of the thiophene in 4 with N-bromosuccinimide in the presence of acetic acid to give bromothiophene 5. That compound was coupled using palladium(0) with bis(pinacolato)diboron to give the desired compound 1.In solution, compounds 4 and 1 show the dual band absorption characteristics (ESI Fig. S1 and Table S1†) that are typical of DPP derivatives.66–68 The absorption properties of monomer (S)-4 (λmax = 499, 518 nm, both with ε = 24![[thin space (1/6-em)]](https://www.rsc.org/images/entities/char_2009.gif) 600 M−1 cm−1) lie between those of similar symmetric derivatives, the N-hexyl thiophene27 (λmax = 548 nm and ε = 31
600 M−1 cm−1) lie between those of similar symmetric derivatives, the N-hexyl thiophene27 (λmax = 548 nm and ε = 31![[thin space (1/6-em)]](https://www.rsc.org/images/entities/char_2009.gif) 055 M−1 cm−1) and N-hexyl phenol29 DPPs (λmax = 481 nm and ε = 22
055 M−1 cm−1) and N-hexyl phenol29 DPPs (λmax = 481 nm and ε = 22![[thin space (1/6-em)]](https://www.rsc.org/images/entities/char_2009.gif) 000 M−1cm−1), illustrating how optical properties are changed by chemical structure in these compounds.
000 M−1cm−1), illustrating how optical properties are changed by chemical structure in these compounds.
Compound 1, that can be considered the covalent dimer of 4, has a large bathochromic shift (104 nm) of the low energy absorption band and a loss of vibronic structure compared with the monomer as a consequence of the extended conjugation in the structures. Both the low and high energy bands are broadened greatly in 1 compared with 4, a type of broadening is typically observed in polymeric DPP systems.69
In solution, 4 has an emission profile with a vibronic structure and a Stokes shift of 35 nm (ESI Fig. S2†). Compound 1, contrastingly, has emission profiles that, like their absorption profiles, exhibit no vibronic structure (ESI Fig. S2†) and extremely large Stokes shift of 100 nm. This effect suggests that much of the absorbed energy is lost to vibrational relaxation – a result of the increased conjugation and increased degrees of freedom compared with the smaller molecule. This hypothesis is supported by the low photoluminescence quantum yields of 1 compared to those of 4 (Table S2†). The absorption spectra of thin films of compounds 4 and 1 show similar trends (ESI Fig. S3 and Table S3†).
The cyclic voltammetry data of (S,S)-1 shows irreversible processes, with a single reduction peak at approximately −1.6 V with respect to Fc/Fc+ and multiple complicated oxidation processes starting from 0.84 V against the same reference (see ESI, Fig. S4 and S5†). This irreversible and sweep-rate dependent behaviour is interpreted as a result of non-reversible adsorption to the electrodes during cycling (Fig. S6†). Nonetheless, the onset values are useful for estimating the energy levels for the compounds. The values calculated from these onsets for 1 (in chloroform) are for HOMO and LUMO −5.28 and −3.61 eV, respectively (Table S4†). These values indicate a gap of 1.67 eV, and the calculated optical gap is 1.59 eV.
Solution state circular dichroism spectroscopy
Compound (S,S)-1 dissolves readily in organic solvents of medium polarity, such as chloroform, dichloromethane and THF. In these media the optical activity is practically null in the visible region. The lack of appreciable CD signal in this area is a result of the large distance between the stereogenic centres in the molecule and the chromophores that are responsible for the absorption. Aggregation of the molecules was observed in mixtures of chloroform and heptane, with the 1![[thin space (1/6-em)]](https://www.rsc.org/images/entities/char_2009.gif) :
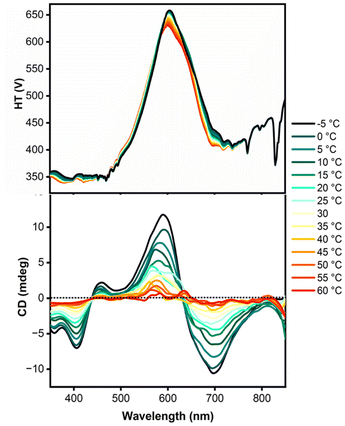
:![[thin space (1/6-em)]](https://www.rsc.org/images/entities/char_2009.gif) 5 ratio being particularly convenient for the study of the self-assembly at different temperatures. The CD spectra (Fig. 2) were acquired between −5 and 60 °C, revealing very modest CD signals at the higher temperature, but clear evidence for aggregation of the molecules as the mixture was cooled. An exciton couplet is clearly observed with maxima at approximately 580 and 690 nm, corresponding to the absorption maximum of the compound. The thermally reversible signals (Fig. S6 and S7 in ESI†) show the kind of change in CD intensity characteristic of a system forming helical aggregates in solution.70–73 The degree of aggregation is very sensitive to concentration; at 8 μM in chloroform
5 ratio being particularly convenient for the study of the self-assembly at different temperatures. The CD spectra (Fig. 2) were acquired between −5 and 60 °C, revealing very modest CD signals at the higher temperature, but clear evidence for aggregation of the molecules as the mixture was cooled. An exciton couplet is clearly observed with maxima at approximately 580 and 690 nm, corresponding to the absorption maximum of the compound. The thermally reversible signals (Fig. S6 and S7 in ESI†) show the kind of change in CD intensity characteristic of a system forming helical aggregates in solution.70–73 The degree of aggregation is very sensitive to concentration; at 8 μM in chloroform![[thin space (1/6-em)]](https://www.rsc.org/images/entities/char_2009.gif) :
:![[thin space (1/6-em)]](https://www.rsc.org/images/entities/char_2009.gif) heptane (1
heptane (1![[thin space (1/6-em)]](https://www.rsc.org/images/entities/char_2009.gif) :
:![[thin space (1/6-em)]](https://www.rsc.org/images/entities/char_2009.gif) 5) the aggregation is quite modest (ESI Fig. S8†).
5) the aggregation is quite modest (ESI Fig. S8†).
Thin film preparation and morphology
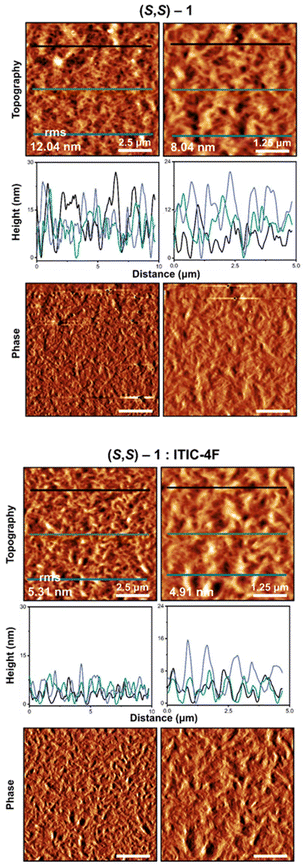
Thin films of donors (S,S)-1 in neat form and in combination with ITIC-4F were made from chlorobenzene solutions, at a total concentration of 20 mg ml−1. The solutions were initially spun cast onto amorphous quartz (fused quartz, to ensure optical transparency for spectroscopy) at room temperature (approximately 20 °C) to give films of the appropriate thickness, approximately 90 nm (extracted from variable angle spectroscopic ellipsometry (VASE, see ESI† for details)), for measuring the optical properties.The morphology of the surface of the films was characterized by atomic force microscopy (AFM) performed in intermittent contact (AC) mode, using parameters developed in other systems.74 The films were imaged at multiple positions over the surface (with scales between 1–10 μm) to ensure reproducibility and homogeneity (ESI Fig. S9 and S10†).
Smooth, randomly distributed intermeshed fibres can be perceived in the images of the films (Fig. 3). The root mean square (RMS) roughness over all images in the scale of 10 × 10 μm is between 7 and 12 nm.
The profiles extracted from the topography images reveal heights and depressions slightly less than 30 nm. The surface looks quite rough with no particular preferred orientation. The phase images are smooth, which is expected for a single component film (supposing domains do not have dramatically different organization).
The films incorporating (S,S)-1 and ITIC-4F have clearer acicular objects, especially in the phase response, more evidently so when compared with the pure electron donor (Fig. 3). The mixed sample shows a smoother film than the films of pure 1 prepared under identical conditions, with an RMS of approximately 6.7 nm on average, half that of the single component film of (S,S)-1, albeit with the presence of some larger acicular particles in the film.
It is believed that the specific growth conditions in the mixture of donor and acceptor promote the formation of acicular objects, as shall be shown one component affects the growth of the other, and the generally much finer structure results in a flatter surface. The mixed film has a distribution of heights (from the profiles extracted from the topography images) of 13 nm with variations of ±5 nm. The surface looks homogeneous with a contrast in the topography image that reflects the interchange of heights and depressions in the nanometric range, with a morphological behaviour reminiscent of a fibre-like distribution. On the other hand, the phase image shows a slightly pronounced but visible contrast in colour, probably because of the presence of the two components. The AFM of the blade-coated samples (ESI Fig. S11†) are quite distinct, and will be discussed later (see below).
Circular dichroism spectroscopy of films
The optical activity of the films was studied by electronic CD spectroscopy on quartz discs using a conventional spectrometer in the first instance, allowing measurement of the average optical properties over a wide range of wavelengths in an area of approximately 0.5 cm2. Multiple spectra were recorded on each sample upon rotations of 45° steps around the direction of the incident light and by flipping the films of 180° around the vertical axis to minimise the contributions from the linear components (LB and LD) to the CD signal.The strongest CD signal is located near the absorption maxima of (S,S)-1 at around 600 nm (the band shows a red shift and broadening compared to solution spectra). Weaker CD signals with the opposite sign are observed either side of this principal band, at 500 and 750 nm. The strong signal arising from the supramolecular organisation of (S,S)-1 in the films resembles that observed in solution of chloroform![[thin space (1/6-em)]](https://www.rsc.org/images/entities/char_2009.gif) :
:![[thin space (1/6-em)]](https://www.rsc.org/images/entities/char_2009.gif) heptane (1
heptane (1![[thin space (1/6-em)]](https://www.rsc.org/images/entities/char_2009.gif) :
:![[thin space (1/6-em)]](https://www.rsc.org/images/entities/char_2009.gif) 5) although the signals are apparently opposite (allowing for the shift to higher wavelength of the solid state absorption signals). This kind of inversion of optical activity upon aggregation is usually assigned to the wrapping of helical objects and is indicative of their hierarchical assembly.75
5) although the signals are apparently opposite (allowing for the shift to higher wavelength of the solid state absorption signals). This kind of inversion of optical activity upon aggregation is usually assigned to the wrapping of helical objects and is indicative of their hierarchical assembly.75
The composite films incorporating (S,S)-1 and ITIC-4F display very different CD spectra. There are clearly chiral aggregates present in the film, as the intensity of the Cotton effects are far larger than to be expected from purely molecular chirality. However, the magnitude is less than that of the pure enantiomers of the donor, as judged by the apparent g-factors of each signal (see Table S5 in ESI†), and also the position of the CD signals is red-shifted compared with the films of pure (S,S)-1. The lower g-factor is partially a result of the overlapping absorption of ITIC-4F in the region of the chiroptical activity arising from (S,S)-1 (Fig. 4). Indeed, the strongest CD signal from the films of (S,S)-1 and ITIC-4F arises at approximately 715 nm, where the CD of pure 1 is comparatively small.
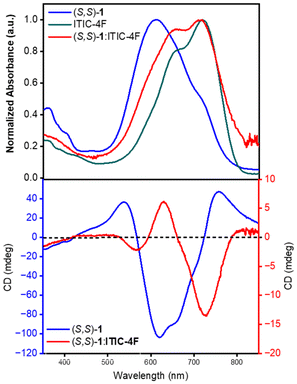 | ||
| Fig. 4 Absorption (top) and CD (bottom) spectra of thin films of donor (S,S)-1 alone and in combination with acceptor ITIC-4F. | ||
The IR spectra of the pure components and mixture of (S,S)-1 and ITIC-4F display peaks that coincide in all the vibrational types from the varied functional groups (see ESI Fig. S12 and S13†). Mapping of the sample shows areas that are richer in one component or the other. The coincidence of the position of vibration of the functional groups in pure material and composite is high, although minor differences may be disguised by the noise.
These CD results indicate that the organisation of (S,S)-1 in the composite films is very different to the assembly of the pure compound, and therefore that the electron acceptor ITIC-4F is affecting the supramolecular chirality of the donor molecules in the film. The domain size of the donor is far smaller in the composite films, and the domains have a large area of interface with the acceptor, that apparently cause a contrasting organisation in the donor compared with the neat material. That change in arrangement is imperceptible using absorption spectroscopy alone. While polymorphism of the electron acceptor used here is known,51,76,77 the authors are not aware of any case where polymorphism of a donor is induced upon incorporation of the acceptor into blend films.
Mueller matrix polarimetric imaging
Mueller Matrix Polarimetry imaging (MMPi) of the films (S,S)-1 and its mixture with ITIC-4F were performed on the B23 beamline at the Diamond synchrotron facility (ESI Fig. S14†). As in our previous work on single component films,57 CD spectral maps were recorded at low resolution, followed by higher resolution optical activity imaging maps, where the contributions from all the components of the Mueller Matrix are recorded. The spectral maps were also recorded to ensure that the CD response (in particular) was arising from the chiral materials present in the films.The imaging of the blend mixtures proved particularly challenging because of the lower g value of the films caused by high absorption and the relatively low optical activity compared with other systems that have been imaged with CD on the beamline B23.78–81 The presence of the achiral electron acceptor that effectively gives a higher absorbance than the pure bis-DPP without increasing the CD signal, in principle at least, makes the measurements harder than for pure material. For this reason, experiments were carried out to optimise the measurements. Maps were recorded (see ESI Fig. S15†) where the integration times were varied from 10 to 100 milliseconds (using 16 integration cycles). The longer integration time gives a uniform signal and much more reliable CD response, and therefore this parameter was used for the optimised measurements.
The MMP maps of spin coated film of (S,S)-1 (Fig. 5) shows negative CD signal at 600 nm with a uniform distribution across large areas, with relatively little variance (and the g factor map corresponds well with the CD map). In the region shown there are significant linear dichroic effects and relatively weaker birefringent effects (presumably caused by local orientation in the film and the deposition method), according to the 16 element Mueller matrix the samples seem to show a complex behaviour82 (biisotropic or bianisotropic) for this reason the MMP were obtained through the analytic inversion method. It is still safe to say that the chiral arrangement of (S,S)-1 throughout the films is uniform (see ESI Fig. S16–S18† for additional data including the full 16 element matrix), even if longer range organisation does vary.
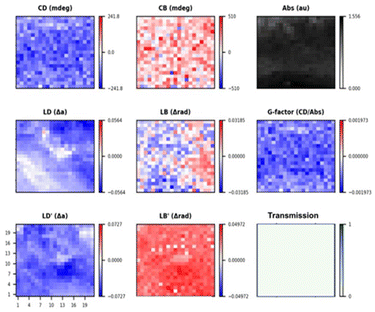 | ||
| Fig. 5 MMP maps calculated from MM using the analytic inversion method of a spin coated film of (S,S)-1 at 600 nm of a 0.5 × 0.5 mm area (21 × 21 steps) with a lateral resolution of 25 μm. | ||
The MMP map of the mixed spin-coated film incorporating (S,S)-1 and ITIC-4F gave noisier data because of the low g factors mentioned previously, as well as the shift in the Cotton effects that are near the 650 nm upper limit of B23 double grating monochromator. The negative signal at 530 nm shows a uniform distribution in a wide area with a very uniform apparent g-factor (Fig. 6), while the slightly positive CD signal at 630 nm is more noisy because of the weaker signal. These results are consistent with the CD signal expected from Fig. 4. Like the pure (S,S)-1, linear components are present but it is still possible to disentangle the CD (see ESI Fig. S17 and S18† for spectra of a map). These results clearly indicate that the orientation of the chiral components is uniform at the limit of resolution across the film, indicative of the homogeneous local arrangement of the molecules, even if the longer range order (seen in linear anisotropic effects) is more heterogeneous. Upon examining the sample prepared on an indium tin oxide (ITO)-coated glass slide using the blade coating technique, (S,S)-1 exhibits a strong negative signal at 600 nm, approximately −100 mdeg (Fig. 7 and ESI Fig. S19†), as expected for aggregates of the molecule.
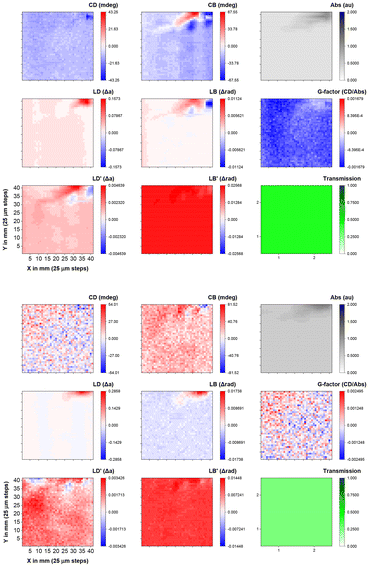 | ||
Fig. 6 Optical activity MMP maps at 630 nm (top) and 530 nm (bottom) of a 1 × 1 mm area (41 × 41 steps) with a lateral resolution of 25 μm of a spin coated film of (S,S)-1![[thin space (1/6-em)]](https://www.rsc.org/images/entities/char_2009.gif) : :![[thin space (1/6-em)]](https://www.rsc.org/images/entities/char_2009.gif) ITIC-4F. ITIC-4F. | ||
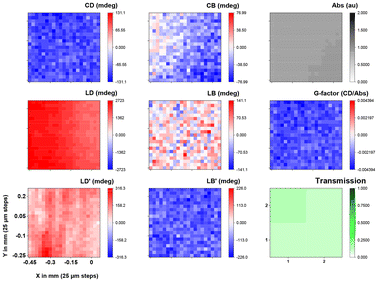 | ||
| Fig. 7 Optical activity MMP maps at 600 nm of a 1 × 1 mm area (21 × 21 steps) with a lateral resolution of 25 μm of a blade coated film of (S,S)-1 on ITO-functionalized glass slide. | ||
The films of (S,S)-1 blended with ITIC-4F show a weaker, positive signal at the same wavelength (Fig. 8 and Fig. S20 and S21†). These samples display significant linear dichroism (LD) and linear birefringence (LB) signals, which is attributed to the blade coating process, potentially causing preferential orientation, and the layered structure (glass/ITO/ZnO nanoparticles layer/active layer) of the solar cell. A test on the ZnO-coated layer (see ESI Fig. S22†) also revealed LD and LB signals but no CD signal, confirming that these significant contributions arise from the blade coating method and not from the samples themselves (Fig. S22† shows that the LD and LD′ of the corresponding M10 and M01, and M20 and M02 are not symmetric as expected for an anisotropic sample. This effect is ascribed to alignment from blade coating. It is interesting to see that the linear birefringent elements M32 and M23, and M31 and M13 are also antisymmetric). Both samples were analysed at spots with similar thickness (see ESI Fig. S17 and S18† for the full 16 element matrix, and Fig. S21† for the full spectroscopic map).
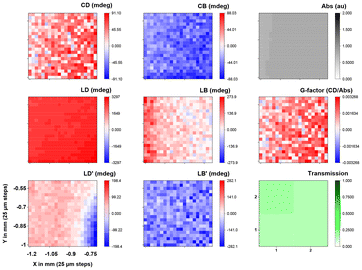 | ||
Fig. 8 Optical activity MMP maps at 600 nm of a 0.5 × 0.5 mm area (21 × 21 steps) with a lateral resolution of 25 μm of a blade coated film of (S,S)-1![[thin space (1/6-em)]](https://www.rsc.org/images/entities/char_2009.gif) : :![[thin space (1/6-em)]](https://www.rsc.org/images/entities/char_2009.gif) ITIC-4F on ITO-functionalized glass slide. ITIC-4F on ITO-functionalized glass slide. | ||
Optoelectronic devices
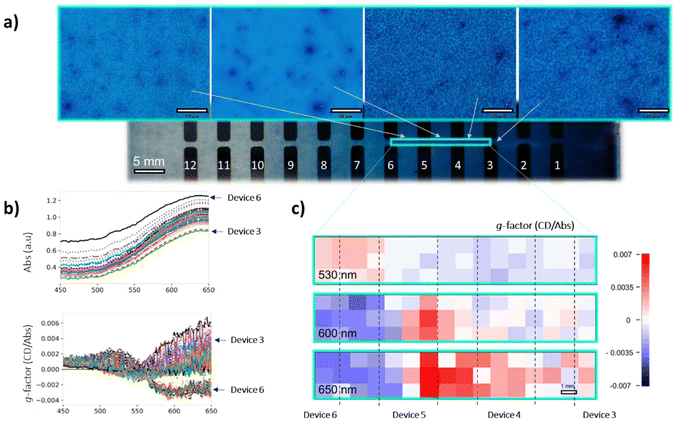
The new electron donor material has energy levels that in combination with those of the acceptor (vide supra) would be expected to lead to a functioning BHJ PV device, and the chiral nature means that the devices can also behave as circular polarised organic photodetectors (CP-OPDs). The device structure incorporating the (S,S)-1:ITIC-4F active layer was ITO/ZnO/active layer/MoOx/Ag (see ESI† for details). To study the influence of the (S,S)-1:ITIC-4F thickness on the photo-response, we deposited the active layers as thickness gradients using decelerating blade coating, employing a methodology developed previously.83,84 This process created 12 devices of varying thickness on each substrate, allowing for rapid and material-efficient optimization of the active layer thickness dependency. The method involved testing 12 distinct parametric combinations, each replicated twice, resulting in a total of 24 devices arranged on a single large aspect ratio substrate (Fig. 9, ESI Fig. S23† and the ‘optoelectronic device fabrication and characterisation’ section in ESI† for more details).Transmission optical micrographs of various regions of the devices show clear changes in morphology of the material as thickness is modulated, a feature also observable in AFM measurements on selected regions (ESI Fig. S11†). The area highlighted in Fig. 9 with a green rectangle was imaged directly using the B23 MMP facility in spectroscopic mode from which the 2D maps at 530, 600 and 650 nm were generated, respectively. We were unable to record spectroscopic data outside this green perimeter area because the sample was either too thin or too thick to give a reliable signal.
The absorbance decreases down the plate as to be expected as the film becomes thinner. More remarkably, the apparent g-factor changes dramatically, as noted in the spectra and the MMP maps at specific wavelengths that are extracted from the spectra. There is a change in the sign of the Cotton effect in the range 550 to 650 nm between the devices 5 and 6. In addition, a positive Cotton effect emerges at approximately 530 nm (see ESI Fig. S21† for full spectroscopic MMP plots). These data indicate a morphology-induced change in the supramolecular structure in the films as they become thinner. Film thickness has been shown to influence the chiral arrangement in polymers,85–87 we are not aware of this affect being observed in systems containing mixtures of small molecule. While there is no direct proof of the origin of this effect, domain size could influence the supramolecular organization in the DPP part of the material, as it is clear that the presence of ITIC-4F does affect the supramolecular structure. That effect presumably arises from the interface between the two components. As film morphology changes, the interface to volume ratio changes, and therefore the influence of the acceptor molecule on the donor molecules chiral orientation is modulated.
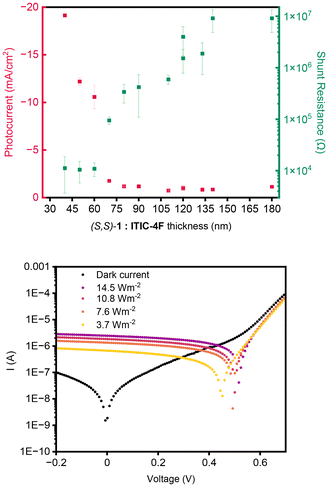
The devices were measured under non-polarized light (AM 1.5 G), varying the thickness. As shown in Fig. 10, most BHJ devices exhibit a photocurrent around 1 mA cm−2, with thinner layers detecting more photocurrent. The performance of the devices as BHJ organic solar cells based on (S,S)-1:ITIC-4F (Table S6 and Fig. S24, S25†) are constrained by the large domain sizes of the donor and acceptor molecules. This is supported by AFM and optical microscopy data, which indicate that the domain sizes exceed the scale necessary for efficient charge transport (see ESI Fig. S11 and S23†). Using different deposition and processing parameters did not improve greatly the performance (see ESI Table S6† for a more complete discussion of all the BHJ devices that were prepared). However, these devices with thinner layers also exhibit very low shunt resistance. In OPDs, a high shunt resistance is desirable as it reduces dark current, improves the signal-to-noise ratio, results in faster response times, and enhances overall sensitivity (Fig. 10). The response of the photocurrent under illumination of 709 nm shows a linear dynamic response at 0 V (see ESI Fig. S26†) of ∼5.6 dB in the range from 3.7 W until 14.2 W.
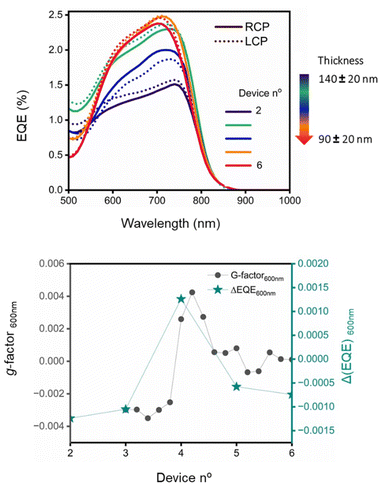
External quantum efficiency (EQE) measurements, which assess the current generated at each wavelength, were conducted using circularly polarized light (CPL) by placing a linear polarizer and a quarter-wave plate after the xenon lamp (Fig. S27†). Both left- and right-circularly polarized light (LCP and RCP), were tested separately, assuming LCP (h+ − e−) ≠ RCP (h+ − e−). The same devices in the gradient array that were tested for their EQE were explored in the spectroscopic grid experiment at the B23 beamline at Diamond (Fig. 9) to correlate the results of the two experiments (Fig. 11). In device 2 (Fig. 11), LCP light generates more current compared to RCP light. The same pattern is observed in device 3. However, in device 4, the situation reverses, with right circularly polarized light producing more current. In devices 5 and 6, the difference between the two is diminished, and the curves appear similar. When comparing this with the Mueller matrix map extrapolated from the spectroscopic grid experiment, particularly at 600 nm, it is evident that the film of the blended donor and acceptor changes from a negative to a positive signal around the 4th device, then decreases again, approaching zero.
With those measurements an EQE dissymmetry factor can be calculated using:
 | (1) |
By plotting the apparent g-factor against gEQE, calculated as in (1), a correlation between the two values can be observed along the gradient.
Here, the small molecules embedded in the active layer exhibit selectivity for left- or right-handed CPL depending on the layer's thickness. This selectivity results in a higher photocurrent generation, even though the absorption probability is lower compared to linearly polarized light (see ESI Fig. S28†). Despite the reversal of circular polarization at the metallic electrode,88,89 the distinction between left- and right-handed CPL is preserved due to the asymmetry in the operation of the two electrodes (with ITIC-4F being a superior charge carrier compared to the DPP derivative). Additionally, part of the incident light is absorbed by the film, reducing the intensity of the reflected light compared to the incident light.
A control experiment was performed by using a racemic mixture of 1, formed from an equimolar mixture of (R,R)-1 and (S,S)-1, blended with ITIC-4F that showed no discrimination in the current generation upon illumination with different light polarizations (see ESI Fig. S29†). The devices based on a racemic active layer give a poorer performance than that based on the enantiomeric material (ESI Table S7†) because of the larger phase separation observed in the films.
While the correlation between short-circuit current, open-circuit voltage, and the thickness and morphology of the device is well-established, the relationship with electronic properties and the preferential absorption and current generation under CPL is novel. Using synchrotron radiation that enables the highest spatial resolution, detailed MMP data was recorded from which the CD solid state maps along the gradient of the active layer in the organic solar cell were obtained, allowing prediction of its behaviour under CPL excitation.
It is to be noted that the term apparent g-factor has been used throughout this text. An analysis of the thickness dependence of the absorption of the films studied with the MMP showed that while there is a linear dependence of absorption with the thickness (see Fig. S30†) there is a non-zero intercept. A contribution from reflection and/or light scattering, therefore, cannot be ruled out, and for this reason the calculated g-factor is apparent. The corrected53g-factor curves are presented in Fig. S30.†
Conclusions
The optical activity data presented here indicates clearly that the electron acceptor ITIC-4F influences dramatically the chiral arrangement of (S,S)-1 compared with its supramolecular structure as a pure material. That information is not evident from any other characterisation technique. The change in organisation of the DPP-containing compound might be interesting to consider in the context of other photovoltaic materials of this type, and the method employed to observe this arrangement with synchrotron MMP could be used widely. Although it is not possible to image individual domains of the chiral material in the nanostructured film, that AFM shows to comprise of acicular objects consistent with phase separated components in the films, the supramolecular arrangement is shown at the micron scale.The MMP imaging is proven to reveal homogeneity of short range chiral orientations and more heterogeneous longer range arrangements in the films. The CD signals recorded with the MMP are similar across large areas, showing that the local molecular order is conserved. The linear dichroic and circular birefringent effects are clearly present at certain randomly distributed locations in the composite films, as seen in the maps measured using the synchrotron light, but apparently do not affect greatly the CD spectra recorded on a commercial instrument that measures the optical activity at a much larger length scale (several millimetres). The synchrotron MMP spectroscopic technique can be used to characterise the materials in a device configuration on transparent electrodes. That fact makes the method an extremely useful probe for studying the arrangements of molecules at different length scales in optoelectronic devices. Moreover, while the absorbance signal only decreases in intensity as the spectroscopic grid maps were measured along the solar cell gradient, the optical activity changes dramatically, reflecting variations in supramolecular organization and domain size. This further highlights the uniqueness of this technique, which allowed recording of spatially resolved information from a functioning organic solar cell and correlate it with its electronic properties.
The chiral materials show an EQE response that depends on the circularly polarised sense of the irradiating light as well as the apparent g-factor of the particular area in the gradient film. The differentiation is surely affected by the optical activity of the composite material across the visible range, with positive and negative components that nonetheless reaffirm great promise for chiral materials in optoelectronic devices.90,91
Author contributions
The manuscript was written through contributions of all authors. CEK and TWR prepared, purified and characterized the materials. GP contributed to the characterization. LLP performed the AFM experiments under the supervision of PB. GP, LLP and DBA performed CD and MMP imaging experiments on quartz. GP and DBA performed CD and MMP on devices. SRG helped in device fabrication and characterization working with GP under the supervision of MCQ. GS worked with LLP, GP and DBA in the recording of the data at Diamond B23 beamline (SM26044). DBA conceptualized, supervised and coordinated the research and attained funding. All authors have given approval to the final version of the manuscript.Data availability
All data is in the main article text or ESI.†Data for this article, including excel files for the spectroscopic and device data and raw files for the AFM data are available at Digital.CSIC Open Science at https://digital.csic.es/.
The data supporting this article in image format have been included as part of the ESI.†
Conflicts of interest
There are no conflicts to declare.Acknowledgements
We thank most warmly Dr Flavia Pop for preliminary syntheses of asymmetric DPP monomers and Dr Christopher Mellor for the VASE data analysis. We are grateful to the University of Nottingham through the Propulsion Futures Beacon of Excellence, the MICIU/AEI/10.13039/501100011033 for the “Severo Ochoa” program for Centres of Excellence CEX2019-000917-S and CEX2023-001263-S as well as project TED2021-131911B-I00, and the EPSRC through the LDMI DTP under grant EP/R513283/1. DBA thanks the MICIU/AEI PID2021-123873NB-I00 and the Agència de Gestió d'Ajuts Universitaris i de Recerca (AGAUR), Grant 2021SGR01085. GP thanks La Caixa Foundation for a predoctoral contract (ID 100010434, code LCF/BQ/DI23/11990066). MCQ and SR acknowledge funding from the European Union through Marie Curie IDEAL, with grant reference 101025608. We thank Dr Markos Paradinas from the ICMAB Scanning Probe Microscopy Laboratory for the AFM images along the gradient of the solar cells. We also thank Dr Sebastian Reparaz for his help with the setup of the EQE measurements. We warmly thank Dr Martin Kreuzer at BL01–MIRAS beamline of ALBA synchrotron for IR measurements. The Diamond Light Source Ltd (beamline B23) is thanked for providing beamtime (SM30198) and Drs T.-M. Gianga and T. Jávorfi for beamline assistance.References
- C. Zhang, X. H. Wang and L. Z. Qiu, Front. Chem., 2021, 9, 711488 CrossRef CAS PubMed.
- D. L. Zhu, W. Jiang, Z. T. Ma, J. J. Feng, X. Q. Zhan, C. Lu, J. Liu, J. Liu, Y. Y. Hu, D. Wang, Y. S. Zhao, J. P. Wang, Z. H. Wang and L. Jiang, Nat. Commun., 2022, 13, 3454 CrossRef CAS PubMed.
- M. D. Ward, W. D. Shi, N. Gasparini, J. Nelson, J. Wade and M. J. Fuchter, J. Mater. Chem. C, 2022, 10, 10452–10463 RSC.
- I. Song, J. Y. Ahn, H. J. Ahn, S. H. Lee, J. G. Mei, N. A. Kotov and J. H. Oh, Nature, 2023, 617, 92–99 CrossRef CAS PubMed.
- D.-M. Lee, J.-W. Song, Y.-J. Lee, C.-J. Yu and J.-H. Kim, Adv. Mater., 2017, 29, 1700907 CrossRef PubMed.
- G. Albano, L. A. Aronica, A. Minotto, F. Cacialli and L. Di Bari, Chem. – Eur. J., 2020, 26, 16622–16627 CrossRef CAS PubMed.
- L. Wan, J. Wade, X. H. Wang, A. J. Campbell and M. J. Fuchter, J. Mater. Chem. C, 2022, 10, 5168–5172 RSC.
- A. Wadsworth, Z. Hamid, J. Kosco, N. Gasparini and I. McCulloch, Adv. Mater., 2020, 32, 2001763 CrossRef CAS PubMed.
- K. Khandelwal, S. Biswas, A. Mishra and G. D. Sharma, J. Mater. Chem. C, 2022, 10, 13–43 RSC.
- E. Gomar-Nadal, J. Puigmartí-Luis and D. B. Amabilino, Chem. Soc. Rev., 2008, 37, 490–504 RSC.
- L. Maggini and D. Bonifazi, Chem. Soc. Rev., 2012, 41, 211–241 RSC.
- T. Ghosh, J. S. Panicker and V. C. Nair, Polymers, 2017, 9, 112 CrossRef PubMed.
- S. Kundu, A. Chowdhury, S. Nandi, K. Bhattacharyya and A. Patra, Chem. Sci., 2021, 12, 5874–5882 RSC.
- S. E. Shaheen, C. J. Brabec, N. S. Sariciftci, F. Padinger, T. Fromherz and J. C. Hummelen, Appl. Phys. Lett., 2001, 78, 841–843 CrossRef CAS.
- F. Zhao, C. Wang and X. W. Zhan, Adv. Energy Mater., 2018, 8, 1703147 CrossRef.
- H. S. Park, Y. W. Han, H. S. Lee, S. J. Jeon and D. K. Moon, ACS Appl. Energy Mater., 2020, 3, 3745–3754 CrossRef CAS.
- M. J. Iqbal, J. Q. Zhang and Z. X. Wei, J. Nanopart. Res., 2022, 24, 225 CrossRef CAS.
- L. X. Liu, Y. Yang, Y. H. Wang, M. A. Adil, Y. J. Zhao, J. Q. Zhang, K. Chen, D. Deng, H. Zhang, K. Amin, Y. C. Wu, Y. J. Zhang and Z. X. Wei, ACS Mater. Lett., 2022, 4, 401–409 CrossRef CAS.
- J. H. Fu, Q. G. Yang, P. H. Huang, S. Chung, K. W. Cho, Z. P. Kan, H. Liu, X. H. Lu, Y. W. Lang, H. J. Lai, F. He, P. W. K. Fong, S. R. Lu, Y. Yang, Z. Y. Xiao and G. Li, Nat. Commun., 2024, 15, 6153 CrossRef PubMed.
- D. B. Amabilino and J. Veciana, Top. Curr. Chem., 2006, 265, 253–302 CrossRef CAS.
- Y. Yang, B. Rice, X. Shi, J. R. Brandt, R. Correa da Costa, G. J. Hedley, D.-M. Smilgies, J. M. Frost, I. D. W. Samuel, A. Otero-de-la-Roza, E. R. Johnson, K. E. Jelfs, J. Nelson, A. J. Campbell and M. J. Fuchter, ACS Nano, 2017, 11, 8329–8338 CrossRef CAS PubMed.
- S. Huang, H. Yu and Q. Li, Adv. Sci., 2021, 8, 2002132 CrossRef PubMed.
- D. B. Amabilino, G. C. Dizon, C. E. Killalea and A. R. Mallia, Fundamentals of Supramolecular Chirality, World Scientific Publishing Co., 2021, pp. 1–58 Search PubMed.
- Y. T. Sang and M. H. Liu, Chem. Sci., 2022, 13, 633–656 RSC.
- M. M. Talamo, T. Cauchy, F. Zinna, F. Pop and N. Avarvari, Chirality, 2023, 35, 805–816 CrossRef PubMed.
- G. Albano, L. A. Aronica, G. Pescitelli and L. Di Bari, Chirality, 2024, 36, e23608 CrossRef CAS PubMed.
- G. Gottarelli, S. Lena, S. Masiero, S. Pieraccini and G. P. Spada, Chirality, 2008, 20, 471–485 CrossRef CAS PubMed.
- I. Danila, F. Pop, C. Escudero, L. N. Feldborg, J. Puigmartí-Luis, F. Riobé, N. Avarvari and D. B. Amabilino, Chem. Commun., 2012, 48, 4552–4554 RSC.
- G. Pescitelli, L. Di Bari and N. Berova, Chem. Soc. Rev., 2014, 43, 5211–5233 RSC.
- M. A. Castriciano, S. Cardillo, R. Zagami, M. Trapani, A. Romeo and L. M. Scolaro, Int. J. Mol. Sci., 2021, 22, 797 CrossRef CAS PubMed.
- T. Hussain, T. Jávorfi and G. Siligardi, Front. Chem., 2021, 9, 616928 CrossRef PubMed.
- R. L. Disch and D. I. Sverdlik, Anal. Chem., 1969, 41, 82–86 CrossRef CAS.
- M. Wolffs, S. J. George, Ž Tomović, S. C. J. Meskers, A. P. H. J. Schenning and E. W. Meijer, Angew. Chem., Int. Ed., 2007, 46, 8203–8205 CrossRef CAS PubMed.
- A. Sorrenti, Z. El-Hachemi, O. Arteaga, A. Canillas, J. Crusats and J. M. Ribo, Chem. – Eur. J., 2012, 18, 8820–8826 CrossRef CAS PubMed.
- T. Schnitzer, M. D. Preuss, J. van Basten, S. M. C. Schoenmakers, A. J. H. Spiering, G. Vantomme and E. W. Meijer, Angew. Chem., Int. Ed., 2022, 61, e202206738 CrossRef CAS PubMed.
- M. Grzybowski and D. T. Gryko, Adv. Opt. Mater., 2015, 3, 280–320 CrossRef CAS.
- M. Kaur and D. H. Choi, Chem. Soc. Rev., 2015, 44, 58–77 RSC.
- F. Pop, W. Lewis and D. B. Amabilino, CrystEngComm, 2016, 18, 8933–8943 RSC.
- A. Ruiz-Carretero, N. R. Ávila-Rovelo, S. Militzer and P. J. Mésini, J. Mater. Chem. A, 2019, 7, 23451–23475 RSC.
- J. Humphreys, F. Pop, P. A. Hume, A. S. Murphy, W. Lewis, E. S. Davies, S. P. Argent and D. B. Amabilino, CrystEngComm, 2021, 23, 1796–1814 RSC.
- N. Maity, K. Majumder, A. K. Patel, D. Swain, N. Suryaprakash and S. Patil, ACS Omega, 2022, 7, 23179–23188 CrossRef CAS PubMed.
- M. Stolte, S.-L. Suraru, P. Diemer, T. He, C. Burschka, U. Zschieschang, H. Klauk and F. Würthner, Adv. Funct. Mater., 2016, 26, 7415–7422 CrossRef CAS.
- P. A. Hume, J. P. Monks, F. Pop, E. S. Davies, R. C. I. MacKenzie and D. B. Amabilino, Chem. – Eur. J., 2018, 24, 14461–14469 CrossRef CAS PubMed.
- K. Dhbaibi, L. Favereau, M. Srebro-Hooper, M. Jean, N. Vanthuyne, F. Zinna, B. Jamoussi, L. Di Bari, J. Autschbach and J. Crassous, Chem. Sci., 2018, 9, 735–742 RSC.
- S. Militzer, N. Nishimura, N. R. Ávila-Rovelo, W. Matsuda, D. Schwaller, P. J. Mésini, S. Seki and A. Ruiz-Carretero, Chem. – Eur. J., 2020, 26, 9998–10004 CrossRef CAS PubMed.
- L. X. Liu, Y. Yang, Y. H. Wang, M. A. Abdullah Adil, Y. J. Zhao, J. Q. Zhang, K. Chen, D. Deng, H. Zhang, K. Amin, Y. C. Wu, Y. J. Zhang and Z. X. Wei, ACS Mater. Lett., 2022, 4, 401–409 CrossRef CAS.
- M. Ottolini, Z. Anfar, N. Grover, G. Magna, M. Stefanelli, R. Paolesse, M. O. Senge, S. Bettini, L. Valli, R. Oda and G. Giancane, Nanoscale, 2024, 16, 16593–16601 RSC.
- X. Yang, M. Brückner, F. Rominger, T. Kirschbaum and M. Mastalerz, Chem, 2024, 10, 832–842 CAS.
- W. W. Li, K. H. Hendriks, M. M. Wienk and R. A. J. Janssen, Acc. Chem. Res., 2016, 49, 78–85 CrossRef CAS PubMed.
- W. Zhao, S. Li, H. Yao, S. Zhang, Y. Zhang, B. Yang and J. Hou, J. Am. Chem. Soc., 2017, 139, 7148–7151 CrossRef CAS PubMed.
- L. Ciammaruchi, O. Zapata-Arteaga, E. Gutiérrez-Fernández, J. Martin and M. Campoy-Quiles, Mater. Adv., 2020, 1, 2846 RSC.
- G. Zhang, F. R. Lin, F. Qi, T. Heumüller, A. Distler, H.-J. Egelhaaf, N. Li, P. C. Y. Chow, C. J. Brabec, A. K.-Y. Jen and H.-L. Yip, Chem. Rev., 2022, 122, 14180–14274 CrossRef CAS PubMed.
- M. Schulz, J. Zablocki, O. S. Abdullaeva, S. Brück, F. Balzer, A. Lützen, O. Arteaga and M. Schiek, Nat. Commun., 2018, 9, 2413 CrossRef PubMed.
- G. Albano, G. Pescitelli and L. Di Bari, Chem. Rev., 2020, 120, 10145–10243 CrossRef CAS PubMed.
- B. Laidlaw, J. Eng, J. Wade, X. Shi, F. Salerno, M. J. Fuchter and T. J. Penfold, Chem. Commun., 2021, 57, 9914–9917 RSC.
- S. Míguez-Lago, I. F. A. Mariz, M. A. Medel, J. M. Cuerva, E. Maçôas, C. M. Cruz and A. G. Campaña, Chem. Sci., 2022, 13, 10267–10272 RSC.
- C. E. Killalea, M. Samperi, G. Siligardi and D. B. Amabilino, Chem. Commun., 2022, 58, 4468–4471 RSC.
- G. Albano, F. Zinna, F. Urraci, M. A. M. Capozzi, G. Pescitelli, A. Punzi, L. Di Bari and G. M. Farinola, Chem. – Eur. J., 2022, 28, e202201178 CrossRef CAS PubMed.
- J. L. Pezzaniti and M. A. Chipman, Opt. Eng., 1995, 34, 1558 CrossRef.
- J. H. Freudenthal, E. Hollis and B. Kahr, Chirality, 2009, 21, E20 CrossRef CAS PubMed.
- A. Taddeucci, G. Siligardi and L. Di Bari, Chem. Biomed. Imaging, 2023, 1, 471–478 CrossRef CAS PubMed.
- D. B. Amabilino, E. Ramos, J.-L. Serrano, T. Sierra and J. Veciana, J. Am. Chem. Soc., 1998, 120, 9126–9134 CrossRef CAS.
- P. Iavicoli, H. Xu, T. Keszthelyi, J. Telegdi, K. Wurst, B. Van Averbeke, W. J. Saletra, A. Minoia, D. Beljonne, R. Lazzaroni, S. De Feyter and D. B. Amabilino, Chirality, 2012, 24, 155–166 CrossRef CAS PubMed.
- W. J. Saletra, Transfer of chirality from amphiphiles into materials, PhD Thesis, Universitat Autònoma de Barcelona, 2013, https://hdl.handle.net/10803/125861 Search PubMed.
- J. Humphreys, C. E. Killalea, F. Pop, E. S. Davies, G. Siligardi and D. B. Amabilino, Chirality, 2023, 35, 281–297 CrossRef CAS PubMed.
- R. S. Szabadai, J. Roth-Barton, K. P. Ghiggino, J. M. White and D. J. D. Wilson, Aust. J. Chem., 2014, 67, 1330–1337 CrossRef CAS.
- S. Wood, J. Wade, M. Shahid, E. Collado-Fregoso, D. D. C. Bradley, J. R. Durrant, M. Heeney and J.-S. Kim, Energy Environ. Sci., 2015, 8, 3222 RSC.
- J. Dhar, N. Venkatramaiah, A. Anitha and S. Patil, J. Mater. Chem. C, 2014, 2, 3457 RSC.
- K. Zhang, B. Tieke, J. C. Forgie, F. Vilela, J. A. Parkinson and P. J. Skabara, Polymer, 2010, 51, 6107 CrossRef CAS.
- V. Dehm, Z. Chen, U. Baumeister, P. Prins, L. D. A. Siebbeles and F. Würthner, Org. Lett., 2007, 9, 1085 CrossRef CAS PubMed.
- C. Oliveras-González, F. Di Meo, A. González-Campo, D. Beljonne, P. Norman, M. Simón-Sorbed, M. Linares and D. B. Amabilino, J. Am. Chem. Soc., 2015, 137, 15795–15808 CrossRef PubMed.
- O. Hassan, M. Falcone, A. Operamolla and G. Albano, New J. Chem., 2021, 45, 12016 RSC.
- A. T. Rösch, Q. Zhu, J. Robben, F. Tassinari, S. C. J. Meskers, R. Naaman, A. R. A. Palmans and E. W. Meijer, Chem. – Eur. J., 2021, 27, 298 CrossRef PubMed.
- L. Liirò-Peluso, J. Wrigley, D. B. Amabilino and P. H. Beton, ACS Appl. Electron. Mater., 2022, 5, 13794–13804 Search PubMed.
- M. Hifsudheen, R. K. Mishra, B. Vedhanarayanan, V. K. Praveen and A. Ajayaghosh, Angew. Chem., Int. Ed., 2017, 56, 12634 CrossRef CAS PubMed.
- S. Marina, A. D. Scaccabarozzi, E. Gutierrez-Fernandez, E. Solano, A. Khirbat, L. Ciammaruchi, A. Iturrospe, A. Balzer, L. Yu, E. Gabirondo, X. Monnier, H. Sardon, T. D. Anthopoulos, M. Caironi, M. Campoy-Quiles, C. Müller, D. Cangialosi, N. Stingelin and J. Martin, Adv. Funct. Mater., 2021, 31, 2103784 CrossRef CAS.
- Y. A. A. Quiroz, T. Koganezawa, P. Perkhun, E. Barulina, C. M. Ruiz, J. Ackermann, N. Yoshimoto and C. Videlot-Ackermann, Adv. Electron. Mater., 2022, 8, 2100743 CrossRef.
- G. Albano, M. Górecki, G. Pescitelli, L. Di Bari, T. Jávorfi, R. Hussain and G. Siligardi, New J. Chem., 2019, 43, 14584–14593 RSC.
- J. Wade, J. N. Hilfiker, J. R. Brandt, L. Liirò-Peluso, L. Wan, X. Shi, F. Salerno, S. T. J. Ryan, S. Schöche, O. Arteaga, T. Jávorfi, G. Siligardi, C. Wang, D. B. Amabilino, P. H. Beton, A. J. Campbell and M. J. Fuchter, Nat. Commun., 2020, 11, 6137 CrossRef CAS PubMed.
- G. Albano, M. Górecki, T. Jávorfi, R. Hussain, G. Siligardi, G. Pescitelli and L. Di Bari, Aggregate, 2022, 3, e193 CrossRef CAS.
- L. Minion, J. Wade, J. M. Moreno-Naranjo, S. Ryan, G. Siligardi and M. J. Fuchter, Chirality, 2023, 35, 817–825 CrossRef CAS PubMed.
- O. Arteaga and B. Kahr, J. Opt. Soc. Am. B, 2019, 36, F72–F83 CrossRef CAS.
- E. Pascual-San-José, X. Rodríguez-Martínez, R. Adel-Abdelaleim, M. Stella, E. Martínez-Ferrero and M. Campoy-Quiles, J. Mater. Chem. A, 2019, 7, 20369–20382 RSC.
- A. Sánchez-Díaz, X. Rodríguez-Martínez, L. Córcoles-Guija, G. Mora-Martín and M. Campoy-Quiles, Adv. Electron. Mater., 2018, 4, 1700477 CrossRef.
- M. R. Craig, P. Jonkheijm, S. C. J. Meskers, A. P. H. J. Schenning and E. W. Meijer, Adv. Mater., 2003, 15, 1435–1438 CrossRef CAS.
- F. J. Wang, K. Nakano, H. Segawa and K. Tajima, ACS Appl. Mater. Interfaces, 2021, 13, 7510–7516 CrossRef CAS PubMed.
- L. Wan, J. Wade, F. Salerno, O. Arteaga, B. Laidlaw, X. H. Wang, T. Penfold, M. J. Fuchter and A. J. Campbell, ACS Nano, 2022, 16, 9962–9963 CrossRef CAS PubMed.
- J. Gilot, R. Abbel, G. Lakhwani, E. W. Meijer, A. P. Schenning and S. C. Meskers, Adv. Mater., 2010, 22, E131–E134 CAS.
- F. Zinna, L. Arrico, T. Funaioli, L. Di Bari, M. Pasini, C. Botta and U. Giovanella, J. Mater. Chem. C, 2022, 10, 463–468 RSC.
- J. R. Brandt, F. Salerno and M. J. Fuchter, Nat. Rev. Chem., 2017, 1, 0045 CrossRef CAS.
- J. Crassous, M. J. Fuchter, D. E. Freedman, N. A. Kotov, J. Moon, M. C. Beard and S. Feldmann, Nat. Rev. Mater., 2023, 8, 365–371 CrossRef.
Footnotes |
| † Electronic supplementary information (ESI) available: Synthetic details and characterization of the news materials, absorption, emission and electrochemical data, supporting CD, MMP mapping and AFM images, protocols, materials and methods. See DOI: https://doi.org/10.1039/d4nr04269g |
| ‡ These authors contributed equally to the research described here. |
| § Present address: Université Angers, CNRS, MOLTECH-Anjou, F-49000 Angers, France |
| ¶ Present address: The Francis Crick Institute, 1 Midland Road, London NW1 1AT, UK |
| This journal is © The Royal Society of Chemistry 2025 |

