DOI:
10.1039/D4SM01443J
(Paper)
Soft Matter, 2025,
21, 2242-2250
Demixing of an active-passive binary mixture through a two-dimensional elastic meshwork†
Received
4th December 2024
, Accepted 16th February 2025
First published on 17th February 2025
Abstract
Separation of particles based on motility is a daunting task, especially when the particles are of the same size and the density is low. We propose and demonstrate how a dilute monodisperse mixture of active-passive particles can be separated by introducing an elastic meshwork. Our in silico method does not rely on any external stimuli, rather the mesh size and stiffness of the meshwork control the demixing. There is a threshold activity above which demixing starts and below this, particles exert pressure on the meshwork that relaxes upon permeation. Our findings are in principle experimentally testable and open up new avenues for active-passive separation, where clustering of particles is not feasible.
1 Introduction
Selective permeation of molecules through hydrogels composed of cross-linked hydrophilic polymers or anisotropic obstacles is a key feature in a wide variety of biological systems. Examples include cartilage, mucus, and the extracellular matrix (ECM).1–3 Two well-studied mechanisms underlying this selectivity are particle size and the specific binding of particles to the meshwork, through which some particles are retained within the polymeric structure while others pass through. Although selective permeation is important, there are cases where it is necessary to allow relatively larger particles to permeate. For example, in humans, the ECM acts as an obstacle to drug delivery. This is because the ECM consists of various components like collagen, glycosaminoglycans, and other molecules that create a physical barrier. These barriers can limit the ability of larger particles to diffuse through the tissue and reach their target area effectively. The statement that the ECM acts as an obstacle to drug delivery highlights the challenge of using large nanoparticles to penetrate tissues, which is necessary for effective drug delivery, for example in tumors.4–10 Similarly, mucus regulates the permeability of nanoparticles,11 but can also limit the diffusion of small molecules like antibiotics. Several studies have suggested that the permeation of larger particles can be enhanced by optimizing their interactions with the mesh.12–16 This fact has been used in molecular engineering, such as in the case of tuning molecular permeability in polymer matrices17 and designing polymer based drug delivery vehicles.18
Another approach to enabling larger particles to permeate through mesh and porous media is by introducing activity.19–33 Here, activity refers to the ability of the particles to execute directed motion by consuming internal energy and therefore these particles are out of equilibrium;13,34 examples include bacteria,35 active colloids,36 motile cells37etc. This unique property of active particles is finding innovative applications in biomedical fields, particularly in cancer therapy. One promising approach involves using live tumor-targeting bacteria, which offers several advantages over traditional therapeutics.20,38
In large ensembles, the activity of individual species can vary widely, from non-motile to highly motile, and separating these species based on motility, despite their similar sizes, is interesting as well as challenging. For example, motile sperm can be separated from a mixture using an integrated, self-contained microfluidic device that is passively driven by the sperm's motility to cross streamlines in a laminar fluid stream.39–41 Further advancements in selecting active species involve the use of acoustofluidic setups, which allow for the tunable selection of sperm cells based on their motility due to the adjustable strength of the acoustic field.42 Other microfluidic methods do not require external flows but instead leverage the natural activity of motile sperm to separate them from immotile cells and debris. These devices rely on the ability of motile sperm to become trapped and accumulate in the corners of asymmetric obstacles,43 or to move in a preferred direction through microchannels44 or arrays of asymmetric obstacles.45 Some studies have observed phase separation between active and passive particles beyond certain thresholds of activity and packing fraction. In these cases, a dense phase of passive particles is enclosed by a layer of active particles.46–49 However, separating these binary mixtures at low density is intriguing because clustering and phase separation do not occur in such cases.
In this work, we demonstrate through Langevin dynamics simulations how a mixture of active and passive particles demixes and permeates through two-dimensional elastic meshworks acting as barriers, and how this permeation affects the meshwork properties.50 Our observations reveal that the interplay between motility, tracer-to-mesh size ratio, and stiffness of the meshwork provides efficient methods for selective particle permeation even though they are not stimulated externally.51 At high tracer-to-mesh size ratios, only particles with high activity are able to permeate, as permeation is feasible only beyond a threshold value of activity, which increases with increasing tracer to mesh size ratio as well as the stiffness of the meshwork.
2 Model and simulation details
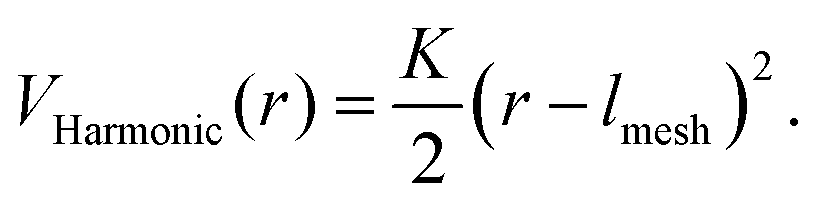
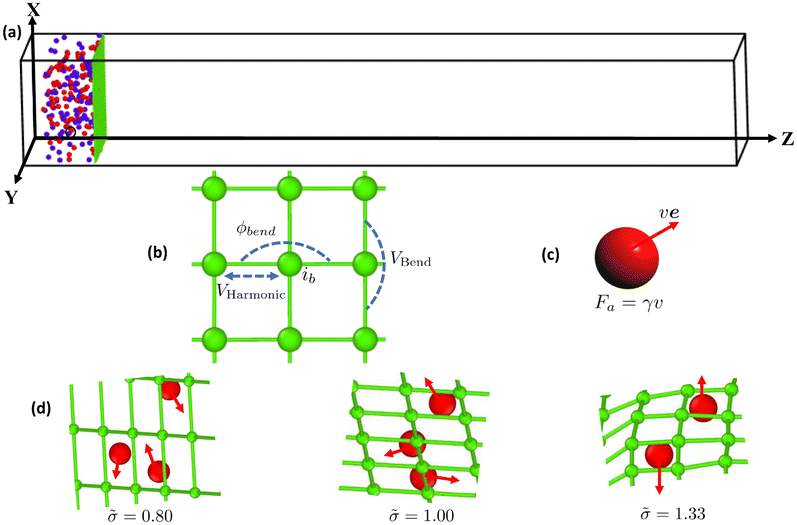
We perform coarse-grained computer simulations to investigate the selective filtration of active particles from a monodisperse binary mixture of active and passive particles (tracer), having diameter σtracer = 2σ present in a 1![[thin space (1/6-em)]](https://www.rsc.org/images/entities/char_2009.gif) :1 ratio through a two-dimensional elastic meshwork (Fig. 1(a)). The two-dimensional elastic meshwork is constructed on a square lattice, where each site is connected to four neighboring sites via a harmonic potential given by (Fig. 1(b)):
:1 ratio through a two-dimensional elastic meshwork (Fig. 1(a)). The two-dimensional elastic meshwork is constructed on a square lattice, where each site is connected to four neighboring sites via a harmonic potential given by (Fig. 1(b)):| |  | (1) |
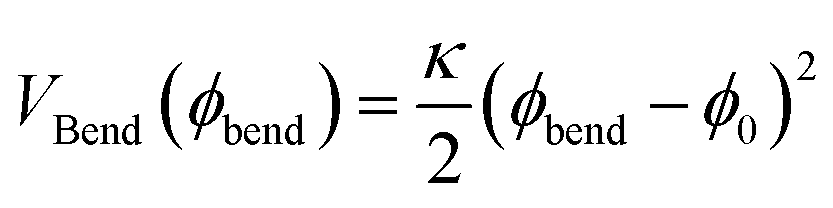
here, r represents the distance between two neighboring beads of the meshwork, lmesh represents the bond length (mesh size), and K = 50 is the spring constant. Additionally, to restrict the bending of the meshwork, we introduce a harmonic bending potential defined as:| |  | (2) |
where κ is the bending modulus and ϕbend is the angle formed by three nearby beads of the meshwork, and ϕ0 is the equilibrium bond angle, which is shown in Fig. 1(b). To model the system, an elastic meshwork is fixed within a tetragonal box of dimensions 60σ × 60σ × 400σ at the height of z = 40σ. A binary mixture of active (red), and passive (blue) particles, each consisting of 100 particles (Na = Np = 100, where Na and Np represent the number of active and passive particles, respectively), is initially placed at the one end of the box between Z = 0 and 40 within the box (Fig. 1a). This corresponds to a volume fraction, 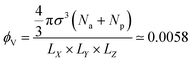 considering that the particles are contained in a box of volume LX × LY × LZ at the beginning of simulation, where, LX = 60, LY = 60 and LZ = 40 in the units of σ. Due to this arrangement of the meshwork and particles, the free volume of the box is nine times larger than the volume occupied by the particles, ensuring a negligibly small probability of particles returning through the meshwork. Furthermore, to reduce the effect of periodic boundary conditions (PBC) on the permeability of particles through the meshwork, we do not impose any PBC in the Z direction and implement repulsive wall planes parallel to the mesh in the XY-plane at the boundaries Z = 0 and Z = 400 of the simulation box. The potential of these walls for the particles is defined as:
| | 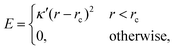 | (3) |
where κ′ = 100, and rc = 0 and r is the distance of the tracer from the wall.
 |
| | Fig. 1 (a) A snapshot of the model system showing active particles in red, passive particles in blue, and the meshwork beads in green. (b) A zoomed-in view of a small portion of the meshwork. (c) A depiction of an active Brownian particle (ABP), with an arrow representing its instantaneous velocity. (d) Magnified images of a small portion of the meshwork: image on the left is for ![[small sigma, Greek, tilde]](https://www.rsc.org/images/entities/i_char_e10d.gif) = 0.80, in the center is for = 1.00, and on the right is for = 1.33. Arrows on the active particles (in red) depict their instantaneous directions of self-propulsion. = 0.80, in the center is for = 1.00, and on the right is for = 1.33. Arrows on the active particles (in red) depict their instantaneous directions of self-propulsion. | |
Interactions between meshwork beads with tracer particles, as well as among themselves, are modeled using the repulsive part of the Lennard–Jones potential, also known as the Weeks–Chandler–Andersen (WCA) potential.52
| | 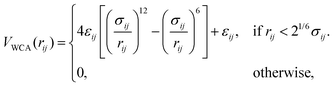 | (4) |
where
rij is the separation between the
ith and
jth particles, and
εij is the strength of the interaction with an effective interaction diameter of

. In what follows, we measure the length in units of
σ and the energy in units of the thermal energy
kBT, where
kB is the Boltzmann constant and
T is the absolute temperature. Details of the model parameters are given in Table S1 of the ESI.
†
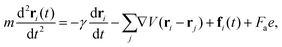
The dynamics of the position ri(t) of the ith particle is described by the Langevin equation:
| |  | (5) |
| |  | (6) |
In the overdamped limit, the inertial term

is negligibly small compared to the drag force

, where
γ is the friction coefficient. To ensure that the system is practically overdamped, we have taken a very high value of

. Here,
m is the mass of the particles and the unit of time (
τ) is

.
V(
r) is the total interaction potential that gives rise to the conservative forces in this model and is described as
V =
VWCA +
VHarmonic +
VBend. The thermal force,
fi(
t) is modeled as Gaussian white noise with zero mean and variance 〈
fi(
t′)
fj(
t′′)〉 = 6
γkBTδijδ(
t′ −
t′′). The activity is modeled as an active Brownian particle (ABP) with propulsive force
Fae (
Fig. 1(c)), where
Fa represents the magnitude of the active force and can be expressed in terms of the Péclet number as

with the orientation specified by the unit vector
e that changes according to
eqn (6). Here,
η(
t) is the stochastic vector, which follows the Gaussian distribution with 〈
η(
t)〉 = 0 and the time correlation is given by 〈
ηα(
t′)
ηβ(
t′′)〉 = 2
DRδαβδ(
t′ −
t′′), where

and
τR is the persistence time (see Fig. S1 and Section S1 of ESI
†). The unit vector
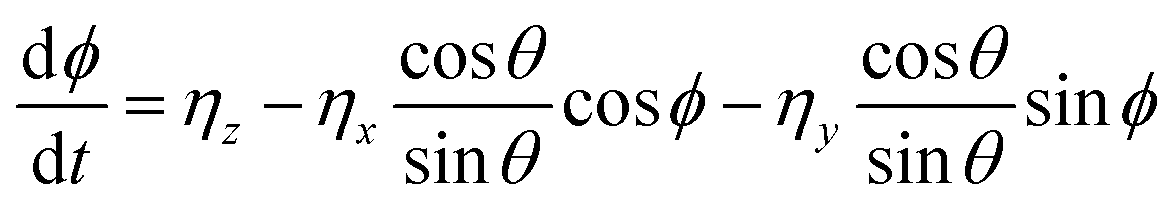
e can be expressed in the form of spherical polar coordinates (sin
θcos
![[thin space (1/6-em)]](https://www.rsc.org/images/entities/i_char_2009.gif) ϕ
ϕ,
sin
θsin
ϕ,
cos
θ).
| |  | (7) |
| |  | (8) |
where
ηx,
ηy and
ηz are the components of the Gaussian white noise
η in Cartesian coordinate space. We have
Fa = 0 for meshwork beads as well as when the particles are passive and non-zero for the self-propelled particles.
All the simulations are performed using the Langevin thermostat and the equation of motion is integrated using the velocity Verlet algorithm in each time step. We initialize the system by placing the colloidal particles under the polymer meshwork in the xy-plane and relaxing the initial configuration for 107 steps. All the production simulations are carried out for 1.5 × 10⁸ steps, where the integration time step is considered to be 5 × 10⁻³ and the positions of the colloidal particles are recorded every 500 steps. The simulations are carried out using LAMMPS,53 a freely available open-source molecular dynamics package.
3 Results and discussion
Selective permeation of particles is a significant phenomenon in biology and various biomedical applications.41,42,44 The active component typically exhibits faster and directed motion compared to the passive one, which facilitates their separation. However, over time, for low packing fraction the components may eventually mix again,40 which is shown in Fig. 2. Here, the binary mixture of active passive particles is placed at one end of the box (Fig. 2(a)), and for Pe = 140, without the meshwork, passive particles (blue) diffuse, leading to eventual mixing with active particles (Fig. 2(b)).
 |
| | Fig. 2 Snapshots of the system with a monodisperse binary mixture of active and passive colloidal particles are shown as follows: (a) the initial frame, (b) the final frame of the simulation without the mesh for Pe = 140, (c) the initial frame, and the final frame of the simulation with = 1.33 for (d) Pe = 0, (e) Pe = 80, and (f) Pe = 140. Here active particles are shown in red, passive particles are shown in blue, and the meshwork beads are shown in green. | |
In contrast, introducing a meshwork that can be engineered to serve as a barrier for passive particles is an effective protocol for separating particles based on their Pe. Such a barrier prevents passive particles from passing through,39–42 effectively blocking them. The snapshot in Fig. 2(c) shows the initial frame of the system, where a monodisperse mixture of active and passive particles is placed at the lower end of the Z-axis, beside the meshwork. At Pe = 0, no particles permeate, as shown in Fig. 2(d). As Pe increases to 80, only a few active particles manage to permeate (Fig. 2(e)). However, at Pe = 140 (Fig. 2(f)), a profound number of active particles pass through, demonstrating that the presence of a two-dimensional elastic meshwork facilitates the selective permeation of particles based on their activity and the properties of the meshwork. We define permeability as  , where, na,p represents the number of permeated particles, and Na,p indicates the total number of active and passive particles, where a stands for active and “p” stands for passive. Particles are considered permeated when they pass through the meshwork into the free space of the box, toward the upper end of the Z-axis. The tracer to mesh size ratio, defined as
  is an important parameter. We consider two cases, viz.Case 1: where the spring constant is fixed (K = 50) and is varied and Case 2: where is fixed at 1.33 and K is varied.
3.1 Case 1: K = 50, different values of ![[small sigma, Greek, tilde]](https://www.rsc.org/images/entities/h3_i_char_e10d.gif)
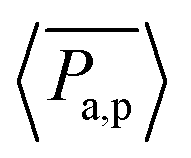
For different values with K = 50, the plots of the time evolution of permeabilities in linear-linear and log-linear scale of the particles are shown in Fig. 3. As shown in Fig. 3(a) for = 0.8, we observe that when all the particles are passive (Pe = 0), the permeability increases continuously over time, albeit at a slow rate. The permeation of passive particles for this size is also noticeable in Movie S1 of the ESI.† In contrast, for a mixture of active and passive particles, the permeability of active particles quickly reaches a steady state. Furthermore, when the size of the tracer is comparable = 1.0 and bigger = 1.33 compared to the size of the mesh, there is no permeation of passive particles, observed as a constant line (black) in Fig. 3(b) and (c). A similar observation is also evident from Movie S2 of the ESI.† Additionally, Fig. 3(b) and (c) show a visible effect of Pe on the permeation rate. In Fig. 3(c), we observe that there is no permeation until Pe = 40, and a very small fraction of active particles permeate at Pe = 80. With a further increase in Pe to Pe = 120 and 140, permeation growth is very fast with a small difference in growth rate. The early-time behavior of permeation is clearly visible in the log-linear plot of the time evolution of pressure. As shown in Fig. 3(d), for = 0.8, there is a noticeably smaller delay time (time at which permeation starts) for active particles compared to passive particles. However, this difference in delay time is less pronounced at high Pe. A similar effect of activity on the delay time is observed at = 1.0, but the value is higher, and the difference is more pronounced, as shown in Fig. 3(e). As increases to 1.33, the difference in delay time becomes even more noticeable (Fig. 3(f)). The effect of activity on the delay time is less pronounced at high Pe, when Pe is sufficiently large compared to the threshold value, allowing particles to pass more easily. These findings suggest that as increases, it becomes harder for particles to permeate, requiring more time and higher Pe. This difficulty becomes even more pronounced when is increased to 2.0, as the meshwork needs to deform to a large extent to allow particle permeation, as shown in Fig. S2 of the ESI.† Up to Pe = 180, there is no significant permeation of active particles; however, beyond this value, a profound number of active particles manage to escape.
 |
| | Fig. 3 Linear-linear plots for time evolution of Pa,p of particles at different Pe, with K = 50 and (a) = 0.8, (b) = 1.0, and (c) = 1.33; and log-linear plots for time evolution of Pa,p of particles at different Pe, with K = 50 and (d) = 0.8, (e) = 1.0 and (f) = 1.33. Here, τR = 10τ is the persistence time of ABP (discussed in Section S1 of the ESI†). | |
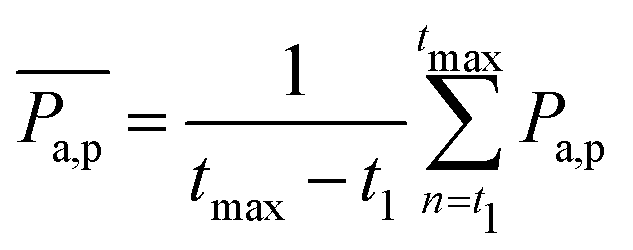
To gain more detail about the change in permeability with activity and , we calculate the time-averaged permeability,  , where t1 is the time beyond which permeability saturates, and tmax is the end of the run time followed by ensemble-averaged permeability,
  , where Ntrj represents the number of independent trajectories. We plot
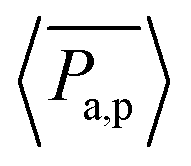
  against Pe, as shown in Fig. 4(a). We notice here that for a relatively smaller size of tracer, there is permeation of particles even at Pe = 0, and the system quickly saturates to a steady state as the Pe increases. In the case of a comparable and bigger size, there is no permeation for passive particles. In the former case, there is small permeability at Pe = 10, but there is a sudden increase and saturation at a high value at Pe = 20 and onward, which is supported by Movie S3 in the ESI.† In the latter case, there is no significant permeation until Pe = 80, as shown in Movie S4 of the ESI,† and at Pe = 100 there is a sudden increase in permeability followed by saturation at higher Pe, which is prominently evident from Movie S5 of the ESI† with Pe = 120. These results suggest that there is a threshold value of Pe for permeation, which increases with the . This is because larger particles require the meshwork to stretch more than smaller particles to accommodate their size. Furthermore, we calculate the selectivity of active colloidal particles over passive ones, defined as:
  . For better statistics, we calculate time-averaged selectivity
 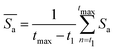 followed by ensemble-averaged selectivity
 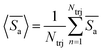 . We plot average
  against Pe for = 0.8,1.0and1.33, as shown in Fig. 4(b). We observe that for relatively smaller tracer-to-mesh size ratios, selectivity increases from Pe = 0 to 10, with no further effect of Pe beyond this point. In contrast, for comparable and larger tracer-to-mesh size ratios, there is a constant line at
  , indicating no permeation of passive particles.
 |
| | Fig. 4 Plots showing the change in (a)  and (b) and (b)  with Pe for different and K = 50. with Pe for different and K = 50. | |
To understand the meshwork deformation and permeation of particles, we calculate the pressure exerted on individual beads of the meshwork, which is defined in Section S2 of the ESI.†54,55 We plot the spatial distribution of the positions of the meshwork beads (Fig. 5(a)) along with the spatial distribution of pressure on the meshwork for = 1 and Pe = 80 (Fig. 5(b)). As shown in Fig. 5(a), there is no significant deformation in the meshwork topology and also there is negligible particle density in the vicinity of the meshwork. The spatial distribution of pressure in Fig. 5(b) has also not significantly changed and it only fluctuates around zero. The reason for this observation is that, in this case, the particles do not need to deform the meshwork; only persistent motion enables the active particles to permeate. Similarly, for = 0.8, meshwork deformation is not required for permeation, resulting in no significant pressure on the meshwork, as shown in Fig. S3(a) and (b) of the ESI.† In contrast, for = 1.33, the spatial distribution of meshwork beads in Fig. 5(c) shows profound deformation of the meshwork at Pe = 80 and there is a significant density of active particles near the meshwork. We observe more population of pressure at high value in the spatial distribution of pressure on the beads in Fig. 5(d). There is a noticeable increase in pressure at Pe = 80. During the discussion of permeability, it is noted that there is no significant permeation of particles at this size ratio for Pe = 80. As a result, active particles exert pressure to pass through the meshwork. Because particles have high motility, they exert a high pressure and deform the meshwork to a significant extent.27,29
 |
| | Fig. 5 Spatial distribution of the meshwork beads at Pe = 80 and K = 50: (a) positions, (b) exerted pressure for = 1.0; and (c) positions, (d) exerted pressure for = 1.33. | |
To analyze the stress developed on the meshwork and the permeability of active particles, we compute the averaged pressure on the meshwork beads, 〈Πmesh-bead〉, which is defined as:  , with Nb representing the number of beads in the meshwork. For better statistics, we average this quantity over time and across different trajectories, which is defined as:
  . In Fig. 6(a), we plot the change in the average pressure on meshwork beads with Pe for different sizes, = 1.0 and = 1.33. The findings show that the pressure exerted on the network at = 1.33 is significantly larger compared to the case of = 1.00, consistent with the observation in Fig. 5. Another important observation is the non-monotonic change in pressure with activity. For = 1.33,
  increases up to Pe = 80, but beyond this value, there is a sudden drop. A similar non-monotonic behavior is observed for = 1.00, where the pressure increases up to Pe = 10 and then decreases and saturates. This non-monotonic change in
  with Pe is related to the permeation of active particles. Initially, as long as the particles do not permeate, the pressure on the meshwork continues to rise. However, once the exerted pressure is sufficient to deform the meshwork and allow particle permeation, the particles begin to permeate, and the stress on the meshwork starts to decrease. These observations are consistent with the findings in Fig. 3(b), (c), (e), and (f). In the process of permeation, the activity of particles is an important factor. To understand this phenomenon, the contribution of pressure from activity is a key aspect. We define a quantity χ, which represents the contribution of pressure from activity, as:
 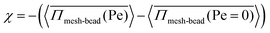 , where
  represents the averaged pressure on the meshwork beads when 50% of the colloidal particles are passive and the other 50% are active. In contrast,
  represents the averaged pressure on the meshwork beads when all the particles are passive. This residual pressure on the meshwork beads at Pe = 0 has two contributions: one from Brownian dynamics and the other from the pressure exerted by the meshwork beads on one another, governed by their mutual interactions. A particle undergoing any type of random motion exerts a pressure Π = −tr(I)/3 = ndγD, where I represents the stress tensor and nd is the number density of the particles. This applies to Brownian particles as well, where D = kBT/γ, leading to the familiar ideal gas Brownian osmotic pressure ΠBrownian = npdkBT, where npd is the number density of passive particles. For free active Brownian particles (ABPs), using the convective diffusivity of dilute active matter
  , one obtains the analogous “ideal gas” swim pressure:
  , where v is the propulsion velocity (v = Fa/γ) and nad is the number density of active particles. Here, we have Πswim ∝ v2 and
  , so the contribution of pressure from activity, χ, on the meshwork beads should be proportional to Pe2. A study by Brady et al. found that this scaling is valid only in the dilute limit, with a prominent deviation as the density increases.56 In Fig. 6(b), we plot the change in χ with Pe for = 1.0 and = 1.33. In both cases we observe that before χ drops it scales as Pe2 (red solid line). In the case of = 1.33 at high Pe = 80 there is a small deviation from Pe2 (black dotted line), which could be due to the permeation of a small number of particles through the meshwork, which is evident in Fig. 3(c), (f) and Movie S4 of the ESI.†
 |
| | Fig. 6 Plots showing the change in (a)  and (b) χ with Pe for different and K = 50. Here, the red solid line represents the Pe2 fitting line, excluding the data point at Pe = 80, while the black dotted line represents the Pe2 fitting line including the data point at Pe = 80. and (b) χ with Pe for different and K = 50. Here, the red solid line represents the Pe2 fitting line, excluding the data point at Pe = 80, while the black dotted line represents the Pe2 fitting line including the data point at Pe = 80. | |
3.2 Case 2: = 1.33 and different values of K
In addition to , meshwork stiffness is another important parameter for selective permeation.7,27,29 In its native form, a biopolymer like mucin is often in a relatively unstructured state and typically exhibits low stiffness (on the order of tens of pascals), as its molecular chains can move freely and slide past one another. In contrast, when in a matrix form, crosslinking among different polymer segments enhances the matrix stiffness to the scale of kilopascals and beyond. As discussed, the importance of crosslinking in the extracellular matrix (ECM), mucus, or any biological matrix cannot be overstated. In our model, based on the spring-bead model, we adjust the effectiveness of crosslinking by varying the value of the harmonic spring constant (K), between two neighboring beads. In Fig. 7, we plot the time evolution of permeability in both linear-linear and log-linear scales for different values of K and Pe with = 1.33. The linear-linear plot for K = 10 in Fig. 7(a) shows no permeation up to Pe = 20. However, as Pe increases further to 40, there is a sudden increase in permeability. Beyond this value of Pe, permeability begins at an earlier time and eventually saturates at a higher value. Increasing K to 30, as shown in Fig. 7(b), results in significant permeation only after Pe = 60. For K = 50, as seen in Fig. 7(c), prominent permeation occurs beyond Pe = 80. These findings suggest that, similar to the increase in , the threshold value for permeation rises with increasing K. To investigate the early-time behavior of permeation for different values of K and Pe, we plot the time evolution of permeability on a log-linear scale. In Fig. 7(d), we observe a notable difference in the delay time between Pe = 40 and Pe = 60, with the delay time decreasing as activity increases. A similar trend is seen for higher values of K, such as K = 30 (Fig. 7(e)) and K = 50 (Fig. 7(f)), where a substantial difference in delay time persists for the same Pe values. From these findings, we conclude that as K increases, the permeation of active particles becomes more difficult, similar to the effect of increasing , which results in a higher threshold value and longer delay time. This is because, with increasing K, the stiffness of the meshwork increases, making it harder to deform the meshwork and, consequently, more difficult for active particles to permeate.
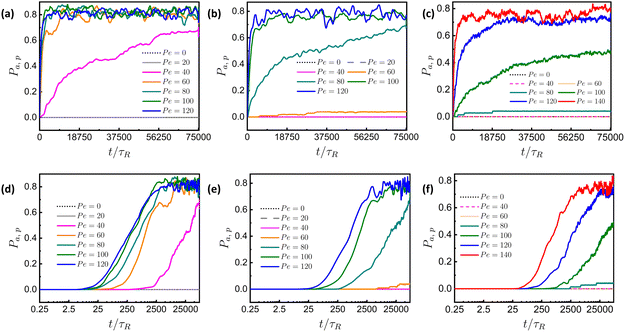 |
| | Fig. 7 Linear-linear plots for time evolution of Pa,p of particles at different Pe, with = 1.33 and (a) K = 10, (b) K = 30, (c) K = 50; and log-linear plots for time evolution of Pa,p of particles at different Pe, with = 1.33 and (d) K = 10, (e) K = 30 and (f) K = 50. Here, τR = 10τ is the persistence time of ABP (discussed in Section S1 of the ESI†). | |
In Fig. 8(a), we plot the change in average permeability with Pe for a fixed value of = 1.33. The change is sigmoidal, with threshold values increasing as the spring constant increases. The effect of the spring constant is also evident from Movie S6 (ESI†), where effective permeation occurs at Pe = 80 and K = 20, but it is not observed for K = 50 in Movie S4 of the ESI.† This occurs because stretching the mesh to allow permeation becomes increasingly difficult as the spring constant (K) increases. A similar result is observed in Fig. 8(b), where we plot the average pressure with Pe for the same size ratio, showing that the threshold value for permeation increases with K. Another interesting observation is that with increasing constant K, the magnitude of the plot's intercept increases. This is attributed to the residual pressure on the meshwork at Pe = 0. This pressure has two contributions: one from Brownian dynamics and the other from the pressure exerted by the meshwork beads on one another, governed by their mutual interactions. In Fig. 8(c) we plot the quantity χ, which represents the pressure contribution due to activity, as a function of Pe. We observe that below the threshold Pe, χ is independent of K and scales as Pe2. From this observation, we conclude that the pressure consists of independent contributions from Brownian dynamics, interactions, and collisions of active particles, expressed as 〈Πmesh-bead〉 = ΠBrownian + Πinteraction + Πactive.
 |
| | Fig. 8 Plots showing change in (a)  , (b) , (b)  , and (c) χ with Pe at = 1.33 and for different values of K. , and (c) χ with Pe at = 1.33 and for different values of K. | |
In the previous discussions, we observe that before permeation, active particles exert pressure on the meshwork. To understand this, we plot the time evolution of 〈Πmesh-bead〉 in log-linear scale for different K, with K = 30 (Fig. 9(a)) and K = 50 (Fig. 9(b)). For Pe = 0, the time evolution of 〈Πmesh-bead〉 remains constant. As Pe increases, 〈Πmesh-bead〉 initially rises over a short period and then saturation in the long term. The saturation occurs at a higher value of 〈Πmesh-bead〉 as Pe increases up to Pe = 40 for K = 30 and Pe = 80 for K = 50. However, as Pe further increases to Pe = 80 for K = 30 and Pe = 120 for K = 50, 〈Πmesh-bead〉 initially increases over a short time but then suddenly starts to decrease. From these results, we conclude that before reaching the threshold activity, the pressure change increases monotonically, followed by saturation at longer times. The value in the saturation region rises with increasing activity. However, beyond the threshold, the change in pressure over time becomes non-monotonic. Initially, there is an increase in pressure, corresponding to the accumulation of active particles near the meshwork, which exerts pressure on the network. After a certain point, when the deformation in the network is sufficient for active particles to escape, the pressure drops. A similar effect of permeation on pressure, both before and after the threshold Pe, is evident as a non-monotonic change in χ with activity in Fig. 8(c). The time at which the non-monotonic behavior begins in the time evolution of pressure is approximately the same as the delay time for permeation, as shown in Fig. 7(e) and (f).
 |
| | Fig. 9 Plots showing the time evolution of 〈Πmesh-bead〉 in log-linear scale for (a) K = 30 and (b) K = 50 at = 1.33. | |
4 Conclusion
In this work, our goal is to examine how a mixture of active and passive particles of the same size de-mixes via selective permeation through a two-dimensional elastic meshwork, and how this permeation affects the meshwork's topology. Selective permeation based on activity from a large ensemble of active species is driven by the interplay of particle motility, relative meshwork mesh size, and spring constant. We observe that as and the spring constant increase, the threshold value of Pe also increases. Consequently, particles with lower activity than the threshold do not permeate, while those with higher activity successfully pass through. Before reaching the threshold value, the pressure on the meshwork beads grows continuously, with the activity dependent part of the pressure, χ, scaling as Pe2. In the case of = 1.33 at high Pe = 80 there is a small deviation from Pe2, which could be due to the permeation of a small number of particles through the meshwork, which is clearly evident in Fig. 6(c). Particles permeate when the exerted pressure deforms the mesh sufficiently to allow passage. This selective permeation, based on motility and membrane properties, has potential applications in material science and biomedical fields,39,41 enabling the design of systems to selectively transport molecules or drugs for targeted material functions.20,34 More importantly, the current work opens up new routes to separate active-passive mixtures through selective permeation.
Data availability
Data can be made available on request to the corresponding author.
Conflicts of interest
There are no conflicts to declare.
Acknowledgements
R. S. Y. thanks IIT Bombay for the fellowship. R. C. acknowledges SERB, India, Project No. MTR/2020/000230 under the MATRICS scheme and IRCC-IIT Bombay (Project No. RD/0518-IRCCAW0-001) for funding. R. S. Y. acknowledges Ligesh Theeyancheri for helpful discussions and Pooja Nanavare for assisting with the rendering of the figures. R. S. Y. and R. C. thank Subhasish Chaki for reading the manuscript.
References
- O. Lieleg and K. Ribbeck, Trends Cell Biol., 2011, 21, 543 CrossRef CAS PubMed
 .
.
- R. A. Cone, Adv. Drug Delivery Rev., 2009, 61, 75 CrossRef CAS PubMed .
- J. Zamecnik, L. Vargova, A. Homola, R. Kodet and E. Sykova, Neuropathol. Appl. Neurobiol., 2004, 30, 338 CrossRef CAS PubMed .
- G. Alexandrakis, E. B. Brown, R. T. Tong, T. D. McKee, R. B. Campbell, Y. Boucher and R. K. Jain, Nat. Med., 2004, 10, 203 CrossRef CAS PubMed .
- P. A. Netti, D. A. Berk, M. A. Swartz, A. J. Grodzinsky and R. K. Jain, Cancer Res., 2000, 60, 2497 CAS .
- A. G. Bajpayee, C. R. Wong, M. G. Bawendi, E. H. Frank and A. J. Grodzinsky, Biomaterials, 2014, 35, 538 CrossRef CAS PubMed .
- A. D. Theocharis, S. S. Skandalis, C. Gialeli and N. K. Karamanos, Adv. Drug Delivery Rev., 2016, 97, 4 CrossRef CAS PubMed .
- M. J. Ernsting, M. Murakami, A. Roy and S.-D. Li, J. Controlled Release, 2013, 172, 782 CrossRef CAS PubMed .
- A. R. Jackson and W. Y. Gu, Curr. Rheumatol. Rev., 2009, 5, 40 CrossRef CAS PubMed .
- E. Irani, Z. Mokhtari and A. Zippelius, Phys. Rev. Lett., 2022, 128, 144501 CrossRef CAS PubMed .
- B. S. Schuster, J. S. Suk, G. F. Woodworth and J. Hanes, Biomaterials, 2013, 34, 3439 CrossRef CAS PubMed .
- C. P. Goodrich, M. P. Brenner and K. Ribbeck, Nat. Commun., 2018, 9, 4348 CrossRef PubMed .
- R. J. Tannenbaum, N. Cislo, E. Ruzicka, P. A. Dean, Z. P. Smith, B. C. Benicewicz and S. K. Kumar, Macromolecules, 2023, 56, 3954 CrossRef CAS .
- J. Witten and K. Ribbeck, Nanoscale, 2017, 9, 8080 RSC .
- T. Bickel and R. Bruinsma, Biophys. J., 2002, 83, 3079 CrossRef CAS PubMed .
- R. Chakrabarti, A. Debnath and K. L. Sebastian, Phys. A, 2014, 404, 65 CrossRef .
- W. K. Kim, M. Kanduč, R. Roa and J. Dzubiella, Phys. Rev. Lett., 2019, 122, 108001 CrossRef CAS PubMed .
- B. Amsden, Macromolecules, 1998, 31, 8382 CrossRef CAS .
- A. Daddi-Moussa-Ider, B. Liebchen, A. M. Menzel and H. Löwen, New J. Phys., 2019, 21, 083014 CrossRef CAS .
- B. J. Toley and N. S. Forbes, Integr. Biol., 2012, 4, 165 CrossRef CAS PubMed .
- F. von Rüling, L. Bakhchova, U. Steinmann and A. Eremin, Adv. Phys. Res., 2024, 3, 2300047 CrossRef .
- A. G. Prabhune, A. S. Garca-Gordillo, I. S. Aranson, T. R. Powers and N. Figueroa-Morales, PRX Life, 2024, 2, 033004 CrossRef .
- L. Theeyancheri, R. Sahoo, P. Kumar and R. Chakrabarti, ACS Omega, 2022, 7, 33637 CrossRef CAS PubMed .
- L. Theeyancheri, S. Chaki, T. Bhattacharjee and R. Chakrabarti, Phys. Rev. E, 2022, 106, 014504 CrossRef CAS PubMed .
- T. Bhattacharjee and S. S. Datta, Nat. Commun., 2019, 10, 2075 CrossRef PubMed .
- P. Kumar, L. Theeyancheri and R. Chakrabarti, Soft Matter, 2022, 18, 2663 RSC .
- Y. Kim, S. Joo, W. K. Kim and J.-H. Jeon, Macromolecules, 2022, 55, 7136 CrossRef CAS .
- R. S. Yadav, C. Das and R. Chakrabarti, Soft Matter, 2023, 19, 689 RSC .
- P. Kumar and R. Chakrabarti, Phys. Chem. Chem. Phys., 2023, 25, 1937 RSC .
- K. Goswami, A. G. Cherstvy, A. Godec and R. Metzler, Phys. Rev. E, 2024, 110, 044609 CrossRef CAS PubMed .
- J. Garamella, K. Regan, G. Aguirre, R. J. McGorty and R. M. Robertson-Anderson, Soft Matter, 2020, 16, 6344 RSC .
- L. Theeyancheri, S. Chaki, T. Bhattacharjee and R. Chakrabarti, J. Chem. Phys., 2023, 159, 014902 CrossRef CAS PubMed .
- Y. Du, H. Jiang and Z. Hou, Soft Matter, 2019, 15, 2020 RSC .
- C. Bechinger, R. Di Leonardo, H. Löwen, C. Reichhardt, G. Volpe and G. Volpe, Rev. Mod. Phys., 2016, 88, 045006 CrossRef .
- F. Matthäus, M. Jagodič and J. Dobnikar, Biophys. J., 2009, 97, 946 CrossRef PubMed .
- J. Palacci, C. Cottin-Bizonne, C. Ybert and L. Bocquet, Phys. Rev. Lett., 2010, 105, 088304 CrossRef PubMed .
- K. Chen, B. Wang and S. Granick, Nat. Mater., 2015, 14, 589 CrossRef CAS PubMed .
- M. T.-Q. Duong, Y. Qin, S.-H. You and J.-J. Min, Exp. Mol. Med., 2019, 51, 1 CrossRef CAS PubMed .
- B. S. Cho, T. G. Schuster, X. Zhu, D. Chang, G. D. Smith and S. Takayama, Anal. Chem., 2003, 75, 1671 CrossRef CAS PubMed .
-
Y. Chung, X. Zhu, W. Gu, G. D. Smith and S. Takayama, Microfluidic Techniques: Reviews and Protocols, 2006, vol. 227 Search PubMed .
- H.-Y. Huang, T.-L. Wu, H.-R. Huang, C.-J. Li, H.-T. Fu, Y.-K. Soong, M.-Y. Lee and D.-J. Yao, J. Lab. Autom., 2014, 19, 91 CrossRef CAS PubMed .
- V. R. Misko, L. Baraban, D. Makarov, T. Huang, P. Gelin, I. Mateizel, K. Wouters, N. De Munck, F. Nori and W. De Malsche, Soft Matter, 2023, 19, 8635 RSC .
- B. Nath, L. Caprini, C. Maggi, A. Zizzari, V. Arima, I. Viola, R. Di Leonardo and A. Puglisi, Lab Chip, 2023, 23, 773 RSC .
- R. Nosrati, M. Vollmer, L. Eamer, M. C. San Gabriel, K. Zeidan, A. Zini and D. Sinton, Lab Chip, 2014, 14, 1142 RSC .
- A. Guidobaldi, Y. Jeyaram, I. Berdakin, V. V. Moshchalkov, C. A. Condat, V. I. Marconi, L. Giojalas and A. V. Silhanek, Phys. Rev. E:Stat., Nonlinear, Soft Matter Phys., 2014, 89, 032720 CrossRef CAS PubMed .
- J. Stenhammar, R. Wittkowski, D. Marenduzzo and M. E. Cates, Phys. Rev. Lett., 2015, 114, 018301 CrossRef CAS PubMed .
- P. Kushwaha, V. Semwal, S. Maity, S. Mishra and V. Chikkadi, Phys. Rev. E, 2023, 108, 034603 CrossRef CAS PubMed .
- P. Dolai, A. Simha and S. Mishra, Soft Matter, 2018, 14, 6137 RSC .
- S. Gokhale, J. Li, A. Solon, J. Gore and N. Fakhri, Phys. Rev. E, 2022, 105, 054605 CrossRef CAS PubMed .
- T. Zhou and J. F. Brady, Proc. Natl. Acad. Sci. U. S. A., 2024, 121, e2407424121 CrossRef CAS PubMed .
- R. R. Arvizo, O. R. Miranda, M. A. Thompson, C. M. Pabelick, R. Bhattacharya, J. D. Robertson, V. M. Rotello, Y. Prakash and P. Mukherjee, Nano Lett., 2010, 10, 2543 CrossRef CAS PubMed .
- J. D. Weeks, D. Chandler and H. C. Andersen, J. Chem. Phys., 1971, 54, 5237 CrossRef CAS .
- S. Plimpton, J. Comput. Phys., 1995, 117, 1 CrossRef CAS .
- A. P. Thompson, S. J. Plimpton and W. Mattson, J. Chem. Phys., 2009, 131, 154107 CrossRef PubMed .
- R. G. Winkler, A. Wysocki and G. Gompper, Soft Matter, 2015, 11, 6680 RSC .
- S. C. Takatori, W. Yan and J. F. Brady, Phys. Rev. Lett., 2014, 113, 028103 CrossRef CAS PubMed .
|
| This journal is © The Royal Society of Chemistry 2025 |
Click here to see how this site uses Cookies. View our privacy policy here. 
 and
Rajarshi
Chakrabarti
and
Rajarshi
Chakrabarti
 considering that the particles are contained in a box of volume LX × LY × LZ at the beginning of simulation, where, LX = 60, LY = 60 and LZ = 40 in the units of σ. Due to this arrangement of the meshwork and particles, the free volume of the box is nine times larger than the volume occupied by the particles, ensuring a negligibly small probability of particles returning through the meshwork. Furthermore, to reduce the effect of periodic boundary conditions (PBC) on the permeability of particles through the meshwork, we do not impose any PBC in the Z direction and implement repulsive wall planes parallel to the mesh in the XY-plane at the boundaries Z = 0 and Z = 400 of the simulation box. The potential of these walls for the particles is defined as:
 . In what follows, we measure the length in units of σ and the energy in units of the thermal energy kBT, where kB is the Boltzmann constant and T is the absolute temperature. Details of the model parameters are given in Table S1 of the ESI.†


 is negligibly small compared to the drag force
  , where γ is the friction coefficient. To ensure that the system is practically overdamped, we have taken a very high value of
  . Here, m is the mass of the particles and the unit of time (τ) is
  . V(r) is the total interaction potential that gives rise to the conservative forces in this model and is described as V = VWCA + VHarmonic + VBend. The thermal force, fi(t) is modeled as Gaussian white noise with zero mean and variance 〈fi(t′)fj(t′′)〉 = 6γkBTδijδ(t′ − t′′). The activity is modeled as an active Brownian particle (ABP) with propulsive force Fae (Fig. 1(c)), where Fa represents the magnitude of the active force and can be expressed in terms of the Péclet number as
 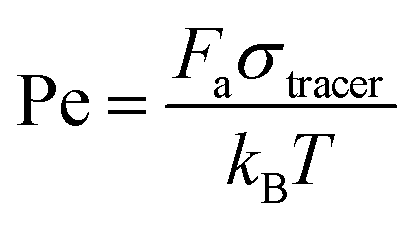 with the orientation specified by the unit vector e that changes according to eqn (6). Here, η(t) is the stochastic vector, which follows the Gaussian distribution with 〈η(t)〉 = 0 and the time correlation is given by 〈ηα(t′)ηβ(t′′)〉 = 2DRδαβδ(t′ − t′′), where
 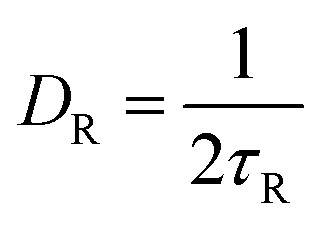 and τR is the persistence time (see Fig. S1 and Section S1 of ESI†). The unit vector e can be expressed in the form of spherical polar coordinates (sin

 , where, na,p represents the number of permeated particles, and Na,p indicates the total number of active and passive particles, where a stands for active and “p” stands for passive. Particles are considered permeated when they pass through the meshwork into the free space of the box, toward the upper end of the Z-axis. The tracer to mesh size ratio, defined as
  is an important parameter. We consider two cases, viz.Case 1: where the spring constant is fixed (K = 50) and
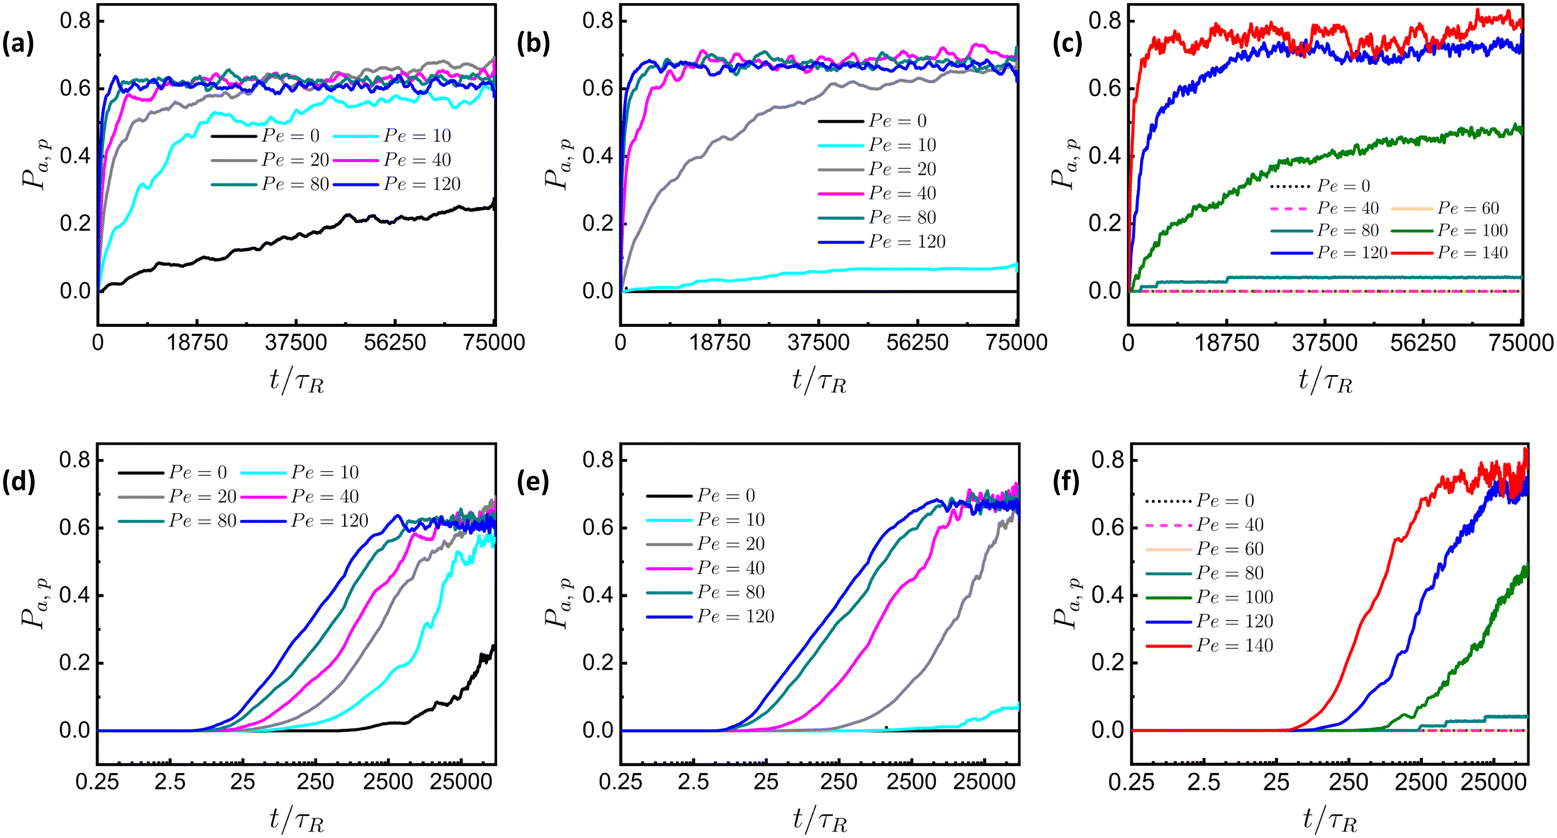
 , where t1 is the time beyond which permeability saturates, and tmax is the end of the run time followed by ensemble-averaged permeability,
  , where Ntrj represents the number of independent trajectories. We plot
  against Pe, as shown in Fig. 4(a). We notice here that for a relatively smaller size of tracer, there is permeation of particles even at Pe = 0, and the system quickly saturates to a steady state as the Pe increases. In the case of a comparable and bigger size, there is no permeation for passive particles. In the former case, there is small permeability at Pe = 10, but there is a sudden increase and saturation at a high value at Pe = 20 and onward, which is supported by Movie S3 in the ESI.† In the latter case, there is no significant permeation until Pe = 80, as shown in Movie S4 of the ESI,† and at Pe = 100 there is a sudden increase in permeability followed by saturation at higher Pe, which is prominently evident from Movie S5 of the ESI† with Pe = 120. These results suggest that there is a threshold value of Pe for permeation, which increases with the
 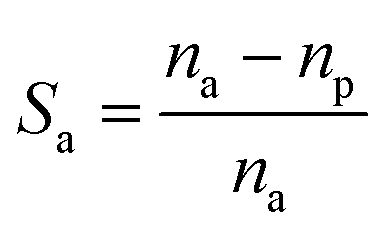 . For better statistics, we calculate time-averaged selectivity
  followed by ensemble-averaged selectivity
  . We plot average
  against Pe for
  , indicating no permeation of passive particles.
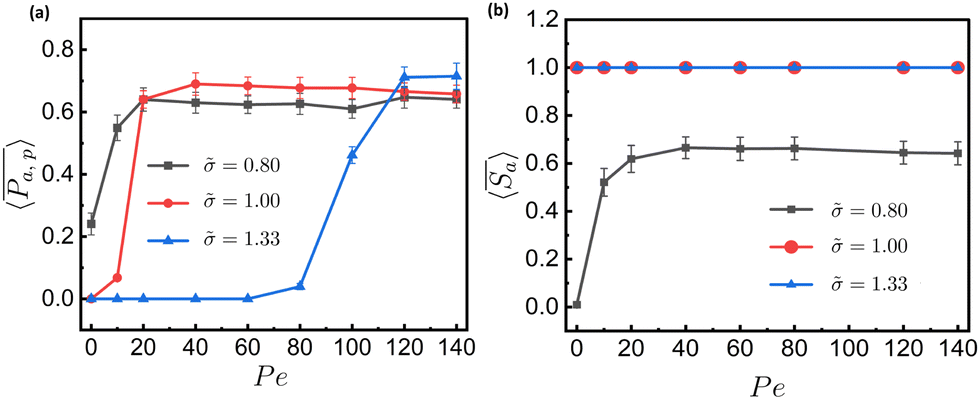
 and (b)
  with Pe for different
 , with Nb representing the number of beads in the meshwork. For better statistics, we average this quantity over time and across different trajectories, which is defined as:
  . In Fig. 6(a), we plot the change in the average pressure on meshwork beads with Pe for different sizes,
  increases up to Pe = 80, but beyond this value, there is a sudden drop. A similar non-monotonic behavior is observed for
  with Pe is related to the permeation of active particles. Initially, as long as the particles do not permeate, the pressure on the meshwork continues to rise. However, once the exerted pressure is sufficient to deform the meshwork and allow particle permeation, the particles begin to permeate, and the stress on the meshwork starts to decrease. These observations are consistent with the findings in Fig. 3(b), (c), (e), and (f). In the process of permeation, the activity of particles is an important factor. To understand this phenomenon, the contribution of pressure from activity is a key aspect. We define a quantity χ, which represents the contribution of pressure from activity, as:
  , where
  represents the averaged pressure on the meshwork beads when 50% of the colloidal particles are passive and the other 50% are active. In contrast,
  represents the averaged pressure on the meshwork beads when all the particles are passive. This residual pressure on the meshwork beads at Pe = 0 has two contributions: one from Brownian dynamics and the other from the pressure exerted by the meshwork beads on one another, governed by their mutual interactions. A particle undergoing any type of random motion exerts a pressure Π = −tr(I)/3 = ndγD, where I represents the stress tensor and nd is the number density of the particles. This applies to Brownian particles as well, where D = kBT/γ, leading to the familiar ideal gas Brownian osmotic pressure ΠBrownian = npdkBT, where npd is the number density of passive particles. For free active Brownian particles (ABPs), using the convective diffusivity of dilute active matter
  , one obtains the analogous “ideal gas” swim pressure:
  , where v is the propulsion velocity (v = Fa/γ) and nad is the number density of active particles. Here, we have Πswim ∝ v2 and
  , so the contribution of pressure from activity, χ, on the meshwork beads should be proportional to Pe2. A study by Brady et al. found that this scaling is valid only in the dilute limit, with a prominent deviation as the density increases.56 In Fig. 6(b), we plot the change in χ with Pe for
 and (b) χ with Pe for different

 , (b)
, (b)  , and (c) χ with Pe at