 Open Access Article
Environmental and life cycle assessment of lithium carbonate production from Chilean Atacama brines†
Zijing
He
a,
Anna
Korre
 *ab,
Geoff
Kelsall
c,
Zhenggang
Nie
 a and
Melanie
Colet Lagrille
 d
d
aDepartment of Earth Science and Engineering, Imperial College London, Exhibition Road, SW7 2AZ, London, UK. E-mail: zijing.he21@imperial.ac.uk; a.korre@imperial.ac.uk
bEnergy Futures Lab, Imperial College London, Exhibition Road, SW7 2AZ, London, UK
cDepartment of Chemical Engineering, Imperial College London, Exhibition Road, SW7 2AZ, London, UK
dDepartment of Chemical Engineering, University of Chile, Av. Beauchef 851, 8370458 Santiago, Región Metropolitana, Chile
First published on 14th November 2024
Abstract
The exponentially growing market for lithium-ion batteries (LIBs) is driving the development of more environmentally benign processes for producing lithium carbonate, a key precursor. Extracting lithium(I) from brine is a cost-effective method, particularly in the Lithium Triangle in South America, including the Atacama Desert in Chile. Life cycle assessment (LCA) was used to assess the environmental impacts of lithium(I) production by establishing a comprehensive life cycle inventory (LCI) with data from modelling, literature, technical reports and the Ecoinvent database. Information about evaporation rates from Atacama salars, the performance of the northern Chile electrical grid fuel mix and present waste management processes were analysed to establish the water balance, water footprint (WF), water scarcity footprint (WSF) and to estimate in Aspen Plus and Sphera the environmental performance of the battery-grade lithium carbonate production process. The results predicted significant environmental impacts associated with production of input chemicals such as sodium hydroxide (NaOH) and sodium carbonate (Na2CO3), as well as with energy conversion from the carbon intensive electrical supply in northern Chile. The waste dumps and surface impoundments required for the production process did not result in significant leachate infiltration, although considerable land areas are occupied. The modelling and analysis results highlighted the importance of accurate brine evaporation rates on the process water balance estimation and on the conventional manufacturing process emissions; insufficient evaporation rates increased the water footprint of chemical production processes. The water resource stress in the arid Atacama region was evident from predicted water balances, WFs and WSFs, emphasising the necessity to innovate less time-consuming and water-conserving processes to increase sustainability.
Sustainability spotlightThe global necessity to decarbonise energy storage and conversion systems is causing rapidly growing demand for lithium-ion batteries, so requiring sustainable processes for lithium carbonate (Li2CO3) production. We established a comprehensive life cycle inventory to evaluate environmental impacts of its production by evaporation of Atacama brines, analysing effects of brine composition, water supply, evaporation rates, waste management and chemical processes deployed. Results highlight significant environmental and water resource impacts, emphasising the urgency of transitioning to water-saving and more energy efficient processes in arid regions and the importance of site-specific information for accurate emissions and environmental impacts assessment. Identifying and evaluating the impacts of Li2CO3 production is essential for developing materials utilisation strategies aligned with United Nations sustainable development goals (SDG 6, 7, 9, 13 and 15). |
1 Introduction
Demand for lithium(I) compounds is growing rapidly, driven by the global necessity to decarbonise chemical-to-electrical energy conversion with renewable energy systems, addressing their intermittency and balancing electrical power supply and demand by energy storage, inter alia in lithium batteries. Fig. 1 shows the global lithium(I) consumption and the proportion of its use in batteries, with global lithium(I) consumption reaching 180 kt a−1 in 2023.1 Although affected by the global COVID-19 pandemic, demand decreased in the first half year of 2020, but the lithium-ion battery market recovered its strong growth in the second half year, as the global economy started to recover. Between 2020 and 2022, lithium(I) mining output expanded by ca. 80%, despite which market demand for lithium(I) remains tight, resulting in the lithium(I) market price increasing more than five-fold over this period.2 However, annual average U.S. lithium carbonate prices in 2023 decreased by 32% from those in 2022, mainly due to policy issues, especially relations with China, and slower growth in demand.1,3 The instability of the lithium(I) market has emphasised the significance of cost-effective, dependable and robust supply chains, particularly for countries that prioritise affordability and those undergoing rapid energy transitions. Lithium(I) can be extracted primarily from hard-rock ores, such as spodumene, petalite and lepidolite, and brines. Australia is the world's leading producer of lithium(I), relying primarily on spodumene, whereas Chile is the second largest producer country, relying on LiI-rich brine resources found in high altitude desert salars.4,5 Interestingly, lithium(I)-containing brines are concentrated mostly in the so-called Lithium Triangle of South America.6 Extracting lithium(I) from hard rock ores requires various processes, which are complex, energy-intensive and may include several chemical transformations. Due to lower production costs, brine is a more common source of lithium(I), which in principle may be extracted from salt lake brines, geothermal brines and even seawater. However, lithium(I) extraction from geothermal brine has not been commercialised on a large scale, being only at the pre-commercial demonstration stage.2 As yet, there are no cost-effective processes to extract lithium(I) from seawater, typically at concentrations of 0.1–0.2 ppm,7,8 whereas lithium(I) concentrations of 200–700 ppm in most salt lake brines are considered as commercially attractive.9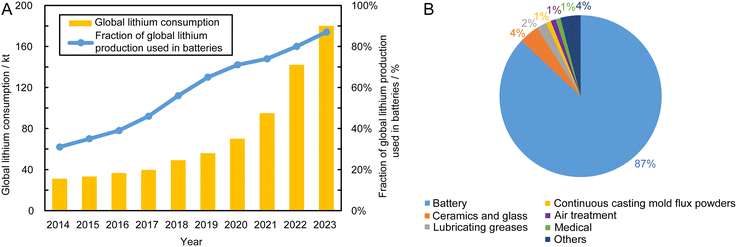 | ||
| Fig. 1 (A) Global lithium(I) consumption and proportion used in batteries over the last decade. (B) Relative consumptions of lithium(I) in different applications in 2023.1 | ||
Amongst industrial effluents, the formation water produced during oil and gas extraction activities can be considered a potential lithium(I) source, although such brines are typically regarded as waste and are reinjected into the subsurface for disposal.10 In these brines, lithium(I) concentrations generally range between 1 and 40 mg dm−3 and depend on the geology of the field.11 While lithium(I) concentrations in seawater are typically 0.1–0.2 mg dm−3, as mentioned above, brines from reverse osmosis processes used to desalinate seawater contain LiI concentrations up to 4 mg dm− 3, so are more promising potential LiI sources compared to seawater.12 Industrial wastewaters, e.g. from cobalt or nickel recovery processes of lithium-ion battery recycling, can contain up to 3 g LiI dm−3.13–15 Recovery of lithium(I) from such resources could enable the industry to develop a circular economy and a strategy to enhance the sustainability of the lithium(I) value chain. Nevertheless, high specific energy consumptions, high costs, LiI selectivities against other cations present and slow process kinetics remain significant challenges, requiring further R&D to increase and optimise LiI recoveries from industrial effluents.
Lithium(I) concentrations in the South American Atacama desert brines reach 1500 ppm.16 Salt lake brines are thought to contain over 70% of exploitable lithium(I) resources globally,1 and about 85% of lithium(I) products are obtained from brines.17,18 However, salt lake brines have extremely complex compositions, with Na+ constituting the greatest proportion of cations, including K+, Mg2+ and Ca2+, with Cl−, CO32−, SO42− and borate anions.19 This causes a significant challenge for purification and selective lithium(I) extraction by various processes being developed, in addition to evaporation technology, as described in the following section. Adsorption by ion exchange of Li+ ions from brine on e.g. manganese oxides, titanium dioxide, or alumina, can achieve selective recovery when saturated adsorbents in columns are washed with fresh water or acidic solutions, producing lithium(I)-containing solutions. After a specific LiI concentration is achieved, sodium carbonate is added to precipitate Li2CO3.17,20 Alternatively, liquid–liquid extraction by various organic solvents can be used to extract LiCl selectively.20,21 Such solvents include β-diketones, n-butanol, neutral organophosphorus compounds, and kerosene.21,22 Although these solvents can differentiate effectively LiCl from NaCl and KCl, separating LiCl from MgCl2 is more difficult. Increasing selectivity between Li+ and Mg2+ often necessitates significant adjustments to pH or brine composition, requiring large amounts of chemicals. Solar evaporative processes predominate in Chile, because of their low costs and as the sensitivity of the environment in the Chilean Atacama region, where water is extremely scarce, precludes processes that require large freshwater inputs to resolve pollution issues.
Common forms of lithium salts include lithium chloride (LiCl), lithium hydroxide (LiOH), and lithium carbonate (Li2CO3). LiCl can be sourced from lithium-rich hard rock resources, salt lake brines, geothermal brines, and from lithium battery recycling. Although LiCl is not directly useable in LIBs, it is a valuable intermediate for converting to LiOH or Li2CO3; the latter, a primary compound for LIB production, can be produced by reacting LiCl with Na2CO3.23 LiOH, another important compound for LIBs, can be synthesised from Li2CO3,24 with research ongoing to convert LiCl directly to LiOH.25
The rising demand of LIBs has triggered a growing interest and a focus in quantifying the environmental burdens with the raw material production throughout its life cycle. Ellingsen (2014)26 established a transparent LIBs LCI on primary data. With regard to lithium production in that research, it is a generalised black box model. Kallitsis et al. (2020)27 studied the LCA of LIBs production in China. This model was based on the model of Ellingsen (2014)26 and is also a black box model for lithium production. However, the actual environmental impacts of lithium production are expected to be influenced by the specifics of the region and particularly the specific lithium raw material. For example, given the energy intensity of the processes involved, the environmental impact of producing Li2CO3 or LiOH from spodumene should have a significantly greater environmental impact than if it were from brine. Although previous research28 suggested that the environmental impacts of Li2CO3 production was negligible compared to the total transportation impacts caused by an EV, possibly in another continent, they are certainly not negligible for the location where raw material production occurs. Moreover, the rapidly growing demand for lithium(I) raw material over the last decade warrants prudence. This work presents a detailed unit process level model that has been developed as a necessary tool to establish a more reliable and accurate environmental impact assessment of lithium(I) production processes.
Stamp (2012)28 established a detailed LCI model for Li2CO3 production by allocating the inputs of Li2CO3 production according to economics, which increased the accuracy of LCA analysis. However, the primary data used in the research appears to be outdated, and the water balance was neglected. The reliance on assumptions of evaporation may contribute to an inaccurate evaporation efficiency. Kelly (2021)29 reported a detailed LCI of Li2CO3 production from brine, but the electrical energy used in the analysis was assumed to be derived from the average Chilean electrical grid fuel mix, overlooking the fact that the national Chilean electrical grid contains different regional grids with distinct fuel mixes. The composition of the regional electrical grid varies according to different climatic characteristics across the nation. For instance, the northern region has abundant solar and wind energy resources. However, coal-fired power plants are also located predominantly in the central and northern regions of Chile.30 Chordia (2022)31 updated the life cycle environmental impacts of lithium from brine. Their LCI covered several publications, technical reports, and Ecoinvent database, but it only offers inputs and outputs without explaining sufficiently the calculation procedures used, nor do they account for the electrical grid mix. Furthermore, the freshwater resources were considered to be extracted from underground aquifers instead of lake-sourced fresh water which is reported in the literature. In contrast, the research results reported here accounts for the separation of minerals from brines and allows for a better understanding of water footprint throughout the process. Khakmardan et al. (2023)32 reported LCA results of different lithium(I) production processes from a global perspective and compared the environmental impacts of lithium production processes from different sources, including brine (Chile), spodumene (Australia and China), hectorite (Mexico), and zinnwaldite (Germany). Lithium(I) production from Chilean brine had the lowest GWP and minimal water consumption, due primarily to the less energy-intensive nature of the brine production process, which involves only pumping the brine to solar evaporation ponds and concentrating it progressively by solar radiation. In contrast, the production of lithium(I) from hard rock sources requires energy-intensive processes such as crushing, grinding, desliming, and flotation, as well as leaching processes and the use of soda ash, sodium hydroxide, and sulfuric acids, which significantly increase water consumption. However, the detailed LCI data of this study32 is not available for verification. Moreover, the lack of high-quality publicly available data has led to high uncertainty in the results reported.
WF and WSF are increasingly important considerations in the LCA analysis, especially when considering operations taking place in extremely arid regions. Despite the general awareness around this topic, there is still a conceptual debate as to whether including brine water in water footprint analysis in appropriate. Some literature considers only freshwater consumption and excludes brine water from the scope of water consumption due to the unsuitability of brines for direct agricultural or domestic use,29,31–33 while other literature considers it as the extraction of brine is not accounted for in the depletion of abiotic resources, where extraction of rock minerals extraction impacts are accounted for.34 In addition, the water scarcity characterisation factors of different regions can also influence the results. In arid regions, the regional water scarcity characterisation factors will be higher than those of other non-arid regions, thereby reflecting in the overall water scarcity impact.35 Therefore, it is crucial to specify details and relevant parameters in both WF and WSF analysis.
This study addresses the environmental impacts and water consumption of producing battery-grade Li2CO3 from lithium-containing brine. For this, detailed LCI modelling of the processes used to extract lithium from resources at Salar de Atacama, Chile, was conducted based on state-of-art literature, technical reports, and Ecoinvent database version 3.9.1.36 The electrical grid mix of the northern Chile region was modelled. Aspen Plus V11 (ref. 37) was used to simulate the production process of Li2CO3, including the recycling of input materials. Furthermore, evaporation modelling and water balance were conducted, followed by WF and WSF analysis. The LCA modelling was conducted within the Sphera software.38 Based on the ReCiPe 2016 v1.1 Midpoint characterisation method, 13 relevant environmental impacts were analysed and their primary contributions are discussed.
2 Methods
2.1 Life cycle assessment methodology
Following the ISO standard,39 a detailed LCI analysis and life cycle assessments were developed to analyse the production of Li2CO3.Calculations for material inputs and outputs were based on stoichiometries with the necessary adjustments required to account for the incompleteness of chemical reactions. Subsequently, the production process was simulated using Aspen Plus V11.37 In addition, the economic allocation approach was applied to Li2CO3 production of material and energy inputs according to ISO 14040,39 as there are by-products such as potassium sulphate that are also produced during evaporation their market prices collected from up to date company reports are used as economic allocation factors.41 Infrastructure construction was not considered in this study due to data unavailability, and considering that this is amortised over the economic materials production during the whole life of the facilities.
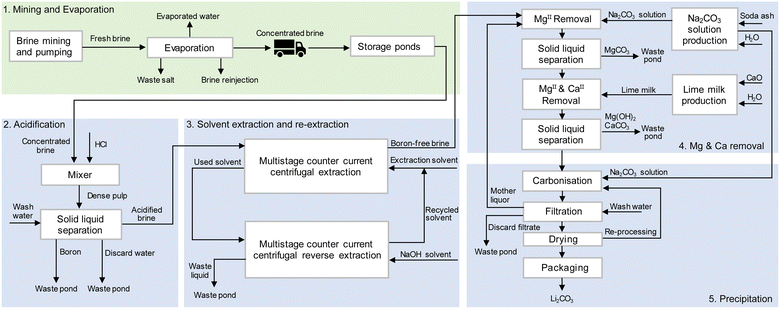
The process routes of Li2CO3 production from Atacama brine are given in Fig. 2. Firstly, underground brine is pumped from the subsurface at the Salar de Atacama core region and deposited into a series of large open-air evaporation ponds to evaporate by solar energy to preconcentrate lithium(I). The common order of precipitation includes halite (NaCl), sylvite (KCl), sylvinite (KCl and NaCl), magnesium salts and small quantities of other alkali salts.42 In order to account for the evaporation process impacts, simulation and calculations using estimation, theoretical calculations based on the Penman equation,43 and reported measurement data from an on-site meteorological station44 were used. Detailed explanations of evaporation modelling are provided in subsequent sections. In the Atacama Desert region, freshwater is reported to be extracted from 4 groundwater wells from beneath the foothills of the eastern mountains of the desert.41 After lithium chloride has reached the drying-up point, at a concentration of approximately 6000 ppm,17 the concentrated brine is trucked 230 km from desert core to a chemical plant, and is then processed to remove impurities. Treatments include acidification, solvent extraction, re-extraction, precipitation and drying. Borates are removed by acidification and solvent extraction. Re-extraction is used for recycling the organic solvent. MgII and CaII are removed by precipitation with soda ash and lime milk. Solid and liquid wastes are collected in surface impoundments. The final concentrated brine is treated with soda ash, thereby precipitating the Li2CO3 product. After washing, drying, and packaging, Li2CO3 product is obtained. Water is used primarily for cleaning pipes at the salar evaporation ponds and as wash water in the production process at the plant. Additionally, water is used for preparing solutions, e.g. of Na2CO3. Electrical energy is used mainly for operating machinery and equipment such as pumps, filters, reactors, dryers, as well as for powering various facilities within the production process, which relies primarily on energy supplied by the electrical grid and fossil fuels. For the electrical grid fuel mix, the SING (Sistema Interconectado del Norte Grande) electrical grid in northern Chile region was chosen for modelling.30,45
The process modelling was carried out for Li2CO3 production in the chemical plant using Aspen Plus V11.37 A heat exchange network was constructed together with the process. The modelling method was set as ELECNRTL. The life cycle inventory was optimised by iteration with Aspen modelling results.
2.2 Weather conditions and evaporation modelling
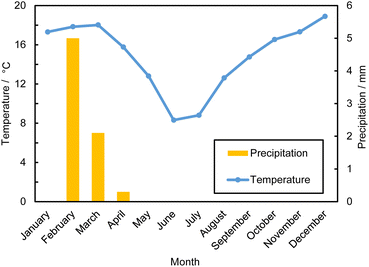 | ||
| Fig. 3 Monthly precipitation rates and temperatures at Atacama Desert in 2023.44,46 | ||
The weather in the Atacama Desert is extremely arid. The average annual precipitation is around 20 mm a−1, and the annual precipitation rate of the core region is less than 10 mm a−1.44 The precipitation has seasonal variations; the summer months from February to April have a relatively high level of precipitation which reached 2.1 mm in 2023, while there is no precipitation during May to December. The total annual precipitation rate at the Atacama core region is 7.4 mm a−1. As shown in Fig. 3, the average daily temperatures typically peak at approximately 18.9 °C and reach a minimum of around 8.32 °C in June. Diurnal temperature fluctuations match this seasonal variability, with maximum and minimum daily temperatures typically separated by around 14 °C.46 During October to March, winds blow predominantly from the west, and during autumn and winter, the wind direction is more variable. Morning wind speeds throughout the year are generally <2 m s−1, and wind speeds typically increase in the afternoon, reaching up to 15 m s−1.47 The low precipitation and high solar insolation make this place favourable for evaporation technology. Overall, producing lithium from brine at arid region is cost-effective.
Although solar evaporation is an inexpensive technology as solar energy is readily available in the Atacama Desert region, there are still some disadvantages. The evaporative precipitation steps are slow, normally taking between 8 and 12 months,41 and may take even 24 months from the pumping process.17,48 Besides, water evaporated from brine, cannot be recovered economically and may cause a series of hydrological and environmental issues.
The simplified versions of Penman's equations is:43
 | (1) |
 | (2) |
N ≈ 4∅![[thin space (1/6-em)]](https://www.rsc.org/images/entities/char_2009.gif) sin(0.53i − 1.65) + 12 sin(0.53i − 1.65) + 12 | (3) |
 | (4) |
 , RA can be calculated if direct data is not available.
The corrected evaporation rate, EO (mm d−1) is given by:54
| EO = KeKSEt | (5) |
2.3 Water
Brines, which are neither suitable for human use nor for irrigation, are designated as minerals rather than water resources.56 However, plants and animals that inhabit the Atacama region depend on this water resource, including protected species such as flamingos. Changes in flamingo populations can strongly reflect the extent of environmental damage. Andean and James' flamingos, which are the most threatened species in the Salar de Atacama, declined by approximately 12% and 10% in recent years.57 Studies have shown a strong correlation between lithium mining activities and local environmental degradation in Atacama.57,58 However, the direct impact of lithium(I) extraction on the environment and hydrology of the Atacama region has not been stated with certainty.
In this research, minerals and water in the brine are suggested to be considered separately to investigate the water balance of the system. Water contained in the brine is considered as water resource for water balance calculations.33 Calculating the water balance provides a clearer understanding of the amount of water that needs to be added and the amount of water flowing out of the system. Eqn (6) shows the mass balance of the inputs and outputs in a unit process.59
| Wei + Wii + Si = Wo + So + Ww + Wr | (6) |
2.4 Waste management
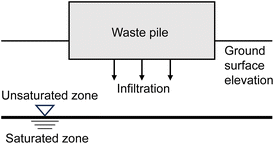
During the evaporation production process, a significant amount of salt waste and used brine are generated. The salt waste is typically accumulated near the evaporation ponds on open ground,41 while used brine is reinjected into the subsurface.61 However, to the best of our knowledge, there are no reported precise operational details or real case studies of reinjection of large volumes of spent brine. The question whether reinjecting brine may cause dilution of lithium resources, change the ecosystem, or disrupt the stratigraphic structure in Atacama still remains a controversial and unresolved issue.17 Considering the aforementioned conditions, detailed reinjection analysis is not within the scope of this research. Similarly, during the Li2CO3 production in the chemical plant, the process generates solid and liquid waste. The composition of liquid waste comprises water with boron(III), organics and some mother liquor containing impurities, while the solid wastes are magnesium carbonate pulp, magnesium hydroxide pulp and calcium carbonate pulp which are generated by precipitation processes. The industrial wastes are disposed in impoundments.41Traditional LCA studies typically neglect the influence of waste management units. However, studying the impact of waste management units is necessary in an arid location like the Atacama Desert where rare animals are present. This study aimed to investigate whether current waste management methods have an impact on the infiltration of groundwater and brine and assess the rational of current waste management practices. The waste management units considered include waste salt piles and surface impoundments.
The waste pile was modelled as a rectangular prism model with rainfall as input and leachate as output. The precipitate can be stored in the system, drained laterally, or evaporated back into the atmosphere, as there is little plant cover in the Atacama production region, the plant evapotranspiration was not considered. As the precipitation and temperature fluctuate with seasons, the quantity of water that is infiltrating was calculated using the principle of annual water balance, according to the following eqn (7):
| Ia = Pa − Ea − (FC − W) × Ta | (7) |
 | (8) |
 | (9) |
| Q = 0.21a0.1h0.9Ks0.74ρS | (10) |
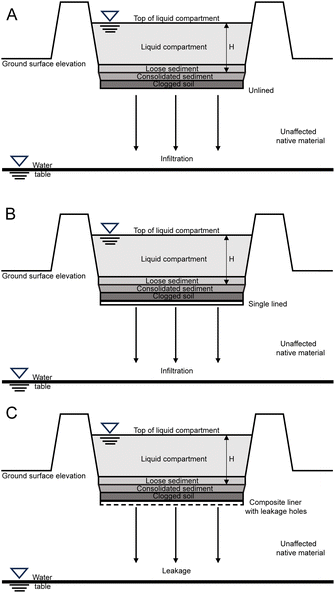 | ||
| Fig. 6 Three types of surface impoundments considered. (A) Unlined. (B) Single lined. (C) Composite liner with leakage holes.62 | ||
3 Results and discussion
3.1 Life cycle inventory (LCI) analysis
The following sections provide a detailed analysis of the LCI results for Li2CO3 production from the Atacama Desert brine, starting with the process modelling.The simulation results showed that for the chemical plant to produce 1 kg of Li2CO3, it required 3.28 kg concentrated brine, and 0.13 kg, 2.79 kg and 10.71 kg of hydrochloric acid, organic solvent, and hydrocarbon diluent, respectively. Precipitation of MgII and CaII impurities and carbonisation of the lithium(I) product required 5.79 kg Na2CO3 in aqueous solution, together with 0.014 kg of lime water. The Aspen modelling of the Li2CO3 production process validated the LCI inputs and the outputs; finally, discrepancies between modelled results and calculated and collected LCI data inputs were optimised by modelling.
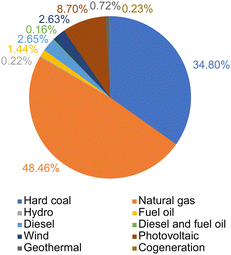 | ||
| Fig. 7 Northern Chilean electrical grid fuel mix.45 | ||
While the effect of waste infiltration may be negligible, the waste produced during evaporation and accumulated near the evaporation ponds occupies significant land area. Based on calculations, the annual production of 1.8 × 10⁵ t a−1 of Li2CO3 will generate 1.43 × 10⁷ t a−1 of waste salts, consisting mainly of sodium and potassium salts. As assumed by Flexer (2018),17 the salt mixture was considered to have an average volumetric density of 2 kg dm−3. As a result, this will produce waste with a volume of 7.16 × 10⁶ m3 a−1. Assuming that each waste pile has a height of 30 m,41 the total required area is 2.39 × 10⁵ m2 a−1 which is expected to expand with increasing annual production, requiring timely implementation of waste disposal.
3.2 Life cycle impact assessment analysis
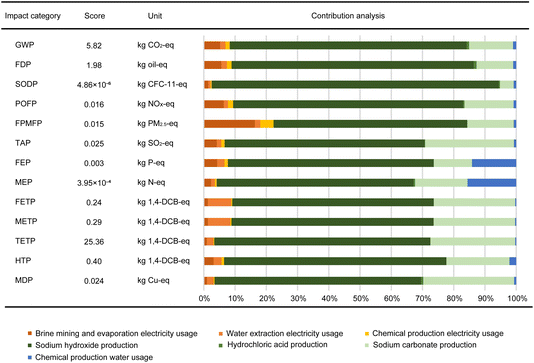 | ||
| Fig. 8 Environmental impacts of lithium carbonate production at the Atacama Desert, disaggregated to key contributing processes. | ||
Among all impact categories, use of NaOH and sodium carbonate, water supply, and electrical energy supply were the most significant contributors, with minor additional contributions from other sources. This arose mainly from the NaOH requirement in the re-extraction process of borates from organic to aqueous solvents. The high mass-specific electrical energy requirement of the chlor-alkali electrolytic process for NaOH production was the dominant contributor. Additionally, Na2CO3, used for MgII and CaII removal and for precipitation of the Li2CO3 product, led to environmental impacts. The entire production process requires electrical energy from the grid and water for solution preparation and as wash water, which also causes significant burdens.
Despite the high CO2 footprint of NaOH production being including in the analysis, as shown in Table 1, the overall GWP of the Li2CO3 production was predicted as 5.82 kg CO2 (kg Li2CO3)−1, driven primarily by use of NaOH (75.84%), Na2CO3 (14.01%) and electrical energy (8.30%). If the re-extraction process was not included in the production process, the overall GWP was predicted to decrease to 1.41 kg CO2 (kg Li2CO3)−1. However, this would result in increased costs and large volumes of waste organic solvents to be treated. The major environmental impacts contributors are summarised in Table 1. NaOH, Na2CO3, electrical energy and water use were the dominant contributors to fossil depletion potential (FDP), stratospheric ozone depletion (SODP), photochemical ozone formation, human health (POFP), terrestrial acidification (TAP), freshwater ecotoxicity (FETP), marine ecotoxicity (METP), terrestrial ecotoxicity (TETP), human toxicity, cancer (HTP) and metal depletion (MDP). For fine particulate matter formation potential (FPMFP), electrical energy was the second largest contributor, accounting for 18.08%. For freshwater eutrophication (FEP) and marine eutrophication (MEP), water use contributed 14.15% and 15.60%, respectively, as did Na2CO3 (12.23% and 16.80%, respectively).
| Impact | Major contributions |
|---|---|
| GWP | NaOH (75.84%), Na2CO3 (14.01%), electricity (8.30%) |
| FDP | NaOH (77.56%), Na2CO3 (11.67%) |
| SODP | NaOH (91.89%), Na2CO3 (4.37%) |
| POFP | NaOH (73.64%), Na2CO3 (15.71%) |
| FPMFP | NaOH (61.90%), electricity (18.08%), Na2CO3 (14.83%) |
| TAP | NaOH (63.97%), Na2CO3 (28.40%) |
| FEP | NaOH (65.89%), Na2CO3 (12.23%), water (14.15%) |
| MEP | NaOH (63.02%), Na2CO3 (16.80%), water (15.60%) |
| FETP | NaOH (64.49%), Na2CO3 (26.05%) |
| METP | NaOH (64.71%), Na2CO3 (26.10%) |
| TETP | NaOH (69.14%), Na2CO3 (27.14%) |
| HTP | NaOH (71.16%), Na2CO3 (20.17%), water (2.17%) |
| MDP | NaOH (66.13%), Na2CO3 (29.06%) |
Fig. 8 reports a predicted GWP of 5.82 kg CO2 (kg Li2CO3)−1 produced from brine, whereas previously research reported different GWP values shown in Table 2.28,29,31,32 However, it is important to note that previous results were predicted using simplistic unit process approaches without detailed theoretical calculations and modelling, such as of evaporation. It is unclear whether those authors considered the effects of boron(III) re-extraction processes; they did not include effects of regional electrical energy simulations, and used data across different years, so a range of GWP values are justified.
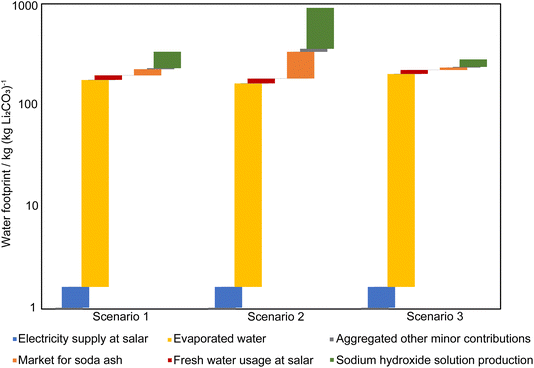
For the assumed evaporation scenario 1, the total was 160 kg (kg Li2CO3)−1 without considering water evaporation from brine, and the blue WF of the chemical plant production process blue WF accounted for 87.50% of the total. The NaOH production process consumed a significant amount of water, accounting for 74.83% of the total blue WF of the chemical plant production process. Excluding the NaOH production process, the total blue WF for all other processes was 55.41 kg (kg Li2CO3)−1. If water evaporation from brine was considered as a consumption of underground water resources, the blue WF was predicted to increase by 175.8 kg (kg Li2CO3)−1.
For scenario 2, using Penman's eqn (1), the total blue WF was predicted as 749 kg (kg Li2CO3)−1 without considering water evaporation from brine, since decreased evaporation rates led to increased volumes of concentrated brine supplied to the chemical plant. According to the calculations, the quantity of chemicals added was proportional to the brine volume, which increased the overall water footprint. Therefore, the first process of brine evaporation is crucial as it influences the inputs to the chemical plant and water consumption, thereby affecting production processes and costs. Similarly, if water evaporation from brine was considered, the blue WF would increase by 164 kg (kg Li2CO3)−1.
For scenario 3, the measured evaporation rate scenario, according to calculations, the blue WF consumption was 80 kg (kg Li2CO3)−1 without considering water evaporation from brine, with 75.14% attributed to the chemical plant production and 24.86% to the mining and evaporation processes. The actual amount of brine available for evaporation, calculated from the total annual brine extraction was 179.7 kg (kg Li2CO3)−1. However, due to the higher evaporation rate, there was an excessive water evaporation from brine; the amount of evaporated water should be 202.6 kg (kg Li2CO3)−1, which is 12.73% more than the actual value.
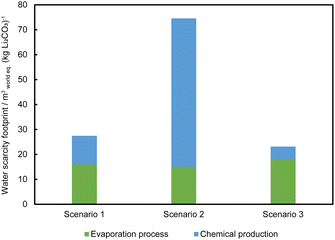
Fig. 10 shows the WSF for Li2CO3 production from brine in Chile. The 2023 AWARE water scarcity index for Chile is 81.38 mworld eq.3 (kg Li2CO3)−1.35 The WSFs were calculated taking water evaporation from brine into account for the three scenarios: 27.45 mworld eq.3 (kg Li2CO3)−1 for scenario 1, 74.55 mworld eq.3 (kg Li2CO3)−1 for scenario 2 and 23.12 mworld eq.3 (kg Li2CO3)−1 for scenario 3. The water scarcity effects of the Atacama Desert arise primarily from water evaporation from brine and direct utilisation of freshwater at the processing plant. If the prior brine evaporation concentration process is sufficient, the water demand for the processing plant would be relatively reasonable.
Some reports argue that the impact of brine extraction should not be included in water balance analyses, but should be evaluated through the hydrogeology analysis of the salt flats.58,65,66 However, the extracted brine, through the evaporation process, results in concentrated brine and takes part in the overall water balance of the system. Therefore, we suggested that it should be considered within the complete scope of water analysis. Furthermore, the extremely high water scarcity factor of Chile indicates the need for cautious water resource consumption in arid regions, especially in the Atacama Desert where the WSF may be even higher than the national average. It is essential to decrease water use and increase water recycling. However, presently, the evaporated brine which should be considered as a resource as well, as it exits the system and cannot be recovered by conventional evaporation methods. The development of new technology avoiding water evaporation from brine and reducing the amount of chemical usage will greatly benefit the arid region by reducing its water scarcity effect.
| Energy type | Contribution/% | |
|---|---|---|
| 2030 | 2050 | |
| Battery energy storage system | 2.32 | 3.17 |
| Diesel | 4.08 | 0.57 |
| Wind | 24.07 | 33.52 |
| Photovoltaic | 26.89 | 36.13 |
| Concentrated solar power | 13.64 | 17.22 |
| Liquified natural gas | 6.15 | 0.93 |
| Hydro | 20.09 | 7.30 |
| Biomass | 2.20 | 0.97 |
| Geothermal | 0.53 | 0.19 |
| Coal | — | — |
Conversely, there will be a decrease in reliance on fossil fuels, hydropower, biomass, and geothermal energy; coal will be phased out entirely.67
Table 3 presents the expected Chilean electrical grid fuel mix evolution in the near- (2030) and longer-term future (2050).67Fig. 11 presents the respective sensitivity analysis results comparing the base case with each of these two scenarios. The transition to increasingly renewable energy-dominated grid mixes in Chile by 2030 and 2050 results in significant environmental benefits, as compared to the present base case, including decreases in GWP, FDP, POFP, FPMFP and TAP up to 16%. However, the energy shift also introduces new challenges. SODP, FEP, MEP, FETP, METP, TETP, HTP and MDP are expected to increase by up to 30%, due to the renewable energy infrastructure specifics, such as the need for battery energy storage systems, solar panels, and wind turbines. Due to high LiI concentrations in Atacama brines, specific energy consumptions of solar evaporation processes are low.68 Therefore, switching to clean energy sources has minimal effect on decreasing GWP (1.22% and 2.54%).
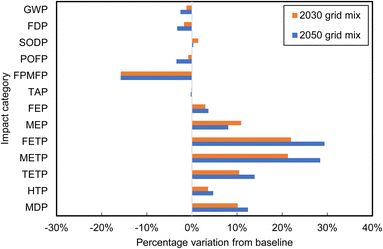 | ||
| Fig. 11 Changes in life cycle impact scores of lithium carbonate production from Atacama brines due to expected electrical grid evolution. | ||
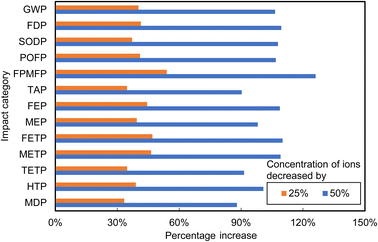
For the sensitivity analysis of brine concentration, it was assumed that the ratios of ion concentrations in brines remained constant, while brine concentrations were diluted by 25% and 50%, reflecting the exploitation of lower quality resources formed by geological and hydrological processes that remained unchanged. The compositions of the diluted brines considered are presented in Table 4.
| Composition | Base case/wt% | 25% reduction/wt% | 50% reduction/wt% |
|---|---|---|---|
| LiI | 0.15 | 0.11 | 0.08 |
| Cl−I | 16.04 | 12.03 | 8.02 |
| NaI | 7.60 | 5.70 | 3.80 |
| KI | 1.85 | 1.39 | 0.93 |
| CaII | 0.03 | 0.02 | 0.015 |
| MgII | 0.96 | 0.72 | 0.48 |
| SO42− | 1.65 | 1.24 | 0.83 |
| BIII | 0.06 | 0.05 | 0.03 |
| H2O | 71.66 | 78.75 | 85.83 |
Fig. 12 presents results of the sensitivity analysis for the two brine dilution scenarios, which were predicted to cause increases in overall environmental impacts, with life cycle impact scores increasing further as concentrations decreased. Specifically, a 25% decrease in brine concentration led to increases in life cycle environmental impacts ranging from 33% to 54%, whereas a 50% reduction in brine concentration caused life cycle impacts to increase by 88% to 126% across the various categories. These increases were due primarily to lower brine concentrations necessitating the processing of larger volumes of brine to produce 1 kg of Li2CO3, in turn intensifying requirements for chemicals and energy. Consequently, overall life cycle environmental impacts increased significantly.
3.3 Process improvements and alternative methods
Improvement of the present process requires optimisation of removal processes of boron(III) and other impurities. Firstly, boron(III) removal was predicted to be the primary source of pollution, mostly due to NaOH production. Replacing the hydrogen evolution/water reduction reaction (2H2O + 2e− → H2 + 2OH−) at cathodes in conventional chlor-alkali membrane electrolysers with the oxygen-reduction reaction (O2 + 2H2O + 4e− → 4OH−) at oxygen depolarised cathodes (ODC) could decrease of electrical energy usage by ca. 25%, thereby decreasing CO2 emissions and GWPs.69 Presently, ODC technology offers the most environmentally sustainable method of chlor-alkali production.70,71 Furthermore, molar ratios of H2O consumed to OH− ions produced in conventional membrane chlor-alkali processes are ca. 1, whereas that ratio is 0.5 for oxygen reduction cathodes, so enabling decreased water consumption.Despite decades of operation of the boron(III) solvent extraction process, ongoing research is exploring alternative methods such as nanofiltration, to remove boron(III) from brine. However, nanofiltration is 1.4 to 1.7 times more polluting than solvent extraction because of its greater consumption of electrical energy.72 In addition, the use of environmentally benign solvents and improved extraction and re-extraction techniques has the potential to decrease the consumption of input materials so decreasing environmental burdens.
Secondly, companies and academics are researching new technologies intensively to recover lithium(I) from brines, since lithium(I) recoveries are <50% by solar evaporation. The new techniques, such as solvent extraction, adsorption, nanofiltration, and electrochemical methods, aim to increase LiI production rates without relying on evaporation. In the extraction of lithium(I), solvent extraction offers 75% to 99% greater recovery rates.73–77 However, large scale production would require large volumes of organic solvent, challenging its recovery and suitable equipment selection.21 Alternatively, lithium(I) extraction by adsorption would be a simple and attractive technique due to high lithium(I) selectivity (92–99%) and adsorption capacity.78–80 However, this technique in large-scale production can result in blockage of the ion channels reducing adsorbing capacity.21 Additionally, the adsorbents may need frequent replacement making implementation complicated and potentially expensive. Nanofiltration for lithium(I) extraction is a simple method that can be conducted at room temperature, but lithium(I) recoveries have been reported to be relatively low, ranging from 12% to 55%.81–83 Electrochemical methods for lithium(I) extraction offer great potential, avoiding the need for boron(III) removal processes and have low water (1.1 to 47.5 dm3 s−1) and electrical energy consumptions (0.001 to 0.013 kW h per mol Li+).84 Additionally, production times have been decreased to days and even hours. For example, lithium(I) in brine can be recovered selectively by electrochemical deintercalation/intercalation system (LiFePO4/FePO4 EDI system), during which the Mg2+, Ca2+, SO42− and B4O72− removal rates were above 94%.85 In addition, LiMn2O4/Li1−xMn2O4 (LMO) electrochemical systems with porous electrodes is also a promising method, which can recover lithium(I) directly from brine at a high rate and low specific electrical energy consumptions.86
Overall, all those methods mentioned above offer distinct advantages and challenges in lithium(I) extraction, highlighting the necessity for comprehensive evaluation and consideration of factors such as recovery efficiency, environmental impact, operational feasibility, and cost benefit analysis in large-scale production scenarios.
3.4 Limitations and future perspectives
Although a detailed LCA of Li2CO3 production has been developed, it still has some limitations and shortcomings. Specifically, the waste management model was simplified; rectangular cuboid units were employed based on the methods of USEPA,62 whereas waste piles often have conical or trapezoidal shapes in reality. These differences can affect the thickness of the accumulated fresh waste layer and further influence infiltration rates. Therefore, a more careful evaluation of the model parameters for real cases is required for an in-depth investigation of waste management. For water scarcity analysis, the water scarcity factor used is the Chilean average value. However, it is essential to obtain the latest water scarcity factor specific to the production site at the core of the Atacama Desert for a more detailed analysis at the regional level.In recent years, several coal-fired power stations have been decommissioned in Chile and replaced with solar and wind energy generation. This change is expected to make the future electrical grid mix in Chile cleaner, and less carbon intensive. Therefore, it is reasonable to explore the environmental impact of Chile energy transition on lithium(I) production in the future. A comprehensive LCA study can be conducted of alternative methods of lithium(I) extraction from brine to compare with conventional evaporative techniques. This analysis can help to evaluate the environmental impacts, water resource consumption, production output, duration, and economic benefits of each method, providing comprehensive guidance for lithium(I) production.
4 Conclusions
An up-to-date and more detailed LCI model has been established, based on chemical stoichiometry calculations, parameter modelling, and existing literature, technical reports, and the Ecoinvent database. This model involved optimisation through simulations, as well as calculations for every step of the process, including recycling. Due to the varying regional characteristics of brine production in each salar, and distinct freshwater resources surrounding different brine extraction sites, investigation of individual salars characteristics and extraction processes is considered necessary. Simulations of the northern Chile electricity grid mix, still dominated by fossil fuels, has helped produce more accurate results that are regionally specific. For waste management, although the accumulation of waste generated during Li carbonate production may not have had a significant impact on infiltration, still it is shown to result in occupation of significant land areas.Detailed and complete analysis of thirteen life cycle environmental impacts of this LiI extraction process has predicted relatively low GWP (5.82 kg CO2 (kg Li2CO3)−1) and other impacts, but relatively high TETP (24.57 kg 1,4-DB eq. (kg Li2CO3)−1) due to NaOH production. Considering water issues, three scenarios for the evaporation process have been simulated, adjusted, and compared to analyse the water balance results. Although the water footprint of the process was shown not to have been significant (0.29 m3 (kg Li2CO3)−1 to 0.92 m3 (kg Li2CO3)−1), it is crucial to note that this water has been extracted and pumped from an underground resource that is scarce in an extremely arid region. Therefore, the WSF of this seemingly low water-consuming LiI production process was predicted to be relatively high significant (23.12 mworld equiv.3 (kg Li2CO3)−1 to 74.55 mworld equiv.3 (kg Li2CO3)−1). In addition to those disadvantages, the time-consuming production also resulted in low predicted lithium(I) recoveries and recovery rates during the evaporation process.
The rapidly growing demand in the Li2CO3 market is encouraging the conception and development of novel lithium(I) recovery processes. Although many alternative solutions have been studied and even up-scaled, they have not specifically addressed the question of how the brine will be treated after lithium(I) recovery. Through our water balance analysis, a significant volume of water from brines was predicted to be lost from the system by evaporation; in such an extremely arid area those losses should not be ignored but considered as a potential resource for recovery. The results provided important insights of the life cycle impacts of Li2CO3 production and associated industries and can help guide lithium(I) production activities. Additionally, the results offer a scientific basis for environmental management in arid and similar regions.
Abbreviations
| EDI | Electrochemical Deintercalation/Intercalation |
| FDP | Fossil Depletion Potential |
| FEP | Freshwater Eutrophication Potential |
| FETP | Freshwater Ecotoxicity Potential |
| FPMFP | Fine Particulate Matter Formation Potential |
| GWP | Global Warming Potential |
| HTP | Human Toxicity Potential, cancer |
| LCA | Life Cycle Assessment |
| LCI | Life Cycle Inventory |
| LIB | Lithium-Ion Battery |
| LMO | LiMn2O4/Li1−xMn2O4 |
| MDP | Metal Depletion Potential |
| MEP | Marine Eutrophication Potential |
| METP | Marine Ecotoxicity Potential |
| POFP | Photochemical Oxidant Formation Potential, human health |
| SING | Sistema Interconectado del Norte Grande |
| SODP | Stratospheric Ozone Depletion Potential |
| SQM | Sociedad Química y Minera |
| TAP | Terrestrial Acidification Potential |
| TETP | Terrestrial Ecotoxicity Potential |
| WF | Water Footprint |
| WSF | Water Scarcity Footprint |
List of symbol definitions and units
| α | Albedo (/1) |
| a | Area of holes in the geomembrane (m2) |
| a U | Wind function coefficient (/1) |
| D clog | Thickness of clogged soil layer (m) |
| D fc | Thickness of consolidated sediment layer (m) |
| D liner | Thickness of consolidated sediment layer (m) |
| E a | Annual evaporation (mm a−1) |
| E O | Corrected evaporation rate (mm day−1) |
| E PEN | Calculated evaporation rate using Penman equation (mm day−1) |
| E t | Recorded evaporation rate in the class A pan or calculations (mm day−1) |
| FC | Field capacity (vol vol−1) |
| h | Head of liquid on top of geomembrane (m) |
| H p | Pond depth of wastewater in the surface impoundment (m) |
| i | Rank of month (/1) |
| I | Average infiltration rate (m s−1) |
| I a | Annual water infiltration (mm a−1) |
| K clog | Saturated hydraulic conductivity of clogged soil (m s−1) |
| K fc | Saturated hydraulic conductivity of consolidated sediment (m s−1) |
| K liner | Saturated hydraulic conductivity of liner (m s−1) |
| K e | Pond coefficient (/1) |
| K s | Hydraulic conductivity of the low-permeability soil underlying the geomembrane (m s−1) |
| K S | Salinity reduction coefficient (/1) |
| n | Bright sunshine hours per day (h) |
| N | Maximum possible daylight duration (h) |
| P a | Annual precipitation (mm a−1) |
| Q | Steady-state rate of leakage through holes in composite liner (m3 s−1) |
| RH | Relative humidity (%) |
| R A | Extraterrestrial irradiance (MJ m−2 day−1) |
| R S | Solar irradiance (MJ m−2 day−1) |
| S | Footprint of the surface impoundment (m2) |
| S i | Solid input (kg (kg Li2CO3)−1) |
| S o | Solid output (kg (kg Li2CO3)−1) |
| T | Average temperature (°C) |
| T a | Thickness of the fresh waste layer accumulated (mm a−1) |
| u | Wind speed (m s−1) |
| W | Initial water content of the fresh waste (vol vol−1) |
| W ei | External water input (kg (kg Li2CO3)−1) |
| W ii | Internal water input (kg (kg Li2CO3)−1) |
| W o | Water output (kg (kg Li2CO3)−1) |
| W r | Recycled water (kg (kg Li2CO3)−1) |
| W w | Wastewater (kg (kg Li2CO3)−1) |
| ∅ | Latitude of the site (Rad) |
| ρ | Leak density (holes m−2) |
Data availability
The data supporting this article have been included as part of the ESI.†Author contributions
Zijing He: conceptualisation, methodology, software, investigation, formal analysis, writing – original draft. Anna Korre: conceptualisation, supervision, methodology, writing – review & editing. Geoff Kelsall: supervision, writing – review & editing. Zhenggang Nie: methodology. Melanie Colet: methodology, input data.Conflicts of interest
There are no conflicts to declare.Acknowledgements
The research reported is part of an Imperial College London PhD research scholarship for the lead author, supplemented by Anne Seagrim Accommodation Scholarship.References
- U.S. Geological Survey, Mineral Commodity Summaries 2024, 2024 Search PubMed.
- International Energy Agency, Net Zero Roadmap: A Global Pathway to Keep the 1.5 °C Goal in Reach, 2023.
- International Energy Agency, Global EV Outlook 2023, https://www.iea.org/reports/global-ev-outlook-2023/executive-summary, (accessed 1 April 2024).
- B. W. Jaskula, 2018 Minerals Yearbook Lithium [Advance Release], U.S. Department of the Interior, U.S. Geological Survey, 2020 Search PubMed.
- H. Vikström, S. Davidsson and M. Höök, Appl. Energy, 2013, 110, 252–266 CrossRef.
- C. Grosjean, P. H. Miranda, M. Perrin and P. Poggi, Renewable Sustainable Energy Rev., 2012, 16, 1735–1744 CrossRef.
- M. E. Q. Pilson, An Introduction to the Chemistry of the Sea, Cambridge University Press, 2012 Search PubMed.
- A. Shahmansouri, J. Min, L. Jin and C. Bellona, J. Cleaner Prod., 2015, 100, 4–16 CrossRef CAS.
- S. E. Kesler, P. W. Gruber, P. A. Medina, G. A. Keoleian, M. P. Everson and T. J. Wallington, Ore Geol. Rev., 2012, 48, 55–69 CrossRef.
- A. Seip, S. Safari, D. M. Pickup, A. V. Chadwick, S. Ramos, C. A. Velasco, J. M. Cerrato and D. S. Alessi, Chem. Eng. J., 2021, 426, 130713 CrossRef CAS.
- A. Kumar, H. Fukuda, T. A. Hatton and J. H. V. Lienhard, ACS Energy Lett., 2019, 4, 1471–1474 CrossRef CAS.
- M. Figueira, D. Rodríguez-Jiménez, J. López, M. Reig, J. L. Cortina and C. Valderrama, Desalination, 2023, 549, 116321 CrossRef CAS.
- S. Kim, J. Kim, S. Kim, J. Lee and J. Yoon, Environ. Sci.: Water Res. Technol., 2018, 4, 175–182 RSC.
- V. Devda, K. Chaudhary, S. Varjani, B. Pathak, A. K. Patel, R. R. Singhania, M. J. Taherzadeh, H. H. Ngo, J. W. C. Wong, W. Guo and P. Chaturvedi, Bioengineered, 2021, 12, 4697–4718 CrossRef.
- N. A. A. Qasem, R. H. Mohammed and D. U. Lawal, npj Clean Water, 2021, 4, 1–15 CrossRef.
- A. Siekierka, M. Bryjak, A. Razmjou, W. Kujawski, A. N. Nikoloski and L. F. Dumée, Membranes, 2022, 12, 343 CrossRef CAS PubMed.
- V. Flexer, C. F. Baspineiro and C. I. Galli, Sci. Total Environ., 2018, 639, 1188–1204 CrossRef CAS.
- B. Swain, Sep. Purif. Technol., 2017, 172, 388–403 CrossRef CAS.
- L. Talens Peiró, G. Villalba Méndez and R. U. Ayres, JOM, 2013, 65, 986–996 CrossRef.
- D. E. Garrett, Handbook of Lithium and Natural Calcium Chloride, 2004 Search PubMed.
- J. F. Song, L. D. Nghiem, X.-M. Li and T. He, Environ. Sci.: Water Res. Technol., 2017, 3, 593–597 RSC.
- C. Shi, Y. Jing and Y. Jia, J. Mol. Liq., 2016, 215, 640–646 CrossRef CAS.
- R. N. Hader, R. L. Nielsen and M. G. Herre, Ind. Eng. Chem., 1951, 43, 2636–2646 CrossRef CAS.
- M. Grágeda, A. González, W. Alavia and S. Ushak, Energy, 2015, 89, 667–677 CrossRef.
- V. T. Nguyen, C. Deferm, W. Caytan, S. Riaño, P. T. Jones and K. Binnemans, J. Sustainable Metall., 2023, 9, 107–122 CrossRef PubMed.
- L. A.-W. Ellingsen, G. Majeau-Bettez, B. Singh, A. K. Srivastava, L. O. Valøen and A. H. Strømman, J. Ind. Ecol., 2014, 18, 113–124 CrossRef CAS.
- E. Kallitsis, A. Korre, G. Kelsall, M. Kupfersberger and Z. Nie, J. Cleaner Prod., 2020, 254, 120067 CrossRef CAS.
- A. Stamp, D. J. Lang and P. A. Wäger, J. Cleaner Prod., 2012, 23, 104–112 CrossRef CAS.
- J. C. Kelly, M. Wang, Q. Dai and O. Winjobi, Resour., Conserv. Recycl., 2021, 174, 105762 CrossRef CAS.
- Ministerio de Energia, Anuario Estadístico de Energía año 2022, 2020 Search PubMed.
- M. Chordia, S. Wickerts, A. Nordelöf and R. Arvidsson, Resour., Conserv. Recycl., 2022, 187, 106634 CrossRef CAS.
- S. Khakmardan, M. Rolinck, F. Cerdas, C. Herrmann, D. Giurco, R. Crawford and W. Li, Procedia CIRP, 2023, 116, 606–611 CrossRef.
- V. Schenker, C. Oberschelp and S. Pfister, Resour., Conserv. Recycl., 2022, 187, 106611 CrossRef CAS.
- A. C. Schomberg, S. Bringezu and M. Flörke, Commun. Earth Environ., 2021, 2, 1–10 CrossRef.
- A.-M. Boulay, J. Bare, L. Benini, M. Berger, M. J. Lathuillière, A. Manzardo, M. Margni, M. Motoshita, M. Núñez, A. V. Pastor, B. Ridoutt, T. Oki, S. Worbe and S. Pfister, Int. J. Life Cycle Assess., 2018, 23, 368–378 CrossRef.
- Ecoinvent Association, Ecoinvent Database 3.9.1, 2024, https://ecoinvent.org/.
- Aspen Tech, Aspen Plus, 2024, https://www.aspentech.com/en/products/engineering/aspen-plus.
- Sphera Solutions, Life Cycle Assessment (LCA) Software, 2023, https://about.sphera.com/ps.
- The International Organization for Standardization, ISO 14040: 2006a Environmental Management-Life Cycle Assessment-Principles and Framework, 2006.
- I. Wilkomirsky, US Pat., 5993759, 1999 Search PubMed.
- Sociedad Química y Minera de Chile, Technical Report Summary Operation Report Salar de Atacama, Av. Las Condes 11.700, Vitacura. Santiago, Chile, 2022 Search PubMed.
- T. Tran and V. T. Luong, in Lithium Process Chemistry, Elsevier, 2015, pp. 81–124 Search PubMed.
- J. D. Valiantzas, J. Hydrol., 2006, 331, 690–702 CrossRef.
- Sociedad Química y Minera de Chile, SQM monitor en línea, https://www.sqmsenlinea.com/meteorology/232, accessed 3 April 2024.
- Economic Charge Dispatch Center of the SING, The Chile CDED-SING, http://cdec2.cdec-sing.cl/pls/portal/cdec.pck_web_coord_elec.sp_pagina?p_id=5197, accessed 1 April 2024.
- Dirección General De Aeronáutica Civil and Dirección Meteorológica de Chile, Servicios Climáticos, https://climatologia.meteochile.gob.cl/application/requerimiento/producto/RE1011, accessed 3 April 2024.
- S. K. Kampf, S. W. Tyler, C. A. Ortiz, J. F. Muñoz and P. L. Adkins, J. Hydrol., 2005, 310, 236–252 CrossRef.
- W. Zhu, W. Xu, D. Liu, L. He, X. Liu and Z. Zhao, Electrochim. Acta, 2024, 475, 143519 CrossRef CAS.
- F. Habashi, Handbook of Extractive Metallurgy, Wiley-VCH, 1997 Search PubMed.
- J. F. Muñoz-Pardo, C. A. Ortiz-Astete, L. Mardones-Pérez and P. de Vidts-Sabelle, Tecnol. Cienc. Agua, 2004, 19, 69–81 Search PubMed.
- T. A. Newson and M. Fahey, Eng. Geol., 2003, 70, 217–233 CrossRef.
- Y. Fujiyasil, PhD thesis, The University of Western Australia, 1997 Search PubMed.
- T. A. Newson, Y. Fujiyasu and M. Fahey, Proceedings of the Fourteenth International Conference on Soil Mechanics and Foundation Engineering, 1997, vol. 3, pp. 1973–1978 Search PubMed.
- L. Mardones, El litio, un nuevo recurso para Chile, 1986, 181–216 Search PubMed.
- F. Ide, PhD thesis, Universidad de Chile, 1978 Search PubMed.
- Sociedad Química y Minera de Chile, Fresh water and brine: why they are different, https://www.sustainablelithium.com/what/, accessed 5 February 2024.
- J. S. Gutiérrez, J. N. Moore, J. P. Donnelly, C. Dorador, J. G. Navedo and N. R. Senner, Proc. R. Soc. B, 2022, 289, 20212388 CrossRef PubMed.
- W. Liu, D. B. Agusdinata and S. W. Myint, Int. J. Appl. Earth Obs. Geoinf., 2019, 80, 145–156 Search PubMed.
- J. C. Molinare, PhD thesis, Imperial College London, 2014 Search PubMed.
- M. M. Aldaya, A. K. Chapagain, A. Y. Hoekstra and M. M. Mekonnen, The Water Footprint Assessment Manual Setting the Global Standard, 2012 Search PubMed.
- Vicepresidencia Operaciones Potasio Litio, Undécimo Informe de Extracción Anual de Salmuera de las Operaciones en el Salar de Atacama, 2019.
- U.S. Environmental Protection Agency, EPA's Composite Model for Leachate Migration with Transformation Products (EPACMTP) Technical Background Document, 2023.
- U.S. Environmental Protection Agency, EPA's Composite Model for Leachate Migration with Transformation Products (EPACMTP) Parameters/Data Background Document, 2023.
- J. Finch and A. Calver, Methods for the Quantification of Evaporation from Lakes, 2008 Search PubMed.
- M. A. Marazuela, E. Vázquez-Suñé, C. Ayora and A. García-Gil, Sci. Total Environ., 2020, 703, 135605 CrossRef CAS.
- W. Liu and D. B. Agusdinata, Extr. Ind. Soc., 2021, 8, 100927 Search PubMed.
- Ministerio de Energía, Proyecciones Eléctricas, https://energia.gob.cl/pelp/proyecciones-electricas, accessed 5 August 2024.
- Sociedad Química y Minera de Chile, Sustainability of lithium production in Chile, 2021.
- Global Corporate Website, Saving energy in chlorine production, https://www.covestro.com/en/sustainability/flagship-solutions/oxygen-depolarized-cathode, accessed 17 April 2024.
- I. Garcia-Herrero, M. Margallo, R. Onandía, R. Aldaco and A. Irabien, Sustain. Prod. Consum., 2017, 12, 44–58 CrossRef.
- I. Garcia-Herrero, M. Margallo, R. Onandía, R. Aldaco and A. Irabien, Sci. Total Environ., 2017, 580, 147–157 CrossRef CAS PubMed.
- J. Wu, B. Li and J. Lu, Clean Technol. Environ. Policy, 2021, 23, 1981–1991 CrossRef CAS.
- T. Sekimoto, S. Nishihama and K. Yoshizuka, Solvent Extr. Res. Dev., Jpn., 2018, 25, 117–123 CrossRef CAS.
- D. Shi, B. Cui, L. Li, X. Peng, L. Zhang and Y. Zhang, Sep. Purif. Technol., 2019, 211, 303–309 CrossRef CAS.
- L. Zhang, L. Li, D. Shi, X. Peng, F. Song, F. Nie and W. Han, Hydrometallurgy, 2018, 175, 35–42 CrossRef CAS.
- W. Xiang, S. Liang, Z. Zhou, W. Qin and W. Fei, Hydrometallurgy, 2017, 171, 27–32 CrossRef CAS.
- L. Ji, Y. Hu, L. Li, D. Shi, J. Li, F. Nie, F. Song, Z. Zeng, W. Sun and Z. Liu, Hydrometallurgy, 2016, 162, 71–78 CrossRef CAS.
- S. Wang, P. Li, X. Zhang, S. Zheng and Y. Zhang, Hydrometallurgy, 2017, 174, 21–28 CrossRef CAS.
- J.-L. Xiao, S.-Y. Sun, X. Song, P. Li and J.-G. Yu, Chem. Eng. J., 2015, 279, 659–666 CrossRef CAS.
- X. Shi, D. Zhou, Z. Zhang, L. Yu, H. Xu, B. Chen and X. Yang, Hydrometallurgy, 2011, 110, 99–106 CrossRef CAS.
- Y. Li, Y. Zhao, H. Wang and M. Wang, Desalination, 2019, 468, 114081 CrossRef CAS.
- A. Somrani, A. H. Hamzaoui and M. Pontie, Desalination, 2013, 317, 184–192 CrossRef CAS.
- X. Wen, P. Ma, C. Zhu, Q. He and X. Deng, Sep. Purif. Technol., 2006, 49, 230–236 CrossRef CAS.
- J. A. A. Dietz, J. T. V. Valero, M. A. C. Lagrille and G. E. M. Naranjo, Undergraduate thesis, Universidad de Chile, 2021 Search PubMed.
- D. Liu, Z. Zhao, W. Xu, J. Xiong and L. He, Desalination, 2021, 519, 115302 CrossRef.
- D. Liu, W. Xu, J. Xiong, L. He and Z. Zhao, Sep. Purif. Technol., 2021, 270, 118809 CrossRef CAS.
Footnote |
| † Electronic supplementary information (ESI) available. See DOI: https://doi.org/10.1039/d4su00223g |
| This journal is © The Royal Society of Chemistry 2025 |

