 Open Access Article
Temperature dependence in fast-atom diffraction at surfaces
Peng
Pan
 ,
Maxime
Debiossac
 and
Philippe
Roncin

Université Paris-Saclay, CNRS, Institut des Sciences Moléculaires d'Orsay (ISMO), 91405 Orsay, France
First published on 9th May 2022
Abstract
Grazing incidence fast atom diffraction at crystal surfaces (GIFAD or FAD) has demonstrated coherent diffraction both at effective energies close to one eV (λ⊥ ≈ 14 pm for He) and at elevated surface temperatures offering high topological resolution and real time monitoring of growth processes. This is explained by a favorable Debye-Waller factor specific to the multiple collision regime of grazing incidence. This paper presents the first extensive evaluation of the temperature behavior between 177 and 1017 K on a LiF surface. Similarly to diffraction at thermal energies (TEAS), an exponential attenuation of the elastic intensity is observed but, contrarily to TEAS, the maximum coherence is not directly reduced by the attraction forces that increase the effective impact energy. It is more influenced by the surface stiffness and appears very sensitive to surface defects.
1 Introduction
The characterization of new materials requires a variety of techniques to analyze their physical and chemical properties. These can be real space microscopic techniques such as scanning tunneling microscopy and atomic force microscopy but also reciprocal space techniques using X-rays, neutrons, electrons, or atoms. Since atoms with kinetic energies below a few eV cannot penetrate below the surface, thermal energies atom scattering (TEAS), also known as helium atom scattering (HAS), is a valuable tool to investigate surfaces and 2D materials.1,2 It is insensitive to the presence of magnetic or electric fields and does not induce any direct damage or charging of the surface. However, its geometry is not compatible with a standard molecular beam epitaxy (MBE) vessel which requires that no instrument prevents the gas from the evaporation cells from reaching the surface. MBE also requires elevated surface temperatures in order to control the mobility of the deposited atom or molecule so that these can reach an optimum location in a reasonable timescale without being trapped too long in undesirable sites.3 In this context, grazing incidence fast atom diffraction (GIFAD4 or FAD5) which is the high energy, grazing incidence counterpart of TEAS offers decisive advantages; it has been shown to be compatible with a harsh UHV environment and with the MBE geometry. At variance with TEAS, the full diffraction image can be recorded in seconds so that it can be used as a real time diagnostic of the structure of the terminal layer. More unexpected, diffraction can be recorded on a surface at elevated temperatures. This is illustrated in Fig. 1 taken from ref. 6 and recorded inside a MBE vessel with a GaAs surface at around 850 K, whereas TEAS is mainly performed at low temperatures. This interesting aspect of GIFAD to operate at elevated surface temperatures is poorly documented7–9 and no systematic experimental investigation has been reported.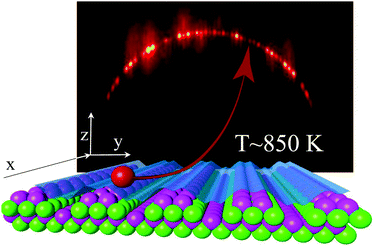 | ||
| Fig. 1 Schematic view of a GIFAD setup, the well-aligned row of atoms acts as a grating for the projectile atomic wave. A detector located almost a meter downstream records the diffraction image. The one here, taken from ref. 6 was recorded directly in a MBE vessel with 400 eV He at 0.65° on a GaAs(001) surface at ∼850 K. The bright spots corresponding to elastic diffraction are located on the Laue circle of energy conservation. | ||
This paper presents experimental investigations on temperature dependence under a wide variety of experimental conditions of energy, angle of incidence and temperatures for helium atoms impinging on a LiF surface. The paper is organized as follows, the experimental setup is described in Section 2 with the protocol used to transform raw data into transverse and polar scattering profiles from which the coherence ratio is defined. In Section 3, the strategy adopted to performed stable temperature variations is presented before an introduction to theoretical aspects of elastic and inelastic diffraction in Section 4. The results are presented and discussed in Section 5.
2 Grazing incidence fast atom diffraction (GIFAD)
The grazing incidence fast atom diffraction at crystal surfaces uses atoms in the keV energy range as probed with incidence angles θi around 1 deg. so that the full diffraction pattern can be recorded in one take on a position-sensitive detector10–13 as sketched in Fig. 1. A commercial ion source delivers ions at the desired energy, they pass inside a charge exchange cell filled with the same gas, where a significant fraction is neutralized by resonant electron capture, see e.g. ref. 14. After this cell, the ion fraction is deflected away and the spatial extent and angular divergence of the neutral beam is controlled by two co-linear diaphragms adjustable between 20 and 100 μm, separated by a distance close to half a meter before entering into the UHV chamber with the target. If the projectile encounters a large enough terrace, it undergoes quasi-specular reflection and the projectiles are scattered within a cone with an opening angle of θi. Since keV atoms are easily detected and imaged by micro-channel plates, GIFAD was able to record a few images per second15,16 with an old ion source.GIFAD offers a high topological resolution of a few pm on atomic structure, e.g. surface rumpling17 or charge transfer,18 simple semi-quantitative interpretation14 and, when compared with exact quantum scattering code,4,19–21 a parameter free accuracy.6,22 The temperature of the surface affects both its nuclear and electronic structures. We use the well-documented system of helium on LiF(001), where the large band-gap prevents electronic contributions,23,24 at least in the quasi-molecular velocity regime and for normal energy E⊥ below 1 eV. This allows interpretations of inelastic effects only in terms of thermal motion of the surface atoms.
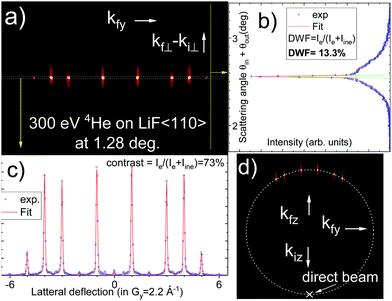
A definition of the (x,y,z) axis is displayed in Fig. 1 together with a typical raw diffraction image on GaAs at elevated temperatures. Another raw diffraction image is plotted in Fig. 2(d) for a LiF crystal and a helium beam oriented along the [110] direction. These images correspond to a direct mapping of the final velocity or wave vector (kfy,kfz) of the scattered projectile perpendicular to the crystal axis. Bright elastic diffraction spots are clearly visible and located on a single circle corresponding to energy conservation of the motion in the (y,z) plane perpendicular to the crystal axis probed: kfy2 + kfz2 = k⊥2 = cst. A polar-like transformation25 brings this Laue circle into a straight line displayed in (Fig. 2(a)). The intensity in this narrow stripe of maximum intensity is reported on Fig. 2(c) and shows well-resolved diffraction peaks equally separated by multiples of the Bragg angle θB = arctan(Gy/ħk‖), where ħk‖ = ħkcos![[thin space (1/6-em)]](https://www.rsc.org/images/entities/char_2009.gif) θin is the projectile momentum parallel to the crystal axis. Gy = 2π/ay is the reciprocal lattice vector associated with the distance ay between atomic rows perpendicular to the probed crystal axis, taken here as the x direction. To derive the structure factor, only the elastic intensities should be considered, however, when elastic intensity is significant, the elastic and inelastic relative intensities on the Laue circle Im were found identical26 so that Fig. 2(c) can be directly exploited.
θin is the projectile momentum parallel to the crystal axis. Gy = 2π/ay is the reciprocal lattice vector associated with the distance ay between atomic rows perpendicular to the probed crystal axis, taken here as the x direction. To derive the structure factor, only the elastic intensities should be considered, however, when elastic intensity is significant, the elastic and inelastic relative intensities on the Laue circle Im were found identical26 so that Fig. 2(c) can be directly exploited.
The projection of Fig. 2(a) on the vertical axis produces the polar scattering profile in Fig. 2(b) showing a narrow elastic peak on top of a broader inelastic scattering profile. The relative weight of the elastic peak can be estimated using a simple fit where the elastic component is represented by a narrow Gaussian peak and the inelastic one by a broader, slightly asymmetric log-normal profile  .27–29 Assuming that the image contains only the gently scattered projectile that did not encounter major surface defects, this ratio DWF = Ie/Itot is believed to be a direct measurement of the Debye-Waller factor. It is slightly different from the standard definition used in TEAS DWF = Ie/I0 where I0 would be the intensity scattered from a ideal lattice at rest.30 The measure of the direct beam intensity31 could also provide a reference for I0 to determine absolute diffraction intensities. In GIFAD, the direct beam is always measured, either directly or through a calibrated attenuation grid, because both the exact beam position and line-profile are mandatory for accurate determination of the small angles. It reveals that for the present cleaved LiF sample, the intensity scattered by the surface drops rapidly as the incidence angle is decreased. The reflectivity starts around unity above 2-3 deg and drops down to only a few percent below 0.5 deg. This reduced reflectively is in part due to the overlap with the sample surface but is probably mainly due to the distribution of terrace height resulting from the cleavage.
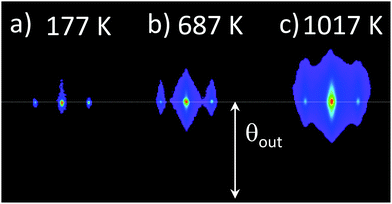
Fig. 3 shows three diffraction images recorded at temperatures of 177 K, 687 K, and 1017 K measured with a type-N thermocouple mechanically pressed on the backside of the sample plate. The transition from a spotty pattern to a much more diffuse one is clearly visible and is discussed in detail along the vertical and horizontal axis corresponding respectively to the polar profile and lateral deflection. On Fig. 4(a) the intensity on the Laue line is displayed in the log scale. Within experimental uncertainty due to slightly different beam conditions, the narrow elastic peaks do not change shape but the inelastic contribution increases both in intensity and in width as outlined by the full lines. More precisely, in this example, both the extrapolated inelastic peak intensity and the exponential decay range increase quasi-linearly with the temperature.
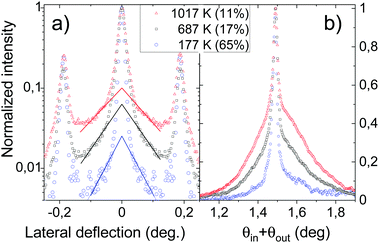 | ||
| Fig. 4 For the three images in Fig. 3, panel (a): lateral profiles on the Laue circle, the lines are here to outline the exponential decay of the peak tail. Panel (b): Polar scattering profiles. The measured values of the DWF are reported in parenthesis and also plotted in Fig. 8(a). | ||
Fig. 4(b) reports the polar scattering profiles of Fig. 3. The broad inelastic profile is also clearly identified with a relative height and a width growing with temperature so that the relative elastic intensity decay rapidly. At this stage, it is useful to compare with the first investigation of the temperature dependence performed when elastic diffraction was not yet demonstrated and where all peak shapes seemed to depend on temperature,6,18,32 probably because of a limited surface coherence. In this context, the Debye-Waller factor was tentatively attributed to the ratio of the narrow peak relative to the total intensity observed on the Laue circle,7,33,34e.g. in Fig. 2(b) or Fig. 4(a), rather than from the projected polar profile in Fig. 2(c) or Fig. 4(b). This point of view, obviously underestimates the overall inelastic intensity and strongly depends on the primary beam profile, and is not used anymore. Our ability to isolate the elastic contribution by a fit is limited by experimental aspect such as statistic for the inelastic profile and resolution for the elastic one but also by theoretical limitations that the Log-normal profile is valid only for a single inelastic collision. It seems to remain a good approximation for multiple inelastic collisions, but strictly speaking, the convolution of such profiles is not anymore a log-normal profile.26,28 In practice we deliberately limit ourselves to elastic contributions above 1% where the elastic peak is still visible.
3 ϕ-scan, θ-scan, E-scan and T-scan
A typical GIFAD experiment begins with the introduction or preparation of a new sample surface and subsequent annealing. The first measurements consist of a rapid azimuthal scan, φ-scan, where the target surface is rotated in-plane (around the z axis in Fig. 1) in order to identify its crystal axis. It does not require that diffraction is observed because a simple analysis of the width of scattered lateral profiles; 〈kfy2〉1/2 in Fig. 2a, c, d and 4a), as a function of the target azimuthal angle φ is enough to identify the principal crystal axis. The procedure called triangulation14,35,36 is used where the angle of incidence θ (![[triple bond, length as m-dash]](https://www.rsc.org/images/entities/char_e002.gif) kiz) is kept constant. In practice, measuring the relative width 〈kfy2〉1/2/kiz compensates for a minor tilt between the surface normal and the rotation axis.36,37 After proper alignment on the desired axis, the surface is prepared by various methods until a good diffraction pattern is observed. Here, we used LiF single crystal previously irradiated by γ-rays38 giving a pronounced yellow to orange color, and cleaved in the air just before introduction into the vacuum. Subsequent heating at 400 °C during a few hours is usually enough to recombine the color centers and to record clean diffraction images with well-resolved elastic spots. The size of the diffraction spots provides indications of the surface coherence length. The lateral angular resolution corresponding to 1/10 of the Bragg angle indicating a transverse coherence length δy = (kδθ)−1 ∼ 10a with a the lattice unit. The equivalent vertical width suggests a longitudinal coherence length δz/θin almost hundred times larger for θ = 0.57 deg so that 1/θ = 100 (for circular diaphragms δkz = δky so that δz = δy). Thus coherent specular reflection requires a crystal without defect on a surface δS given by 104a2 equivalent to a tiny square hundred by hundred lattice units or 105 Å2.
kiz) is kept constant. In practice, measuring the relative width 〈kfy2〉1/2/kiz compensates for a minor tilt between the surface normal and the rotation axis.36,37 After proper alignment on the desired axis, the surface is prepared by various methods until a good diffraction pattern is observed. Here, we used LiF single crystal previously irradiated by γ-rays38 giving a pronounced yellow to orange color, and cleaved in the air just before introduction into the vacuum. Subsequent heating at 400 °C during a few hours is usually enough to recombine the color centers and to record clean diffraction images with well-resolved elastic spots. The size of the diffraction spots provides indications of the surface coherence length. The lateral angular resolution corresponding to 1/10 of the Bragg angle indicating a transverse coherence length δy = (kδθ)−1 ∼ 10a with a the lattice unit. The equivalent vertical width suggests a longitudinal coherence length δz/θin almost hundred times larger for θ = 0.57 deg so that 1/θ = 100 (for circular diaphragms δkz = δky so that δz = δy). Thus coherent specular reflection requires a crystal without defect on a surface δS given by 104a2 equivalent to a tiny square hundred by hundred lattice units or 105 Å2.
In principle, a T-scan would consist of a simple variation of the target temperature leaving all other parameters unchanged. Unfortunately, this is not compatible with the extreme sensitivity of grazing incidence. In GIFAD, the target surface is easily positioned within 10 to 20 m from the beam: when it is not inserted enough, the primary beam is still present on the image, whereas when it is inserted too much, the direct beam impacts the edge of the ≈1 mm thick crystal and even the scattered beam disappears from the detector. However, thermal expansion of the target crystal and of the manipulator induce much larger displacements as well as minor angular tilts producing major effects in GIFAD (see e.g. the θ3 dependence in Fig. 7). For this reason, we were not able to record the three images displayed in Fig. 3 one after the other. Instead, we had to wait for a stable temperature before realigning the target and restoring a comparable incidence angle. In the following, we rationalize this approach by performing several θ-scan or E-scan at different temperatures. From these variations, we interpolate between measured angular values, for instance with a B-spline, to restore a temperature variation. It should be noted that at elevated temperatures, typically above 800 K, particles emitted from the heating filament produce an additional noise on our detector that may ruin a temperature variation whereas, taking time to find a stable detector bias and data-acquisition-mode can reduce the noise level allowing a more stable θ-scan or E-scan.
4 Elastic and inelastic diffraction
For ideal crystalline surfaces with atoms at the equilibrium position, it has been shown that the rapid movement parallel to the crystal axis (x) is decoupled from the slow one in the (y,z) perpendicular plane.20,21,39–42 Therefore, elastic diffraction of fast atoms along a crystal axis is equivalent to that of a much slower particle with an energy E⊥ = Esin2θ evolving in the averaged potential . Experimentally, this axial channeling approximation (ASCA) results in diffraction taking place only in the (y,z) perpendicular plane14,40,43 (see also32,39 for the cases where the ASCA breaks down.). From a spatial point of view, the elastic diffraction can be seen as the coherent part of the scattered waves and this later can only build up at a location corresponding to the equilibrium position, the one of the center of the vibrational wavefunction. In contrast, inelastic diffraction corresponds to a situation where momentum and/or energy has been exchanged with the surface i.e. with the vibration of the surface atoms or phonons, breaking the exact translation symmetry of the ideal surface and requiring a priori to abandon the ASCA for a full 3D representation.8,9
In TEAS, X-ray or neutron diffraction, this situation is described by the Debye-Waller factor DWF = Ie/I0 = e−σφ2 where σφ2 is the variance of the phase distribution induced the thermal displacement σz of surface atoms. In a Debye model of solids, each atom is described by a local harmonic oscillator with frequency ωD and the thermal amplitude is Gaussian σz(T) resulting in a phase coherence e−σφ2 = e−q2σz2 where q is the projectile momentum. It describes how the elastic diffraction intensity progressively vanishes when the amplitude σz of the thermal disorder becomes comparable to the projectile wavelength λ = h/q. From a momentum point of view, the DWF can be written as e−Er/ħω where Er = q2/2m is the binary recoil energy, which can be interpreted as the Lamb-Dicke probability of recoil-less emission that the harmonic oscillator exchanges the momentum 2q without changing its energy level. This DWF does not apply directly to GIFAD, even when considering λp = λ/sinθin ≫ λ, because the momentum exchange of 2ksinθin needed for specular reflection of the primary beam is acquired via several successive fast gentle collisions with surface atoms. With a rigid lattice model and an exponential repulsive mean planar potential of stiffness Γ, V(z) = V0e−Γz, the trajectory is analytic and the binary momentum exchanges can be calculated to obtain the classical energy loss ΔECl in eqn (1) with mp the projectile mass and a the lattice unit.26,28 The effective number  of binary collision is defined such that N times the individual deflection dθ is the specular deflection 2θin and that N times the individual binary recoil energy Er matches the analytic total energy loss ΔECl = NEr. The DWF for GIFAD writes:
 | (1) |
This naive, purely repulsive description was improved by taking into account an attractive part of the potential, for instance, van der Waals contributions,44–47 responsible for the physisorption well of depth D. In elastic diffraction, the effect of such attraction is the presence of bound-state resonances48,49 and the increase of the rainbow angle at low energy.22 These are naturally accounted for using a quantum approach22,49 or modeled in semi-classical50 or optical method such as the hard corrugated wall by the Beeby correction indicating that the effective impact energy E⊥ increases to E⊥ + D44,51,52 or considering a modified angle of incidence  . The Beeby correction also decreases significantly the DWF in TEAS.53 In GIFAD, we also found that the mere presence of a tiny well significantly modifies the stiffness of the potential by bringing the turning point much closer to the surface plane.29 This can be expressed quantitatively using a Morse potential VM(z) = D(e−Γ(z–z0)–2e−Γ/2(z–z0)) and looking for the turning point zt where VM(zt) = E⊥ the effective stiffness is:
 | (2) |
This increased stiffness was already identified in TEAS54 but it has much less consequence since at normal incidence the projectile hits a single surface atom, only the time scale τ ≈ Γ/v// depends on Γ not the magnitude of the exchanged momentum 2q and therefore not the coherence ratio. It is the reverse in grazing scattering, for identical values of E⊥ the time scale for bouncing from the surface are identical in TEAS or GIFAD, but the time needed for a single quasi binary collision is now independent on Γeff, while its magnitude ≈2q/N depends directly on the effective stiffness Γeff. In summary, for GIFAD, the stiffness Γeff governs the momentum transferred in each collision, a stiffer interaction potential needs fewer collisions for specular reflection and each of them becomes more violent leading to an overall reduction of the DWF.
At the atomic level, the temperature is modeled by the spatial extend of a surface atom of mass m, which, in a Debye harmonic model is Gaussian profile with  , where TD is the Debye temperature such that ħω = kBTD with kB the Boltzmann constant.
5 Results
5.1 Orientation of the surface
When investigating the polar scattering profile,29 it was shown that the shape of the polar scattering profile does not depend significantly on the orientation of the surface. This is illustrated in Fig. 5 and we have checked that this similarity remains valid at different temperatures. Since both the data acquisition and the data analysis are simpler for random orientation of the surface where only one specular order (m = 0) is present, most of the temperature variations presented here correspond to this crystal orientation. The other data were recorded along the [100] direction where the corrugation amplitude is reduced generating fewer diffraction orders as visible when comparing Fig. 5a with Fig. 5b.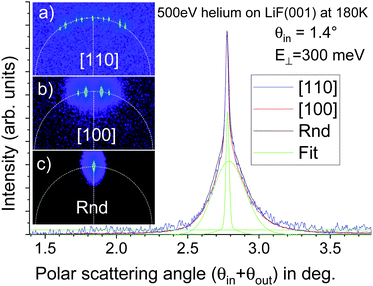 | ||
| Fig. 5 (a–c) are raw diffraction images of 500 eV helium incident at 1.4° on LiF at 180 K oriented along the [110], [100], and random direction, respectively (in part, taken from29). The resulting polar scattering profiles are almost identical, with a narrow elastic peak at θout = θin on top of a broader peak fitted by a log-normal profile27 (green curves). | ||
5.2 Bragg angle and form factor
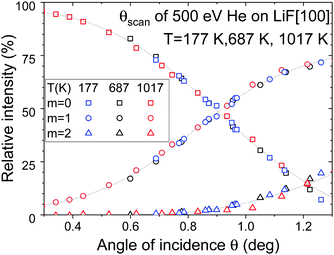
The main focus of this paper is the temperature dependence of the elastic ratio which is presumed to depend mainly on the thermal movement of the surface atoms. When analyzing the intensity on the Laue circle as displayed in Fig. 2c), we can extract the value of the Bragg angle as well as the relative intensities Im associated with each diffraction order m. Both could change with the temperature due to thermal expansion and possible reconstruction of the surface. This could be investigated in detail but we have only checked that the surface equilibrium positions and GIFAD form factor do not change significantly. The evolution of the Bragg angle is compatible with the thermal expansion coefficient measured by TEAS55 and the Fig. 6 shows that in spite of important variation of the scattering profiles visible in Fig. 3 and 4, the relative intensities Im measured along the [100] direction do not change significantly with temperature. This aspect is not discussed further because, in practice, it is by-passed when analyzing the random direction where the reciprocal lattice vector is absent.5.3 Sample quality
All our samples have been prepared by cleaving at air LiF crystals previously irradiated by γ rays,38 however, the Debye-Waller factor varies from sample to sample and also depend on the actual part of the surface illuminated by the atomic beam. As a worst case, we experienced a variation up to almost a factor two, after changing the target orientation and position when switching from Random to [100] direction. Exploring a few target positions is usually enough to optimize the DWF. We also observed a slow degradation of the diffraction images with time even at a few 10−10 mb pressure. When taking a sample that was left in a vacuum for a few weeks, the measured DWF is systematically lower, even after a short thermal treatment. This is illustrated in Fig. 7 where three sets of data recorded on different samples are reported. In spite of a scattering of data points in each set, the data follow different curves and therefore different DWF, but the trends are similar. In the final analysis, we have kept only two samples with large enough temperature variations and we provide the results as separate sets.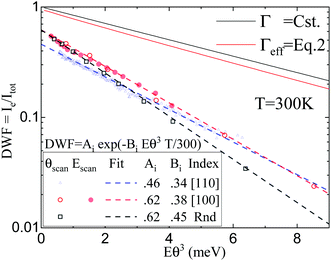 | ||
Fig. 7 The DWF =  from 3 LiF samples are reported as a function of Eθ3. The dotted lines are fits to the data while the solid lines are numerical prediction of eqn (1) with (red A = 0.94, B = 0.19) and without corrections (black A = 1, B = 0.17) due to the attraction towards the surface. from 3 LiF samples are reported as a function of Eθ3. The dotted lines are fits to the data while the solid lines are numerical prediction of eqn (1) with (red A = 0.94, B = 0.19) and without corrections (black A = 1, B = 0.17) due to the attraction towards the surface. | ||
5.4 Energy and angular variations
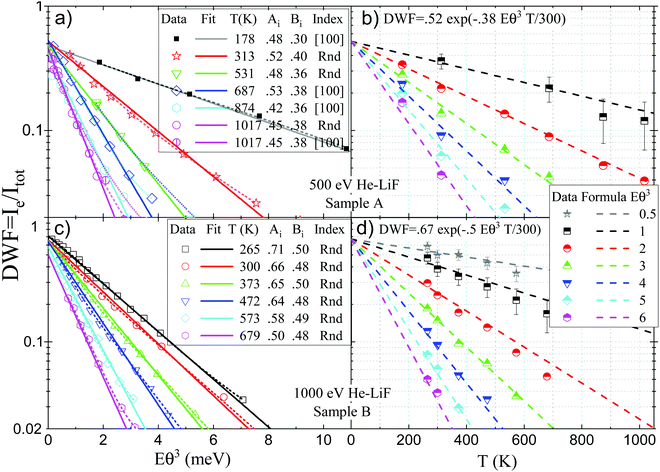
As detailed in Section 4, the effective DWF adapted to GIFAD is expected to scale with exp(−Eθin3) where E is the primary beam energy and θin the angle of incidence. This was suggested from the spatial approach7 considering that the scattering by a row of N atoms should have a mean thermal amplitude 〈σz2〉 = σz2/N or from momentum transfer along the trajectory26,28 because the classical recoil energy loss is also expected to scale with Eθin3. This dependence was first observed at room temperature by reporting DWF measured on a large set of energy and incidence angles.29 The Fig. 8(a and c) display similar dependence's recorded during E-scan and θ-scan at different temperatures. All curves indicate a pronounced exponential decay illustrated by the straight lines resulting from independent fits DWF = Aiexp![[thin space (1/6-em)]](https://www.rsc.org/images/entities/char_2009.gif) (−BiEθ3T/300) where both Ai and Bi were left free and without any weighting of the data.
(−BiEθ3T/300) where both Ai and Bi were left free and without any weighting of the data.
5.5 Temperature dependence
According to the announced strategy, we do not use the fits of Fig. 8(a) to evaluate the temperature dependence but we use the B-spline interpolation of the data, plotted as dotted lines Fig. 8(a) to produce the temperature dependence displayed in Fig. 8(b) at fixed values of Eθ3 between 0.5 meV and 6 meV. Here again, the exponential character is readily visible. In contrast with Fig. 8(a), we now try to apply a unique formula to describe all the data. The adjustment was performed by changing step-wise the parameters A and B until a decent visual impression is obtained. In practice, we could have used the data from the fits through the Eθ3 variation Fig. 8(a and c) but this would induce a possible bias forcing the final dependence.In TEAS, the Beeby correction to the DWF alone is significant and limits the maximum coherence, it is often used to estimate the D value (see e.g.2,44,56). This is not the case in GIFAD, a numerical evaluation, reported as full lines in Fig. 7 indicates that these corrections have a weak influence both on the magnitude and the exponential range.
5.6 The inelastic scattering width
The polar inelastic scattering profile is fitted log-normal form27 and the relative width w are reported in Fig. 9(a and b) as a function of the perpendicular energy E⊥, a quantity that governs the distance of closest approach to the surface. The fact that this width was found29 to depend mainly on E⊥ = Eθ2 indicates that it is sensitive to the magnitude of the most violent inelastic collisions along the trajectory rather than to the integral effect of such collision which would be closer to Eθ3. Assuming that the inelastic collision is well-modeled by classical mechanics, the thermal motion σz(T) of the surface atom induces, for each collision a log-normal scattering profile having a width dw = Γσz26,28 or, equivalently a contribution to the angular straggling dσθ = Γσzdθ where dθ is the elastic deflection angle in this collision already estimated as dθ = (θin + θout)/N. Adding the N individual variances dσθ2 or using the mean log-normal width the classical scattering width is predicted:
 | (3) |
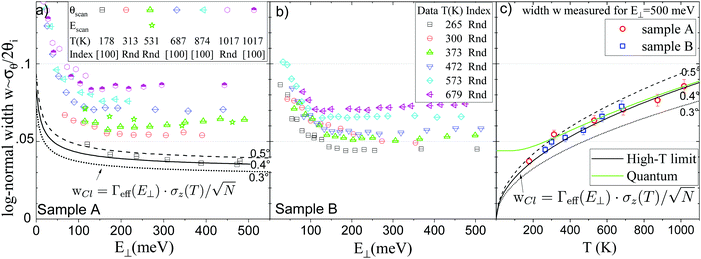 | ||
| Fig. 9 (a and b) inelastic scattering width w as a function of E⊥ = Eθ2. The increase at low E⊥ is mainly due to Γeff(E⊥). The w measured at the asymptotic value E⊥ = 500 meV are reported in panel (c) with the mean thermal amplitude σz2(T). The lines in (a and c) correspond to eqn (3) with different angles in the evaluation of N. (see text) The green curve marked as Quantum takes the zero point energy into account. | ||
The comparison with experiment is tricky, the eqn (3) reproduced the evolution during an E-scan but not during a θ-scan while the experiment gives similar results during E-scan and θ-scan.29 In this respect, the following discussion is only qualitative. More precisely, during an E-scan where θi is fixed N would stay constant so that, neglecting here the Beeby correction, wCl∝Γσz would remain constant. However, as already observed at room temperature29 and in Fig. 9(a and b) a sharp increase of w is observed at low E⊥. The agreement was established by taking into account the attractive forces i.e. by replacing Γ by Γeff from eqn (2). The increase at low energy could be then be attributed to the enhanced stiffness at low energy.29 The full, dashed and dotted lines indicate how the absolute values of wCl depend on the angle of incidence of the hypothetical equivalent E-scan. The 5.5c) reports the value of w measured at E⊥ = 500 meV where is becomes stable. The lines using the same eqn (3) now indicate that the evolution of the plateau values in Fig. 9(a and b) is compatible with the expected variation of σz even if the low-temperature zero point motion (green curve) is not visible. The physical parameter D = 8.5 meV48 and TD = 550 K17 correspond to well-accepted values in the literature and Γ = 3.5 Å−1 was derived in a quantum calculation.49 It is close to the asymptotic value  Å−1 where W = 12.2 ± 0.5 eV is the work-function of LiF. Once again, the semi-quantitative agreement should be balanced by the fact that the model does not predict the observed similar behavior of w(E⊥) during an E-scan and a θ-scan.
6 Discussion
With the LiF samples used here, the Fig. 8(b and d) indicate that GIFAD is not able to provide an internal value of the temperature with an accuracy better than 20–50 °C. Combining consistently the width w and the DWF could improve the accuracy but the sensitivity to sample quality appears as a severe limitation. In contrast, if the main focus is to optimize the growth parameters to improve the surface quality in terms of coherence length, i.e. mean distance LC between defects, GIFAD offers a unique handle with a very broad range of operation. First, a simple φ-scan36 can identify crystallographic axis even without diffraction offering a first estimate of LCvia the peak to background ratio of the φ-scan.14 When diffraction becomes visible, the presence of elastic diffraction, and its associated elastic peak width, readily gives insights on LC. Then, optimizing the DWF could give real time access to very large defect-free surfaces with the advantage that the diagnostic is performed simultaneously on an illuminated surface S ≈ ∅2/θ on the order of 1 mm2 for a diaphragm size of ∅ = 100 μm. This diagnostic is complementary to the elastic diffracted intensity which indicates in real time the detailed topology of the terminal layer. We have shown here that the width w of the scattering profile can be understood qualitatively in terms of a classical model using an effective stiffness Γeff(E⊥) and a thermal amplitude σz(T). This suggests that classical scattering simulation in grazing incidence, in general57 and in the context of GIFAD8,9 should produce a fair estimate of the inelastic profile. However, In fine, a quantum inelastic treatment as developed in TEAS58 and recent attempts to encompass both elastic and inelastic aspects under grazing incidence59 should help connecting to the real world of surface phonons and their possible specific coupling to the multiple collision regime.7 Conclusions
Using a definition based on the analysis of the polar scattering profile to isolate the elastic and inelastic components, the DWF can be evaluated for each diffraction image. At comparable energy and incidence angle, the DWF is found to be independent of the crystal axis probed. Due to the extreme sensitivity to mechanical deformations associated with temperature variations, the T-scans were performed indirectly via interpolation of θ-scan and E-scan at different temperatures. At each temperature, the DWF specific to the multiple collision regime of GIFAD is shown to depend primarily on Eθ3, differing from Eθ2 in TEAS where a single collision regime prevails. Within the present accuracy, a simple exponential decay with temperature is observed but, different LiF samples produce slightly different decay parameters and maximum coherence suggesting an important contribution of the defect density and terrace size distribution. The effect of the attractive forces towards the surface have been investigated in TEAS. It produces an increased impact energy, known as the Beeby correction, and an increased stiffness of the surface mean-planar potential-energy-surface due to a closer distance of approach towards the surface.54 They also have the same consequences regarding the elastic diffracted intensities in GIFAD or TEAS but very different consequences in the inelastic behavior of GIFAD and TEAS. In TEAS, the Beeby correction is known to limit the maximum possible DWF44 while in GIFAD, the eqn (1) and Fig. 7c) indicate only a weak influence on the maximum DWF. As to the effective stiffness Γeff,54 it does not directly affect the DWF in TEAS, whereas, it enters the DWF factor in GIFAD because each binary collision becomes more violent as evidenced by the sharp increase of the inelastic scattering width w at low values of Eθ2 in Fig. 9(a and b). The effect of Γeff on the DWF, though larger than the Beeby correction is also limited because it is, in part, balanced by the reduced number of collisions needed for specular reflection. Our results also suggest an important contribution of surface defect to decoherence in grazing conditions but this aspect is yet unexplored.Conflicts of interest
There are no conflicts to declare.Acknowledgements
The image in Fig. 1 was recorded inside a MBE vessel in collaboration with P. Atkinson, M. Eddrief, V. Etgens, F. Finocchi from Institut des NanoSciences de Paris and H. Khemliche, A. Momeni A.G. Borisov, A. Zugarramurdi from ISMO. We are grateful to Hynd Remita from the Institut de Chimie Physique for the irradiation of the LiF samples. This work has been funded by the Agence Nationale de la Recherche (contract ANR-2011-EMMA-003-01) and Chinese Scholarship Council (CSC) Grant reference number 201806180025.References
- G. Anemone, A. Al Taleb, G. Benedek, A. Castellanos-Gomez and D. Farías, Electron-phonon coupling constant of 2H-MoS2 (0001) from helium-atom scattering, J. Phys. Chem. C, 2019, 123(6), 3682–3686 CrossRef CAS.
- A. Tamtögl, A. Ruckhofer, D. Campi, W. Allison and W. E. Ernst, Atom-surface van der Waals potentials of topological insulators and semimetals from scattering measurements, Phys. Chem. Chem. Phys., 2021, 23, 7637–7652 RSC.
- V. Romankov and J. Dreiser, Morphology of ultrathin lithium fluoride deposited on ag(100): Dendrites versus islands, Phys. Rev. B, 2021, 104, 195401 CrossRef CAS.
- P. Rousseau, H. Khemliche, A. G. Borisov and P. Roncin, Quantum scattering of fast atoms and molecules on surfaces, Phys. Rev. Lett., 2007, 98, 016104 CrossRef CAS PubMed.
- A. Schüller, S. Wethekam and H. Winter, Diffraction of fast atomic projectiles during grazing scattering from a LiF(001) surface, Phys. Rev. Lett., 2007, 98, 016103 CrossRef PubMed.
- M. Debiossac, A. Zugarramurdi, H. Khemliche, P. Roncin, A. G. Borisov, A. Momeni, P. Atkinson, M. Eddrief, F. Finocchi and V. H. Etgens, Combined experimental and theoretical study of fast atom diffraction on the 2(2 × 4) reconstructed GaAs(001) surface, Phys. Rev. B: Condens. Matter Mater. Phys., 2014, 90, 155308 CrossRef.
- P. Rousseau, H. Khemliche, N. Bundaleski, P. Soulisse, A. Momeni and P. Roncin, Surface analysis with grazing incidence fast atom diffraction (GIFAD), J. Phys.: Conf. Ser., 2008, 133, 012013 CrossRef.
- L. Frisco and M. S. Gravielle, Phonon contribution in grazing-incidence fast atom diffraction from insulator surfaces, Phys. Rev. A, 2019, 100, 062703 CrossRef CAS.
- L. Frisco and M. S. Gravielle, Thermal effects on helium scattering from LiF(001) at grazing incidence, Phys. Rev. A, 2020, 102, 062821 CrossRef CAS.
- V. A. Morosov, A. Kalinin, Z. Szilagyi, M. Barat and P. Roncin, 2π spectrometer: A new apparatus for the investigation of ion surface interaction, Rev. Sci. Instrum., 1996, 67(6), 2163 CrossRef CAS.
- J. S. Lapington, A comparison of readout techniques for high-resolution imaging with microchannel plate detectors, Nucl. Instrum. Methods Phys. Res., Sect. A, 2004, 525(1), 361–365 CrossRef CAS.
- S. Lupone, S. Damoy, A. Husseen, N. Briand, M. Debiossac, S. Tall and P. Roncin, Note: A large open ratio, time, and position sensitive detector for time of flight measurements, Rev. Sci. Instrum., 2015, 86(12), 126115 CrossRef CAS PubMed.
- S. Lupone, P. Soulisse and P. Roncin, A large area high resolution imaging detector for fast atom diffraction, Nucl. Instrum. Methods Phys. Res., Sect. B, 2018, 427, 95–99 CrossRef CAS.
- M. Debiossac, P. Pan and P. Roncin, Grazing incidence fast atom diffraction, similarities and differences with thermal energy atom scattering (TEAS), Phys. Chem. Chem. Phys., 2021, 11(12), 4564–4569 Search PubMed.
- P. Atkinson, M. Eddrief, V. H. Etgens, H. Khemliche, M. Debiossac, A. Momeni, M. Mulier, B. Lalmi and P. Roncin, Dynamic grazing incidence fast atom diffraction during molecular beam epitaxial growth of GaAs, Appl. Phys. Lett., 2014, 105(2), 021602 CrossRef.
- M. Debiossac, P. Atkinson, A. Zugarramurdi, M. Eddrief, F. Finocchi, V. H. Etgens, A. Momeni, H. Khemliche, A. G. Borisov and P. Roncin, Fast atom diffraction inside a molecular beam epitaxy chamber, a rich combination, Appl. Surf. Sci., 2017, 391, 53–58 CrossRef CAS.
- A. Schüller, S. Wethekam, D. Blauth, H. Winter, F. Aigner, N. Simonović, B. Solleder, J. Burgdörfer and L. Wirtz, Rumpling of LiF(001) surface from fast atom diffraction, Phys. Rev. A: At., Mol., Opt. Phys., 2010, 82, 062902 CrossRef.
- H. Khemliche, P. Rousseau, P. Roncin, V. H. Etgens and F. Finocchi, Grazing incidence fast atom diffraction: An innovative approach to surface structure analysis, Appl. Phys. Lett., 2009, 95(15), 151901 CrossRef.
- F. Aigner, N. Simonović, B. Solleder, L. Wirtz and J. Burgdörfer, Suppression of decoherence in fast-atom diffraction at surfaces, Phys. Rev. Lett., 2008, 101, 253201 CrossRef CAS PubMed.
- A. Zugarramurdi and A. G. Borisov, Transition from fast to slow atom diffraction, Phys. Rev. A: At., Mol., Opt. Phys., 2012, 86, 062903 CrossRef.
- A. S. Muzas, F. Gatti, F. Martín and C. Díaz, Diffraction of H from LiF(001): From slow normal incidence to fast grazing incidence, Nucl. Instrum. Methods Phys. Res., Sect. B, 2016, 382, 49–53 CrossRef CAS.
- M. Debiossac, P. Roncin and A. G. Borisov, Refraction of fast Ne atoms in the attractive well of a LiF surface, J. Phys. Chem. Lett., 2020, 11(12), 4564–4569 CrossRef CAS PubMed.
- H. Winter, Collisions of atoms and ions with surfaces under grazing incidence, Phys. Rep., 2002, 367(5), 387–582 CrossRef CAS.
- P. Roncin, J. Villette, J. P. Atanas and H. Khemliche, Energy loss of low energy protons on LiF(100): Surface excitation and H-mediated electron emission, Phys. Rev. Lett., 1999, 83, 864–867 CrossRef CAS.
- M. Debiossac and P. Roncin, Image processing for grazing incidence fast atom diffraction, Nucl. Instrum. Methods Phys. Res., Sect. B, 2016, 382, 36–41 CrossRef CAS.
- P. Roncin and M. Debiossac, Elastic and inelastic diffraction of fast atoms, Debye-Waller factor, and Mössbauer-Lamb-Dicke regime, Phys. Rev. B, 2017, 96, 035415 CrossRef.
-
log-normal distribution.
 .
. - J. R. Manson, H. Khemliche and P. Roncin, Theory of grazing incidence diffraction of fast atoms and molecules from surfaces, Phys. Rev. B: Condens. Matter Mater. Phys., 2008, 78, 155408 CrossRef.
- P. Pan, M. Debiossac and P. Roncin, Polar inelastic profiles in fast-atom diffraction at surfaces, Phys. Rev. B, 2021, 104, 165415 CrossRef CAS.
- D. Farias and K.-H. Rieder, Atomic beam diffraction from solid surfaces, Rep. Prog. Phys., 1998, 61(12), 1575–1664 CrossRef CAS.
- P. Sutter, M. Minniti, P. Albrecht, D. Farías, R. Miranda and E. Sutter, A high-reflectivity, ambient-stable graphene mirror for neutral atomic and molecular beams, Appl. Phys. Lett., 2011, 99(21), 211907 CrossRef.
- M. Busch, J. Seifert, E. Meyer and H. Winter, Evidence for longitudinal coherence in fast atom diffraction, Phys. Rev. B: Condens. Matter Mater. Phys., 2012, 86, 241402 CrossRef.
- N. Bundaleski, P. Soulisse, A. Momeni, H. Khemliche and P. Roncin, Decoherence in fast atom diffraction from surfaces, Nucl. Instrum. Methods Phys. Res., Sect. B, 2011, 269(11), 1216–1220 CrossRef CAS.
- Please note that, when reproducing the Fig. 7 of ref. 7 in ref. 33 the data column was mistakenly replaced by the line to guide the eyes giving an impression of being perfectly aligned, the error was reproduced in ref. 43.
- F. E. Feiten, J. Seifert, J. Paier, H. Kuhlenbeck, H. Winter, J. Sauer and H.-J. Freund, Surface structure of V2O3 revisited, Phys. Rev. Lett., 2015, 114, 216101 CrossRef PubMed.
- N. Kalashnyk, H. Khemliche and P. Roncin, Atom beam triangulation of organic layers at 100 mev normal energy: self-assembled perylene on Ag(110) at room temperature, Appl. Surf. Sci., 2016, 364, 235–240 CrossRef CAS.
- M. Sereno, S. Lupone, M. Debiossac, N. Kalashnyk and P. Roncin, Active correction of the tilt angle of the surface plane with respect to the rotation axis during azimuthal scan, Nucl. Instrum. Methods Phys. Res., Sect. B, 2016, 382, 123–126 CrossRef CAS.
- J. J. Gilman, C. Knudsen and W. P. Walsh, Cleavage cracks and dislocations in LiF crystals, J. Appl. Phys., 1958, 29(4), 601–607 CrossRef CAS.
- A. Zugarramurdi and A. G. Borisov, When fast atom diffraction turns 3D, Nucl. Instrum. Methods Phys. Res., Sect. B, 2013, 317, 83–89 CrossRef CAS.
- D. Farías, C. Díaz, P. Nieto, A. Salin and F. Martín, Pronounced out-of-plane diffraction of H2 molecules from a Pd(111) surface, Chem. Phys. Lett., 2004, 390(1), 250 CrossRef.
- M. Debiossac and P. Roncin, Atomic diffraction under oblique incidence: An analytical expression, Phys. Rev. A: At., Mol., Opt. Phys., 2014, 90, 054701 CrossRef.
- D. M. Danailov and D. S. Karpuzov, Total reflection of energetic ions from crystal surfaces at glancing incidence, Can. J. Phys., 1997, 75(4), 197–209 CrossRef CAS.
- H. Winter and A. Schüller, Fast atom diffraction during grazing scattering from surfaces, Prog. Surf. Sci., 2011, 86(9), 169–221 CrossRef CAS.
- J. L. Beeby and L. Dobrzynski, The scattering of atoms from surfaces: a model, J. Phys. C-Solid State Phys., 1971, 4(11), 1269–1278 CrossRef CAS.
- G. A. Bocan, J. D. Fuhr and M. S. Gravielle, van der Waals effects on grazing-incidence fast-atom diffraction for H on LiF(001), Phys. Rev. A, 2016, 94, 022711 CrossRef.
- M. del Cueto, A. S. Muzas, G. Füchsel, F. Gatti, F. Martín and C. Díaz, Role of van der Waals forces in the diffraction of noble gases from metal surfaces, Phys. Rev. B, 2016, 93, 060301 CrossRef.
- M. S. Gravielle, J. E. Miraglia and G. A. Bocan, Interaction potentials for atoms in front of a LiF(001) surface, 2019, ch. 7, pp. 177–203 Search PubMed.
- A. P. Jardine, S. Dworski, P. Fouquet, G. Alexandrowicz, D. J. Riley, G. Y. H. Lee, J. Ellis and W. Allison, Ultrahigh-resolution spin-echo measurement of surface potential energy landscapes, Science, 2004, 304(5678), 1790 CrossRef CAS PubMed.
- M. Debiossac, A. Zugarramurdi, P. Lunca-Popa, A. Momeni, H. Khemliche, A. G. Borisov and P. Roncin, Transient quantum trapping of fast atoms at surfaces, Phys. Rev. Lett., 2014, 112, 023203 CrossRef CAS PubMed.
- G. A. Bocan, H. Breiss, A. Szilasi, S. Momeni, E. M. Staicu-Casagrande, E. A. Sánchez, M. S. Gravielle and H. Khemliche, Dynamical effects as a window into van der Waals interactions in grazing-incidence fast He-atom diffraction from KCl, Phys. Rev. B, 2021, 104, 235401 CrossRef CAS.
- A. Al Taleb, G. Anemone, L. Zhou, H. Guo and D. Farías, Diffraction of CH4 from a metal surface, J. Phys. Chem. Lett., 2019, 10(7), 1574–1580 CrossRef CAS PubMed.
- M. Debiossac, A. Zugarramurdi, Z. Mu, P. Lunca-Popa, A. J. Mayne and P. Roncin, Helium diffraction on SiC grown graphene: Qualitative and quantitative descriptions with the hard-corrugated-wall model, Phys. Rev. B, 2016, 94, 205403 CrossRef.
- G. Vidali and C. Hutchings, Measurement of the Debye-Waller factor for He-LiF, Phys. Rev. B: Condens. Matter Mater. Phys., 1988, 37, 10374–10377 CrossRef CAS PubMed.
- K. H. Rieder and N. Garcia, Energy dependence and softness of the potential for He scattering from Ni(110), Phys. Rev. Lett., 1982, 49, 43–46 CrossRef CAS.
- Y. Ekinci and J. P. Toennies, Thermal expansion of the LiF(001) surface, Surf. Sci., 2004, 563(1), 127–134 CrossRef CAS.
- D. Farías, R. Miranda and K. H. Rieder, Energy dependence of diffractive and rotationally inelastic scattering of D2 from NiAl(110), J. Chem. Phys., 2002, 117(5), 2255–2263 CrossRef.
- D. M. Danailov, R. Pfandzelter, T. Igel, H. Winter and K. Gärtner, Test of the interatomic potential in the ev-region by glancing-angle scattering of He-atoms from Fe(001), Appl. Surf. Sci., 2001, 171(1), 113–119 CrossRef CAS.
- P. Kraus, A. Tamtögl, M. Mayrhofer-Reinhartshuber, F. Apolloner, Ch Gösweiner, S. Miret-Artés and W. E. Ernst, Surface structure of Bi(111) from helium atom scattering measurements. inelastic close-coupling formalism, J. Phys. Chem. C, 2015, 119(30), 17235 CrossRef CAS PubMed.
- M. C. Schram and E. J. Heller, Approach to coherent interference fringes in helium-surface scattering, Phys. Rev. A, 2018, 98, 022137 CrossRef CAS.
| This journal is © the Owner Societies 2022 |

