Investigation of upconversion and photoacoustic properties of NIR activated Er3+/Yb3+ doped [RE]VO4 (RE = Y, Gd) phosphors for photothermal conversion applications
Cinumon
K. V.
a,
Minarul I.
Sarkar
b and
Kaushal
Kumar
 *a
*a
aOptical Materials and Bio-imaging Research Laboratory, Department of Physics, Indian Institute of Technology (Indian School of Mines), Dhanbad, Jharkhand – 826004, India. E-mail: kkumar@iitism.ac.in
bBiomedical and Nano-Bioscience Engineering Lab, School of Physics, Indian Institute of Science Education and Research Thiruvananthapuram, Kerala – 695551, India
First published on 19th August 2024
Abstract
Er3+/Yb3+ doped YVO4 and GdVO4 phosphors were prepared through the combustion technique and were characterized through various techniques. XRD has revealed a tetragonal structure for YVO4 and GdVO4 phosphors. The 980 nm excited upconversion emission has resulted in intense green upconversion emission from both samples. However, the GdVO4 sample has shown higher emission intensity. Photoacoustic heat generation in samples has been studied using the same 980 nm excitation, and in this case, the YVO4 phosphor has shown higher heat generation. The YVO4 phosphor again has shown lower heat dissipation and, hence, higher photo-thermal conversion efficiency upon irradiation of the sample.
1. Introduction
The extensive study of luminous materials has been driven by the quest for novel substances capable of functioning effectively in applications such as lighting, sensing, visualisation, nonlinear optics, bioimaging and therapy.1 A class of luminous materials known as upconversion (UC) phosphors take advantage of the unique wavelength-converting properties of rare-earth/lanthanide (Ln3+) ions.2 Rare earth-based phosphors are efficient UC materials that absorb multiple photons in the low-frequency infrared region (IR) and have emission spectra in the higher energy visible region.3 In this anti-Stokes luminescence, multiple photons with lower energy are transformed into a single photon having higher energy. This process involves the transfer of accumulated energy in the system, typically absorbed by sensitiser ions, to activator ions.4Phosphors based on rare-earth/lanthanide (Ln3+) elements hold appeal due to their distinctive spectral characteristics, including narrow emission and absorption lines and comparatively prolonged emission durations. When incorporated into an inorganic host lattice, the long-lived ladder-like 4f–4f intermediate energy states of these ions enable them to absorb multiphotons to yield anti-Stokes luminescence.5 The efficiency of phosphors is influenced by factors such as the host composition, crystallinity, concentration of structural defects, component compositions, distribution of dopant ions, etc.6
Dopants of rare earths can be introduced into various organic as well as inorganic host materials. Among them, the rare-earth orthovanadates [RE]VO4 (such as YVO4, GdVO4, etc.) as inorganic hosts are notable for their innate self-activation properties. Vanadate-based materials have a significantly better thermal stability, even above 1300 K, than their fluoride counterparts, which usually begin to oxidise and break down after 700 K.7 Their physical and chemical stabilities and favourable band gap and phonon frequency conditions make them excellent host material choices.8 They are outstandingly flexible hosts for lanthanide (Ln3+) optical centres with down and upconversion emissions. When lanthanide ions (Ln3+) are incorporated into their internal structure, these materials demonstrate the luminescence phenomenon upon suitable photo-excitation, displaying distinct, sharp, and narrow emission bands corresponding to the Ln3+ 4f–4f transitions.5
For years, significant progress has been achieved in developing luminescent materials utilising GdVO4 and YVO4 as host lattices. Other lanthanides can easily replace Gd3+ and Y3+ because of their similar valence and ionic radii. GdVO4 and YVO4 crystallise into a tetragonal zircon-type structure under ambient conditions.9 Comprehensive research has been done on materials doped with erbium (Er3+) and ytterbium (Yb3+) ions. This is because Er3+ ions have beneficial metastable energy levels with longer lifetimes and emissions in the green and red wavelength ranges. These materials are widely used in various fields, such as security inks and temperature sensing, and in biological applications. Yb3+ ions have a broad absorption cross-section around 980 nm, facilitating the effective transfer of excitation energy to Er3+ ions.3
Along with the radiative transitions in materials the non-radiative transitions also occur at the same time and these non-radiative transitions can be detected through the photoacoustic (PA) spectroscopy technique, which was discovered by Alexander Graham Bell.10 This technique initiated a pathway for previously unexplored non-radiative routes of energy transitions in light and matter interaction.11 This technique is widely employed in various applications, including optical and thermal property analysis, quality assessment, trace gas detection, and bioimaging.12,13 In recent times, there has been a remarkable and rapid growth in research on photoacoustic imaging (PAI), driven by its appealing characteristics as a non-invasive, non-ionising, and multiparametric imaging technique. PAI involves the application of temporally confined optical illumination to a target, generating acoustic waves that convey information about the target's photothermal conversion efficiency and spatial geometry.14 The primary advantage of photoacoustic spectroscopy (PAS) lies in its immunity to interferences due to scattered, reflected, or transmitted light. Also, a strong laser source can be used to increase the sensitivity of the device because the strength of the acoustic signal is proportional to the absorbed light intensity.15
There are few studies on the upconversion emission and photoacoustic properties of rare-earth co-doped orthovanadate phosphors. Among the reported upconversion phosphors, the first red-emitting Eu3+ doped YVO4 phosphors facilitated the advancement of colour television display technology.16 Sheng et al. showed the use of rare earth-doped phosphors as contrast agents in dual-modality luminescence–photoacoustic (PA) imaging to improve the signal-to-noise ratio (SNR) and resolution. Using a single NIR excitation wavelength within biological windows, they simultaneously exploited both radiative and non-radiative de-excitations to record contrast signals in PA and luminescence.17
Thao et al. developed an efficient process for synthesising large quantities of Yb3+, Er3+, and Eu3+ triplet-doped YVO4. The prepared material showed strong red emission when excited by ultraviolet light (254 nm) and intense green emission when excited by infrared light (980 nm). Its bioimaging feasibility was also investigated by modifying its surface with L-cysteine (Cys) and L-glutathione (GSH).18 Mahalingam et al. investigated the effect of increasing the Yb3+ concentration in Er3+/Yb3+-doped GdVO4 nanocrystals to intensify the green-to-red emission ratio.19 Stopikowska et al. employed a combination of hydrothermal and calcination methods to synthesise single and co-doped YVO4:Yb3+,Er3+. When subjected to continuous laser excitations at 785 nm and 975 nm, the synthesised phosphors exhibited pure green up-conversion luminescence.7
Using the solid-state reaction technique, our research group previously successfully synthesised the monoclinic phase LaVO4 and the tetragonal phase GdVO4 co-doped with Tm3+ and Yb3+.20 The non-thermally coupled levels, 3F3 (700 nm) and 1G4 (475 nm), were used for optical thermometry under 980 nm laser excitation, and the LaVO4:Tm3+/Yb3+ phosphor showed a higher sensing sensitivity than GdVO4:Tm3+/Yb3+. Roy et al. reported a comparative investigation of the upconversion (UC) emissions. They tuned the emission colour and intensity of YVO4, YTaO4, and YNbO4 doped with Ho3+/Yb3+ by altering the vanadate(V) concentration.21
In this work, 2%Er3+ and 10%Yb3+ co-doped rare-earth orthovanadate ([RE]VO4, RE = Y, Gd) phosphors were synthesized via a low-temperature solution-combustion process. The structural, morphological, surface and absorption characteristics of the prepared samples were investigated using powder X-ray diffraction (XRD), FTIR, SEM, and UV-vis-NIR absorption techniques. The radiative and non-radiative emission characteristics were analyzed using upconversion (UC) and photoacoustic (PA) spectroscopic techniques. The thermal conversion efficiency of the samples was also determined.
2. Experimental
2.1 Chemicals used
For synthesis, yttrium nitrate (Y(NO3)·xH2O; 99.9%; CDH, India), gadolinium(III) nitrate (Gd(NO3)·6H2O; 99.9%; CDH, India), ytterbium(III) oxide (Yb2O3; 99.99%; Alfa Aesar, USA), erbium(III) oxide (Er2O3; 99.99%; Alfa Aesar, USA), ammonium-m-vanadate (NH4VO3; 99%; CDH, India), urea (NH2CONH2; 99.5% SRL, India) and nitric acid (75.0%, Finar, India) were used. Deionised (DI) water (Millipore Milli-Q water purifier) was used throughout the synthesis. All materials and chemicals were used as obtained and were not subjected to any purification processes.2.2 Synthesis of the samples
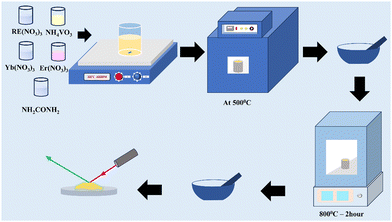
Due to its rapid reaction times and minimal temperature demands, the combustion method is feasible for generating luminous materials, especially those infused with rare earth (RE) dopants.22 In the present study, Er3+/Yb3+doped rare earth vanadate ([RE]VO4) phosphors were synthesised via the solution combustion method. Urea served as the fuel agent in the process. The composition comprised 88 mol% [RE]VO4, 2 mol% Er2O3, and 10 mol% Yb2O3.Fig. 1 summarises the different stages involved in the synthesis process. The oxide precursors were converted into equivalent nitrates by processing them with concentrated nitric acid at 80 °C until a clear solution was obtained. The various nitrate precursors were then dissolved in deionised water and mixed at 90 °C while constantly stirring. Once they were blended properly, NH4VO3 in DI water was added, giving a pale-yellow colour to the mixture. After a few minutes, urea was added, and the mixture was heated further until the mixture turned into gel form. After this, the gel was put into an alumina crucible and kept inside a furnace at 500 °C to initiate the combustion process. Within a few minutes, dense fumes started to appear, followed by combustion, resulting in the formation of yellow foamy products. Using a pestle and mortar, the obtained products were ground well into fine powder and annealed for 2 hours at a temperature of 800 °C.
2.3 Instrumentation
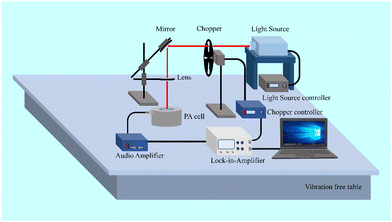
Powder X-ray diffraction was performed for the phase identification of the samples using a high-resolution X-ray diffractometer (Rigaku Smartlab). Field scanning electron microscopy (Zeiss, Supra-55) was used to investigate the morphological characteristics. The absorbance spectra were measured using a UV-vis-NIR absorption spectrometer (Agilent Cary-5000). The PerkinElmer spectrum 2.0 spectroscope was used to record the FT-IR spectra in the form of KBr particles to investigate the vibrational bands and luminescent quenching centres that existed in the sample. A spectrometer based on a charge-coupled device (Avantes, USA, ULS2048X64 spectrometer) and a 980 nm laser source were used to record the UC emission spectra. The photoacoustic spectroscopic data were recorded using a home-assembled photoacoustic spectrometer setup.23 A diagram illustrating the configuration of the photoacoustic spectroscopic system is provided in Fig. 2. The excitation sources were a xenon lamp and a 980 nm laser. Light modulation was achieved using an optical chopper (model SR540) operating within a frequency range of 4 Hz to 3.7 kHz. The acoustic signals produced inside the custom-made photoacoustic cell were detected and amplified using a very sensitive microphone-amplifier setup (Bruel & Kjaer, 50 mV Pa−1). These signals were then processed by a high-end lock-in amplifier (SRS560), which was connected to the chopper controller before being recorded by the computer.3. Results and discussion
3.1 X-ray diffraction (XRD) analysis
The powder XRD data of the samples were recorded in the 2θ range of 10–80°. The structure and phase of the prepared samples annealed at 800 °C were identified from the obtained diffraction spectra. The XRD patterns, as well as the standard card of doped [RE]VO4 samples, are depicted in Fig. 3(a and a′).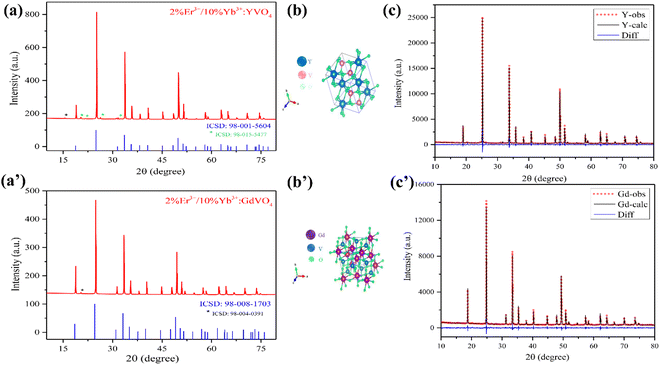 | ||
| Fig. 3 (a and a′) XRD pattern and (b and b′) crystal structure of the unit cell and (c and c′) Rietveld refinement of the XRD patterns of 2%Er3+/10%Yb3+ co-doped YVO4 and GdVO4. | ||
The XRD results demonstrated that both samples are crystallised in their typical zircon tetragonal structure. The diffraction peaks matched well with the typical tetragonal phase of YVO4 (ICSD 98-001-5604) and GdVO4 (ICSD 98-008-1703) with the space group I41/amd.24–26 The most prominent peaks are detected around 2θ values of approximately 25°, 33°, and 49°, corresponding to the (hkl) planes (200), (112), and (312), respectively. Although they are less intense, both samples contained some feeble impurity peaks in their XRD spectra. In YVO4, a few peaks were found in the 2θ range of 15–32°. Among them, peaks around 20°, 23°, 26°, and 32° correspond to the (011), (101), (111), and (200) planes of orthorhombic phased yttrium vanadate(III) (ICSD 98-015-5477), while the peak around 15° may be due to the presence of cubic phased diyttrium divanadate (ICSD 98-016-0600). In the case of GdVO4, only one impurity peak was observed around 20°, which indicates the presence of the orthorhombic phased gadolinium vanadate(III) (ICSD 98-004-0391).
The doping sites of Er3+/Yb3+ ions within the host materials can be determined using the percentage radius variance (Δr) resulting from the doping process, which is given by,27
 | (1) |
Further, Rietveld refinement of the XRD patterns of 2%Er3+ and 10%Yb3+ doped YVO4 and GdVO4 samples was performed to elucidate the phase formation. Fig. 3(c and c′) presents the observed Bragg's diffraction peaks, fitted curve and the corresponding differences of YVO4 and GdVO4 samples. The reliability of the fitting was confirmed by the goodness of the fit parameters Rp, Rwp and GOF. A comprehensive overview of the structural properties of the synthesized samples is presented in Table 1.
| Parameters | YVO4 | GdVO4 |
|---|---|---|
| Space group | I41/amd | I41/amd |
| Cell parameters | a = b = 7.10953(79) Å | a = b = 7.18879(12) Å |
| c = 6.28431(69) Å | c = 6.33402(11) Å | |
| α = β = γ = 90° | α = β = γ = 90° | |
| V = 317.644 Å3 | V = 327.334(13) Å3 | |
| Reliability factors | R p = 6.21 | R p = 4.57 |
| R wp = 8.16 | R wp = 5.84 | |
| GOF = 1.73 | GOF = 1.28 | |
3.2 FE-SEM analysis
The surface morphology and particle size of the prepared samples were examined through FE-SEM analysis. Fig. 4(a and b) presents the FE-SEM images of the rare-earth orthovanadates co-doped with Er3+ and Yb3+. The images revealed that the samples were synthesised in irregular shapes. The particle size distribution was calculated from the FE-SEM images using ImageJ software and is given in Fig. 4(a′ and b′). The average diameter of the samples was found to fall within the 0.8–1.4 μm range.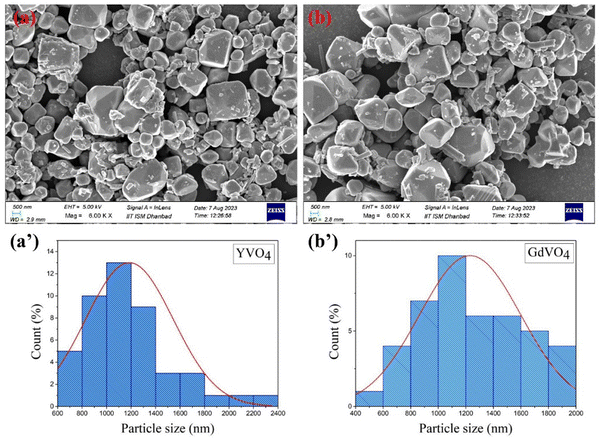 | ||
| Fig. 4 (a) and (b) FE-SEM images and (a′) and (b′) particle size distribution of Er3+/Yb3+ co-doped YVO4 and GdVO4. | ||
3.3 FTIR analysis
Any foreign volatile impurity present in samples along with the maximum phonon frequency of the host can be identified using the Fourier-transform infrared spectroscopy (FTIR) analysis technique.32Fig. 5 illustrates the FTIR spectra recorded within the 450–4000 cm−1 range. The peak at 824 cm−1 is due to the antisymmetric stretching mode of V–O bands present in VO43− units.33 On the other hand, the peaks around 1635 and 3428 cm−1 correspond to the hydroxyl group's stretching (ϑOH) and bending (δOH) vibrations, likely caused by the inherent moisture-absorbing properties of our materials.34 It can be concluded that samples have the same maximum lattice frequency of 824 cm−1.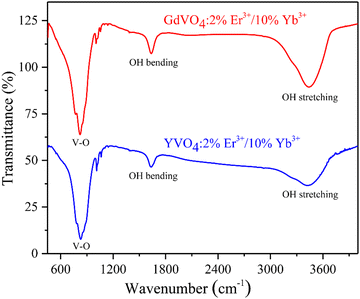 | ||
| Fig. 5 Fourier-transform infrared spectroscopy (FTIR) of 2%Er3+/10%Yb3+ co-doped YVO4 and GdVO4 phosphors. | ||
3.4 UV-visible-NIR absorption spectroscopy
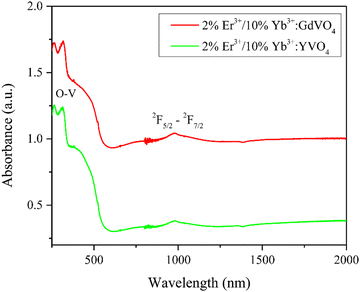
The absorption properties of synthesized phosphors were recorded and analysed in the UV-visible-NIR region. Fig. 6 illustrates the optical absorption spectra of the co-doped rare-earth orthovanadates recorded within the 250–2000 nm wavelength range.Both phosphors exhibited wide absorption bands spanning 250–500 nm, with two prominent peaks centred around 264 and 312 nanometers. The charge transfer state (CTS) transitions between O2− and V5+ ions are the source of these peaks.35 The charge transfer arises from the transition of 2p electrons of excited oxygen ligands (O2−) to the empty 3d orbitals of the central vanadium atom (V5+) in the VO43− groups. As per the molecular orbital theory, this involves the transitions from the 1A2(1T1) ground state to two close-lying 1A1(1E) and 1E(1T2) excited electronic states of the VO43− ions in crystalline hosts. The crystal field reduces the original Td symmetry of VO43− (free ion) to D2d, causing a splitting of the degenerate levels of VO43−.36–38 The broad band in the range of 400 nm in the spectra may be due to the overlapping of different bands of VO43−.39 The absorption band observed at 980 nm is a result of the 2F5/2 to 2F7/2 transition of the Yb3+ ion.40 No other 4f–4f transition of doped ions is seen due to weak absorption by doped ions.
3.5 Upconversion emission study
The anti-Stoke frequency upconversion emission characteristics of the Er3+/Yb3+ co-doped phosphor subjected to the laser excitation at 980 nm are illustrated in Fig. 7(a). The spectra consist of two prominent green emission peaks approximately at 525 nm and 553 nm, originating from the 2H11/2 → 4I15/2 and 4S3/2 → 4I15/2 transitions of the Er3+ ion. Meanwhile, the red emission peak at 660 nm is due to the Er3+ ion's 4F9/2 → 4I15/2 transitions.40,41 Among YVO4 and GdVO4, the latter exhibited the highest emission intensities for all three peaks.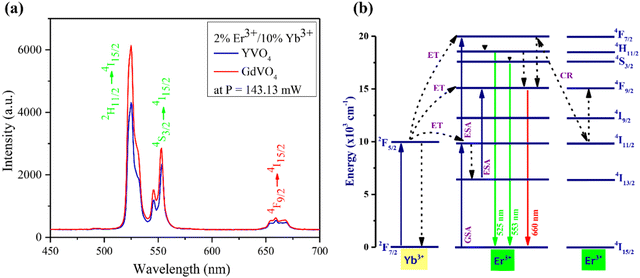 | ||
| Fig. 7 (a) Upconversion emission spectra of Er3+/Yb3+ co-doped [RE]VO4, (RE = Y, Gd) phosphors. (b) Energy level diagram and emission mechanisms of 980 nm excited Er3+ and Yb3+ ions. | ||
The observed UC emissions of the prepared phosphors result from several processes. Various excitation and emission processes, such as ground state absorption (GSA), excited state absorption (ESA), energy transfer (ET), and cross-relaxation (CR), are involved. Fig. 7(b) illustrates the energy level diagram that explains the diverse processes responsible for the observed emissions. The larger absorption cross-section of Yb3+ ions allowed them to absorb a significant portion of the incoming near-infrared photons, leading to their transition from 2F7/2 to 2F5/2 levels. Simultaneously, a certain amount of NIR photons was also absorbed by the Er3+ ions. This induces a ground-state absorption (GSA) process in Er3+ ions through which they undergo a transition from the 4I15/2 to 4I11/2 level. The perfect energy resonance among the 2F5/2 and the 4I11/2 levels of the Yb3+ and Er3+ ions facilitated an effective energy transfer from Yb3+ to Er3+ ions. The energy gained by the Er3+ ions in this process resulted in their transitions to the higher energy 4F7/2 state. Most of the Er3+ ions populated at the 4F7/2 level via excited state absorption (ESA) de-excited non-radiatively to the 2H11/2 level. Among them, a few transited down again into the 4S3/2 level non-radiatively. The radiative transitions of Er3+ ions into the 4I15/2 level from 2H11/2 and 4S3/2 levels resulted in two green UC emission peaks, one around 525 and the other at 553 nm. A few Er3+ ions populated at 4I11/2 by ground-state absorption de-excited non-radiatively into the 4I13/2 level. Subsequently, from there, they undergo a transition into a higher 4F9/2 state via ESA. The 4F9/2 was also populated by the non-radiative transitions from the 4F7/2 and 4S3/2. These Er3+ ions occupied in the 4F9/2 level underwent radiative transitions into the 4I15/2 ground state, resulting in the 660 nm red emission.42–45
| I = Pn | (2) |
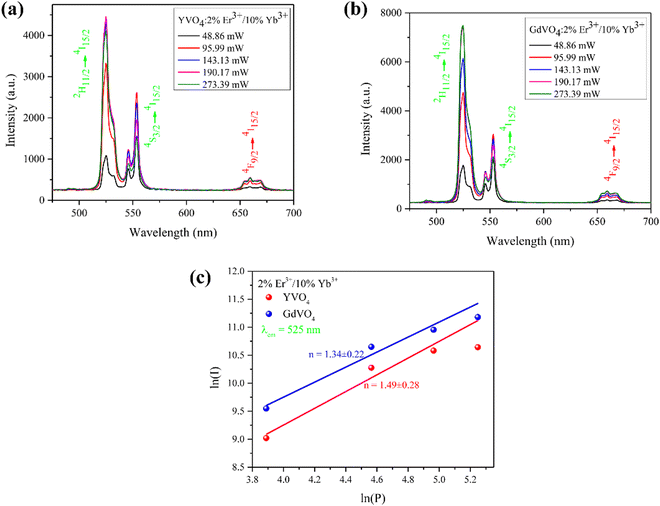 | ||
| Fig. 8 Pump power-dependent UC emission spectra of Er3+/Yb3+ co-doped (a) YVO4 and (b) GdVO4 and (c) ln(P)–ln(I) plot associated with the 525 nm emission. | ||
At a moderate pump power, the upconversion luminescence intensity (I) exhibits a proportional relationship to the laser power (P) raised to the power of n, where ‘n’ represents the number of photons participating in a specific upconversion emission process. The slope of the linear fit of the ln(P)–ln(I) graph would be the value of n. Fig. 8(c) depicts the relationship between the pump power and the emission intensity of upconversion associated with the 525 nm emission of the prepared phosphors on a logarithmic scale. The obtained values were around 1.5, deviating from the anticipated involvement of two photons, as indicated by the energy level diagram. This divergence is attributed to the participation of different energy transfer processes, such as cross-relaxation (CR) and other non-radiative emissions. At higher concentrations of the activator ions, the average distance between them decreases. This facilitates the energy transfer process between them. Also, the presence of chemical functional groups such as O–H and C–O with high vibrational frequency modes present in the sample increases the nonradiative transitions. These eventually reduce the slope values in UC emissions. A similar behaviour in slope values has been found in certain theoretical investigations, which explain that due to intermediate-level saturation, the computed slopes deviate from the expected theoretical values.47,48
3.6 Constant wavelength mode photoacoustic spectroscopic study
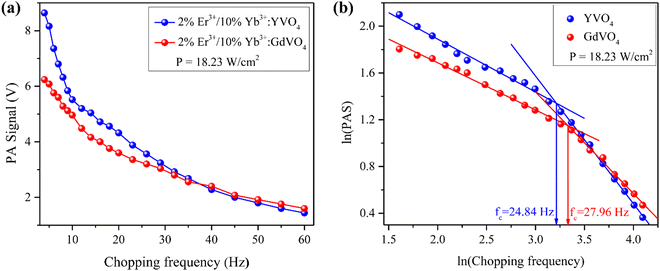
Prepared samples were studied for chopping frequency dependent photoacoustic signals. This study will reveal the intensity of heat generation and its diffusion in the samples. Samples were excited using a 980 nm laser. The acoustic signals were generated inside the cell due to the periodic heat flow from periodically heated samples to the surrounding gas. The photoacoustic (PA) signal was recorded using a highly sensitive microphone at chopping frequencies of 5 Hz to 60 Hz. The variation in the photoacoustic signal intensity with the variation in chopping frequency in Er3+/Yb3+ doped YVO4 and GdVO4 at 18.23 W cm−2 excitation power density is depicted in Fig. 9(a). As the chopping frequency increases, the PA signal amplitude decreases due to a decrease in the energy density of the light beam.23,49 YVO4 exhibited the highest PA signal amplitude among the two samples, specifically at lower chopping frequencies, indicating that the YVO4 lattice generated more heat compared to the GdVO4 lattice. This can be correlated with the upconversion emission; as the GdVO4 phosphor shows higher emission, it should have lower non-radiative emission in principle.The length within the sample over which the entire thermal energy is dispersed is called the thermal diffusion length (μs). The sample is considered as thermally thin or thick based on whether the thermal diffusion length is greater than or less than the sample thickness (l). With the chopping frequency, the depth at which thermal energy penetrates the sample also varies.50 The thermal transition and characteristic frequency (fc) of the samples were determined from the ln(chopping frequency) vs. ln(PAS amplitude) graph illustrated in Fig. 9(b). A sudden change in the slope of the graph was observed at a certain point. The antilog of the ln(chopping frequency) value at which this change occurs gives the value of fc.51 The transition frequencies were found to be 25 Hz and 28 Hz for YVO4 and GdVO4, respectively. These transition frequencies indicate that at these frequencies the samples are changed from thermally thin to thermally thick state. This characteristic frequency is related to the thermal diffusivity (α) of the sample by the relationship α = fcl2.52 Lower transition frequency will result in lower heat dissipation to the environment and hence higher temperature could be achieved upon irradiation. This property is beneficial for photo-thermal applications of such phosphors in biology.
3.7 Photo-thermal conversion efficiency measurement
Due to their NIR absorption and efficient conversion of light into heat, rare-earth-based photothermal converting agents are beneficial for photo-thermal therapy applications.53,54 The photothermal conversion efficiency, η, is a measure of the amount of heat produced after light radiation is absorbed by the sample, which is given by, | (3) |
 | (4) |
 | (5) |
Here, the value of η is computed by analysing the temperature changes over time in the suspension during the laser ON state (temperature rise profile of the system). For highly diluted phosphor fluids (where there is a negligible amount of sample in the suspension), Cp is approximately equal to Cp,0, yielding;46,55
 | (6) |
Fig. 10 illustrates the temperature variations of the prepared phosphor samples with time under 980 nm laser irradiation. From the temperature rise profile, the photothermal conversion efficiencies are calculated to be 31% and 22.83% for YVO4 and GdVO4, respectively.
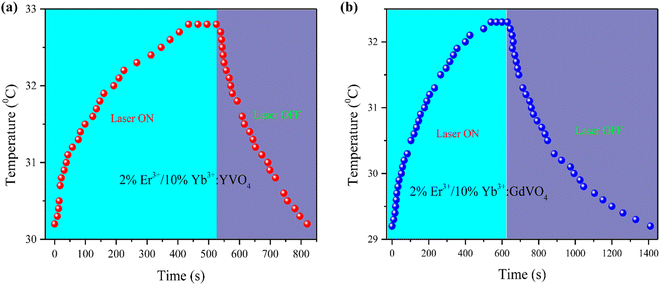 | ||
| Fig. 10 Temperature variation with time under 980 nm laser irradiation of Er3+/Yb3+ doped (a) YVO4 and (b) GdVO4. | ||
4. Conclusions
Er3+/Yb3+ doped YVO4 and GdVO4 phosphors were prepared through the combustion technique and were characterized through various techniques. Both the prepared samples have shown good upconversion emission, and among the two, the GdVO4 phosphor has shown higher emission intensity despite having a similar phonon frequency. Both samples were also studied for photoacoustic heat generation, and it was found that the YVO4 phosphor showed a higher heat generation compared to the other. The YVO4 phosphor again has shown lower heat dissipation and, hence, higher photo-thermal conversion efficiency upon irradiation.Author contributions
Cinumon K. V.: conceptualisation, methodology, investigation, formal analysis, data curation and writing – original draft; Minarul I. Sarkar: investigation, formal analysis, and data curation; and Kaushal Kumar: conceptualisation, supervision, data curation, validation, resources, and writing – reviewing and editing.Data availability
Data will be made available on request.Conflicts of interest
The authors declare that they have no known competing financial interests or personal relationships that could have appeared to influence the work reported in this paper.Acknowledgements
Cinumon K. V. is thankful to the Indian Institute of Technology (Indian School of Mines) Dhanbad for providing financial support in terms of a research fellowship. The authors acknowledge the Central Research Facility and the FTIR lab at the Department of Chemistry and Chemical Biology, IIT (ISM) Dhanbad. The authors are also thankful to Ms Chandni Kumari, Department of Physics IIT(ISM), for assistance with the Rietveld refinement analysis. Prof. Kaushal Kumar acknowledges the Department of Science and Technology (DST) Science and Engineering Research Board (SERB), New Delhi, India (as project DST (CRG/2023/006161) for financial support.References
- Y. Liu, D. Tu, H. Zhu and X. Chen, Lanthanide-doped luminescent nanoprobes: controlled synthesis, optical spectroscopy, and bioapplications, Chem. Soc. Rev., 2013, 42(16), 6924–6958 RSC.
- C. Lee and P. J. Schuck, Photodarkening, Photobrightening, and the Role of Color Centers in Emerging Applications of Lanthanide-Based Upconverting Nanomaterials, Annu. Rev. Phys. Chem., 2023, 74, 415–438 CrossRef CAS PubMed.
- V. Nguyen, T. K. C. Tran and D. V. Nguyen, Combustion synthesis and characterization of Er3+ -doped and Er3+, Yb3+ -codoped YVO4 nanophosphors oriented for luminescent biolabeling applications, Adv. Nat. Sci. Nanosci. Nanotechnol., 2011, 2(4), 045011 CrossRef.
- F. Auzel, Upconversion and Anti-Stokes Processes with f and d Ions in Solids, Chem. Rev., 2004, 104(1), 139–174 CrossRef CAS PubMed.
- N. Stopikowska, M. Runowski, M. Skwierczyńska and S. Lis, Improving performance of luminescent nanothermometers based on non-thermally and thermally coupled levels of lanthanides by modulating laser power, Nanoscale, 2021, 13(33), 14139–14146 RSC.
- T. Minakova, S. Mjakin, V. Bakhmetyev, M. Sychov, I. Zyatikov and I. Ekimova, et al., High Efficient YVPO4 Luminescent Materials Activated by Europium, Crystals, 2019, 9(12), 658 CrossRef CAS.
- N. Stopikowska, M. Runowski, P. Woźny, S. Lis and P. Du, Generation of Pure Green Up-Conversion Luminescence in Er3+ Doped and Yb3+-Er3+ Co-Doped YVO4 Nanomaterials under 785 and 975 nm Excitation, Nanomaterials, 2022, 12(5), 799 CrossRef CAS PubMed.
- Y. Liang, P. Chui, X. Sun, Y. Zhao, F. Cheng and K. Sun, Hydrothermal synthesis and upconversion luminescent properties of YVO4:Yb3+,Er3+ nanoparticles, J. Alloys Compd., 2013, 552, 289–293 CrossRef CAS.
- J. A. Baglio and G. Gashurov, A refinement of the crystal structure of yttrium vanadate, Acta Crystallogr., Sect. B: Struct. Crystallogr. Cryst. Chem., 1968, 24(2), 292–293 CrossRef CAS.
- A. G. Bell, On the production and reproduction of sound by light, Am. J. Sci., 1880, s3–20(118), 305–324 CrossRef.
- A. Rosencwaig and A. Gersho, Theory of the photoacoustic effect with solids, J. Appl. Phys., 1976, 47(1), 64–69 CrossRef.
- S. Manohar and D. Razansky, Photoacoustics: a historical review, Adv. Opt. Photonics, 2016, 8(4), 586–617 CrossRef.
- Z. Lang, S. Qiao, Y. He and Y. Ma, Quartz tuning fork-based demodulation of an acoustic signal induced by photo-thermo-elastic energy conversion, Photoacoustics, 2021, 22, 100272 CrossRef PubMed.
- S. Hakakzadeh, M. Amjadian, Y. Zhang, S. M. Mostafavi, Z. Kavehvash and L. Wang, Signal restoration algorithm for photoacoustic imaging systems, Biomed. Opt. Express, 2023, 14(2), 651–666 CrossRef CAS PubMed.
- W. Choi, B. Park, S. Choi, D. Oh, J. Kim and C. Kim, Recent Advances in Contrast-Enhanced Photoacoustic Imaging: Overcoming the Physical and Practical Challenges, Chem. Rev., 2023, 123(11), 7379–7419 CrossRef CAS PubMed.
- A. K. Levine and F. C. Palilla, A New, Highly Efficient Red-Emitting Cathodoluminescent Phosphor (YVO4:Eu) For Color Television, Appl. Phys. Lett., 1964, 5(6), 118–120 CrossRef CAS.
- Y. Sheng, L. D. Liao, N. Thakor and M. C. Tan, Rare-Earth Doped Particles as Dual-Modality Contrast Agent for Minimally-Invasive Luminescence and Dual-Wavelength Photoacoustic Imaging, Sci. Rep., 2014, 4(1), 6562 CrossRef CAS PubMed.
- C. T. B. Thao, B. T. Huy, M. Sharipov, J. Ik Kim, V. D. Dao and J. Y. Moon, et al., Yb3+, Er3+, Eu3+-codoped YVO4 material for bioimaging with dual mode excitation, Mater. Sci. Eng. C, 2017, 75, 990–997 CrossRef CAS PubMed.
- V. Mahalingam, C. Hazra, R. Naccache, F. Vetrone and J. A. Capobianco, Enhancing the color purity of the green upconversion emission from Er3+/Yb3+-doped GdVO4 nanocrystals via tuning of the sensitizer concentration, J. Mater. Chem. C, 2013, 1(40), 6536–6540 RSC.
- M. M. Upadhyay, K. Shwetabh and K. Kumar, Comparative studies of upconversion luminescence and optical temperature sensing in Tm3+/Yb3+ codoped LaVO4 and GdVO4 phosphors, RSC Adv., 2023, 13(30), 20674–20683 RSC.
- A. Roy, A. Dwivedi, H. Mishra and S. B. Rai, Host dependent upconversion, color tunability and laser induced optical heating via NIR excitation in Ho3+, Yb3+ doped YXO4 (X = V, Nb, Ta) phosphor materials: Application as a security tool and optical heater, Mater. Res. Bull., 2022, 145, 111568 CrossRef CAS.
- S. M. Rafiaei, A. Kim and M. Shokouhimehr, Enhanced Luminescence Properties of Combustion Synthesized Y2O3:Gd Nanostructure, Curr. Nanosci., 2016, 12(2), 244–249 CrossRef CAS.
- S. Pandhija, N. K. Rai, A. K. Singh, A. K. Rai and R. Gopal, Development of photoacoustic spectroscopic technique for the study of materials, Prog. Cryst. Growth Charact. Mater., 2006, 52(1), 53–60 CrossRef CAS.
- Z. Huang, J. Feng and W. Pan, Theoretical investigations of the physical properties of zircon-type YVO4, J. Solid State Chem., 2012, 185, 42–48 CrossRef CAS.
- H. Thakur, B. P. Singh, R. Kumar, A. K. Gathania, S. K. Singh and R. K. Singh, Synthesis, structural analysis, upconversion luminescence and magnetic properties of Ho3+/Yb3+ co-doped GdVO4 nanophosphor, Mater. Chem. Phys., 2020, 253, 123333 CrossRef CAS.
- T. Grzyb, A. Szczeszak, A. Shyichuk, R. T. Moura, A. N. C. Neto and N. Andrzejewska, et al., Comparative studies of structure, spectroscopic properties and intensity parameters of tetragonal rare earth vanadate nanophosphors doped with Eu(III), J. Alloys Compd., 2018, 741, 459–472 CrossRef CAS.
- A. Hooda, A. Khatkar, S. Chahar, S. Singh, P. Dhankhar and S. P. Khatkar, et al., Photometric features and typical white light emanation via combustion derived trivalent dysprosium doped ternary aluminate oxide based nanophosphor for WLEDs, Ceram. Int., 2020, 46(4), 4204–4214 CrossRef CAS.
- N. Kumar Mishra, M. M. Upadhyay, S. Kumar and K. Kumar, Efficient dual mode emission in Ce3+/Yb3+/Er3+ doped yttrium aluminium gallium garnet for led device and optical thermometry, Spectrochim. Acta, Part A, 2022, 282, 121664 CrossRef CAS PubMed.
- H. Liu, J. Miao, S. Chen, J. Shen, S. Wei and W. F. Rao, High-performance of optical thermometry based on the non-thermally coupled levels in YVO4: Yb3+/Er3+/Tm3+ nanocrystals, J. Lumin., 2024, 270, 120584 CrossRef CAS.
- K. Momma and F. Izumi, VESTA 3 for three-dimensional visualization of crystal, volumetric and morphology data, J. Appl. Crystallogr., 2011, 44(6), 1272–1276 CrossRef CAS.
- B. Chakravarti, A. P. Mishra and R. K. Singh, Impact of alkali metals (M =
![[thin space (1/6-em)]](https://www.rsc.org/images/entities/char_2009.gif) Li, Na, and K) co-doping on luminescence properties of hydrothermally synthesized YVO4:Dy3+ phosphors, J. Mater. Sci.: Mater. Electron., 2023, 34(2), 133 CrossRef CAS.
Li, Na, and K) co-doping on luminescence properties of hydrothermally synthesized YVO4:Dy3+ phosphors, J. Mater. Sci.: Mater. Electron., 2023, 34(2), 133 CrossRef CAS. - C. Berthomieu and R. Hienerwadel, Fourier transform infrared (FTIR) spectroscopy, Photosynth. Res., 2009, 101(2), 157–170 CrossRef CAS PubMed.
- L. Alcaraz and J. Isasi, Synthesis and study of Y0.9Ln0.1VO4 nanophosphors and Y0.9Ln0.1VO4@SiO2 luminescent nanocomposites with Ln = Eu, Dy, Er, Ceram. Int., 2017, 43(6), 5311–5318 CrossRef CAS.
- N. K. Mishra, K. Shwetabh, U. K. Gautam and K. Kumar, Probing multimodal light emission from Tb3+/Yb3+ -doped garnet nanophosphors for lighting applications, Phys. Chem. Chem. Phys., 2023, 25(16), 11756–11770 RSC.
- R. Wiglusz, L. Marciniak, R. Pazik and W. Strek, Structural and Spectroscopic Characterization of Nd3+-Doped YVO4 Yttrium Orthovanadate Nanocrystallites, Cryst. Growth Des., 2014, 14, 5512 CrossRef CAS.
- E. Rai, R. S. Yadav, D. Kumar, A. K. Singh, V. J. Fulari and S. B. Rai, Improved photoluminescence in Eu3+ doped LaVO4 phosphor via co-doping of Li+/Ca2+ ions, J. Lumin., 2022, 241, 118519 CrossRef CAS.
- D. J. Jovanović, T. V. Gavrilović, S. D. Dolić, M. Marinović-Cincović, K. Smits and M. D. Dramićanin, Up-conversion luminescence of GdVO4:Nd3+/Er3+ and GdVO4:Nd3+/Ho3+ phosphors under 808 nm excitation, Opt. Mater., 2018, 82, 1–6 CrossRef.
- R. Okram, N. Yaiphaba, R. S. Ningthoujam and N. R. Singh, Is Higher Ratio of Monoclinic to Tetragonal in LaVO4 a Better Luminescence Host? Redispersion and Polymer Film Formation, Inorg. Chem., 2014, 53(14), 7204–7213 CrossRef CAS PubMed.
- T. V. Gavrilović, D. J. Jovanović, V. Lojpur and M. D. Dramićanin, Multifunctional Eu3+ - and Er3+/Yb3+ -doped GdVO4 nanoparticles synthesized by reverse micelle method, Sci. Rep., 2014, 4(1), 4209 CrossRef PubMed.
- M. K. Mahata, S. P. Tiwari, S. Mukherjee, K. Kumar and V. K. Rai, YVO4:Er3+/Yb3+ phosphor for multifunctional applications, JOSA B, 2014, 31(8), 1814–1821 CrossRef CAS.
- Y. Yang, J. Huang, W. Wei, Q. Zeng, X. Li and D. Xing, et al., Switching the NIR upconversion of nanoparticles for the orthogonal activation of photoacoustic imaging and phototherapy, Nat. Commun., 2022, 13(1), 3149 CrossRef CAS PubMed.
- G. Mialon, S. Türkcan, G. Dantelle, D. P. Collins, M. Hadjipanayi and R. A. Taylor, et al., High Up-Conversion Efficiency of YVO4:Yb,Er Nanoparticles in Water down to the Single-Particle Level, J. Phys. Chem. C, 2010, 114(51), 22449–22454 CrossRef CAS.
- N. Kumar Mishra, M. M. Upadhyay, S. Kumar and K. Kumar, Efficient dual mode emission in Ce3+/Yb3+/Er3+ doped yttrium aluminium gallium garnet for led device and optical thermometry, Spectrochim. Acta, Part A, 2022, 282, 121664 CrossRef CAS PubMed.
- A. Shyichuk, S. S. Câmara, I. T. Weber, A. N. Carneiro Neto, L. A. O. Nunes and S. Lis, et al., Energy transfer upconversion dynamics in YVO4:Yb3+,Er3+, J. Lumin., 2016, 170, 560–570 CrossRef CAS.
- J. H. Zeng, J. Su, Z. H. Li, R. X. Yan and Y. D. Li, Synthesis and Upconversion Luminescence of Hexagonal-Phase NaYF4:Yb, Er3+ Phosphors of Controlled Size and Morphology, Adv. Mater., 2005, 17(17), 2119–2123 CrossRef CAS.
- K. Shwetabh, N. K. Mishra and K. Kumar, NIR activated Er3+/Yb3+ doped LiYF4 upconverting nanocrystals for photothermal treatment, optical thermometry, latent fingerprint detection and security ink applications, Mater. Sci. Semicond. Process., 2023, 167, 107806 CrossRef CAS.
- J. F. Suyver, A. Aebischer, S. García-Revilla, P. Gerner and H. U. Güdel, Anomalous power dependence of sensitized upconversion luminescence, Phys. Rev. B: Condens. Matter Mater. Phys., 2005, 71(12), 125123 CrossRef.
- S. Sinha, M. K. Mahata and K. Kumar, Enhancing the upconversion luminescence properties of Er3+–Yb3+ doped yttrium molybdate through Mg2+ incorporation: effect of laser excitation power on temperature sensing and heat generation, New J. Chem., 2019, 43(15), 5960–5971 RSC.
- M. I. Sarkar and K. Kumar, Thermal diffusivity measurement of boron nitride by photoacoustic spectroscopy, Mater. Today Proc., 2022, 65, 345–350 CrossRef CAS.
- S. D. George, R. Komban, K. G. K. Warrier, P. Radhakrishnan, V. P. N. Nampoori and C. P. G. Vallabhan, Photoacoustic Thermal Characterization of Porous Rare-Earth Phosphate Ceramics, Int. J. Thermophys., 2007, 28(1), 123–132 CrossRef CAS.
- M. I. Sarkar and K. Kumar, Power dependent photoacoustic and photoluminescence studies on a Ho3+/Yb3+ doped Y2O3 phosphor, RSC Adv., 2023, 13(19), 12723–12730 RSC.
- S. Rasool, K. Saritha, K. T. R. Reddy, K. R. Reddy, L. Bychto and A. Patryn, et al., Optical properties of thermally evaporated In 2 S 3 thin films measured using photoacoustic spectroscopy, Mater. Sci. Semicond. Process., 2017, 72, 4–8 CrossRef CAS.
- F. Wang, D. Banerjee, Y. Liu, X. Chen and X. Liu, Upconversion nanoparticles in biological labeling, imaging, and therapy, Analyst, 2010, 135(8), 1839–1854 RSC.
- G. Chen, H. Qiu, P. N. Prasad and X. Chen, Upconversion Nanoparticles: Design, Nanochemistry, and Applications in Theranostics, Chem. Rev., 2014, 114(10), 5161–5214 CrossRef CAS PubMed.
- S. Balabhadra, M. L. Debasu, C. D. S. Brites, R. A. S. Ferreira and L. D. Carlos, Radiation-to-heat conversion efficiency in SrF2:Yb3+/Er3+ upconverting nanoparticles, Opt. Mater., 2018, 83, 1–6 CrossRef CAS.
| This journal is © The Royal Society of Chemistry and the Centre National de la Recherche Scientifique 2024 |

