
 Open Access Article
 This Open Access Article is licensed under a
 Creative Commons Attribution 3.0 Unported Licence
The effect of templating on the mechanical properties of smectic liquid crystal elastomers†
Stuart R.
Berrow
 *a,
Thomas
Raistrick
a,
Aidan
Street
a,
Emily J.
Cooper
a,
Meg
Coleman
a,
Richard J.
Mandle
ab and
Helen F.
Gleeson
a
*a,
Thomas
Raistrick
a,
Aidan
Street
a,
Emily J.
Cooper
a,
Meg
Coleman
a,
Richard J.
Mandle
ab and
Helen F.
Gleeson
a
aSchool of Physics and Astronomy, University of Leeds, LS2 9JT, UK. E-mail: S.R.Berrow@leeds.ac.uk
bSchool of Chemistry, University of Leeds, LS2 9JT, UK
First published on 12th May 2025
Abstract
In 1969, de Gennes predicted that macromolecules templated in different liquid crystal phases would have distinct mechanical properties. In this work, we explore his prediction, specifically examining smectic liquid crystal elastomers (LCEs) that have been polymerised either in a nematic or a smectic phase. The LCEs are chemically similar; they can be defined as primarily side-chain systems in which the mesogenic moiety is connected to an acrylate backbone by an alkoxy spacer unit. All of the LCEs are lightly crosslinked using a bifunctional acrylate mesogenic unit at a ratio of 7.7 mol%. When polymerised in the nematic phase, the smectic LCEs show relatively short smectic correlation lengths, extending over less than 5 smectic layers. The samples have nematic-like mechanical properties. This includes: low anisotropy of their Young's moduli (E‖/(E⊥) ∼ one order of magnitude), and similar resistance to compression parallel to their initial director as for comparable nematic LCEs. Alternatively, when polymerised in a smectic phase, the LCEs exhibit much larger long-range smectic order (correlation lengths > 10 layers) and incompressible smectic layers. Surprisingly, samples polymerised in the smectic phase have rather low anisotropy of their Young's moduli, which we attributed to a more isotropic backbone conformation than anticipated by De Gennes. Regardless of the phase in which the polymerisation is conducted, all of the smectic LCEs show the emergence of biaxial smectic A order upon mechanical deformation perpendicular to their director.
1. Introduction
Liquid crystal elastomers (LCEs) are lightly cross-linked polymers which incorporate anisotropic structural motifs known as mesogens into their structure. This leads to materials which combine the elastic properties of elastomers with the self-organisation and anisotropic properties of liquid crystals.1 Research interest into LCEs is centred around LCEs which display nematic ordering, i.e. the mesogenic components have orientational order but no positional order, as they display interesting properties that have suggested several potential applications.1,2 These include mechanical metamaterials,3–6 actuation,7–13 and anisotropic adhesion.14–17 The architecture of the nematic LCEs can differ, depending on the desired property, Fig. 1. For example, materials selected for actuation are often main-chain LCEs (MCLCEs) (Fig. 1), as direct incorporation of mesogens into the polymer backbone leads to the greatest magnitude of change at the nematic to isotropic phase transition. | ||
| Fig. 1 Schematics to show (a) the prominent LCE architectures often reported, and (b) the arrangement of mesogens in the nematic and smectic A liquid crystal phases. | ||
Many of the early liquid crystal polymer systems contained mesogens affixed to the polymer backbone via a flexible chain known as a spacer, a method pioneered in the group of Helmut Ringsdorf, akin to the side-chain LCE (SCLCE) architecture shown in Fig. 1.18–27 This network architecture has a propensity to promote the formation of smectic phases, in which the centres of mass of the mesogens are arranged into layers, particularly when siloxane backbones are used due to their immiscibility with carbon-based motifs.28 However, acrylate-based nematic LCEs that are predominantly side chain, have been demonstrated and, interestingly, many show a negative Poisson's ratio (a property also known as auxetic behaviour) and biaxial deformation when under strain, contrasting with the more commonly observed semi-soft elastic response of nematic LCEs.4,29,30 The auxetic LCEs were all produced by polymerisation in a nematic phase; indeed templating such materials in the isotropic phase produces chemically identical, isotropic elastomers with very different properties, including exceptionally high photoelastic coefficients.6
This paper concerns smectic LCEs, motivated by work that reported the synthesis of side chain LCEs displaying smectic character, where the polymerisation had been undertaken in the nematic phase.4 Furthermore, those materials displayed properties that suggested a nature somewhere between that of typical nematic and smectic LCEs. For example, the samples reached failure at relatively low strains (∼0.3) when subject to mechanical strain perpendicular to the director, as expected for smectic LCEs.4 However, during strain, the samples also showed a transition from uniaxial to biaxial character, analogous to the biaxial deformation seen in the nematic homologues and other auxetic nematic LCEs.4
We were already aware of the powerful influence templating could have on the physical properties of LCEs.31 Our motivation here was to undertake an in-depth exploration of smectic LCEs templated in aligned nematic or smectic liquid crystal phases, to examine the extent to which the properties of the LCE depended on the synthetic conditions. The question of templating macromolecules in different host phases, thereby inducing different mechanical properties was first considered by de Gennes.32 He considered the difference between forming a polymer network in an aligned nematic or smectic phase, predicting a high mechanical anisotropy in the latter case. However, in De Gennes’ postulations, simple isotropic macromolecular chains are considered, as opposed to the liquid crystalline macroscopic character present in the LCEs employed in this work. Here, we report the synthesis and physical properties of a series of chemically similar LCEs that show varying degrees of smectic ordering, achieved by controlling the liquid crystal phase in which the polymerisation is conducted.
2. Experimental
2.1. Materials
All materials were used as purchased without further purification, and were obtained from one of the following suppliers: Sigma Aldrich (Gillingham, UK), Fisher Scientific (Loughborough, UK), Apollo Scientific (Stockport, UK), Ambeed (Arlington Heights, IL, USA), Fluorochem (Glossop, UK), Tokyo Chemical Industry UK (Oxford, UK), Synthon Chemicals GmbH (Bitterfeld-Wolfen, Germany), Insight Biotechnology Ltd (Wembley, UK).2.2. Material characterisation
A detailed description of the experimental conditions employed for the characterisation of the materials reported in this work can be found in the ESI.† In brief, these consist of: differential scanning calorimetry; mechanical analysis; optical microscopy; X-ray scattering; and nuclear magnetic resonance spectroscopy.2.3. Monomer selection
Fig. 2 displays the monomers investigated in this work, and the abbreviations by which they will be known for the remainder of this work. Most of the monomers investigated in this work were synthesised in-house. Detailed experimental procedures for these syntheses can be found in the ESI.† | ||
| Fig. 2 The chemical structures of the monofunctional mesogenic monomer variations employed in the fabrication of LCEs within this work. The LCEs produced from the AnOCB monomers were reported previously4 and differ by the number of repeat units in the spacer chain, as opposed to differences in the structure of the mesogenic unit as in M1–M6. | ||
2.4. Elastomer mould fabrication
The LCE films were produced exhibiting high-quality planar or homeotropic alignment (Fig. S1 and Fig. S2 respectively, ESI†), utilising bespoke alignment moulds, which have been described in detail elsewhere.4 The process followed for both is described briefly below.2.5. Liquid crystal elastomer synthesis
The generalised procedure employed for the production of the LCEs studied in this work is adapted from procedures reported within our previous work, and is described briefly below.4,33–35Fig. 3 shows the generalised composition of the LCE precursor mixture. The 6OCB is non-reactive and is included to ensure a room temperature liquid crystal phase prior to polymerisation. The room-temperature phase can be either nematic or smectic, allowing us to investigate the influence of templating on the resulting LCE, as mentioned in the introduction. | ||
| Fig. 3 Generalised composition of the LCE mixture when the monofunctional mesogenic monomer MX is varied. The quantities in square brackets denote the composition of the final LCE after the unreactive material has been removed. In the case of MX, the X displayed in the chemical structure, denotes the appropriate mesogenic unit from Fig. 2. | ||
2.6. Planar alignment
In a typical procedure, the difunctional cross-linker (RM82) (3.5 mol%), the monofunctional mesogenic monomer (24.4 mol%), and 6OCB (54.6 mol%) were heated to 120 °C with stirring until a homogeneous isotropic phase was obtained. The mixture was cooled to 45 °C, followed by the addition of EHA (16 mol%) and MBF (1.5 mol%), and stirred for 5 min, again ensuring a homogeneous, completely isotropic material was obtained. The mixture was then filled into a mould at 45 °C via pipette, before being cooled to room temperature and allowed to stand for 20 min. The samples were then cured under 350 nm (2.5 Wcm−2) irradiation for 2 h, to yield a fully cured sample as evidenced in previous work.33 After curing, the samples were removed from the moulds (using a small amount of isopropanol if necessary to aid delamination from the substrates) and left to stand in a solution of dichloromethane (DCM)![[thin space (1/6-em)]](https://www.rsc.org/images/entities/char_2009.gif) :isopropanol (30:70) overnight to remove the non-reactive 6OCB. The samples were then allowed to dry under ambient conditions for 5 h, to yield the final LCE films.
:isopropanol (30:70) overnight to remove the non-reactive 6OCB. The samples were then allowed to dry under ambient conditions for 5 h, to yield the final LCE films.
2.7. Homeotropic alignment
For LCEs synthesised with homeotropic alignment, the procedure is largely consistent with that described above for the planar aligned samples. However, rather than the samples being left to align for 30 minutes after cooling to room temperature as is the case for the planar samples, in the homeotropic case, a voltage of 40 Vrms at 1 kHz was applied to the cell to enhance the homeotropic alignment provided by the surface treatment. The samples were then cured under 350 nm (2.5 W cm−2) irradiation for 2 hours, after which time they were removed from the moulds and washed in a manner consistent with that used for the planar aligned samples.3. Results and discussion
3.1. LCE fabrication and phase analysis
The LCEs were synthesised in accordance with previous chemically similar LCEs, with high-quality monodomain alignment achieved via surface alignment or electric field enhanced surface alignment for planar and homeotropic samples, respectively.4,34 The precursor mixtures were either smectic or nematic at room temperature (Fig. S13, ESI†) but the LCEs all had smectic character (described in more detail below). When considering smectic elastomers, it has been suggested that the conditions under which the sample was fabricated are important, because the phase in which the sample is polymerised influences backbone conformation and hence layer formation.32 For LCEs synthesised in the smectic phase, the polymer chains are expected to be strongly constrained to planes and weakly coupled between them. When surface alignment or external fields are applied to the smectic mixture prior to cross-linking, it has been suggested that the lamellar structure is stabilised, enhancing long-range order.36 The LCEs prepared with M5 and M6 in this work are polymerised at room temperature in a well-aligned smectic phase. For all the other LCEs in this work, cross-linking is made in a well-aligned nematic phase and the backbone is expected to be less constrained. Indeed, it has been reported that frustrated layer structures occur when the smectic phase forms in a nematic phase, due to random cross-link positioning which disrupts the smectic order.36In all cases, using the surface alignment approach allows high quality LCE samples to be routinely obtained, showing excellent planar alignment in the desired orientation (Fig. S2, ESI†). The electric field enhanced surface alignment enabled high quality homeotropically aligned samples to be created for the LCEs made with monomers M1–M4 (Fig. S3, ESI†). However, homeotropically aligned LCEs of M5 and M6 could not be obtained, a factor we attribute to the expected low dielectric anisotropy of the monomer mixtures. All samples show a glass transition temperature (Tg) below room temperature (Table S1, ESI†), with Tg varying between −7 °C and 7 °C. Upon examination of the LCEs in X-ray scattering experiments (Fig. 4), all samples show sharp (001) Bragg reflections in the small angle region, suggesting the presence of smectic ordering. As the (001) Bragg reflections due to the layer spacing and the diffuse wide-angle scattering are orthogonal, the smectic phase can be assigned as smectic-A (SmA).
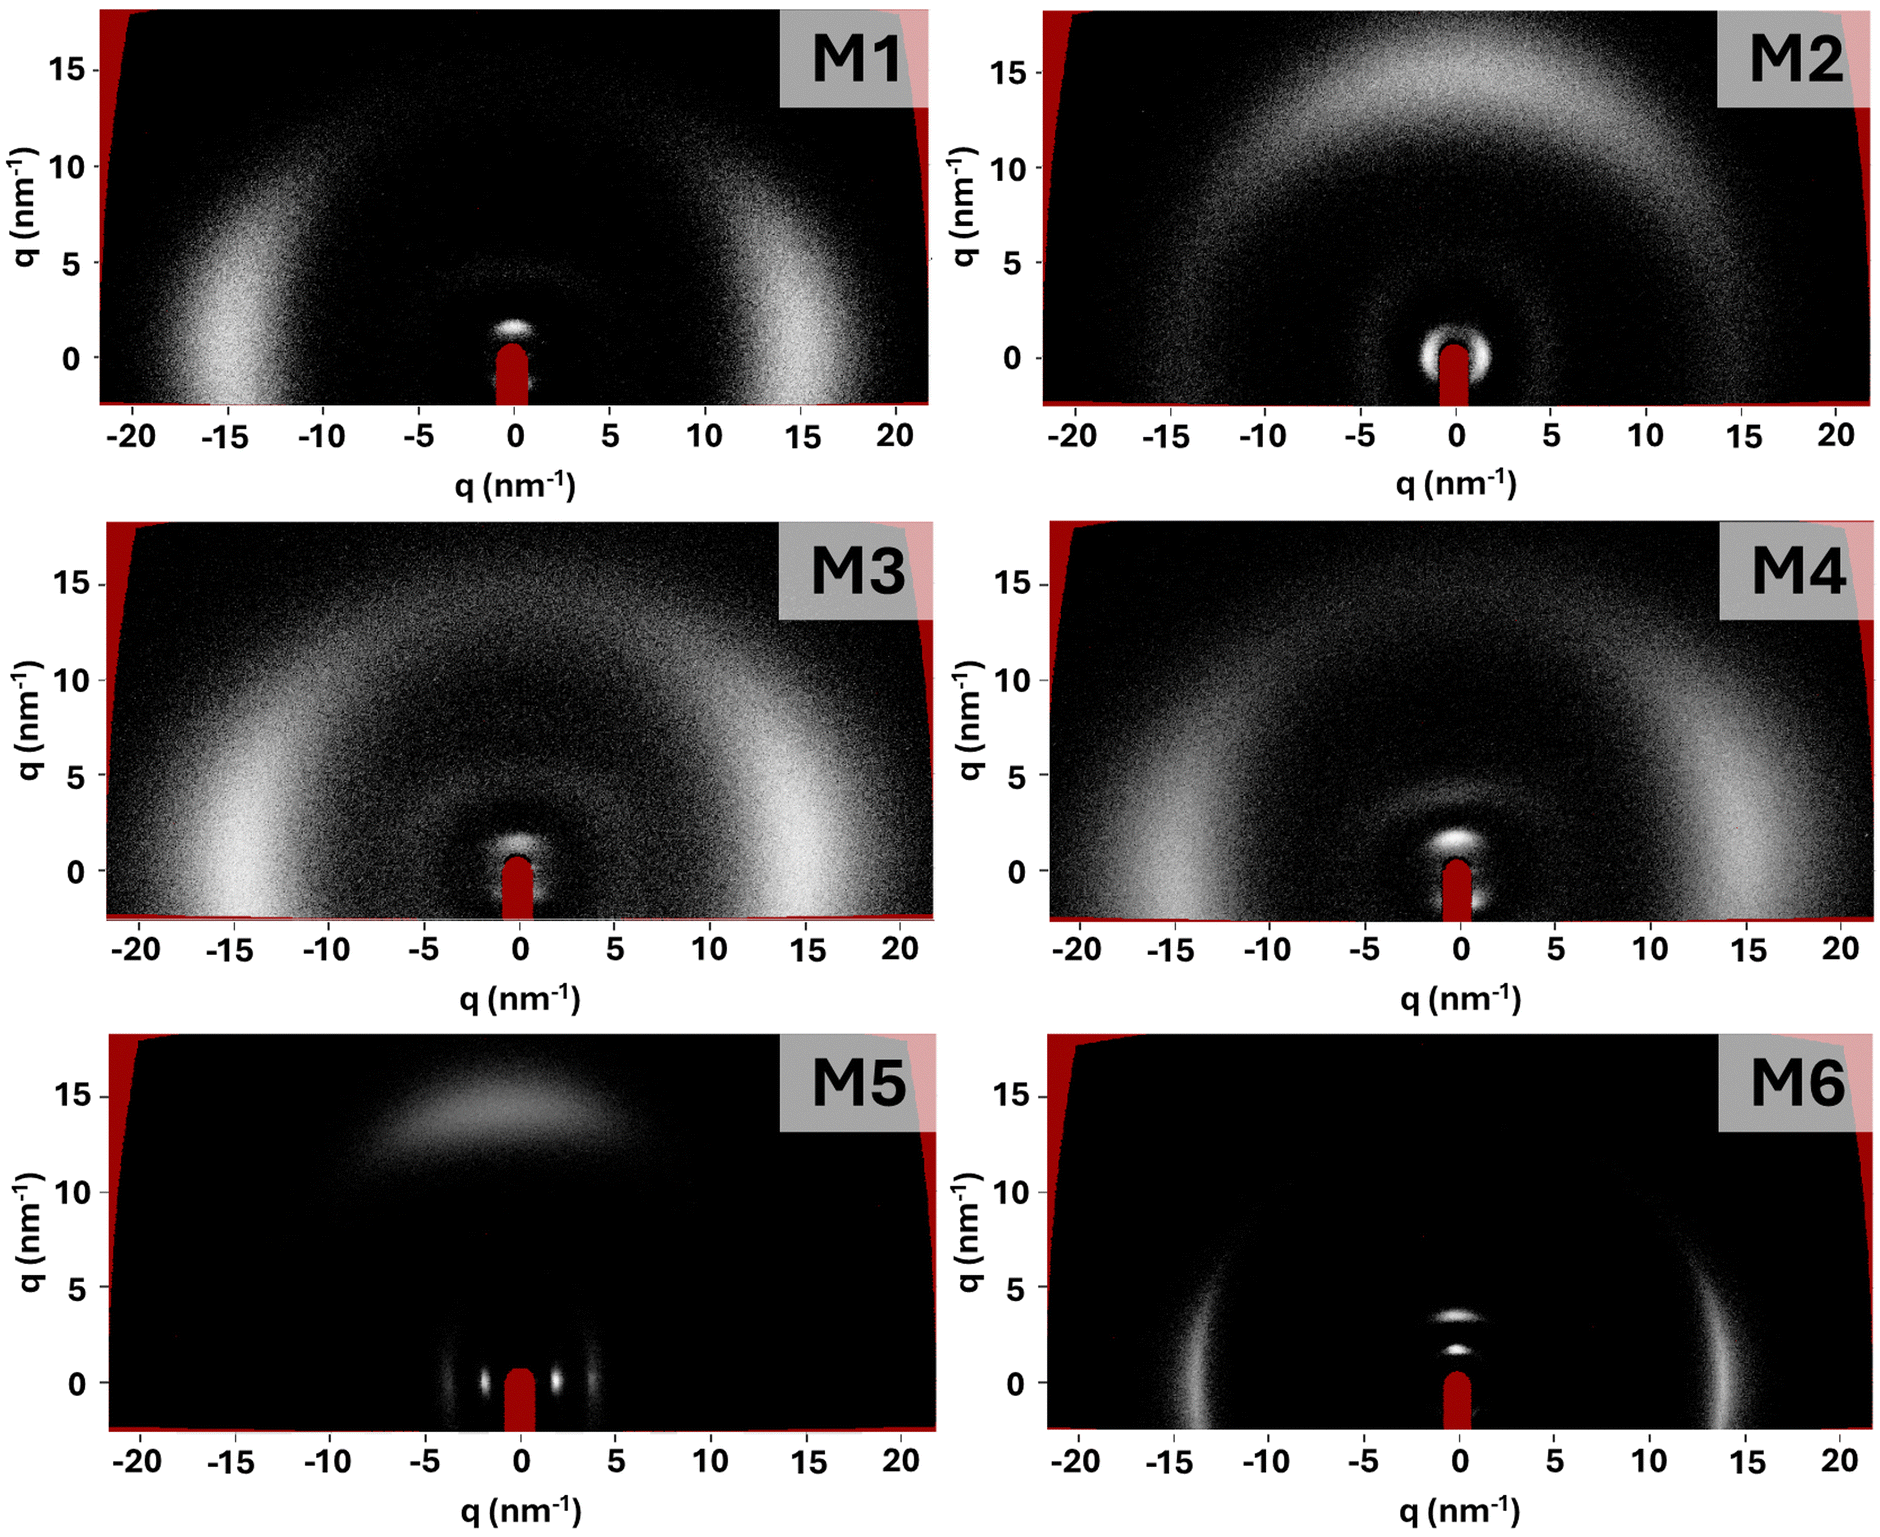 | ||
| Fig. 4 Two-dimensional X-ray scattering data for each LCE sample. Planar samples were used, with the director approximately vertical (M1, M3, M4 and M6) or horizontal (M2 and M5). (001) Bragg peaks due to smectic layer spacing can be seen in each case close to the red beam stop. Only M5 and M6 show multiple small angle features (001) and (002) peaks. | ||
Further details in the X-ray scattering patterns obtained for the samples provide insight into the smectic ordering (Fig. 4). For all the samples which are polymerised in a nematic phase (M1–M4), a single (001) Bragg reflection is observed. This is consistent with an algebraic decay of the smectic correlation function, attributed to the Landau–Peierls instability, resulting from samples displaying quasi-long range to short range order.36 This suggests that the lamellar arrangement of the smectic phase is destabilised, and therefore that the samples adopt a frustrated smectic arrangement. These observations are consistent with those made for LCEs synthesised with monomers A7OCB, A8OCB and A9OCB reported in previous work, which were also polymerised in the nematic phase.4 The focus of the work in which the AnOCB LCEs were reported was not on the smectic ordering, but rather on the auxetic behaviour of the nematic homologues. Therefore, here we have further analysed the smectic nature of the AnOCB LCEs. Contrary to the samples polymerised in the nematic phase, the samples made with M5 and M6, and thus polymerised in the smectic phase, show multiple orders of Bragg reflection, suggesting that long-range order associated with lamellar arrangement is present.
When examined as a function of temperature, none of the samples exhibit any change in smectic layer spacing within experimental error (Fig. S8, ESI†), regardless of the phase in which they are polymerised. However, what is apparent is that the intensity of the (001) Bragg reflection reduces with increased temperature (Fig. S7, ESI†). In all cases, the peak exists up to 110 °C (the limit of our apparatus), suggesting smectic ordering remains, however the reduction in intensity suggests a reduction of smectic ordering and perhaps a broad transition towards a less ordered phase is occurring, over a wide temperature range.
To quantify the extent of long-range ordering present in each LCE, the X-ray scattering data were used to calculate the smectic correlation length.37 Full experimental information regarding the calculation of correlation length can be found in the ESI.†Table 1 shows the evaluated correlation lengths (ε‖), layer spacing (d) and the number of layers over which the long-range ordering extends (ε‖/d) for M1 to M6 and also for the smectic LCEs reported previously, denoted A7OCB, A8OCB and A9OCB.4 Examining ε‖/d clearly differentiates the materials according to the phase in which the polymerisation was conducted. The LCEs for which the polymerisation was conducted in the nematic phase (M1–M4 and the AnOCB monomers) show correlations over only a few layers (2–5), consistent with a frustrated smectic structure, which has been suggested to represent smectic LCEs with correlations of up to 10 layers.38 Conversely, monomers M5 and M6 for which the polymerisation is achieved in a smectic phase, yield LCEs with order extending over 18 and 11 layers respectively, which are more akin to the order of smectic structures. Whilst there is no accepted definition of what constitutes a smectic correlation length, it is worth noting that for smectic LCEs in the literature, observed correlation lengths typically take values in the region of 200–600 Å, comparable with the majority of those reported in this work.
| Monomer | Correlation length (ε‖) (Å) | Layer spacing (d) (Å) | ε ‖/d |
|---|---|---|---|
| A7OCB | 200 | 39 | 5 |
| A8OCB | 161 | 41 | 4 |
| A9OCB | 210 | 41 | 5 |
| M1 | 97 | 42 | 2 |
| M2 | 103 | 46 | 2 |
| M3 | 73 | 47 | 2 |
| M4 | 134 | 37 | 4 |
| M5 | 630 | 35 | 18 |
| M6 | 420 | 37 | 11 |
3.2. Mechanical properties
The mechanical properties of the LCEs were examined through stress–strain measurements, dynamic mechanical analysis and through observation of the macroscopic dimension changes of the samples when subject to strain. Such measurements allow the anisotropic elastic moduli and Poisson's ratio of the samples to be determined. The physical properties deduced from the mechanical analysis are detailed in Table 2.| Monomer | b | Young's modulus ‖ (MPa) | Young's modulus ⊥ (MPa) | Ratio of moduli, ‖/⊥ |
|---|---|---|---|---|
| A7OCB | 4.5 | 16.5 | 2.8 | 5.9 |
| A8OCB | 7.5 | 13.3 | 1.8 | 7.4 |
| A9OCB | 14 | 11.3 | 1.8 | 6.3 |
| M1 | 3.4 | 8.2 | 1.6 | 5.1 |
| M2 | 5.7 | 19.0 | 2.2 | 8.6 |
| M3 | 5.2 | 8.7 | 1.7 | 5.1 |
| M4 | 6.4 | 9.1 | 1.9 | 4.7 |
| M5 | 50 | 9.4 | 4.7 | 2.0 |
| M6 | 16 | 71.1 | 48.4 | 1.5 |
3.3. Macroscopic shape change
The macroscopic changes in sample dimensions upon the application of strain were observed using the bespoke apparatus described in the previous literature.5 In brief, samples (of dimensions 20 mm × 2 mm × 0.1 mm) were subject to 0.5 mm strain steps at 10-minute intervals, and the macroscopic size of the samples recorded through a series of images. Fig. 5 shows a schematic of the sample configuration in the experiments, and representative shape change data observed for each sample, plotted as applied engineering strain (x-axis) and measured engineering strain (y-axis). | ||
Fig. 5 The effect of an applied x-strain, perpendicular to the director, on the observed strain in the width (y-axis, black symbols) and thickness (z-axis, open red symbols) of planar aligned samples of each LCE. In all cases, strains are plotted as engineering strains. In all graphs, the blue and yellow lines display the strain behaviour expected for a system with a Poisson's ratio (ν) of 0.5 (i.e. isotropic rubber behaviour) and 1 (incompressible layers) respectively, and the grey dashed lines represent ν of 0. The schematic atop the figure displays the direction of applied strain (ε) relative to the director/smectic layer normal (![[n with combining macron]](https://www.rsc.org/images/entities/i_char_006e_0304.gif) ), with smectic layers being displayed as dark blue lines. ), with smectic layers being displayed as dark blue lines. | ||
In previous work on smectic elastomers, the effect of strain on macroscopic sample size has been examined when strain is applied both parallel and perpendicular to the smectic layer normal (and thus the director).39–47 In this work, attempts to strain each LCE both parallel and perpendicular to the layer normal were also made. However, all cases, the samples failed upon the application of the initial strain step when strained parallel the layer normal. Conversely, when strain is applied perpendicular to the layer normal, strains of up to 0.3 could be routinely achieved prior to failure. Thus, Fig. 5 only details observations made when strain is applied perpendicular to the director/layer normal.
The observed changes in the sample dimensions further support the suggestion that when polymerisation is conducted in the nematic phase, the smectic ordering is frustrated. The materials formed from M1–M4 were seen to contract in both transverse axes (thickness (z) and width (y)), Fig. 5, when subject to strain perpendicular to the director.4 Similar behaviour was observed in A7OCB, A8OCB and A9OCB, which are polymerised in the nematic phase.4 Indeed, such stress–strain behaviour is comparable to that reported for chemically similar nematic LCE samples for low strains (less than ∼0.3).4,5,34 Whilst both axes contract, the samples are anisotropic due to their macroscopic alignment. Thus, the two axes display different Poisson's ratios, <0.5 in the y-axis and >0.5 in the z-axis, which when averaged yield a value of 0.5, typical of elastomeric materials.
The LCEs synthesised in a smectic phase (M5 and M6) which exhibit a higher degree of long-range order also show significant anisotropy when subject to strain perpendicular to the director/layer normal. These materials show minimal changes in width (along the smectic layer normal, black data points in Fig. 5), instead contracting almost exclusively in their thickness with a Poisson's ratio of 1. In the case of M5, which shows the largest correlation lengths, the sample is almost completely incompressible in the direction of the layer normal. For M6, at strains >0.2 some deviation from this behaviour is observed, perhaps due to the slightly lower correlation length observed for M6 relative to M5, suggesting a small degree of frustration of the smectic structure.
Our results can be compared with other studies of smectic A LCEs. In most instances, reports focus on LCEs with siloxane backbones, and those samples show minimal changes in the direction of the layer normal. In such cases, samples deform exclusively in thickness, following a Poisson's ratio of 1, akin to the observations made in this work for M5 and M6.39–47 This was previously suggested to result from an absence of director reorientation under strain, meaning no changes in smectic layer spacings can be observed.39–47 One could therefore suggest that in the case of M5, and for the most part M6, no reorientation of the director is occurring as previously seen in the literature (this hypothesis is investigated in more detail later).
In the case of our LCEs polymerised in the nematic phase and deemed on the basis of the low correlation lengths to show a frustrated smectic structure, the changes in samples’ dimensions suggest that a reorientation event is occurring. This can be understood by assuming that the frustrated smectic structure allows the samples to behave in a manner more typical of nematic LCEs. An example of a reorientation event in a smectic sample was reported by Stannarius et al., who observed a significant change in layer spacing under strain.48 Upon first glance, the work by Stannarius seems to be an interesting comparison to the LCEs reported in this work, as both LCEs contain a significant fraction of non-mesogenic repeat units.48 However, in the Stannarius case, the reorientation event is described as a tilt of the director, allowed because the LCE displays multiple smectic phases, including a smectic C* phase.48 Consequently, in that case, it is suggested that the smectic A phase of the LCE adopted a pre-tilted structure, which upon strain produces a pronounced layer spacing change, associated with a clear tilt of the director.48 The LCEs in this work only show one smectic phase, and thus the same rationale cannot be applied here. The question of the reorientation that occurs in our case is considered further through conoscopic measurements below.
3.4. Smectic layer compressibility
When dealing with smectic LCEs, it is useful to determine the smectic layer compression modulus, B. However, the value of the modulus b, associated with changes in the smectic layer spacing that occur under a deformation can be easier to deduce and is related to B through b = B/μ, where μ is the shear elastic modulus.29 To estimate b, a linear tensile strain, λx, can be applied in-the-plane but perpendicular to the initial layer normal (Fig. 5 schematic), the geometry used in the stress–strain measurements using planar samples. Minimization of the free energy with respect to the deformation in the thickness gives eqn (1),49| λx2λz2 − 1 = b(1 − λxλz) | (1) |
In cases where b is large the smectic layers are effectively incompressible, and the sample remains unchanged in width (y-direction). Consequently, to conserve volume, larger values of b result in more pronounced changes in the sample thickness (z-direction). Table 2 summarizes the values of b for the samples studied here; LCEs polymerized in the smectic phase (M5 and M6) have significantly larger values of (50 and 16 respectively) than those polymerised in the nematic phase. Interestingly, when the same analysis is conducted on a nematic LCE of similar structure, a value of b = 3.5 is observed (A6OCB in Fig. S14, ESI†). This is comparable to the values reported for the LCEs polymerised in the nematic phase in this work (b = 3.4–7.5), further supporting their nematic-like behaviour. The only outlier in this analysis is the previously reported LCE produced with A9OCB, which shows a relatively high b value of 14. It is however of note that these samples fail at relatively low strains compared to the other LCEs polymerised in the nematic phase, which may contribute to the fitting used to calculate b being less precise than for other samples.
3.5. Anisotropy of Youngs’ moduli
We now consider the Young's moduli recorded for each sample (Table 2), calculated based on stress–strain curves, representative examples of which can be seen in Fig. S15 (ESI†). These data were recorded using the tensile experimental functionality of a DMA instrument. Samples of each LCE were strained both parallel and perpendicular to the director, to examine the anisotropy in Young's moduli. It is of note that the samples can reach larger strains in the stress–strain data than were observed in our bespoke apparatus used for macroscopic shape-change observations, and indeed can be strained to values of 0.2 without failure when strained parallel to the director. This is due to a difference in the strain rate (strain of 0.06 per minute for stress–strain measurements vs. 0.025 every 10 minutes in shape change measurements), and the nature of the strain applied, i.e. a steady application of strain vs. strain steps (as is the case in the dimension change experiments).The LCEs polymerized in the nematic phase (AnOCB and M1–M4) display anisotropy in their Young's moduli of approximately one order of magnitude, values being between 4.7–8.6 times greater parallel to the director than perpendicular. This degree of anisotropy is typical for nematic LCEs,30 and was also observed for the main-chain smectic LCEs reported by Beyer et al.50 In the case of the LCEs reported by Beyer et al., the nematic-like anisotropy is assumed to be due to short correlation lengths.50 Such an explanation is consistent for the LCEs reported here polymerized in the nematic phase where the short correlation lengths, correlate with nematic-like mechanical anisotropy. It should however also be noted, that according to De Gennes, when polymerized in a nematic solvent and the solvent removed post cross-linking, the LCE backbone can adopt a more isotropic conformation than is typical of a smectic LCE.32 This more isotropic backbone conformation offers an alternative explanation for the low anisotropy in the Youngs moduli.
More typically in smectic systems, the modulus parallel to the director/layer normal is two orders of magnitude greater than that perpendicular to it, attributed to the large layer compression modulus which resists the change in layer spacing that must occur to accommodate a strain parallel to the layer normal.39–47 Unusually, in the case of our LCEs polymerized in the smectic phase (M5 and M6), and with high correlation lengths, a very low degree of anisotropy is observed, with moduli parallel to the director being between 1.5 and 2 times larger than perpendicular. The highly monodomain nature of our samples which was confirmed optically and via X-ray scattering allows us to rule out poor alignment of the samples causing such an effect (a polydomain sample would be expected to show minimal mechanical anisotropy), thus this small degree of anisotropy is surprising. We suggest that this results from the polymer backbone adopting a more isotropic-like conformation than is typical for aligned LCEs, due to the washout step. De Gennes’ work suggests that a system swollen with a smectic solvent would result in a highly anisotropic conformation.32 However, the exact nature of the system described by De Gennes suggests a simple macromolecular chain, whereas we consider a liquid crystalline polymer, within a liquid crystalline solvent. Thus, we suggest our system is sufficiently different to the system envisioned by theory, to account for the deviation from his prediction.
3.6. Effect of strain on network symmetry
In the previous work detailing the synthesis of LCEs from the AnOCB monomers, it was observed that upon the application of strain perpendicular to the layer normal, the initially uniaxial samples show biaxial nature; this is most clearly observed by undertaking conoscopy on the homeotropic samples.4 While a biaxial response was unsurprising for the nematic LCE homologues, the biaxiality was also seen in the smectic LCEs (A7OCB, A8OCB and A9OCB). We therefore undertook conoscopy measurements on the LCEs reported herein where homeotropic alignment could be achieved, to examine if a similar uniaxial to biaxial transition is observed. A representative set of conoscopic figures obtained for the M3 LCE sample prior to, and upon the application of strain are displayed in Fig. 6, with the observations being consistent for the LCEs synthesised with M1–M4. | ||
| Fig. 6 Conoscopic figures for unstrained and strained samples of the LCE synthesised with M3. The strain applied (ε) and the orientation of the polarisers (denoted by the crossed white arrows) are reported for each image. Strain is applied in the x direction, as depicted by axes on the left-hand side of the figure. | ||
In all cases, the initial uniaxial nature of the LCEs is confirmed by the ‘Maltese cross’ texture, which rotates upon rotation of the polarisers, indicative of a uniaxial system. Upon the application of even a very small strain, the conoscopic figures exhibit two melatopes, indicating the emergence of two optical axes, and therefore confirming a biaxial nature, consistent with the findings reported for the AnOCB LCEs.4 We suggest that the biaxial deformation, which is characteristic of auxetic nematic LCEs, is further evidence that when polymerised in the nematic phase, the smectic LCEs adopt a frustrated structure, and in general adopt nematic-like mechanical behaviour.
To further enhance our understanding of the deformations occurring under a strain applied perpendicular to the director, X-ray scattering data were collected as a function of strain for selected LCEs. As a representative of the LCEs polymerised in the nematic phase and clearly exhibiting a biaxial response, data were collected for LCEs synthesised with A7OCB, M1 and M2; Additionally, data were collected for both LCEs polymerised in the smectic phase (M5 and M6). The smectic layer spacings as a function of strain are displayed in Fig. S10 (ESI†), and in all cases show no notable change, within experimental error, as a function of applied strain up to sample failure. This suggests the b values for all samples are sufficiently high to resist layer compression, even those which appear to be rather low (b ∼ 4, Table 2).
These observations are interesting given that a macroscopic reduction in width parallel to the director as observed would be expected to correspond to a reduction in smectic layer spacing. However, over the strain range studied by X-ray scattering (up to 0.15 applied X-strain), the reduction in sample width seen is less than 3%, for all samples. This would correspond to a change in layer spacing of fractions of Angstroms, which would be within the experimental error of the technique applied. Thus, the lack of an observed layer spacing change is consistent with the mechanical behaviour. It is also worth noting that the lack of change of layer spacing in these systems, as well as a lack of a change in the angle between WAXS and SAXS signals, shows that there is no strain-induced transition to the Smectic-C phase (Fig. S6, ESI†). We can also rule out a strain-induced transition from a Smectic-A to nematic phase as the smectic correlation length does not change on strain. These observations together allow us to conclude the samples show biaxial smectic A ordering upon strain.
Considering the observations on network symmetry as a whole, one could ask how can the biaxial order, that definitely emerges in the frustrated smectic systems, be generated without a strain induced tilt or change in layer structure? We suggest that the observations reported in this work can be explained simply by the macroscopic dimension changes observed. If we start with an ellipsoidal backbone (as expected for aligned LCEs, even if the degree of anisotropy is low as is suggested in this work), applying a strain to the ellipsoid will require one or both transverse axes to change in dimension to conserve volume. In the case of this work, due to layer incompressibility, these constraints result in the emergence of biaxial order. Our data show that this is unequivocally the case for M1–M4, and strongly suggest that this it also true for M5 and M6.
4. Conclusions
When considered as a whole, these findings present clear evidence that the phase in which the polymerisation is conducted when synthesising smectic LCEs has a significant impact on their mechanical properties, behaviour predicted many years ago by De Gennes for simple macromolecules. Samples polymerised in a nematic phase that develop smectic ordering upon curing are found to show relatively small smectic correlation lengths, consistent with quasi long-range order. Indeed, in such samples (M1–M4) order extends over at most 5 smectic layers. We suggest these samples adopt a frustrated smectic structure, which in turn results in lower resistance to layer compression (by factor of approximately 5), leading to many of their mechanical properties showing a more typically nematic-like behaviour.Conversely, when polymerisation is conducted in a smectic phase, the LCEs adopt a structure with greater long-range ordering. This manifests as larger correlation lengths, existing over tens of smectic layers. In such samples, there is a much larger resistance to changes in smectic layer spacing, seen through the modulus b. In terms of macroscopic deformation, these samples behave mechanically in a manner largely similar to previously reported smectic LCEs. However, M5 and M6 present a significantly lower anisotropy in their Young's moduli than previously reported smectic LCEs, which we suggest is the result of the polymer backbone adopting a more isotropic conformation than has previously been observed in smectic LCEs. We present evidence that for all materials produced, the mechanical deformation results in the emergence of biaxial smectic A order. We speculate that such a mechanically induced uniaxial smectic A to biaxial smectic A transition is more general in smectic LCEs than previously thought.
Author contributions
Conceptualisation: S. R. B., T. R., and H. F. G.; data curation: S. R. B, T. R., A. S. and M. C.; formal analysis: S. R. B, T. R., A. S., M. C., and E. J. C.; funding acquisition: R. J. M and H. F. G.; investigation: S. R. B, T. R., A. S. and M. C.; methodology:, S. R. B, T. R., A. S. and M. C.; project administration: S. R. B and H. F. G., resources: S. R. B. and R. J. M., software: E. J. C and R. J. M., supervision: H. F. G., validation: S. R. B and T. R., visualisation: S. R. B, writing – original draft preparation: S. R. B., T. R., and A. S.; writing – review and editing: S. R. B, T. R., A. S., M. C., E. J. C., R. J. M. and H. F. G.Data availability
The data underlying this study are openly available at: S. R. Berrow, T. Rasitrick, A. Street, E. J. Cooper, M. Colman, R. Mandle and H. F. Gleeson, (2025): Dataset associated with “The Effect of Templating on the Mechanical Properties of Smectic Liquid Crystal Elastomers”. University of Leeds. [Dataset], https://doi.org/10.5518/1673.Conflicts of interest
H. F. G. holds a position on the board of Auxetec Ltd (Company number 12925662), and both H. F. G. and T. R. are shareholders in Auxetec Ltd.Acknowledgements
The authors would like to acknowledge funding from the Engineering and Physical Sciences Research Council, Grant Number EP/V054724/1, for allowing us to conduct the research. RJM acknowledges UKRI for a Future Leaders Fellowship (grant MR/W006391/1). We would also like to acknowledge grant number EP/X0348011 for the purchase of the SAXS/WAXS system used in this work. The funders had no role in the design of the study; in the collection, analyses, or interpretation of data; in the writing of the manuscript; or in the decision to publish the results.References
- J. Lagerwall, Programmable Mater., 2023, 1, 1–46 CrossRef.
- K. M. Herbert, H. E. Fowler, J. M. McCracken, K. R. Schlafmann, J. A. Koch and T. J. White, Nat. Rev. Mater., 2022, 7, 23–38 CrossRef CAS.
- T. Moorhouse and T. Raistrick, Adv. Opt. Mater., 2024, 12, 2400866 CrossRef CAS.
- S. R. Berrow, T. Raistrick, R. J. Mandle and H. F. Gleeson, Polymers, 2024, 16, 1957 CrossRef CAS.
- D. Mistry, S. D. Connell, S. L. Mickthwaite, P. B. Morgan, J. H. Clamp and H. F. Gleeson, Nat. Commun., 2018, 9, 5095 CrossRef CAS PubMed.
- D. Mistry, M. Nikkhou, T. Raistrick, M. Hussain, E. I. L. Jull, D. L. Baker and H. F. Gleeson, Macromolecules, 2020, 53, 3709–3718 CrossRef CAS.
- Y. Yao, E. He, H. Xu, Y. Liu, Z. Yang, Y. Wei and Y. Ji, Nat. Commun., 2023, 14, 3518 CrossRef CAS.
- Y. Jiang, X. Dong, S. Zhu, S. Dai, H. Bai, Q. Li, L. Li, N. Yuan and J. Ding, Colloids Surf., B, 2023, 222, 113110 CrossRef CAS PubMed.
- T. Guin, M. J. Settle, B. A. Kowalski, A. D. Auguste, R. V. Beblo, G. W. Reich and T. J. White, Nat. Commun., 2018, 9, 2531 CrossRef.
- G. E. Bauman, J. M. McCracken and T. J. White, Angew. Chem., Int. Ed., 2022, 61, e202202577 CrossRef CAS.
- S. J. D. Lugger, D. J. Mulder, M. G. Debije and A. P. H. J. Schenning, Liq. Cryst., 2024, 51, 2137–2143 CrossRef CAS.
- C. Ohm, M. Brehmer and R. Zentel, Adv. Mater., 2010, 22, 3366–3387 CrossRef CAS.
- H. Guo, C. Liang, T. P. Ruoko, H. Meteling, B. Peng, H. Zeng and A. Priimagi, Angew. Chem., Int. Ed., 2023, 62, e202309402 CrossRef CAS PubMed.
- P. A. Pranda, A. Hedegaard, H. Kim, J. Clapper, E. Nelson, L. Hines, R. C. Hayward and T. J. White, ACS Appl. Mater. Interfaces, 2024, 16, 6394–6402 CrossRef CAS.
- T. Ohzono, M. O. Saed and E. M. Terentjev, Adv. Mater., 2019, 31, 1902642 CrossRef.
- H. Guo, M. O. Saed and E. M. Terentjev, Macromolecules, 2023, 56, 6247–6255 CrossRef CAS PubMed.
- H. J. Farre-Kaga, M. O. Saed and E. M. Terentjev, Adv. Funct. Mater., 2022, 32, 2110190 CrossRef CAS.
- G. R. Mitchell, F. J. Davis, A. Ashman and J. J. Thomson, Polymer, 1987, 28, 639–647 CrossRef CAS.
- C. T. Imrie, F. E. Karasz and G. S. Attard, Macromolecules, 1993, 26, 3803–3810 CrossRef CAS.
- F. E. Karasz and G. S. Attard, Macromolecules, 1993, 26, 545–550 CrossRef.
- D. Stewart and C. T. Imrie, Macromolecules, 1997, 30, 877–884 CrossRef CAS.
- A. A. Craig and C. T. Imrie, Macromolecules, 1995, 28, 3617–3624 CrossRef CAS.
- A. A. Craig and C. T. Imrie, Polym. Vol., 1997, 38, 4951–4957 CrossRef CAS.
- D. R. Mulligan, C. T. Imrie and P. Larcey, J. Mater. Sci., 1996, 31, 1985–1989 CrossRef CAS.
- C. T. Imrie, F. E. Karasz and G. S. Attard, Macromolecules, 1992, 25, 1278–1283 CrossRef CAS.
- H. Finkelmann, J. Koldehoff and H. Ringsdorf, Angew. Chem., Int. Ed. Engl., 1978, 17, 935–936 CrossRef.
- H. Finkelmann, H. Ringsdorf and J. H. Wendorff, Die Makromol. Chem., 1978, 179, 273–276 CrossRef CAS.
- H. Guo, M. O. Saed and E. M. Terentjev, Soft Matter, 2022, 18, 4803–4809 RSC.
- M. Warner and E. M. Terentjev, Liquid Crystal Elastomers, Oxford University PressOxford, Oxford, 2003 Search PubMed.
- D. Mistry, P. B. Morgan, J. H. Clamp and H. F. Gleeson, Soft Matter, 2018, 14, 1301–1310 RSC.
- E. I. L. Jull, R. J. Mandle, T. Raistrick, Z. Zhang, P. J. Hine and H. F. Gleeson, Macromolecules, 2022, 55, 4320–4330 CrossRef CAS.
- P. G. De Gennes, Phys. Lett., 1969, 28A, 725–727 CrossRef.
- S. R. Berrow, R. J. Mandle, T. Raistrick, M. Reynolds and H. F. Gleeson, Macromolecules, 2024, 57, 5218–5229 CrossRef CAS.
- Z. Wang, T. Raistrick, A. Street, M. Reynolds, Y. Liu and H. F. Gleeson, Materials, 2023, 16, 393 CrossRef CAS PubMed.
- E. J. Cooper, M. Reynolds, T. Raistrick, S. R. Berrow, E. I. L. Jull, V. Reshetnyak, D. Mistry and H. F. Gleeson, Macromolecules, 2024, 57, 2030–2038 CrossRef CAS PubMed.
- W. H. de Jeu and B. I. Ostrovskii, Adv. Polym. Sci., 2012, 250, 187–234 CrossRef CAS.
- D. T. Kennedy, J. D. Hoang, M. F. Toney and T. J. White, Macromolecules, 2024, 57, 10032–10040 CrossRef CAS.
- D. M. Lambreva, B. I. Ostrovskii, H. Finkelmann and W. H. De Jeu, Phys. Rev. Lett., 2004, 93, 185702 CrossRef PubMed.
- E. Nishikawa and H. Finkelmann, Macromol. Chem. Phys., 1999, 200, 312–322 CrossRef CAS.
- E. Nishikawa and H. Finkelmann, Macromol. Chem. Phys., 1997, 198, 2531–2549 CrossRef.
- E. Nishikawa, H. Finkelmann and H. R. Brand, Macromol. Rapid Commun., 1997, 18, 65–71 CrossRef CAS.
- I. Kundler, E. Nishikawa and H. Finkelmann, Macromol. Symp., 1997, 117, 11–19 CrossRef CAS.
- N. Aßfalg and H. Finkelmann, Macromol. Chem. Phys., 2001, 202, 794–800 CrossRef.
- A. Komp and H. Finkelmann, Macromol. Rapid Commun., 2007, 28, 55–62 CrossRef CAS.
- J. Weilepp, P. Stein, N. Assfalg, H. Finkelmann, P. Martinoty and H. R. Brand, Europhys. Lett., 1999, 47, 508–514 CrossRef CAS.
- D. Kramer and H. Finkelmann, Macromol. Rapid Commun., 2007, 28, 2318–2324 CrossRef CAS.
- D. Kramer and H. Finkelmann, Macromol. Rapid Commun., 2011, 32, 1539–1545 CrossRef CAS PubMed.
- R. Stannarius, R. Köhler, M. Rössle and R. Zentel, Liq. Cryst., 2004, 31, 895–906 Search PubMed.
- J. M. Adams and M. Warner, Phys. Rev. E: Stat., Nonlinear, Soft Matter Phys., 2005, 71, 021708 Search PubMed.
- P. Beyer, E. M. Terentjev and R. Zentel, Macromol. Rapid Commun., 2007, 28, 1485–1490 Search PubMed.
Footnote |
| † Electronic supplementary information (ESI) available. See DOI: https://doi.org/10.1039/d5tc01484k |
| This journal is © The Royal Society of Chemistry 2025 |