 Open Access Article
Creative Commons Attribution 3.0 Unported Licence
Ionic liquids containing tricyanomethanide anions: physicochemical characterisation and performance as electrochemical double-layer capacitor electrolytes†
Vitor L.
Martins
 *ab,
Anthony J. R.
Rennie
 *a,
Roberto M.
Torresi
b and
Peter J.
Hall
a
aChemical and Biological Engineering, University of Sheffield, Sir Robert Hadfield Building, Mappin Street, Sheffield S1 3JD, England, UK. E-mail: v.l.martins@sheffield.ac.uk; a.rennie@sheffield.ac.uk
bInstituto de Química, Universidade de São Paulo – C.P. 26077, CEP 05513-970, São Paulo, SP, Brazil
First published on 19th June 2017
Abstract
We investigated the use of fluorine free ionic liquids (ILs) containing the tricyanomethanide anion ([C(CN)3]) as an electrolyte in electrochemical double-layer capacitors (EDLCs). Three cations were used; 1-butyl-3-methylimidazolium ([Im1,4]), N-butyl-N-methylpyrrolidinium ([Pyr1,4]) and N-butyl-N-methylpiperidinium ([Pip1,4]). Their physicochemical properties are discussed alongside with their performance as electrolytes. We found that the cyano-based ILs present higher ionic conductivity (9.4, 8.7 and 4.2 mS cm−1 at 25 °C for [Im1,4], [Pyr1,4] and [Pip1,4], respectively) than the widely studied IL containing the bis(trifluoromethylsulfonyl)imide anion, namely [Pyr1,4][Tf2N] (2.7 mS cm−1 at 25 °C). Of the three ILs investigated, [Pip1,4][C(CN)3] presents the widest electrochemical stability window, 3.0 V, while [Pyr1,4][C(CN)3] is stable up to 2.9 V and its [Tf2N] analogue can operate at 3.5 V. Despite operating at a lower voltage, [Pyr1,4][C(CN)3] EDLC is capable of delivering up to 4.5 W h kg−1 when operating at high specific power of 7.2 kW kg−1, while its [Pyr1,4][Tf2N] counterpart only delivered 3.0 W h kg−1 when operated at similar power.
Introduction
Electrochemical double-layer capacitors (EDLCs), or supercapacitors, are energy storage devices that can deliver charge at high rates, typically discharging over a few milliseconds up to several minutes.1–4 The main difference between EDLCs and batteries is their charge storage mechanism; where batteries store energy through electrochemical reactions, EDLCs rely on the electrostatic interaction between electrode surfaces and electrolyte ions, i.e. the double-layer.4 Consequently, batteries can store substantially more charge than EDLCs, whereas EDLCs can supply charge at rates that cannot be safely delivered by batteries. As no structural changes occur during cycling, the cycle life of EDLCs are substantially greater than batteries, often reported as being in excess of 100![[thin space (1/6-em)]](https://www.rsc.org/images/entities/char_2009.gif) 000 cycles.
000 cycles.
Currently available EDLCs are typically composed of two activated carbon (AC) electrodes and an electrolyte based on tetraethylammonium tetrafluoroborate (TEABF4) in propylene carbonate (PC) or acetonitrile (ACN). ACs generally possess an active surface area greater than 1000 m2 g−1 and organic solvents can yield electrolytes with high ionic conductivity.5–9 However, the low electrochemical stability of the organic solvent limits the operating voltage to around 2.5–2.7 V.2,10 The maximum operating voltage, or electrochemical stability window (ESW), is a crucial parameter in the design of high energy devices, since E = 1/2 CV2, where C is the cell capacitance (F g−1) and V is the operating voltage (V). Therefore, the search for new electrolytes is driven by the need for higher energy EDLCs.11–14
Ionic liquids (ILs) are a class of material that has been extensively studied and are considered as an alternative to organic solvent-based electrolytes in energy storage devices, not only due to their intrinsic ionic conductivity but also due to their high chemical and thermal stability, non-flammability, negligible vapour pressure, high electrochemical stability and they can be considered to be less hazardous than organic solvent-based electrolytes.15–18 ILs are salts that normally contain an asymmetric cation and an anion with delocalised charge, which results in weak ionic interactions. Conventionally, salts that display a melting temperature lower than 100 °C are considered to be ILs.19,20 For applications in energy storage devices, the IL N-butyl-N-methylpyrrolidinium bis(trifluoromethylsulfonyl)imide ([Pyr1,4][Tf2N]) is widely studied due to its wide ESW (from 3.0 up to 3.7 V depending on the electrode material)15,21–23 and good ionic conductivity (2.7 mS cm−1 at 25 °C). Other groups of ILs have also been investigated due to their desirable characteristics such as wide ESW or high ionic conductivity; such as sulfonium,24 phosphonium,25 and azepanium based ILs.26 Recently, Wolff et al.27 reported the use of dicyanamide anion ([N(CN)2]) based ILs to obtain high power EDLCs. They found that even operating at a lower voltage than [Pyr1,4][Tf2N], the EDLCs containing [N(CN)2] anions could store more energy at a relatively high discharge rates.
Another cyano-based anion that displays interesting physicochemical properties is the tricyanomethanide anion ([C(CN)3]),28,29 and ILs containing this anion have been considered as Li-ion battery electrolytes.30,31 Carvalho et al.32 reported that 1-butyl-3-methylimidazolium tricyanomethanide ([Im1,4][C(CN)3]) exhibits a significantly lower viscosity of 27.5 mPa s at 25 °C than [Im1,4][Tf2N] (50 mPa s).33 In addition, ILs containing cyano-based anions are fluorine free and generally exhibit a low density (close to 1.0 g cm−3) which may result in cells with an overall higher gravimetric specific energy and increased safety.
Herein, we report the physicochemical properties of three ILs containing the [C(CN)3] anion, namely 1-butyl-3-methylimidazolium tricyanomethanide ([Im1,4][C(CN)3]), N-butyl-N-methylpyrrolidinium tricyanomethanide ([Pyr1,4][C(CN)3]) and N-butyl-N-methylpiperidinium tricyanomethanide ([Pip1,4][C(CN)3]). Fig. 1 illustrates the structures of the ions present in the studied ILs. The ESW of each IL was determined in order to assemble EDLCs and characterise their electrochemical performance using cyclic voltammetry (CV), galvanostatic charge–discharge and electrochemical impedance spectroscopy (EIS). We found that the [C(CN)3] containing ILs have high ionic conductivity and that the EDLC using [Pyr1,4][C(CN)3] electrolyte stores more energy when operating at higher power than its [Tf2N] containing analogue.
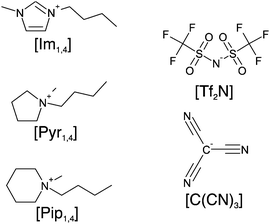 | ||
| Fig. 1 Schematic structure of ions in the ionic liquids: cations [Im1,4], [Pyr1,4] and [Pip1,4], and the anions [Tf2N] and [C(CN)3]. | ||
Experimental details
[Im1,4][C(CN)3], [Pyr1,4][C(CN)3] and [Pyr1,4][Tf2N] were purchased from Io-Li-Tec GmbH (>99%, Germany). [Pip1,4][C(CN)3] was prepared by ion-exchange reaction of [Pip1,4]Br (Io-Li-Tec) and Na[C(CN)3] (Io-Li-Tec) diluted in aqueous solution as described elsewhere.34 All ILs were dried under vigorous agitation at 100 °C inside an Ar-filled glovebox (MBraun, H2O < 0.1 ppm, O2 < 0.1 ppm). The quantity of moisture was determined by Karl–Fischer titration (KF899 Coulometer, Metrohm) and ILs were used only when the water concentration was below 10 ppm.Thermal stability was determined by thermogravimetric analysis (TGA) (TGA/DSC1, Mettler Toledo). Approximately 20 mg of sample was heated in an Al pan from room temperature to 600 °C at 10 °C min−1 under N2 flow (50 cm3 min−1) monitoring mass loss and heat change. Differential Scanning Calorimetry (DSC) was performed using a DSC1 (Mettler Toledo) with liquid N2 cooling. Approximately 10 mg of sample was added to an Al pan and sealed in the Ar-filled glovebox. Samples were cooled to −120 °C at −10 °C min−1 and held at this temperature for one hour. Samples were then heated to 100 °C at 10 °C min−1.
Density and viscosity were measured using a thermoregulated digital densimeter/viscometer (SVM 3000, Anton Paar K.G.). Ionic conductivity at a range of temperatures was determined using the impedance method with a Modulab XCM (Solartron) over a frequency range from 100 kHz to 10 mHz in an environmental chamber (Maccor MTC-010). Roughly 0.5 mL of liquid was sealed in a BioLogic HTC cell, containing parallel platinised Pt plates, in an Ar-filled glovebox. The cell constant of 1.0 was confirmed with a KCl standard solution.
Electrodes were prepared using AC (SBET = 1930 m2 g−1), conductive carbon black (Super C45, Imerysys G&C) and polymer binder (Teflon 30-N, Alfa Aesar). The components were mixed in a ratio of 80-10-10 (by mass) in ethanol until a dough like consistency was observed. The mixture was then rolled to the desired thickness and punched into 12 mm diameter discs. Electrodes were dried overnight under vacuum at 80 °C before cell assembly. The mass loading ranged from 1.0 to 4.5 mg cm−2, with thicknesses ranging from 50 to 300 μm.
Coin cells (2016) were assembled using stainless steel spacers, carbon electrodes, and a glass fibre separator (GF/F, Whatman) soaked with the IL under study. The cells were kept in the glovebox anti-chamber under vacuum for at least five minutes at ca. 50 °C to improve electrolyte impregnation into electrodes. Cells were crimped inside the glovebox.
The ESW of each IL was determined using a Solartron Analytical 1470E Multichannel Potentiostat/Galvanostat. Cyclic voltammetry (CV) was carried out on cells with five initial cycles at 5 mV s−1 between 0 and 0.5 V (vs. OCP). Four subsequent cycles were performed before the CV window was increased in 0.1 V steps up to 2.5 V, performing four cycles with each increment. The same procedure was run on a fresh cell to determine the negative stability, however in this case initial cycling was between 0 and −1.0 V (vs. OCP), with 0.1 V increments recorded until −3.0 V. The quantities of charge passed during the charge (qcharge) and discharge (qdischarge) processes were calculated by the integration of current over time. The difference of charge (Δq = qdischarge − qcharge) is a measure of coulombic efficiency, with a value of zero representing a fully reversible process. A sharp increase in Δq vs. E indicates that faradaic reactions related to the decomposition of electrolyte has occurred. Therefore, the sum of the potential windows before these sharp increases for the positive and negative scans represents the ESW of the IL.
Cyclic voltammetry was also performed on cells using the set up described above from 0 V to the determined ESW at different scanrates. Cells were also cycled galvanostatically at different rates from 0.5 to 10 A g−1, using a Maccor 4000 M. EIS was performed at OCP using a Modulab XCM (Solartron). A 10 mV perturbation in the frequency range of 100 kHz to 10 mHz was used. All experiments were carried out at 25 °C in environmental chambers unless otherwise stated.
Specific capacitance was calculated from CV considering the charge delivered during discharge as shown in eqn (1):
 | (1) |
 | (2) |
 | (3) |
 | (4) |
 | (5) |
Results and discussion
Thermoanalyses and physicochemical properties
Thermal analyses of three ILs containing the [C(CN)3] anion are illustrated in Fig. 2. Fig. 2a shows that the ILs are thermally stable up to 300 °C, and that [Im1,4][C(CN)3] exhibits a slightly higher stability (up to 320 °C). DSC measured during the TGA (Fig. 2b) shows the exothermic decomposition of the liquids, with peaks at 355, 346 and 352 °C for the ILs [Im1,4][C(CN)3], [Pyr1,4][C(CN)3] and [Pip1,4][C(CN)3], respectively. In addition, Fig. 2c shows the DSC traces of the ILs when heated from −120 to 100 °C. [Im1,4][C(CN)3] solely presents glass transition temperature (Tg) at −78 °C and no further peaks are observed, indicating that this liquid does not go a through phase transition but forms an amorphous glass. On the other hand, [Pyr1,4][C(CN)3] and [Pip1,4][C(CN)3] present glass transitions at −88 and −71 °C, respectively, followed by exothermic and endothermic peaks, suggesting that both ILs go through cold crystallisation (−28 and −3.8 °C, respectively) before melting at −1.3 and 17 °C, respectively. The thermal behaviour of the ILs is summarised in Table 1.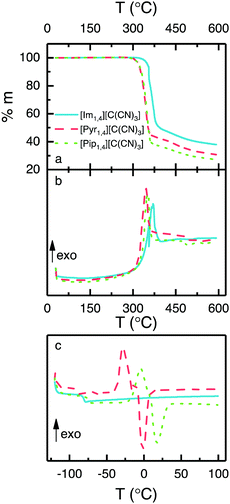 | ||
| Fig. 2 Thermal analyses of ILs containing [C(CN)3] anion, (a) TGA, (b) DSC measured during TGA and (c) DSC. | ||
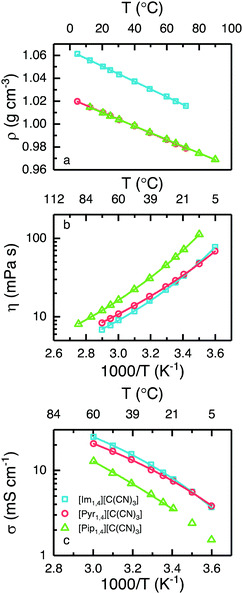
It is known that ILs containing anions based on the cyano group present a significantly lower density when compared with those containing the [Tf2N] anion.24,27,34–36 The variation in density with temperature for each of the ILs is presented in Fig. 3a. At 25 °C, [Im1,4][C(CN)3] exhibits a density of 1.05 g cm−3, whereas [Pyr1,4][C(CN)3] and [Pip1,4][C(CN)3] present exactly the same density, 1.01 g cm−3.
Considering that [Pyr1,4][Tf2N] displays a density of 1.40 g cm−3,24 the [C(CN)3] analogues have a substantially lower density. Practically, EDLCs using the cyano- based liquid could exhibit a higher gravimetric energy density than cells using the same volume of [Pyr1,4][Tf2N]. As anticipated, the density decreases with increasing temperature and notably, [Pyr1,4][C(CN)3] possesses a density lower than 1.0 g cm−3 at temperatures in excess of 40 °C. Generally, the anion has a greater impact in the ILs density than the cation. But the small differences among the ILs densities in this study can be explained by the different cation volume. As [Im1,4] cation presents the smallest volume, the density is the highest. Surprisingly, even with the cations [Pyr1,4] and [Pip1,4] presenting different volumes, their densities are practically the same in the temperatures studied. The lines in Fig. 3a are the linear fit of density in function of temperature (r2 = 0.999). The equation intercept y at 1.06, 1.02 and 1.02 g cm−3 for [Im1,4], [Pyr1,4] and [Pip1,4] ILs, respectively, whereas equations slopes are −6.71 × 10⁻⁴, −6.06 × 10⁻⁴ and −5.90 × 10⁻⁴ g cm−3 °C−1, respectively.
[Im1,4][C(CN)3] and [Pyr1,4][C(CN)3] display similar rheology over the studied temperature range, see Fig. 3b, with values of 27.5 and 29.0 mPa s being determined at 25 °C, respectively; this is in excellent agreement with previously reported values for [Im1,4][C(CN)3].32 Despite showing similar values of viscosity, relative changes in viscosity with increases in temperature differ slightly with [Pyr1,4][C(CN)3] displaying a higher viscosity than [Im1,4][C(CN)3] at high temperatures, however this changes at around 16 °C, below which [Pyr1,4][C(CN)3] is less viscous. On the other hand, [Pip1,4][C(CN)3] is more viscous than both ILs in the entire temperature range, determined as 57.8 mPa s at 25 °C.
The ionic conductivity of the ILs is presented in Fig. 3c, and as can be expected from the similarities in their viscous behaviour, [Im1,4][C(CN)3] and [Pyr1,4][C(CN)3] exhibit similar values of ionic conductivity; at 25 °C the determined values of ionic conductivity are 9.4 and 8.7 mS cm−1 respectively. Interestingly, the values of ionic conductivity intersect at a lower temperature than indicated by the changes in viscosity, around 10 °C, [Im1,4][C(CN)3] has higher ionic conductivity at temperature higher than 10 °C. The change in trends for the ILs [Im1,4][C(CN)3] and [Pyr1,4][C(CN)3] may be related to different aggregates at different temperatures. [Pip1,4][C(CN)3] presents the lowest ionic conductivity among the three liquids, which can be attributed to its higher melting temperature. (For comparison, the ionic conductivity measured at 25 °C was 4.2 mS cm−1). The three ILs present higher ionic conductivity than [Pyr1,4][Tf2N] (2.7 mS cm−1 at 25 °C). [Im1,4][C(CN)3] lower viscosity and higher ionic conductivity can be explained due to the imidazolium aromatic ring, as it guarantees a more delocalised positive charge, decreasing the coulombic interactions between cation and anion; the same effect is observed when different anions are used with imidazolium cations. On the other hand, [Pip1,4][C(CN)3] presents poorer transport properties than [Pyr1,4][C(CN)3] due to its larger cation size, which hampers its movement.
When ionic conductivity and fluidity (reciprocal viscosity) are expressed in the form of a Walden plot (Fig. S1 in ESI†), the “ionicity” of the ILs can be compared. This is related to how free the ions are to transport charge because they may form aggregates, diminishing the concentration of charge. In Walden plot this is evidenced by the extent of the deviation of ionic conductivity from the ideal value to that specific liquid fluidity.37,38 The three ILs containing the anion [C(CN)3] present similar ionicity. Behaviour as closer to the ideal KCl line indicates higher ionicity, indicating that there are more free ions available to carry charge. It is worth noting that the [C(CN)3] anion containing ILs are associated with a lower degree of ionicity than ILs containing cyano based anions such as tetracyanoborate ([B(CN4)]) and dicyanamide ([N(CN)2]) ILs,36 see Fig. S1 (ESI†) for comparison.
The lines in Fig. 3b and c represent the best fit by the Vogel–Tammann–Fulcher (VTF) equations, η = η0eB/T−T0 for viscosity, and σ = σ0e−B/T−T0 for ionic conductivity, where η0, σ0, B and T0 are adjustable parameters,39 which are provided in Tables S1 and S2, in ESI.† The relationship B/T0 is related to liquid fragility; strong liquids have low values of B/T0, meaning that changes in temperature have low degree of influence on their transport properties, on the other hand, fragile liquids display high values of B/T0 and changes in temperature will have a greater impact on their transport properties. The [C(CN)3] ILs present lower values of B/T0 when compared to [Pyr1,4][Tf2N],24 indicating that they are less fragile than their [Tf2N] analogue. Among the three [C(CN)3] anion containing ILs, [Im1,4][C(CN)3] exhibits the lowest value of B/T0. Although the best fit for the [Pip1,4][C(CN)3] ionic conductivity is presented in Fig. 3c, the narrower temperature range studied (limited by its relatively high melting temperature) generates less reliable values. It is worth noting that liquid fragility classification is often made near the glass transition temperature, and deviation of the fit over an extended temperature range needs to be considered.40 A summary of the physicochemical properties of ILs at 25 °C is included in Table 1.
Electrochemical double-layer capacitor performance
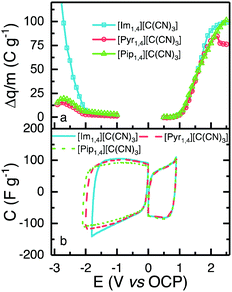
To obtain the highest energy density possible that each IL can deliver, it is important to determine the widest reliable operating potential of the devices, considering the electrolyte and electrode materials employed.The ESW of the ILs was determined using a method described elsewhere.24 In summary, positive and negative limits are determined separately, using fresh cells, by conducting cyclic voltammetry at 5 mV s−1. Each cell has a working electrode with the same composition as used in the EDLC, and a counter electrode with at least 20 times more active material than the working electrode. After pre-conditioning the cells with five cycles to 0.5 V, for positive or −1.0 V for the negative determination, the voltage window was increased by 0.1 V and then four cycles were performed. The window was increased in 0.1 V increments up to values of 2.5 and −3.0 V, for positive and negative determination, respectively. The difference of charge (Δq, C g−1) between the charge and discharge processes was calculated for each electrochemical window, and is presented in Fig. 4a; an increase in Δq signifies a less efficient charge–discharge process, indicating that faradaic reactions occur at the determined voltage. In order to select a positive and a negative limit, the second derivative of Δq was calculated, and the observation of a sharp increase in the value of the second derivative was used to define the operating potential limit. [Im1,4][C(CN)3], [Pyr1,4][C(CN)3] and [Pip1,4][C(CN)3] present the same positive limit of 0.9 V, which is understandable as they share the same anion, and negative limits of −1.8, −2.0 and −2.1 V, respectively. [Im1,4] is known to be less stable than other cations due to the acidic proton present on the carbon in the aromatic ring.34 Overall, the determined operating potentials were 2.7, 2.9 and 3.0 V, respectively. Fig. 4b shows CVs over the determined potentials for positive and negative scans; it is evident that there are no faradaic reaction peaks observed over the operating potential range and that they display the profile expected for EDLCs.
As the observed positive and negative limits are asymmetrical with respect to the open circuit potential, different quantities of active material on each electrode are needed in order to avoid electrolyte degradation and rapid capacitance reduction. The ratio of the quantity of charge passed during the discharge steps of negative (q−) and positive (q+) sweeps was used to calculate the required mass balance between the electrodes, i.e., m+/m− = q−/q+, where m+ and m− are the mass of positive and negative electrodes, respectively. This determination was made at different scanrates and the ratio was seen to change slightly with scan rate. The mass balance determined at 100 mV s−1 was used to define the ratio used in the full EDLC cells, since the charge–discharge time is closer to that experienced in cycle life experiments. Therefore, the mass ratios used for [Im1,4][C(CN)3], [Pyr1,4][C(CN)3] and [Pip1,4][C(CN)3] were 3.1, 2.3 and 4.0, respectively. In comparison, [N(CN)2]-EDLCs required a mass ratio of 5.0.27
[Im1,4][C(CN)3] demonstrated the lowest operating potential of the three ILs under study, moreover, EDLCs assembled using this IL as electrolyte did not show sufficiently stable cycling even at this low potential. CVs provided in Fig. S2 (ESI†) show that a high faradaic current is observed when voltage approaches 2.3 V, and a cathodic peak is also observed in the reverse scan, probable due to the products of IL oxidation. The current decreases with subsequent scans, but some faradaic reactions can still be observed. The voltages of positive and negative electrodes were measured separately using a quasi-reference electrode, Pt wire in a Swagelok®-type cell, to understand which electrode operates beyond stability window. In all cycles, the negative electrode displayed a potential greater than −1.8 V (vs. OCP), indicating that early IL degradation may occur in the negative electrode. The hydrogen located at the C-2 position in the imidazole ring is known to present certain acidity,34 and it may be responsible for this early degradation; alternatively, a different mass ratio may be required for EDLCs using [Im1,4][C(CN)3]. Due to the limited operating potential and unstable performance of cells using [Im1,4][C(CN)3], subsequent characterisations were only carried out using [Pyr1,4][C(CN)3] and [Pip1,4][C(CN)3].
Fig. 5a shows CVs obtained using EDLCs containing [Pyr1,4][C(CN)3] and [Pip1,4][C(CN)3] at 5 mV s−1. The CVs are of rectangular form as anticipated for EDLCs without any apparent faradaic reactions being present. [Pyr1,4][C(CN)3] cells are associated with substantially higher values of specific capacitance than [Pip1,4][C(CN)3] cells, as a result of the higher ionic conductivity and smaller cation size of the IL, which facilitates access to a larger number of electrode pores. The specific capacitances at different scan rates are illustrated in Fig. 5b with [Pyr1,4][C(CN)3] cells producing substantially higher values of specific capacitance than [Pip1,4][C(CN)3] at all of the rates studied. At 200 mV s−1, [Pyr1,4][C(CN)3] and [Pip1,4][C(CN)3] retain 58.6% and 52.7%, respectively, of the specific capacitance determined at 5 mV s−1. The improved performance of [Pyr1,4][C(CN)3] as an EDLC electrolyte when compared to the [Pip1,4][C(CN)3] can be attributed to its lower viscosity and smaller ion size, allowing it to access smaller pores than its counterpart, thus increasing the capacitance. This finding is supported by the ESW results in Fig. 4b, where the positive scans presented the same capacitance for the three ILs, whereas the negative scans showed slight different capacitances and a relation with viscosity and ions size.
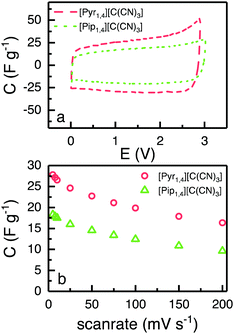 | ||
| Fig. 5 (a) CVs of EDLC containing [Pyr1,4][C(CN)3] (red) and [Pip1,4][C(CN)3] (green) at 5 mV s−1, form 0 to 2.9 and 3.0 V, respectively. (b) Calculated capacitance from CVs at different scanrates. | ||
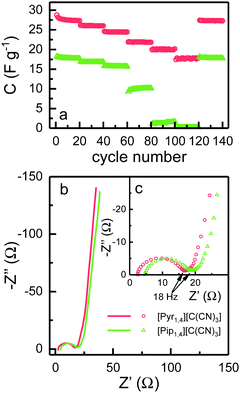
EDLCs were also tested using galvanostatic charge–discharge cycling at different rates from 0.5 to 10 A g−1. Fig. 6a shows the discharge capacitance for each cycle. At 0.5 A g−1, [Pyr1,4][C(CN)3] and [Pip1,4][C(CN)3] based cells deliver specific capacitances of 27.3 and 17.7 F g−1, respectively, which is in agreement with the cyclic voltammograms in Fig. 5. As the rate increases, the specific capacitance of cells using [Pyr1,4][C(CN)3] show a decrease to a value of 17.8 F g−1 at 10 A g−1, representing a retention of 65% of the initial capacitance. Coincidentally this is equivalent to the value of specific capacitance found at slowest rate when using [Pip1,4][C(CN)3] as an electrolyte. The specific capacitance of [Pip1,4][C(CN)3] based cells displays a sharp decrease at faster rates, and does not show any measurable capacitance at rates of 7.5 and 10 A g−1 due to their large ‘iR drops’.
EIS spectra are illustrated in Fig. 6b, where it is possible to observe a semi-circle obtained at high frequencies, and capacitor-like behaviour at low frequencies. Semi-circles are not normally observed for EDLCs containing organic solvent based electrolytes, since there are no charge transfer processes and pure capacitor behaviour would result in a straight line parallel to the imaginary axis. EDLCs based on IL electrolytes frequently present a semi-circle at high frequencies however the resistance is not associated with any transfer of charge. This behaviour has been attributed to the resistance for the IL ion to access small pores in the electrode and to the rearrangement of these ions inside pores.24,41,42
Fig. 6c shows the high frequency semi-circle in more detail. The first obvious conclusion from these spectra is that the resistance related to the electrolyte ionic conductivity (Rs) is in agreement with results in Fig. 3c. [Pyr1,4][C(CN)3] presents a lower Rs as it has higher ionic conductivity than [Pip1,4][C(CN)3]. Both EDLCs present similar internal resistance (Ri) – semi-circle diameter, ca. 13.5 Ω. The capacitances calculated from the lowest frequency for [Pyr1,4][C(CN)3] and [Pip1,4][C(CN)3] are 16.0 and 11.9 F g−1, respectively (these values correspond favourably with those determined using cyclic voltammetry at 200 mV s−1). Characteristics determined from EIS measurements are summarised in Table 2.
| R s (Ω) | R i (Ω) | C EIS (F g−1) | |
|---|---|---|---|
| [Pyr1,4][C(CN)3] | 2.3 | 13.4 | 16.0 |
| [Pip1,4][C(CN)3] | 4.5 | 13.5 | 11.9 |
The Ragone plot is shown in Fig. 7a, where the specific energy and specific power, normalised by total active mass, can be observed. Together with the two ILs investigated in this work, [Pyr1,4][Tf2N] is also shown for comparative purposes. EDLCs containing [Pyr1,4][C(CN)3] outperform [Pip1,4][C(CN)3] based cells over the whole discharge rate range studied. EDLCs containing [Pip1,4][C(CN)3] store only 0.9 W h kg−1 when operating at 6 kW kg−1, whereas a [Pyr1,4][C(CN)3] containing cell can store up to 4.5 W h kg−1 when operating at a similar specific power. At this specific power, this represents a specific energy even higher than the [Pyr1,4][Tf2N]-EDLC, which operates at the substantially higher potential of 3.5 V and stores up to 3.0 W h kg−1. Therefore, the [C(CN)3] IL can store more energy at high power than the [Tf2N] IL despite operating at lower potential. It is worth noting that operating at higher specific power than the values showed in Fig. 7a would raise limitations due to the higher ‘iR drops’ when operating at higher discharge currents.
Finally, the long-term stability of both EDLCs was tested at 2.0 A g−1, cycling from 0 V to the operating voltage of each device, and it is presented in Fig. 7b. The first 200 cycles show a rapid decay of ca. 4% in specific capacitance for both ILs, however they retain greater than 75% of initial capacitance after 50![[thin space (1/6-em)]](https://www.rsc.org/images/entities/char_2009.gif) 000 cycles, indicating relatively stable cycling behaviour. ILs containing the fluorine free tricyanomethanide anion can be used as EDLC electrolytes operating at relatively high voltages (higher than organic solvents but lower than [Tf2N] analogues). Due to its increased ionic conductivity, the [C(CN)3]-EDLC can operate at higher power than a [Tf2N]-EDLC delivering more energy at the highest rate tested.
000 cycles, indicating relatively stable cycling behaviour. ILs containing the fluorine free tricyanomethanide anion can be used as EDLC electrolytes operating at relatively high voltages (higher than organic solvents but lower than [Tf2N] analogues). Due to its increased ionic conductivity, the [C(CN)3]-EDLC can operate at higher power than a [Tf2N]-EDLC delivering more energy at the highest rate tested.
Conclusions
In summary, the thermal behaviour of three ILs based in the [C(CN)3] anion, their physicochemical properties and their performance as electrochemical double-layer capacitors (EDLCs) have been investigated. The ILs [Im1,4][C(CN)3], [Pyr1,4][C(CN)3] and [Pip1,4][C(CN)3] display high thermostability, and whereas the first liquid solely presents a Tg at −78 °C, [Pyr1,4] and [Pip1,4] ILs present melting temperatures at −1.3 and 17 °C, respectively. The three ILs studied here present higher ionic conductivity than [Pyr1,4][Tf2N] but a lower electrochemical stability window. Despite operating at a relatively low voltage [Im1,4][C(CN)3] underwent some faradaic reactions during charge–discharge in an EDLC, indicating that the ESW is less stable than that determined. Three electrodes studies suggested that the negative electrode was operating beyond its stable potential. On the other hand, [Pyr1,4][C(CN)3] and [Pip1,4][C(CN)3] were suitable to be used as EDLC electrolytes, and the [Pyr1,4][C(CN)3] outperformed its [Tf2N] analogue when operating at higher rates, being able to store 4.5 W h kg−1 while [Pyr1,4][Tf2N] was limited at 3.0 W h kg−1.Acknowledgements
The authors acknowledge EPSRC (EP/K021192/1) and FAPESP (15/26308-7) for funding. V. L. M. thanks FAPESP (13/22748-7 and 14/14690-1) for scholarship support.References
- R. Kötz and M. Carlen, Electrochim. Acta, 2000, 45, 2483–2498 CrossRef
.
- P. Simon and Y. Gogotsi, Nat. Mater., 2008, 7, 845–854 CrossRef CAS PubMed
.
- P. J. Hall, M. Mirzaeian, S. I. Fletcher, F. B. Sillars, A. J. R. Rennie, G. O. Shitta-Bey, G. Wilson, A. Cruden and R. Carter, Energy Environ. Sci., 2010, 3, 1238–1251 CAS
.
- F. Béguin, V. Presser, A. Balducci and E. Frackowiak, Adv. Mater., 2014, 26, 2219–2251 CrossRef PubMed
.
- X. Luo, J. Wang, M. Dooner and J. Clarke, Appl. Energy, 2015, 137, 511–536 CrossRef
.
- M. F. El-Kady, Y. Shao and R. B. Kaner, Nat. Rev. Mater., 2016, 16033 CrossRef CAS
.
- Z. Yang, J. Zhang, M. C. W. Kintner-Meyer, X. Lu, D. Choi, J. P. Lemmon and J. Liu, Chem. Rev., 2011, 111, 3577–3613 CrossRef CAS PubMed
.
- L. L. Zhang and X. S. Zhao, Chem. Soc. Rev., 2009, 38, 2520–2531 RSC
.
- M.-M. Titirici, R. J. White, N. Brun, V. L. Budarin, D. S. Su, F. del Monte, J. H. Clark and M. J. MacLachlan, Chem. Soc. Rev., 2015, 44, 250–290 RSC
.
- A. Lewandowski and M. Galinski, J. Power Sources, 2007, 173, 822–828 CrossRef CAS
.
- D. Weingarth, H. Noh, A. Foelske-Schmitz, A. Wokaun and R. Kötz, Electrochim. Acta, 2013, 103, 119–124 CrossRef CAS
.
- A. Krause and A. Balducci, Electrochem. Commun., 2011, 13, 814–817 CrossRef CAS
.
- K. Xu, M. S. Ding and T. Richard Jow, Electrochim. Acta, 2001, 46, 1823–1827 CrossRef CAS
.
- D. Weingarth, a. Foelske-Schmitz and R. Kötz, J. Power Sources, 2013, 225, 84–88 CrossRef CAS
.
- M. P. S. Mousavi, B. E. Wilson, S. Kashefolgheta, E. L. Anderson, S. He, P. Bühlmann and A. Stein, ACS Appl. Mater. Interfaces, 2016, 8, 3396–3406 CAS
.
- A. McEwen, H. Ngo and K. LeCompte, J. Electrochem. Soc., 1999, 146, 1687–1695 CrossRef CAS
.
- M. Galiński, A. Lewandowski, I. Stepniak, M. Galinski, A. Lewandowski and I. Stepniak, Electrochim. Acta, 2006, 51, 5567–5580 CrossRef
.
- A. Brandt, S. Pohlmann, A. Varzi, A. Balducci and S. Passerini, MRS Bull., 2013, 38, 554–559 CrossRef CAS
.
- K. E. Johnson, Electrochem. Soc. Interface, 2007, 38–41 CAS
.
- D. R. Macfarlane and K. R. Seddon, Aust. J. Chem., 2007, 60, 3–5 CrossRef CAS
.
- A. J. R. Rennie, V. L. Martins, R. M. Smith and P. J. Hall, Sci. Rep., 2016, 6, 22062 CrossRef CAS PubMed
.
- G. Ayalneh Tiruye, D. Muñoz-Torrero, J. Palma, M. Anderson and R. Marcilla, J. Power Sources, 2015, 279, 472–480 CrossRef CAS
.
- A. Balducci, R. Dugas, P. L. L. Taberna, P. Simon, D. Plée, M. Mastragostino and S. Passerini, J. Power Sources, 2007, 165, 922–927 CrossRef CAS
.
- A. J. R. Rennie, V. L. Martins, R. M. Torresi and P. J. Hall, J. Phys. Chem. C, 2015, 119, 23865–23874 CAS
.
- A. J. R. Rennie, N. Sanchez-Ramirez, R. M. Torresi and P. J. Hall, J. Phys. Chem. Lett., 2013, 4, 2970–2974 CrossRef CAS PubMed
.
- S. Pohlmann, T. Olyschläger, P. Goodrich, J. Alvarez Vicente, J. Jacquemin and A. Balducci, J. Power Sources, 2015, 273, 931–936 CrossRef CAS
.
- C. Wolff, S. Jeong, E. Paillard, A. Balducci and S. Passerini, J. Power Sources, 2015, 293, 65–70 CrossRef CAS
.
- Y. Yoshida, K. Muroi, A. Otsuka, G. Saito, M. Takahashi and T. Yoko, Inorg. Chem., 2004, 43, 1458–1462 CrossRef CAS PubMed
.
- T. J. Wooster, K. M. Johanson, K. J. Fraser, D. R. MacFarlane and J. L. Scott, Green Chem., 2006, 8, 691 RSC
.
- H. Yoon, G. H. Lane, Y. Shekibi, P. C. Howlett, M. Forsyth, A. S. Best and D. R. MacFarlane, Energy Environ. Sci., 2013, 6, 979 CAS
.
- M. Barghamadi, A. S. Best, A. I. Bhatt, A. F. Hollenkamp, P. J. Mahon, M. Musameh and T. Rüther, Electrochim. Acta, 2015, 180, 636–644 CrossRef CAS
.
- P. J. Carvalho, T. Regueira, L. M. N. B. F. Santos, J. Fernandez and J. A. P. Coutinho, J. Chem. Eng. Data, 2010, 55, 645–652 CrossRef CAS
.
- H. Tokuda, K. Hayamizu, K. Ishii, M. A. B. H. Susan and M. Watanabe, J. Phys. Chem. B, 2004, 108, 16593–16600 CrossRef CAS
.
- F. F. C. Bazito, Y. Kawano and R. M. Torresi, Electrochim. Acta, 2007, 52, 6427–6437 CrossRef CAS
.
- D. R. MacFarlane, S. A. Forsyth, J. Golding and G. B. Deacon, Green Chem., 2002, 4, 444–448 RSC
.
- N. Sanchez-Ramirez, V. L. Martins, R. A. Ando, F. F. Camilo, S. M. Urahata, M. C. C. Ribeiro and R. M. Torresi, J. Phys. Chem. B, 2014, 118, 8772–8781 CrossRef CAS PubMed
.
- K. Ueno, H. Tokuda and M. Watanabe, Phys. Chem. Chem. Phys., 2010, 12, 1649–1658 RSC
.
- C. Austen Angell, Y. Ansari and Z. Zhao, Faraday Discuss., 2012, 154, 9–27 RSC
.
- C. A. Angell, Chem. Rev., 2002, 102, 2627–2650 CrossRef CAS PubMed
.
- M. C. C. Ribeiro, J. Chem. Phys., 2010, 133, 24503 CrossRef PubMed
.
- H.-K. Song, Y.-H. Jung, K.-H. Lee and L. H. Dao, Electrochim. Acta, 1999, 44, 3513–3519 CrossRef CAS
.
- G. Wang, L. Zhang and J. Zhang, Chem. Soc. Rev., 2012, 41, 797–828 RSC
.
Footnote |
| † Electronic supplementary information (ESI) available. See DOI: 10.1039/c7cp03377j |
| This journal is © the Owner Societies 2017 |

