 Open Access Article
Effect of metal–metal distance in Ni(II)-based metallo-supramolecular polymers: DNA binding and cytotoxicity†
Md. Delwar
Hossain‡
a,
Utpal
Rana
a,
Chanchal
Chakraborty
a,
Jinghua
Li§
a,
Reiko
Nagano
b,
Takashi
Minowa
b and
Masayoshi
Higuchi
 *a
*a
aElectronic Functional Macromolecules Group, National Institute for Materials Science (NIMS), 1-1 Namiki, Tsukuba 305-0044, Japan. E-mail: HIGUCHI.Masayoshi@nims.go.jp; Fax: +81-29-860-4721; Tel: +81-29-860-4721
bNanotechnology Innovation Station, NIMS, 1-2-1 Sengen, Tsukuba 305-0047, Japan
First published on 2nd August 2017
Abstract
Two Ni(II)-based metallo-supramolecular polymers (polyNiL1 and polyNiL2) with different metal–metal distances were synthesized via (1![[thin space (1/6-em)]](https://www.rsc.org/images/entities/char_2009.gif) :
:![[thin space (1/6-em)]](https://www.rsc.org/images/entities/char_2009.gif) 1) complexation between the Ni salts with bis(1,10-phenanthroline)s and their DNA binding properties and cytotoxicity were revealed. Short metal–metal distances (1.35 nm) in polyNiL2 showed ∼7 times stronger DNA binding properties and remarkably higher cytotoxicity to Hela-Fucci cells than long metal–metal distances (1.95 nm) in polyNiL1. Enhancement of Ni polymer-induced cell killing has been observed in a cell cycle study.
1) complexation between the Ni salts with bis(1,10-phenanthroline)s and their DNA binding properties and cytotoxicity were revealed. Short metal–metal distances (1.35 nm) in polyNiL2 showed ∼7 times stronger DNA binding properties and remarkably higher cytotoxicity to Hela-Fucci cells than long metal–metal distances (1.95 nm) in polyNiL1. Enhancement of Ni polymer-induced cell killing has been observed in a cell cycle study.
Introduction
The construction of small molecules as anticancer drugs has been an intensive subject in the past few decades. Transition metal complexes as potential therapeutic agents have received more attention because the central metal atom can bound to a surrounding array of molecules or anions and the modified ligands can specifically recognize the sequence of a nucleic acid.1 It is potentially useful to understand the binding of metal complexes to DNA, for designing the structure and conformation of metal complexes. The mode of recognition is a kind of reversible non-covalent binding primarily based upon intercalation, major or minor groove-binding, hydrogen bonding and electrostatic interactions, which are dependent on the spatial configuration and specific modification of small molecules.2 As such, the development of new metal complex structures having high binding affinity with DNA is of increasing importance in drug design.2b In addition to the studies on the interaction between short strand planar complex and DNA, metal nanoparticles and polymer complexes have recently received more attention for application in antitumor targeted drug delivery.3 Previously, we reported high binding affinity of terpyridine-based metallo-supramolecular polymers to DNA.4a,b These results indicate that the metallo-supramolecular polymers become a new candidate of anticancer drugs, because such strong binding to DNAs should prevent multiplication of the cancer cells. Recently, we reported that, the right handed helical metallo-supramolecular polymer exhibited strong DNA binding properties to B-DNA and high cytotoxicity to cancer cell.4c Metallo-supramolecular polymer can bind to the DNA by strong electrostatic interaction and groove binding. Electrostatic interaction occurred between the positively charge metal center of polymer and negatively charge phosphate backbone of DNA. The phosphate–phosphate distance of B-DNA is 0.7 nm is well known.4d So, the metal–metal distance ∼0.7 nm in metallo-supramolecular polymer should be a potential route for improving DNA binding properties, as a result of cytotoxicity. In order to enhance the possibility of metallo-supramolecular polymers as anticancer drugs, we planned to investigate the DNA binding activity of tetrahedral or square planar coordination geometry type metallo-supramolecular polymers with variation of the metal–metal distances. However, variety of N-hetero ligands such as terpyridines, bipyridines and porphyrins are well known for synthesis of metallo-supramolecular polymers but very few papers were reported with 1,10-phenanthroline based ligands.5 Phenanthroline analogues formed coordinate metal complexes with variety of metal ions including Ni2+, Cu2+, Pt4+ and have been shown numerous biological activities such as antitumour,6a anti-candida,6b antimycobacterial,6c antimicrobial,6d activities etc. Moreover, considerable attention has been focused on the use of phenanthroline complexes as intercalating agents of DNA1a and as artificial nucleases.7 With the aim to generate biological activities of phenanthroline-based metallo-supramolecular polymers, herein we report the binding properties of Ni(II)-based polymers with ct-DNA and their cytotoxicity to cancer cells (Hela-Fucci). In addition, the variation of the metal–metal distances and their relationship to the binding affinity to DNA as well as anticancer activity to cancer cells also investigated.Experiment
Materials
Calf-thymus (ct) DNA (TREVIGEN, 10 mg mL−1, 200–500 bp), was highly purified and qualified. Human cervical cancer (Hela) cells expressing the Fucci probes (Hela-Fucci) were purchased from RIKEN BRC, Japan. Cell Counting Kit-8 (CCK-8) was obtained from Dojindo Laboratories (Kumamoto, Japan). Fetal bovine serum (FBS) was obtained from Bioserum (Hiroshima, Japan). Dulbecco's Modified Eagle Medium (DMEM), Dulbecco's phosphate buffered saline (PBS), and trypsin–EDTA (0.05% trypsin, 0.53 mM EDTA–4Na) were obtained from Invitrogen (Carlsbad, CA, USA). Cell culture dishes were from BD Bioscience (San Jose, CA, USA). All reagents were the highest purity commercially available and, unless otherwise noted, were used as obtained without further purification.Instrumentation
UV-vis spectra were recorded at 30 °C using a Shimadzu UV-2550 UV-vis spectrophotometer. A Model 550 Microplate Reader (Bio-Rad Laboratories, Inc.) was used for cell viability test. Total Internal Reflection Fluorescence (TIRF), Leica microsystems were used for cell cycle study.Binding constant
The concentration of ct-DNA per nucleotide was calculated from its known extinction coefficient at 260 nm (6600 M−1 cm−1, 200–500 base pairs) and the concentration of polymers were expressed in repeat units.8 The binding constants of the polymers to ct-DNA were determined by absorption titration at 30 °C in 5% acetonitrile-aqueous solution. Dilution of the polymers at the end of each titration was negligible. The DNA binding constant, Kb, of the polymers were determined from fitting the changes in the absorption of the polymer as a function of ct DNA concentration using eqn (1).10 | (1) |
Cell viability
Human cervical cancer cell lines (Hela-Fucci) were maintained in DMEM medium supplemented with 5% fetal bovine serum (FBS), 100 IU mL−1 of penicillin, 100 μg mL−1 of streptomycin at 37 °C in a humidified incubator at 5% CO2. The adherent cultures were grown as monolayer and were passaged once in 3–4 days by exposure to 0.05% trypsin–EDTA. For cell viability assay, the Hela-Fucci cells were seeded in 96-well plates and cultured for 24 h. The medium was removed, and Ni polymers were added, which were prepared by medium including 5% acetonitrile and reached the final concentration 0, 5, 10, 15, 20, 25 μM respectively. The 5% acetonitrile was used as a control. After 24 h of incubation, 10 μL of CCK-8 solution was added to each well and check the cell viability. Further 24 h was incubated and check the cell viability. Cell viabilities were normalized to (OD450–OD620) for the untreated cells. Assays were performed in quadruplicate.Fluorescence imaging
Fluorescence images were taken using a fluorescence microscope (DMIL, Leica Microsystems, Germany). For time-lapse imaging, cells were held in an incubation chamber at 37 °C in a humidified atmosphere containing 5% CO2 (Tokai Hit, Fujinomiya, Japan).Results and discussion
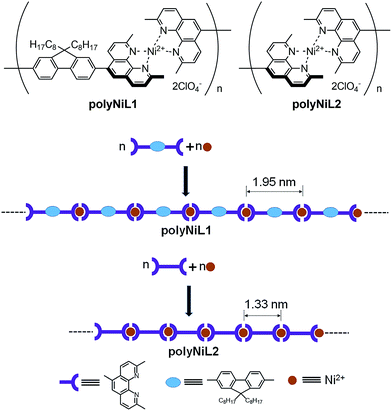
Bis(1,10-phenanthroline)s with different substituent L1–L2 were synthesized according to our previous report.9a The polyNiL1 and polyNiL2 (Scheme 1) were prepared by 1![[thin space (1/6-em)]](https://www.rsc.org/images/entities/char_2009.gif) :
:![[thin space (1/6-em)]](https://www.rsc.org/images/entities/char_2009.gif) 1 complexation equimolar L1 or L2 (in CH2Cl2), and Ni(ClO4)2·6H2O(CH3CN) under inert atmosphere.9b The reaction mixture was stirred 1 h at room temperature. The desired polymers were obtained as a pink solid (PolyNiL1: 92%; polyNiL2: 90%) and is highly soluble in acetonitrile. The molecular weight (Mw) of polyNiL1 and polyNiL2 in acetonitrile were determined by a SEC-viscometry-RALLS method (size exclusion chromatography-viscometry-right-angle light scattering) using polyethylene oxide as a standard and to be 1.24 × 10⁵ Da and 1.28 × 10⁵ Da respectively.9
1 complexation equimolar L1 or L2 (in CH2Cl2), and Ni(ClO4)2·6H2O(CH3CN) under inert atmosphere.9b The reaction mixture was stirred 1 h at room temperature. The desired polymers were obtained as a pink solid (PolyNiL1: 92%; polyNiL2: 90%) and is highly soluble in acetonitrile. The molecular weight (Mw) of polyNiL1 and polyNiL2 in acetonitrile were determined by a SEC-viscometry-RALLS method (size exclusion chromatography-viscometry-right-angle light scattering) using polyethylene oxide as a standard and to be 1.24 × 10⁵ Da and 1.28 × 10⁵ Da respectively.9
The coordination geometry of Ni(II) in polymers were justified by UV-vis spectrophotometric titration of Ni(II) ions and ligand L1 (Fig. S1, ESI†) or L2.9b Interestingly, the spectrum changed during the addition of 0.0–1.0 equivalents of the Ni(II) salt to the ligand and then remained unaffected by the addition of more than 1.1 equivalents of the Ni(II) salt. The titration plots between the absorbance and the molar ratio of [the Ni salt]/[ligand] clearly showed the 1![[thin space (1/6-em)]](https://www.rsc.org/images/entities/char_2009.gif) :
:![[thin space (1/6-em)]](https://www.rsc.org/images/entities/char_2009.gif) 1 complexation. These results indicated that Ni(II) bind 1
1 complexation. These results indicated that Ni(II) bind 1![[thin space (1/6-em)]](https://www.rsc.org/images/entities/char_2009.gif) :
:![[thin space (1/6-em)]](https://www.rsc.org/images/entities/char_2009.gif) 1 way and formed tetrahedral geometry during the formation of polyNiL1 and polyNiL2.9a,b
1 way and formed tetrahedral geometry during the formation of polyNiL1 and polyNiL2.9a,b
The UV-vis spectra of polyNiL1 and polNiL2 were recorded in 5% acetonitrile aqueous solution (concentration = 5 mM). The polyNiL1 showed three absorption peaks at 230, 280 and 324 nm whereas polyNiL2 showed two absorption peaks at 232 and 277 nm. The peaks at ∼230 and ∼280 nm for n → π* and π → π* transition of phenanthroline unit and 324 nm for π → π* transition of fluorene unit (Fig. S2, ESI†).9
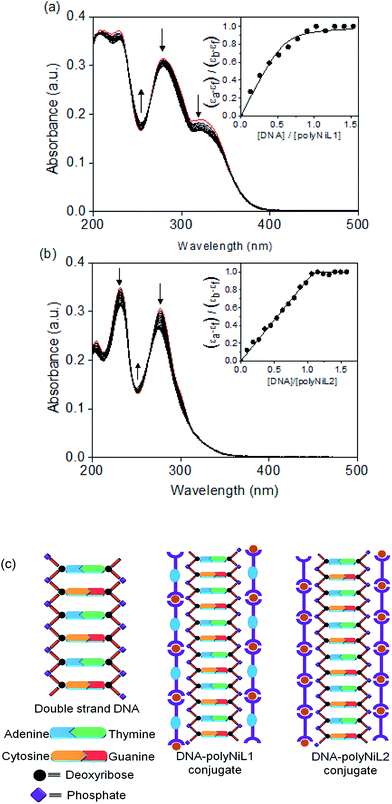
The interaction between the polymers (polyNiL1 and polyNiL2) and DNA was investigated by UV-vis spectral measurement (Fig. 1). Metallo-supramolecular polymers contains Ni(II) ions with bis(phenanthroline)s containing aromatic heterocycles, can be immensely powerful tools for probing nucleic acids. ct-DNA belongs to B-form DNA having wide major groove with moderate depths easily accessible to molecules. In the UV-vis titration with increasing concentrations of ct-DNA, all of Ni(II) polymers were found to exhibit noticeable hypochromism and bathochromic shift with several isosbestic points (Table 1). During the titration of ct-DNA to Ni(II) polymers, a hypochromic shift at 280–350 nm was observed due to electrostatic interaction between the polymer complexes and DNA (Fig. 1a and b). In UV-vis spectra, the hypochromicity along with bathochromic shifts indicate an electronic interaction between the polymers and ct-DNA. The spectral change was saturated at 1![[thin space (1/6-em)]](https://www.rsc.org/images/entities/char_2009.gif) :
:![[thin space (1/6-em)]](https://www.rsc.org/images/entities/char_2009.gif) 1 molar ratio of [nucleotide of DNA]/[unit of polymer] (Fig. 1a and b insets). According to the fits of titration data (eqn (1)), the binding constants (Kb) of polyNiL1, and polyNiL2 were determined to be 2.77, and 19.76 × 10⁶ M−1 respectively by using the non-linear curve fitting (Table 1).10PolyNiL1 with fluorene spacer has approximately seven times smaller binding constant than without spacer polyNiL2. The reason can be explained as the metal–metal distance in the polymer chains. The metal–metal distance for polyNiL1 and polyNiL2 was 1.95 and 1.33 nm respectively, which was calculated by simple Chem3D software. In contrast, the phosphate–phosphate distance of B-DNA are known to be approximately 0.7 nm. The charge of the Ni(II) atom in the polymer is +2, whereas the charge of the phosphate in DNA is −1. So, one Ni(II) center of polymer can interact with two phosphate groups of DNA. The metal–metal distance of polymers to phosphate–phosphate distance of DNA of polyNiL1 and polyNiL2 is approximately 2 and 3 respectively. So, strong electrostatic bonding between ct-DNA and polyNiL2 occurred due to the close matching of the metal–metal distance of this polymer with phosphate–phosphate distance of B-DNA. Compared with the mono-metal complexes, the binding constants of the polymer complexes are larger than the mono-metal complexes.11 Such a strong binding properties of the polymer complexes to ct-DNA will be caused by the collaborative effect on stabilization between the neighboring binding sites in the polymer complex. Therefore, very strong electrostatic interaction can be revealed between the Ni polymers and ct-DNA.
1 molar ratio of [nucleotide of DNA]/[unit of polymer] (Fig. 1a and b insets). According to the fits of titration data (eqn (1)), the binding constants (Kb) of polyNiL1, and polyNiL2 were determined to be 2.77, and 19.76 × 10⁶ M−1 respectively by using the non-linear curve fitting (Table 1).10PolyNiL1 with fluorene spacer has approximately seven times smaller binding constant than without spacer polyNiL2. The reason can be explained as the metal–metal distance in the polymer chains. The metal–metal distance for polyNiL1 and polyNiL2 was 1.95 and 1.33 nm respectively, which was calculated by simple Chem3D software. In contrast, the phosphate–phosphate distance of B-DNA are known to be approximately 0.7 nm. The charge of the Ni(II) atom in the polymer is +2, whereas the charge of the phosphate in DNA is −1. So, one Ni(II) center of polymer can interact with two phosphate groups of DNA. The metal–metal distance of polymers to phosphate–phosphate distance of DNA of polyNiL1 and polyNiL2 is approximately 2 and 3 respectively. So, strong electrostatic bonding between ct-DNA and polyNiL2 occurred due to the close matching of the metal–metal distance of this polymer with phosphate–phosphate distance of B-DNA. Compared with the mono-metal complexes, the binding constants of the polymer complexes are larger than the mono-metal complexes.11 Such a strong binding properties of the polymer complexes to ct-DNA will be caused by the collaborative effect on stabilization between the neighboring binding sites in the polymer complex. Therefore, very strong electrostatic interaction can be revealed between the Ni polymers and ct-DNA.
| Polymer | Hypochromicity (%) | K b (×106 M−1) | s |
|---|---|---|---|
| polyNiL1 | 13 | 2.77 | 0.17 |
| polyNiL2 | 14 | 19.76 | 0.49 |
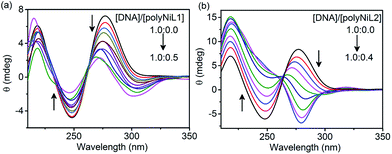
The structural changes of DNA in the presence of polymers were studied by circular dichroism (CD) titration and the results are shown in Fig. 2. The B-form of ct-DNA exhibited two positive bands at 277 and ∼220 nm and a negative band at 248 nm (a black spectrum in Fig. 2a and b), implying the right-handed helical structure of DNA. When the polymer was added to the DNA solution, the spectrum was dramatically changed. The changes caused by polyNiL2 were more significant than those by polyNiL1. Interestingly, with increasing the concentration of polyNiL2, the band at 277 nm in Fig. 2b was blue-shifted to 267 nm and almost vanished when the mass ratio of DNA/polyNiL2 reached 1.0![[thin space (1/6-em)]](https://www.rsc.org/images/entities/char_2009.gif) :
:![[thin space (1/6-em)]](https://www.rsc.org/images/entities/char_2009.gif) 0.2 (a green spectrum in Fig. 2b), indicating the original helical structure of DNA was collapsed. With the further addition of polyNiL2 to the solution, a new band at 283 nm appeared in the negative region. This wavelength (283 nm) corresponds with that of an intense absorption (280 nm) in the UV-vis spectrum of polyNiL2 (a black spectrum of Fig. S2, ESI†). This result indicates the helicity in polyNiL2 was induced by DNA in the polyNiL2-DNA conjugates, probably because of the strong and favorable electrostatic interaction between the cationic polyNiL2 and anionic DNA. It is considered that the polymer chains of polyNiL2 take on a helical conformation along the DNA helicity.12a As for polyNiL1, with increasing the polymer concentration, the band at 277 nm in Fig. 2a became small but no new peaks appeared in the negative region. It suggests the electrostatic interaction with DNA is weaker than that of polyNiL1.
0.2 (a green spectrum in Fig. 2b), indicating the original helical structure of DNA was collapsed. With the further addition of polyNiL2 to the solution, a new band at 283 nm appeared in the negative region. This wavelength (283 nm) corresponds with that of an intense absorption (280 nm) in the UV-vis spectrum of polyNiL2 (a black spectrum of Fig. S2, ESI†). This result indicates the helicity in polyNiL2 was induced by DNA in the polyNiL2-DNA conjugates, probably because of the strong and favorable electrostatic interaction between the cationic polyNiL2 and anionic DNA. It is considered that the polymer chains of polyNiL2 take on a helical conformation along the DNA helicity.12a As for polyNiL1, with increasing the polymer concentration, the band at 277 nm in Fig. 2a became small but no new peaks appeared in the negative region. It suggests the electrostatic interaction with DNA is weaker than that of polyNiL1.
It is commonly considered that DNA is the major target of many anticancer agents.12b The aim of many studies is to establish new anticancer agents with greater selectivity to cancer cells. The cytotoxicity of the polymers (polyNiL1, polyNiL2) were studied using cell counting kit, CCK-8 (WST-8) assay with Hela-Fucci cell. The cytotoxicity of the polymers were measured as the percentage ratio of the absorbance of the treated Hela-Fucci cells to the untreated controls. Cell viability experiment showed 59.5% and 1% of viable cells with using poly NiL1 (25 μM) and polyNiL2 (25 μM) respectively (Fig. 3). The polyNiL2 polymer without spacer largely decreased the cell viability in a dose-dependent manner than polyNiL1 with fluorene spacer because the binding affinities of polyNiL2 (Kb = 19.76 × 10⁶ M−1) with ct-DNA is higher than polyNiL1 (Kb = 2.77 × 10⁶ M−1). It seems that the cytotoxicity of the polymers is largely dependent on the binding constant.
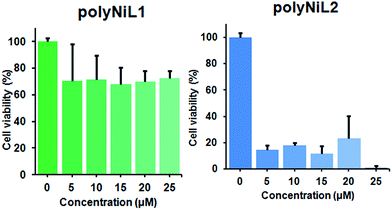 | ||
| Fig. 3 Cytotoxicity of polyNiL1 (0, 5, 10, 15, 20, 25 μM) and polyNiL2 (0, 5, 10, 15, 20, 25 μM) in cell culture medium against Hela-Fucci cells. | ||
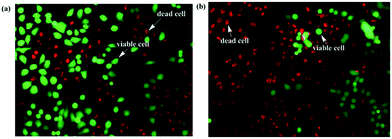
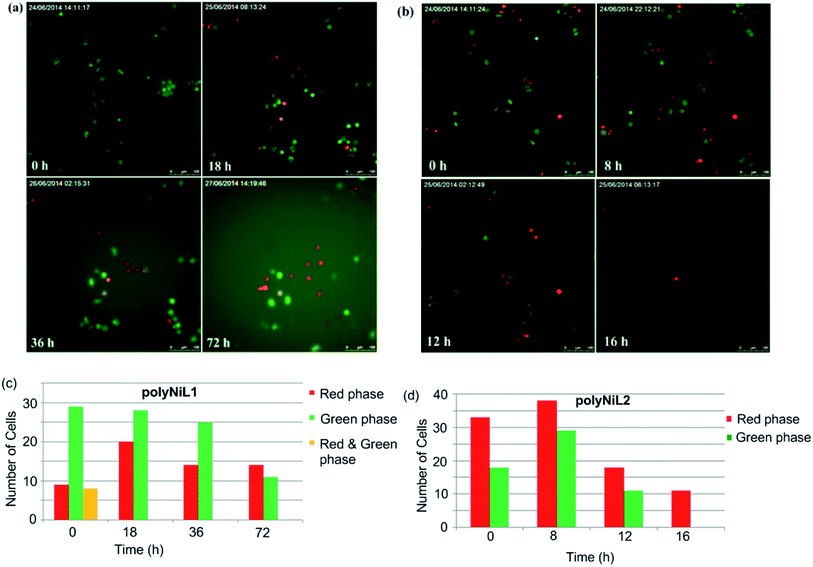
Cellstain-double staining kit is utilized for simultaneous fluorescence staining of viable and dead cells. This kit contains calcein-AM and propidium iodide (PI) solutions, which stain viable (green) and dead cells (red), respectively. After the cells were incubated for 24 h with 25 μM of PolyNiL1 or polyNiL2 in 24 well plates, the cells were washed twice with sterile PBS, and 500 μL of PBS containing calcein-AM (2 μM) and PI (4 μM) were added. Plates were incubated for 15 min before fluorescence imaging with a microscope. PolyNiL2 (Fig. 4b) showed more number of dead cells (red fluorescence) than polyNiL1 (Fig. 4a). Fluorescence microscopic analysis suggested that PolyNiL2 has a greater potential to induce the death of Hela-Fucci cancer cells (Fig. 4) and indicates the higher cytotoxicity of polyNIL2.
Cell cycle study is the most important process for understanding the mechanism of DNA replication within a defined time period. Cell cycle occurs in four phases, G1(gap1)/S(synthesis)/G2(gap2)/M(mitosis).13 A fluorescent probe that labels different phases of cell cycle like G1 phase nuclei in red and S/G2/M phase nuclei in green. Sakaue-Sawano et al. developed a cell-cycle visualization system called fluorescent ubiquitination-based cell-cycle indicator (Fucci), which takes advantage of the cell cycle-dependent ubiquitination of Cdt1 protein and geminin protein.13 Fucci is a sophisticated technology for easy determination of G1 and S/G2/M phases of the cell cycle. Fucci-G1 red is a fusion protein of a fragment of human Cdt1 with the orange fluorescent, mKO2 (monomeric Kusabira-Orange2) that indicates the G1 phase, whereas Fucci-S/G2/M green is a fusion protein of a fragment of human geminin with the green fluorescent protein, mAG1 (monomeric Azami-Green1) that visualize S/G2/M phase.13c In this system, G1 and S/G2/M cells emit red and green fluorescence by TIRF microscope, respectively. In our experiment, we added Ni polymer solution in Hela-Fucci cells in DMEM then held in TIRF microscope. In Fig. 5a and c, we have shown that G1 (red phase) and S/G2/M (green phase) Hela-Fucci cells gradually decreased during 0 h to 72 h treatment with polyNiL1 (25 μM). In Fig. 5b and d, G1 and S/G2/M cells drastically decreased during 0 h to 16 h with polyNiL2 (25 μM) and finally only G1 cells remained. This result indicated that G1 phase is arrested with the treatment of polyNiL2 and predicted to enhance cell killing. Thus, we concluded that the polyNiL2 showed very strong cytotoxicity than polyNiL1.
Conclusions
In an effort to select the new candidates for anti-cancer drugs, we used our synthesized polymers (polyNiL1, and polyNiL2) to do the DNA binding experiments. The very strong electrostatic interaction was confirmed between the polymers and ct-DNA by UV-vis experiment. The polyNiL2 exhibited higher binding constants than polyNiL1 to ct-DNA. Cell viability experiment showed 59.5% and 1% of viable cell for polyNiL1 and polyNiL2 to cancer cells (Hela-Fucci) respectively. Cell cycle studies showed living cancer cell dead rapidly with the treatment with polyNiL2.Acknowledgements
The authors would like to acknowledge JST CREST Grant Number JPMJCR1533, Japan for financial support.References
-
(a) K. E. Erkkila, D. T. Odom and J. K. Barton, Chem. Rev., 1999, 99, 2777 CrossRef CAS
; (b) S. N. Georgiades, N. H. Abd Karim, K. Suntharalingam and R. Vilar, Angew. Chem., Int. Ed., 2010, 49, 4020 CrossRef CAS
; (c) J. K. Barton, E. D. Olmon and P. A. Sontz, Coord. Chem. Rev., 2011, 255, 619 CrossRef CAS
.
-
(a) B. C. Bales, T. Kodama, Y. N. Weledji, M. Pitie, B. Meunier and M. M. Greenberg, Nucleic Acids Res., 2005, 33, 5371 CrossRef CAS
; (b) J. Liu, H. Zhang, C. Chen, H. Deng, T. Lu and L. Ji, Dalton Trans., 2003, 115, 114 RSC
.
-
(a) Y. Matsumura and H. Maeda, Cancer Res., 1986, 46, 6387 CAS
; (b) C. H. J. Choi, C. A. Alabi, P. Webster and M. E. Davis, Proc. Natl. Acad. Sci. U. S. A., 2010, 107, 1235 CrossRef CAS
.
-
(a) J. Li, Z. Futera, H. F. Li, Y. Tateyama and M. Higuchi, Phys. Chem. Chem. Phys., 2011, 13, 4839 RSC
; (b) J. Li, T. Murakami and M. Higuchi, J. Inorg. Organomet. Polym., 2013, 23, 119 CrossRef CAS
; (c) U. Rana, C. Chakraborty, R. K. Pandey, M. D. Hossain, R. Nagano, H. Morita, S. Hattori, T. Minowa and M. Higuchi, Bioconjugate Chem., 2016, 27, 2307 CrossRef CAS
; (d) R. J. Epstein, Human Molecular Biology: An Introduction to the Molecular Basis of Health and Disease, Cambridge University Press, Cambridge, 2003 Search PubMed
.
-
(a) A. T. Daniher and J. K. Bashkin, Chem. Commun., 1998, 1077 RSC
; (b) P. J. Carter, C.-C. Cheng and H. H. Thorp, J. Am. Chem. Soc., 1998, 120, 632 CrossRef CAS
; (c) R. J. Mortimer, A. L. Dyer and J. R. Reynolds, Displays, 2006, 27, 2 CrossRef CAS
; (d) D. G. Kurth and M. Higuchi, Soft Matter, 2006, 2, 915 RSC
; (e) M. Higuchi and D. G. Kurth, Chem. Rec., 2007, 7, 203 CrossRef CAS
; (f) F. S. Han, M. Higuchi and D. G. Kurth, Adv. Mater., 2007, 19, 3928 CrossRef CAS
; (g) F. S. Han, M. Higuchi and D. G. Kurth, J. Am. Chem. Soc., 2008, 130, 2074 Search PubMed
; (h) A. Bandyopadhyay, S. Sahu and M. Higuchi, J. Am. Chem. Soc., 2011, 133, 1168 CrossRef CAS
; (i) G. R. Whittell, M. D. Hager, U. S. Schubert and I. Manners, Nat. Mater., 2010, 10, 176 CrossRef
; (j) R. I. Wojtecki, M. A. Meador and S. J. Rowan, Nat. Mater., 2010, 10, 14 CrossRef
; (k) M. Burnworth, L. Tangl, J. R. Kumpferl, A. J. Duncan, F. L. Beyer, G. L.Fiore, S. J. Rowan and C. Weder, Nature, 2011, 472, 334 CrossRef CAS
; (l) U. Velten, B. Lahn and M. Rehahn, Macromol. Chem. Phys., 1997, 198, 2789 CrossRef CAS
; (m) U. Velten and M. Rehahn, Chem. Commun., 1996, 2639 RSC
; (n) S. Bernhard, K. Takada, D. Jenkins and H. D. Abruna, Inorg. Chem., 2002, 41, 765 CrossRef CAS
; (o) S. Bernhard, J. I. Goldsmith, K. Takada and H. D. Abruna, Inorg. Chem., 2003, 42, 4389 CrossRef CAS
; (p) U. Velten and M. Rehahn, Macromol. Chem. Phys., 1998, 199, 127 CAS
; (q) P. L. Vidal, B. Divisia-Blohorn, G. Bidan, J. L. Hazemann, J. M. Kern and J. P. Sauvage, Chem.–Eur. J., 2000, 6, 1663 CrossRef CAS
; (r) J. P. Sauvage, Acc. Chem. Res., 1998, 31, 611 CrossRef CAS
.
-
(a) J. D. Ranford and P. J. Sadler, Dalton Trans., 1993, 3393 RSC
; (b) G. Majella, S. Vivienne, M. Malachy, D. Michael and M. Vickie, Polyhedron, 1999, 18, 2931 CrossRef
; (c) D. K. Saha, U. Sandbhor, K. Shirisha, S. Padhye, D. Deobagkar, C. E. Ansond and A. K. Powelld, Bioorg. Med. Chem. Lett., 2004, 14, 3027 CrossRef CAS
; (d) M. A. Zoroddu, S. Zanetti, R. Pogni and R. Basosi, J. Inorg. Biochem., 1996, 63, 291 CrossRef CAS
.
-
(a) D. S. Sigman, Biochem., 1990, 29, 9097 CrossRef CAS
; (b) D. S. Sigman, A. Mazumder and D. M. Perrin, Chem. Rev., 1993, 93, 2295 CrossRef CAS
; (c) W. K. Pogozelski and T. D. Tullius, Chem. Rev., 1998, 1089 CrossRef CAS
.
- R. E. Reichmann, S. A. Rice, C. A. Thomas and P. Doty, J. Am. Chem. Soc., 1954, 76, 3047 CrossRef
.
-
(a) M. D. Hossain and M. Higuchi, Synthesis, 2013, 45, 753 CrossRef CAS
; (b) R. K. Pandey, M. D. Hossain, S. Moriyama and M. Higuchi, J. Mater. Chem. A, 2013, 1, 9016 RSC
; (c) M. K. Bera, C. Chakraborty and S. Malik, New J. Chem., 2015, 39, 9207–9214 RSC
.
-
(a) W. A. Kalsbeck and H. H. Thorp, J. Am. Chem. Soc., 1993, 115, 7146 CrossRef CAS
; (b) D. A. Lutterman, A. Chouai, Y. Liu, Y.-J. Sun, C. D. Stewart, K. R. Dunbar and C. Turro, J. Am. Chem. Soc., 2008, 130, 1163 CrossRef CAS
; (c) Y. Liu, R. Hammitt, D. A. Lutterman, R. P. Thummel and C. Turro, Inorg. Chem., 2007, 46, 6011 CrossRef CAS
; (d) V. Uma, M. Elango and B. U. Nair, Eur. J. Inorg. Chem., 2007, 3484 CrossRef CAS
; (e) M. Marigppan and B. G. Maiya, Eur. J. Inorg. Chem., 2005, 2164 CrossRef
.
-
(a) S. Ramakrishnan and M. Palaniandavar, J. Chem. Sci., 2005, 117, 179 CrossRef CAS
; (b) H. Gopinathan, A. E. Poornanandhan and M. N. Arumugham, International Journal of Inorganic and Bioinorganic Chemistry, 2012, 2, 42 Search PubMed
; (c) S. Arounaguiri, D. Easwaramoorthy, A. Ashokkumar, A. Dattagupta and B. G. Maiya, Proc. - Indian Acad. Sci., Chem. Sci., 2000, 112, 1 CrossRef CAS
.
-
(a) H. Qiu, J. B. Gilroya and I. Manners, Chem. Commun., 2013, 49, 42–44 RSC
; (b) F. Gao, H. Chao, F. Zhou, Y. X. Yuan, B. Peng and L. N. Ji, J. Inorg. Biochem., 2006, 100, 1487 CrossRef CAS
.
-
(a) N. Zielke and B. A. Edgar, Wiley Interdiscip. Rev.: Dev. Biol., 2015, 4, 469 CrossRef CAS
; (b) A. Sakaue-Sawano, H. Kurokawa and T. Morimura, et al. , Cell, 2008, 132, 487 CrossRef CAS
; (c) S. Karasawa, T. Araki, T. Nagai, H. Mizuno and A. Miyawaki, Biochem. J., 2004, 381, 307 CrossRef CAS
.
Footnotes |
| † Electronic supplementary information (ESI) available. See DOI: 10.1039/c7ra05644c |
| ‡ Present Address: Department of Chemistry, Faculty of Science, Jagannath University, Dhaka-1100, Bangladesh. |
| § Present Address: Laboratory of Soft Matter and Biological Physics, Institute of Physics, Chinese Academy of Sciences, Beijing 100190, China. |
| This journal is © The Royal Society of Chemistry 2017 |

