Europium single atom based heterojunction photocatalysts with enhanced visible-light catalytic activity†
Yini li
,
Yang
Qu
 and
Guofeng
Wang
 *
*
Key Laboratory of Functional Inorganic Material Chemistry, Ministry of Education, School of Chemistry and Materials Science, Heilongjiang University, Harbin 150080, China. E-mail: 2010070@hlju.edu.cn
First published on 18th November 2021
Abstract
Promoting charge separation is still the main challenge in the rational design of photocatalysts for visible light photocatalytic reduction of CO2. Based on the unique advantages of the Eu3+ single atom and the Type-II heterojunction in the field of photocatalytic reduction, a Eu3+ single atom doped CdS/InVO4 Type-II heterojunction was successfully constructed through the combination of hydrothermal and in situ synthesis. The prepared CdS/InVO4:Eu3+ single atom composite material has excellent photocatalytic CO2 reduction activity under visible light. The XPS test results show that the In 3d, O 1s, V 2p, and Eu 3d peaks of 10-CdS/IVO:Eu3+ move slightly towards a low energy direction, while, the positions of Cd 3d and S 2p peaks are both shifted to the direction of high binding energies, which indicated that the electrons can be transferred from CdS to IVO with the help of Eu3+. The CO yield of CdS/InVO4:Eu3+ was 11.02 μmol g−1 h−1, which was almost 2.4 times that of pure InVO4 and 1.9 times that of pure CdS, and the yield of CH4 of CdS/InVO4:Eu3+ reached 8.24 μmol g−1 h−1, which was 5.3 times and 10.6 times that of InVO4 and CdS, respectively. Both the theoretical and experimental results show that the single atom Eu3+ can not only modify InVO4 and activate CO2 molecules, but can also promote charge separation between the interface and improve the photocatalytic performance. It is expected that the research results of this paper can provide a novel idea for the rational design of rare earth monatomic catalysts.
1. Introduction
The rapid development of society and the excessive use of fuel due to globalization and industrialization have not only aggravated the emission of carbon dioxide (CO2), but have also posed a serious threat to the ecosystem of earth. CO2 is considered to be the main greenhouse gas causing global warming. In the last few decades, CO2 has accumulated in the atmosphere in large amounts.1–5 Through photoreduction CO2 technology, CO2 can be effectively converted into fuels or more valuable chemicals, which means that it can not only reduce the greenhouse effect caused by CO2, but can also fulfill the needs of looking for new types of energy.6–11 However, most photocatalysts currently developed are restricted by a narrow light absorption range and poor photo-generated carrier separation efficiency, resulting in low photocatalytic activity efficiency.Compared with single-component catalysts, multi-component composite photocatalysts are more conducive to improving charge separation and photocatalytic activity. Therefore, the reasonable construction of semiconductor heterojunction photocatalysts is expected to improve the photocatalytic efficiency of the catalyst.12–16 The heterojunction with good semiconductor energy level matching and close contact can accelerate charge separation and extend the lifetime of electrons.17–24
In recent years, indium vanadate (InVO4) has been considered as a photocatalyst with great potential because of its appropriate band gap energy (2.15 eV) and high chemical stability.25–28 However, the recombination rate of electron–hole pairs of InVO4 is relatively high, which limits the improvement of photocatalytic performance. As another excellent catalyst material, CdS has been widely used in hydrogen production from water splitting and photocatalytic degradation of organic pollutants.29–33 CdS has high visible light response and carrier transport ability. More importantly, the suitable band gap (2.4 eV) of CdS can be well matched with that of InVO4; so it is possible to form a Type-II heterostructure. How to greatly improve charge transfer at the heterogeneous interface is still the focus of current research work.34–36
Atomically thin semiconductors can provide a large number of low-coordination surface atoms, which can be used as the catalytic center for CO2 reduction to improve the photocatalytic activity. The ultra-thin thickness can also shorten the distance of charge transfer, so that the photo-generated carriers can more easily migrate from the inside to the surface.37–39 Particularly, single-atom catalysts have attracted extensive attention, in which each atom is used as an active center, so the efficiency of catalysts is greatly improved.40–44 However, there are few studies on rare earth (RE) single-atom catalysts. It is well known that RE ions have special energy level structures and have been widely used in the modification of catalysts, but the possible mechanism to improve the catalytic performance of RE ions is yet to be explored.45–51
Herein, InVO4 sheets with a uniform thickness of less than 10 nm were successfully synthesized, and were further compounded with CdS nanoparticles to form a Type-II heterojunction with enhanced visible-light catalytic activity. This is the first report of europium single atom photocatalytic materials (Table S1†). The prepared CdS/InVO4:Eu3+ single atom composite material has excellent photocatalytic CO2 reduction activity under visible light.
2. Experimental
The chemicals and characterization details are shown in the ESI.†2.1 Synthesis of CdS nanoparticle
4 mmol (Cd(CH3COO)2·2H2O) was dissolved in 20 mL dodecylamine, and then 4 mmol S powder was added into the above solution under constant magnetic stirring. After further stirring for 30 minutes at 50 °C, the mixture was transferred to a Teflon lined stainless steel autoclave with an internal volume of 50 mL and heated at 200 °C for 24 h; the precipitate obtained by the reaction was repeatedly washed with ethanol and CS2 solvent, centrifuged, and dried at room temperature to obtain small CdS nanoparticles.2.2 Synthesis of InVO4 (IVO) and InVO4:Eu3+ (IVO:Eu3+)
1.0 mmol Na3VO4·12H2O and 1.0 mmol InCl3·4H2O were dissolved in 20 and 10 mL deionized water, respectively. The InCl3 aqueous solution was added into the Na3VO4 solution under constant magnetic stirring, and then, the pH value of the solution was adjusted to about 1–2. The solution was further transferred to a Teflon-lined stainless steel autoclave and kept at 180 °C for 18 h in the oven. After cooling to room temperature, the sediment at the bottom was filtered, washed with deionized water several times, freeze-dried in a freeze dryer, and then ultra-thin indium IVO (InVO4) nanosheets were successfully obtained. The synthesis process of IVO:Eu3+ (InVO4:Eu3+) is similar to that of IVO, except that 1 mol% InCl3 is replaced by EuCl3 in the initial reaction process.2.3 Synthesis of CdS/IVO:Eu3+ and CCdS/IVO:Eu3+
First, CdS small particles were synthesized by a hydrothermal method, and then CdS/IVO:Eu3+ was obtained by adding CdS particles into the precursor solution of synthetic IVO:Eu3+. According to the ratio of CdS to IVO:Eu3+, these samples were named 5-CdS/IVO:Eu3+, 7-CdS/IVO:Eu3+, 10-CdS/IVO:Eu3+, and 13-CdS/IVO:Eu3+. Similarly, CCdS/IVO:Eu3+ was obtained by adding CCdS (commercial CdS) particles into the precursor solution of synthetic IVO:Eu3+. The synthesis parameters and sample abbreviations are shown in Table S2.†3. Results and discussion
3.1 Overall design route of the work
As mentioned above, the Eu3+ single atom doped CdS/InVO4 Type-II heterojunction can be constructed through the combination of a hydrothermal method and in situ synthesis method. Here, the CCdS/InVO4 Type-II heterojunction was used as a reference sample to study the photocatalytic performance. Scheme 1a shows the synthesis diagrams of CdS and CdS/IVO:Eu3+. The photoreduction process of CO2 under visible light and the proposed photocatalytic mechanism are shown in Scheme 1b. In this study, the 5D1 level of Eu3+ is located between the conduction bands of CdS and IVO, which is suitable for forming a charge transfer bridge and promoting charge separation. Thus, the single-atom Eu3+ can not only modify IVO by doping, but can also serve as an interface charge transfer bridge between IVO and CdS, which fully improves the charge separation between the interfaces and improves the photocatalytic activity of CO2 reduction. | ||
| Scheme 1 (a) Synthesis diagrams of CdS and CdS/IVO:Eu3+. (b) The proposed mechanism diagram of photocatalysis and the photoreduction of CO2 process under visible light irradiation. | ||
3.2 Materials characterization
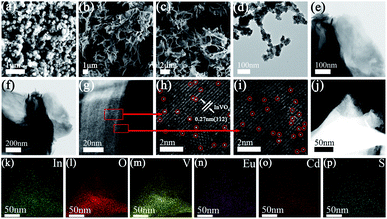
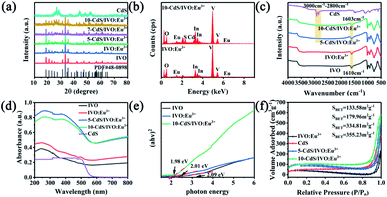
As expected, a series of Eu3+ single atom based CdS/IVO:Eu3+ and CCdS/IVO:Eu3+ composite materials were successfully synthesized. As mentioned above, the synthesis parameters and sample abbreviations are shown in Table S2.† The scanning electron microscope (SEM) and transmission electron microscopy (TEM) images of CdS, IVO, IVO:Eu3+, and 10-CdS/IVO:Eu3+ are shown in Fig. 1a–f. The SEM and TEM images of IVO indicate that IVO is mainly composed of smooth, flexible, and sheet-like nanostructures, and a small amount of Eu3+ doping (1 mol%) has little effect on the morphology. For the 10-CdS/IVO:Eu3+ sample, it can be observed that the nanosheet structure of IVO:Eu3+ is still retained (Fig. 1c, g–i), and the HRTEM image shows that the lattice fringe at a distance of 0.27 nm between planes belongs to the (112) crystal plane of the orthogonal phase of the IVO. The dispersion state of the Eu element in CdS/IVO:Eu3+ was further verified by aberration-corrected HAADF-STEM (AC HAADF-STEM) measurements (Fig. 1g–p). Clear bright spots can be observed in the AC HAADF-STEM image of 10-CdS/IVO:Eu3+, indicating that the Eu element exists in the composite material as a single atom. The energy dispersive spectroscopy (EDX) spectra showed the same results as expected, indicating that In, O, V, Eu, Cd, and S elements are uniformly distributed in the composite material. In addition, the SEM images of CCdS and 10-CCdS/IVO:Eu3+ show that CCdS is mainly composed of irregular and amorphous nanocrystalline structures, and a large amount of aggregation occurs in 10-CCdS/IVO:Eu3+ composites, as shown in Fig. S1.† The atomic force microscope (AFM) images and the corresponding height cross section profiles of IVO and 10-CdS/IVO:Eu3+ are illustrated in Fig. S2.† The thickness of the nanosheet was measured from the cross section height profiles, which reveals that the average thicknesses of IVO and 10-CdS/IVO:Eu3+ are 6.8 and 7.0 nm, respectively.The crystal structures of the prepared samples were studied by XRD characterization (Fig. 2a). The results of XRD patterns show that the pure IVO can be easily indexed to the orthorhombic phase (JCPDS no. 48-0898); the obvious and sharp peaks indicate that IVO is well crystallized. In the XRD diffraction peaks of IVO:Eu3+, no obvious Eu3+ diffraction peaks were observed, indicating that the atomic-level dopant Eu3+ ions are well combined with the IVO lattice. For CdS/IVO:Eu3+, the characteristic peaks of IVO:Eu3+ and CdS were detected, proving that there is a two-phase composition in the CdS/IVO:Eu3+ heterojunction. As the content of CdS increases, the peak intensity of CdS also increases. The energy dispersive spectroscopy (EDS) spectra of 10-CdS/IVO:Eu3+ further prove the formation of a heterojunction, in which the signals of In, V, O, Eu, Cd, and S elements can be clearly observed (Fig. 2b). In order to better evaluate the effect of Eu content on photocatalytic performance, we carried out the ICP test of different ratios of CdS/IVO:Eu3+. Among them, the Eu mass concentrations of 7-CdS/IVO:Eu3+, 10-CdS/IVO:Eu3+, and 13-CdS/IVO:Eu3+ are 1.28%, 1.27%, and 1.21%, respectively. It is noted that during the synthesis of CdS/IVO:Eu3+, the concentration of Eu3+ in IVO:Eu3+ is fixed, and the concentration of Eu3+ in CdS/IVO:Eu3+ changes with the different proportions of CdS and IVO:Eu3+. On the whole, the Eu3+ concentration increases with the increase of IVO:Eu3+ content.
The Fourier transform infrared (FT-IR) spectra of pure IVO, IVO:Eu3+, 5-CdS/IVO:Eu3+, 10-CdS/IVO:Eu3+, and CdS are shown in Fig. 2c. For the CdS/IVO:Eu3+ composite material, almost the same characteristic peaks as IVO can be observed, of which 764, 925, and 1014 cm−1 are assigned to V–O–In bridging and V–O stretching, respectively. A weaker Cd–S vibration (2861 and 2920 cm−1) was observed in the 3000–2800 cm−1 area. In addition, the position of the VO4− group (1603 cm−1) for CdS/IVO:Eu3+ has a weaker blue shift relative to that of IVO or IVO:Eu3+ (1610 cm−1), which can be attributed to the interaction of IVO:Eu3+ and CdS.
The UV-vis absorption spectra of the obtained samples were measured by UV-vis absorption spectroscopy; all samples respond under ultraviolet and visible light (Fig. 2d). Compared with pure IVO, the absorption range of the Eu3+ doped one broadens toward the long wave direction. Meanwhile, the visible light absorption of CdS/IVO:Eu3+ was significantly enhanced, and the absorption edge showed a red shift with the increase of CdS content. The bandgap energies (Eg) of IVO, IVO:Eu3+, 10-CdS/IVO:Eu3+, and CdS are estimated to be about 2.09, 2.01, 1.98 and 2.42 eV, respectively (Fig. 2e and S3†). The reduction in the band gap of the composite material may be caused by the interaction of chemical bonds between semiconductors and the Eu3+ doping. The thermogravimetric analysis of 10-CdS/IVO:Eu3+ is shown in Fig. S4.† The weightlessness stage mainly occurs below 100 °C, which is caused by the evaporation of residual solvent. The composite materials show no obvious frame collapse, which proves that it has good thermal stability.
The hysteresis loops of the nitrogen adsorption and desorption isotherm belong to the second type isotherm (Fig. 2f), indicating that the samples have large pores. The specific surface areas of the composite samples 5-CdS/IVO:Eu3+ and 10-CdS/IVO:Eu3+ are as high as 334.81 and 355.23 m2 g−1, which are significantly larger than those of IVO and CdS. In general, the larger the surface area is, the more conducive it is to the adsorption of CO2, thereby improving the photocatalytic performance.
The chemical compositions and the binding energy of chemical bonds of the as-prepared 10-CdS/IVO:Eu3+ photocatalyst were further analyzed by X-ray photoelectron spectroscopy (XPS). The results of XPS spectra show that 10-CdS/IVO:Eu3+ is mainly composed of In, O, V, Eu, Cd, and S elements (Fig. S5†). In the In 3d XPS spectrum (Fig. 3a) of IVO:Eu3+, the two peaks at 445.2 and 452.7 eV are attributed to the binding energies of In 3d5/2 and In 3d3/2, indicating the existence of In3+ species. After compounding with CdS, the peak positions of In 3d5/2 and In 3d3/2 shift to 444.9 and 452.4 eV, respectively. Obviously, the peak positions of In 3d5/2 and 3d3/2 move slightly towards the low energy direction, indicating that the charge density around In increases. Compared with IVO:Eu3+, the O 1s peaks for 10-CdS/IVO:Eu3+ shifted from 530.1 eV (lattice oxygen), 530.8 eV (vacancy oxygen), and 532.4 eV (absorbed oxygen) to 529.9, 530.7, and 532.3 eV, respectively (Fig. 3b). Among them, the formation of vacancy oxygen in IVO is necessary to maintain a charge balance when V5+ converts to V3+ and V5+ to V4+.52Fig. 3c shows the V 2p spectra of 10-CdS/IVO:Eu3+ and IVO:Eu3+. For IVO:Eu3+, the peaks at 516.2 and 523.6 eV correspond to V 2p3/2 and V 2p1/2 of V3+ ions, while the peaks at 517.4 and 525.0 eV are attributed to V 2p3/2 and V 2p1/2 of V5+ ions, and the other peak at about 517.9 eV can be indexed to the oxidation state of V4+, respectively. For 10-CdS/IVO:Eu3+, the location of V 2p3/2 and V 2p1/2 peaks of V3+ ions shift to 515.9 and 522.1 eV, the location of V 2p3/2 and V 2p1/2 peaks of V5+ ions shift to 517.1 and 524.6 eV, and the location of oxidation state of the V4+ peak shifts to 517.7 eV, respectively. Compared with IVO:Eu3+, the Eu 3d peaks of 10-CdS/IVO:Eu3+ shifted from 1135.4 eV (Eu 3d5/2), 1149.5 eV (Eu 3d3/2), and 1164.8 eV (Eu 3d3/2) to 1135.4, 1148.7, and 1164.4 eV, respectively (Fig. 3d). The Cd 3d spectrum of CdS displays four peaks at 404.5, 405.8, 411.3, and 412.5 eV, which exactly belonged to Cd 3d5/2 and Cd 3d3/2 of Cd2+ (Fig. 3e). After compounding with IVO:Eu3+, the Cd 3d5/2 peaks shifted to 404.9 and 406.2 eV, and the Cd 3d3/2 peaks shifted to 411.6 and 412.9 eV, respectively. In the spectra of S 2p (Fig. 3f), the S 2p3/2 (160.7 eV) and S 2p1/2 (161.8 eV) peaks also shifted to the high binding energy side (161.2 eV and 162.3 eV) after forming the 10-CdS/IVO:Eu3+ heterojunction. Interestingly, it is found that the In 3d, O 1s, V 2p, and Eu 3d peaks of 10-CdS/IVO:Eu3+ move slightly towards the low energy direction, indicating that the charge density around In, O, V, and Eu increases. However, the positions of Cd 3d and S 2p peaks are both shifted to the direction of high binding energy, which indicated that the charge density around Cd and S decreases. These results further demonstrate that Eu3+ exists as a charge transfer bridge between CdS and IVO:Eu3+, and the electrons can transfer from CdS to IVO, which promotes charge separation and improves photocatalytic activity. The charge separation will be also discussed in detail with subsequent theoretical calculations.
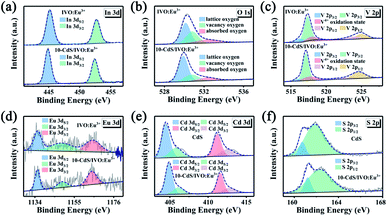 | ||
| Fig. 3 XPS spectra of IVO:Eu3+, 10-CdS/IVO:Eu3+, and CdS. (a) In 3d, (b) O 1s, (c) V 2p, (d) Eu 3d, (e) Cd 3d, and (f) S 2p. | ||
3.3 Photocatalytic properties
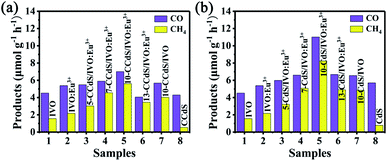
The photocatalytic performances of IVO, IVO:Eu3+, CdS, CCdS, CdS/IVO, CdS/IVO:Eu3+, CCdS/IVO, and CCdS/IVO:Eu3+ under visible light are shown in Fig. 4. As predicted, the photocatalytic performance of CCdS/IVO:Eu3+ was significantly improved compared with those of pure IVO, IVO:Eu3+ and CCdS. And the photocatalytic performance of CdS/IVO:Eu3+ was also significantly improved compared with those of pure IVO, IVO:Eu3+ and CdS. Particularly, the photocatalytic performance of CdS/IVO:Eu3+ was better than that of CCdS/IVO:Eu3+. The CO and CH4 production rates of 10-CCdS/IVO:Eu3+ reached 7.01 and 5.61 μmol g−1 h−1, respectively. The CO content is equivalent to 1.56 times that of IVO (4.52 μmol g−1 h−1) and 1.63 times that of CCdS (4.3 μmol g−1 h−1). The CH4 content for 10-CCdS/IVO:Eu3+ is equivalent to 3.6 times that of IVO (1.56 μmol g−1 h−1) and 10.6 times that of CCdS (0.53 μmol g−1 h−1). The CO production rates of 10-CdS/IVO:Eu3+ reached 11.02 μmol g−1 h−1, which is approximately 2.4 times that of IVO (4.52 μmol g−1 h−1) and 1.9 times that of CdS (5.7 μmol g−1 h−1). The CH4 production rates of 10-CdS/IVO:Eu3+ reached 8.24 μmol g−1 h−1, which is 5.3 times higher than that of pure IVO (1.56 μmol g−1 h−1) and 10.6 times higher than that of CdS (0.78 μmol g−1 h−1). In order to investigate the CO2 adsorption capacity of the as-prepared samples, the CO2-TPD measurements of the samples were performed, as shown in Fig. S6.† The CO2-TPD profile of 10-CdS/IVO:Eu3+ shows that there is a strong CO2 desorption band in the range of 200–350 °C, implying that the surface of 10-CdS/IVO:Eu3+ could induce a certain extent of CO2 adsorption. It is worth noting that the CO2 desorption peak area of 10-CdS/IVO:Eu3+ is much larger than that of IVO, so the interaction between CO2 and 10-CdS/IVO:Eu3+ is much stronger.The O2, CO, CH4, and H2 photocatalytic production amounts of IVO, 10-CdS/IVO:Eu3+ and CdS are shown in Fig. S7.† According to our test results, the numbers of electrons consumed in the reduction reactions of IVO, 10-CdS/IVO:Eu3+ and CdS are 24.56, 93.16, and 20.64 μmol g−1 h−1, and the numbers of holes consumed on the water oxidation reaction are 24.72, 94.00, and 21.20 μmol g−1 h−1, respectively. The calculation results are basically in line with the balance of the number of electrons consumed in the reduction reaction and the number of holes consumed in the water oxidation reaction, and are basically consistent with 4 × O2 = 2 × CO + 8 × CH4 + 2 × H2. In addition, the photocatalytic activity of 10-CdS/IVO:Eu3+ is relatively stable (Fig. S8†). It is found that the crystal phase of the sample has no obvious change after the photocatalysis test, but the morphology of the sample shows that the sample has agglomeration which further proves that the photocatalyst has good stability (Fig. S9†). To prove the role of Eu3+, the photocatalytic performance between CdS/IVO:Eu3+ and CdS/IVO (or between CCdS/IVO:Eu3+ and CCdS/IVO) were compared. As expected, the photocatalytic performance of CdS/IVO:Eu3+ (or CCdS/IVO:Eu3+) was improved compared with that of pure CdS/IVO (or CCdS/IVO). We suggested that the Eu3+ single atom plays multiple roles in the CdS/IVO:Eu3+ (or CCdS/IVO:Eu3+) samples, which will be discussed in the later theoretical calculation in detail.
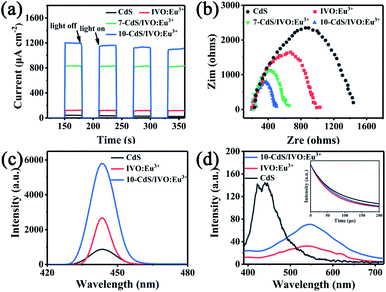
Fig. 5a shows the transient photocurrent test results of IVO:Eu3+, CdS and CdS/IVO:Eu3+. Compared with IVO:Eu3+ and CdS, CdS/IVO:Eu3+ has significantly higher photocurrent intensity, and the photocurrent intensity of 10-CdS/IVO:Eu3+ is the highest. We suggested that CdS/IVO:Eu3+ has a higher photocatalytic activity by reducing the recombination rate of photoinduced charge carriers and promoting the separation and transfer of photogenerated electron–hole pairs, which is consistent with the results of photocatalytic performance. The electrochemical impedances (EIS) results are shown in Fig. 5b; it is well known that the smaller the arc radius, the faster the interface charge transfer, indicating that the charge transfer of 10-CdS/IVO:Eu3+ is the fastest. The coumarin fluorescence method was employed to explore the ˙OH produced by the samples during the photocatalytic reduction of CO2, and the fluorescence spectra of 7-hydroxycoumarin were measured under 370 nm light excitation (Fig. 5c). The fluorescence spectrum signal of 10-CdS/IVO:Eu3+ is much higher than those of IVO:Eu3+ and CdS, indicating that 10-CdS/IVO:Eu3+ produces more ˙OH and higher photoactivity during the reduction process. Fig. 5d presents the photoluminescence spectra of different samples. Here, the emission band positions of CdS and IVO:Eu3+ are obviously different. However for CdS/IVO:Eu3+, only the emission band of IVO:Eu3+ was observed, indicating that the electrons can transfer from CdS to IVO. The illustration in Fig. 5d shows the luminescence decay curves of different samples. It is noted that the monitoring wavelengths are 440, 540, and 540 nm for CdS, IVO:Eu3+, and 10-CdS/IVO:Eu3+, respectively. The average fitting data of the fluorescence lifetimes of CdS, IVO:Eu3+, and 10-CdS/IVO:Eu3+ are 173.40, 147.66 and 150.90 μs, respectively. Compared with IVO:Eu3+, the fluorescence lifetime of 10-CdS/IVO:Eu3+ was improved, which further proves that the energy is transferred from CdS to IVO:Eu3+, and the formation of the heterojunction can enhance electron transport and reduce hole–electron pair recombination.
3.4 DFT calculations and discussion
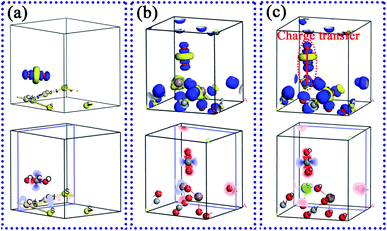
To further prove that the CdS/IVO:Eu3+ is conducive to charge separation, DFT was used to optimize the crystal structures and calculate the deformation charge densities of CdS, IVO, and IVO:Eu3+. The calculation parameters for the (112) surface of samples with different section thicknesses and vacuum layer thicknesses and the corresponding sample names are shown in Table S3.† The geometric structures and deformation charge densities of CdS, IVO, and IVO:Eu3+ are shown in Fig. 6 and S10.† The lattice parameters of CdS are a = 6.26 Å, b = 6.26 Å, and c = 7.16 Å. The lattice parameters of IVO are a = 5.55 Å, b = 5.55 Å, and c = 7.18 Å. The lattice parameters of IVO:Eu3+ are a = 5.35 Å, b = 5.35 Å, and c = 7.41 Å. The adsorption energies (Eads) of CO2 on the (112) surfaces of CdS (thin), IVO (thin), and IVO:Eu3+ (thin) are also shown in Fig. 6. The values of Eads are 0.5, 0.3, and 0.7 eV for CdS (thin), IVO (thin), and IVO:Eu3+ (thin), respectively. The results show that the bond length of O–Eu is shorter than that of O–In, and the adsorption energy of CO2 on the (112) surface of IVO (thin) is larger than that of IVO:Eu3+ (thin). Noteworthily, CO2 adsorption energy is also related to the location of CO2 adsorption, as shown in Fig. S11.† The charge density differences of CO2 adsorbed on the (112) surface of the CdS (thin), IVO (thin), and IVO:Eu3+ (thin) are shown in Fig. 7. The geometric structure and charge density difference of CdS/IVO (thin), CdS/IVO:Eu3+ (thin), and CdS/IVO:Eu3+ (thick) heterojunctions are shown in Fig. 8. All the results indicate that the existence of the Eu3+ single atom is conducive to the activation of CO2 molecules and the interfacial charge transfer.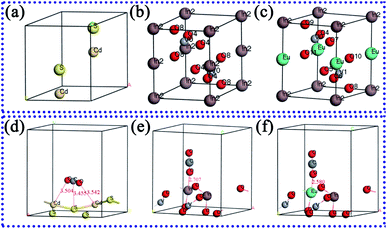 | ||
| Fig. 6 The geometric structures of (a) CdS, (b) IVO, and (c) IVO:Eu3+. The adsorption energy (Eads) of CO2 on the (112) surface of (d) CdS (thin), (e) IVO (thin), and (f) IVO:Eu3+ (thin). | ||
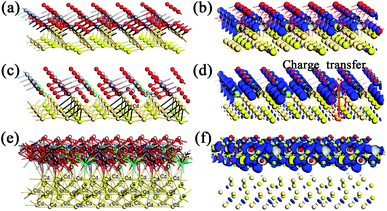 | ||
| Fig. 8 The geometric structures and charge density difference of (a and b) CdS/IVO (thin), (c and d) CdS/IVO:Eu3+ (thin), and (e and f) CdS/IVO:Eu3+ (thick). | ||
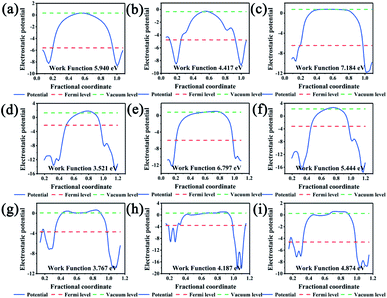
The calculated Fermi levels, vacuum levels, and work functions of the (112) surface of samples with different section thicknesses and vacuum layer thicknesses are shown in Fig. 9. The results indicate that the values of work function are 5.940, 4.417, 7.184, 3.521, 6.797, 5.444, 3.767, 4.187, and 4.874 eV for CdS (thin), CdS (thick), IVO (thin), IVO (thick), IVO–Eu (thin), IVO–Eu (thick), CdS/IVO:Eu3+ (thin), CdS/IVO:Eu3+ (thick), and CdS/IVO (thin), respectively. In particular, the change of work functions between CdS/IVO:Eu3+ (thin) and CdS/IVO (thin) heterojunctions directly affects energy transfer from CdS to IVO in the CdS/IVO:Eu3+ heterojunction, which is conducive to the improvement of interfacial charge transfer and photocatalytic performance.
Fig. 10 shows the calculated band structure and density of states of the (112) surface for IVO (thin), IVO–Eu (thin), CdS (thin), CdS/IVO (thin), CdS/IVO:Eu3+ (thin), and CdS/IVO:Eu3+ (thick). The results show that the band gap of IVO becomes narrower after Eu doping. In addition, the band structure and density of states are also related to the section thickness and vacuum layer thickness. Therefore, different crystal planes and atoms of the material can be exposed by controlling the synthesis conditions, so as to enhance the photocatalytic performance.
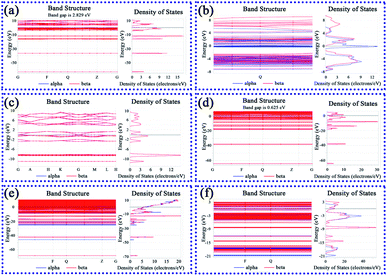 | ||
| Fig. 10 Band structure and density of states for the (112) surface: (a) IVO (thin), (b) IVO–Eu (thin), (c) CdS (thin), (d) CdS/IVO (thin), (e) CdS/IVO:Eu3+ (thin), and (f) CdS/IVO:Eu3+ (thick). | ||
Fig. S12† shows the optical properties of bulk CdS, IVO, and IVO:Eu3+ obtained by theoretical simulation. Fig. S13† shows the theoretical optical properties of the (112) surface of CdS, IVO, IVO–Eu, CdS/IVO, CdS/IVO:Eu3+ with different section thicknesses and vacuum layer thicknesses. It is noted that the dielectric function is related to the electronic transition and electronic structure in the crystal and can reflect the band structure and optical properties of the materials. The imaginary part of the dielectric function describes the actual transition between the occupied state and the unoccupied state. The results show that we can reasonably design the composite structures by designing the particle size, the exposed crystal surface, and the proportion of composite materials, so as to meet our different needs.
4. Conclusions
Starting from the controllable construction at the atomic and molecular scales, and considering the special structure of Eu3+ ions and the advantages of CdS/IVO:Eu3+ Type-II heterojunctions, we propose that the single-atom Eu3+ can not only modify IVO by doping, but can also act as an interface charge transfer bridge between IVO and CdS, thereby fully promoting the charge separation between the interfaces and improving the photocatalytic activity of CO2 reduction. As expected, small CdS particles are compounded on the InVO4 plate with a uniform thickness through the combination of a hydrothermal process and in situ synthesis method. Under the irradiation of visible light, the yield of CH4 for 10-CdS/IVO:Eu3+ reached 8.24 μmol g−1 h−1, which was 5.3 times and 10.6 times that of IVO and CdS, and the CO yield was 11.02 μmol g−1 h−1, which was almost 2.4 times that of IVO and 1.9 times that of CdS, respectively. The XPS test results show that the In 3d, O 1s, V 2p, and Eu 3d peaks of 10-CdS/IVO:Eu3+ move slightly towards the low energy direction, indicating that the charge density around In, O, V, and Eu increases. The positions of Cd 3d and S 2p peaks are both shifted to the high binding energy direction, which indicates that the charge density around Cd and S decreases. Thus, the Eu3+ ions effectively promote the charge transfer between CdS and IVO:Eu3+, and electrons can transfer from CdS to IVO. Through a series of DFT calculations, the results of the band structure, work function and CO2 adsorption energy successfully proved that the Eu3+ single atom has a dual function of CO2 activation and charge separation promotion. In addition, the combined mode of Eu3+ single atom catalysis and the heterojunction makes full use of their advantages. It is expected that the results of this work can provide more theoretical and experimental design support ideas and prospects for RE single atom catalysts, and open up a novel pathway for the design of photocatalytic systems with high catalytic performance.Author contributions
Y. L. analyzed the experimental data and wrote the original draft. Y. L. performed major experiments. G. W. designed the concept of this work. G. W. performed the computational study. G. W. and Y. Q. revised the manuscript. All the authors discussed the results and commented on the manuscript.Conflicts of interest
There are no conflicts to declare.Acknowledgements
This work was supported by the National Natural Science Foundation of China (No. 21871079), and the 2021 Graduate Innovation Project Fund of Heilongjiang University (YJSCX2021-070HLJU).Notes and references
- D. Wang and Y. Li, Adv. Mater., 2011, 23, 1044–1060 CrossRef CAS PubMed
.
- S. Ji, Y. Qu, T. Wang, Y. Chen, G. Wang, X. Li, J. Dong, Q. Chen, W. Zhang, Z. Zhang, S. Liang, R. Yu, Y. Wang, D. Wang and Y. Li, Angew. Chem., Int. Ed., 2020, 59, 10651–10657 CrossRef CAS
.
- Y. Wang, D. Wang and Y. Li, Adv. Mater., 2021, 33, 2008151 CrossRef CAS
.
- Y. Wang, S. Wang and X. Lou, Angew. Chem., Int. Ed., 2019, 58, 17236–17240 CrossRef CAS PubMed
.
- Q. Shi, Z. Li, L. Chen, X. Zhang, W. Han, M. Xie, J. Yang and L. Jing, Appl. Catal., B, 2019, 244, 641–649 CrossRef CAS
.
- W. Liu, X. Li, C. Wang, H. Pan, W. Liu, K. Wang, Q. Zeng, R. Wang and J. Jiang, J. Am. Chem. Soc., 2019, 141, 17431–17440 CrossRef CAS
.
- N. Zhang, C. Ye, H. Yan, L. Li, H. He, D. Wang and Y. Li, Nano Res., 2020, 13, 3165–3182 CrossRef CAS
.
- J. Ran, M. Jaroniec and S. Qiao, Adv. Mater., 2018, 30, 1704649 CrossRef PubMed
.
- S. Cao, B. Shen, T. Tong, J. Fu and J. Yu, Adv. Funct. Mater., 2018, 28, 1800136 CrossRef
.
- S. Ji, Y. Chen, X. Wang, Z. Zhang, D. Wang and Y. Li, Chem. Rev., 2020, 120, 11900–11955 CrossRef CAS
.
- J. Wang, W. Liu, G. Luo, Z. Li, C. Zhao, H. Zhang, M. Zhu, Q. Xu, X. Wang, C. Zhao, Y. Qu, Z. Yang, T. Yao, Y. Li, Y. Lin, Y. Wu and Y. Li, Energy Environ. Sci., 2018, 11, 3375–3379 RSC
.
- J. Bian, Y. Qu, X. Zhang, N. Sun, D. Tang and L. Jing, J. Mater. Chem. A, 2018, 6, 11838–11845 RSC
.
- J. Yang, J. Hao, S. Xu, Q. Wang, J. Dai, A. Zhang and X. Pang, ACS Appl. Mater. Interfaces, 2019, 11, 32025–32037 CrossRef CAS PubMed
.
- W. Zhao, Y. Feng, H. Huang, P. Zhou, J. Li, L. Zhang, B. Dai, J. Xu, F. Zhu, N. Sheng and D. Leung, Appl. Catal., B, 2019, 245, 448–458 CrossRef CAS
.
- Q. Bi, J. Wang, J. Lv, J. Wang, W. Zhang and T. Lu, ACS Catal., 2018, 8, 11815–11821 CrossRef CAS
.
- D. Wang and Y. Li, J. Am. Chem. Soc., 2010, 132, 6280 CrossRef CAS
.
- H. Yu, E. Haviv and R. Neumann, Angew. Chem., Int. Ed., 2020, 59, 6219–6223 CrossRef CAS PubMed
.
- X. Li, H. Rong, J. Zhang, D. Wang and Y. Li, Nano
Res., 2020, 13, 1842–1855 CrossRef CAS
.
- J. Wang, W. Liu, G. Luo, Z. Li, C. Zhao, H. Zhang, M. Zhu, Q. Xu, X. Wang, C. Zhao, Y. Qu, Z. Yang, T. Yao, Y. Li, Y. Lin, Y. Wu and Y. Li, Energy Environ. Sci., 2018, 11, 3375–3379 RSC
.
- J. Zhang, S. Wu, X. Lu, P. Wu and J. Liu, ACS Nano, 2019, 13, 14152–14161 CrossRef CAS PubMed
.
- R. Kuriki, M. Yamamoto, K. Higuchi, Y. Yamamoto, M. Akatsuka, D. Lu, S. Yagi, T. Yoshida, O. Ishitani and K. Maeda, Angew. Chem., Int. Ed., 2017, 56, 4867–4871 CrossRef CAS PubMed
.
- G. Zhao, W. Zhou, Y. Sun, X. Wang, H. Liu, X. Meng, K. Chang and J. Ye, Appl. Catal., B, 2018, 226, 252–257 CrossRef CAS
.
- H. Xu, Y. Wang, X. Dong, N. Zheng, H. Ma and X. Zhang, Appl. Catal., B, 2019, 257, 117932 CrossRef CAS
.
- Q. Han, X. Bai, Z. Man, H. He, L. Li, J. Hu, A. Alsaedi, T. Hayat, Z. Yu, W. Zhang, J. Wang, Y. Zhou and Z. Zou, J. Am. Chem. Soc., 2019, 141, 4209–4213 CrossRef CAS PubMed
.
- S. He, Z. Yang, X. Cui, X. Zhang and X. Niu, Chem, 2020, 260, 127548 CAS
.
- R. Kuriki, H. Matsunaga, T. Nakashima, K. Wada, A. Yamakata, O. Ishitani and K. Maeda, J. Am. Chem. Soc., 2016, 138, 5159–5170 CrossRef CAS
.
- R. Qi, P. Yu, J. Zhang, W. Guo, Y. He, H. Hojo, H. Einaga, Q. Zhang, X. Liu, Z. Jiang and W. Shangguan, Appl. Catal., B, 2020, 274, 119099 CrossRef CAS
.
- Z. Shen, H. Li, H. Hao, Z. Chen, H. Hou, G. Zhang, J. Bi, S. Yan, G. Liu and W. Gao, J. Photochem. Photobiol., A, 2019, 380, 111864 CrossRef CAS
.
- M. Kuehnel, K. Orchard, K. Dalle and E. Reisner, J. Am. Chem. Soc., 2017, 139, 7217–7223 CrossRef CAS PubMed
.
- S. Wang, M. Xu, T. Peng, C. Zhang, T. Li, I. Hussain, J. Wang and B. Tan, Nat. Commun., 2019, 10, 10 CrossRef CAS PubMed
.
- C. Gao, J. Low, R. Long, T. Kong, J. Zhu and Y. Xiong, Chem. Rev., 2020, 120, 12175–12216 CrossRef CAS PubMed
.
- Y. Zhao, Z. Han, G. Gao, W. Zhang, Y. Qu, H. Zhu, P. Zhu and G. Wang, Adv. Funct. Mater., 2021, 31, 2104976 CrossRef CAS
.
- J. Shan, F. Raziq, M. Humayun, W. Zhou, Y. Qu, G. Wang and Y. Li, Appl. Catal.,
B, 2017, 219, 10–17 CrossRef CAS
.
- S. Bai, C. Gao, J. Low and Y. Xiong, Nano Res., 2019, 12, 2031–2054 CrossRef CAS
.
- Q. Chen, G. Gao, Y. Zhang, Y. li, H. Zhu, P. Zhu, Y. Qu, G. Wang and W. Qin, J. Mater. Chem. A, 2021, 9, 15820–15826 RSC
.
- Z. Han, Y. Zhao, G. Gao, W. Zhang, Y. Qu, H. Zhu, P. Zhu and G. Wang, Small, 2021, 17, 2101089 Search PubMed
.
- X. Ye, C. Yang, X. Pan, J. Ma, Y. Zhang, Y. Ren, X. Liu, L. Li and Y. Huang, J. Am. Chem. Soc., 2020, 142, 19001–19005 CrossRef CAS
.
- L. Wang, W. Chen, D. Zhang, Y. Du, R. Amal, S. Qiao, J. Bf and Z. Yin, Chem. Soc. Rev., 2019, 48, 5310–5349 RSC
.
- J. Liu, X. Kong, L. Zheng, X. Guo, X. Liu and J. Shui, ACS Nano, 2020, 14, 1093–1101 CrossRef CAS
.
- K. Choi, D. Kim, B. Rungtaweevoranit, C. Trickett, J. Barmanbek, A. Alshammari, P. Yang and O. Yaghi, J. Am. Chem. Soc., 2017, 139, 356–362 CrossRef CAS
.
- S. Bao, H. Yu, G. Gao, H. Zhu, D. Wang, P. Zhu and G. Wang, 2021, DOI:10.1007/s12274-021-3886-x.
- S. Wang, B. Zhu, M. Liu, L. Zhang, J. Yu and M. Zhou, Appl. Catal., B, 2019, 243, 19–26 CrossRef CAS
.
- J. Yang, W. Li, D. Wang and Y. Li, Small Struct., 2021, 2, 2000051 CrossRef
.
- Z. Wang, C. Li and K. Domen, Chem. Soc. Rev., 2019, 48, 2109–2125 RSC
.
- Z. Zhuang, Q. Kang, D. Wang and Y. Li, Nano Res., 2020, 13, 1856–1866 CrossRef CAS
.
- Y. Wang, J. Mao, X. Meng, L. Yu, D. Deng and X. Bao, Chem. Rev., 2019, 119, 1806–1854 CrossRef CAS PubMed
.
- G. Wang, C. He, R. Huang, J. Mao, D. Wang and Y. Li, J. Am. Chem. Soc., 2020, 142, 19339–19345 CrossRef CAS PubMed
.
- N. Wetchakun, P. Wanwaen, S. Phanichphant and K. Wetchakun, RSC Adv., 2017, 7, 13911–13918 RSC
.
- X. Wu, Y. Li, G. Zhang, H. Chen, J. Li, K. Wang, Y. Pan, Y. Zhao, Y. Sun and Y. Xie, J. Am. Chem. Soc., 2019, 141, 5267–5274 CrossRef CAS
.
- X. Yuan, L. Jiang, J. Liang, Y. Pan, J. Zhang, H. Wang, L. Leng, Z. Wu, R. Guan and G. Zeng, Chem. Eng. J., 2019, 356, 371–381 CrossRef CAS
.
- C. Chen, T. Wu, H. Wu, H. Liu, Q. Qian, Z. Liu, G. Yang and B. Han, Chem. Sci., 2018, 9, 8890–8894 RSC
.
- Z. Wang, X. Zheng and D. Wang, Nano Res., 2021 DOI:10.1007/s12274-021-3794-0
.
Footnote |
| † Electronic supplementary information (ESI) available. See DOI: 10.1039/d1ta08253a |
| This journal is © The Royal Society of Chemistry 2022 |

