Sector coupling leading to low-carbon production of power and chemicals in China†
Yinan
Li
 a,
Lanyu
Li
bc,
Chuan
Zhang
d,
Yingru
Zhao
e and
Xiaonan
Wang
 *b
*b
aDepartment of Chemical and Biomolecular Engineering, National University of Singapore, Singapore 117585, Singapore
bDepartment of Chemical Engineering, Tsinghua University, Beijing 100084, China. E-mail: wangxiaonan@tsinghua.edu.cn
cSchool of Economics and Management, Tsinghua University, Beijing 100084, China
dInstitute of Energy, Peking University, Beijing 100871, China
eCollege of Energy, Xiamen University, Xiamen, China
First published on 30th March 2023
Abstract
The global surface temperature had increased by about 1 °C relative to the 1850–1900 period by the end of the 2010s, leaving limited safe operating space and thus a more stringent need to combat climate change to accomplish the Paris Agreement. As one of the world's major greenhouse gas emitters, China has reaffirmed its commitment to emission reduction with the announcement of the carbon neutrality goal in 2020. A fundamental transformation of the current energy structure is necessary, considering that the power sector is a major contributor to national emission. Moreover, China dominates the global methanol and ammonia markets. The nexus between the electricity sector and chemical sector, represented by methanol and ammonia, is considered a promising direction for future decarbonization. This study investigates the cost-optimal transition pathway of the electricity-chemical nexus in China. A bi-level adaptive optimization framework consisting of an upper-level capacity expansion model and a lower-level annual operation model is developed. High-resolution results show that carbon neutrality can be achieved for the co-supply of electricity, methanol and ammonia in China by 2060 through a systematic shift towards combined deployment of low-carbon and negative emission technologies. Sector coupling significantly improves the effectiveness of the transition. The power sector decarbonizes chemical production via green hydrogen, reducing carbon intensities of methanol and ammonia from 3.5 kg CO2-eq kg−1 to 1.6 kg CO2-eq kg−1 and 4.8 kg CO2-eq kg−1 to 1.1 kg CO2-eq kg−1, respectively. Meanwhile, sector coupling accelerates technology learning by at most 4% in the capital cost of solar photovoltaics, increases renewable penetration by nearly 5% in primary electricity generation, and reduces the power curtailment rate to below 5% by 2060. Green methanol and ammonia, as well as power transmission, all play a role as energy carriers in the future energy system. While grid transmission contributes to balancing the spatially uneven distribution of renewable resources, the equivalent energy transmission via green chemicals complements the former leveraging its relatively light dependence on infrastructure and high flexibility in operation scheduling. According to the analysis of this study, an optimized inter-sectorial integration provides a feasible and promising roadmap to realize carbon neutrality in both the power and chemical sectors.
1 Introduction
In order to combat global warming, the Paris Agreement has aimed to keep the global temperature increase in this century well below 2 °C, and preferably at 1.5 °C, above pre-industrial levels.1 It was recently reported that compared to the 2 °C target, a global warming of 1.5 °C can significantly reduce the occurrence of extreme weather conditions and leave much milder impacts on ecosystems, oceans and humans.2 Despite the controversy over the exact definition of pre-industrial periods, the annual average global surface temperature in 2019 has already increased by 0.98 °C relative to the average temperature of 1951–1980, which is a time period clearly after the (First) Industrial Revolution.3 Furthermore, according to the Intergovernmental Panel on Climate Change (IPCC), the trend of increasing annual anthropogenic carbon dioxide (CO2) emissions has persisted in recent years.4 According to Friedlingstein et al.,5 China has been the world's largest CO2 emitter since 2006 and currently it contributes to over one quarter of the world's total annual anthropogenic CO2 in terms of territorial emissions. With the most recent announcement at the 75th United Nations General Assembly (UNGA) held in September 2020, China has reaffirmed its determination in fighting climate change and committed to peak carbon emission before 2030 and achieve carbon neutrality by 2060.6 A fundamental transformation of the country's current coal-dominated energy structure is therefore needed.Depending on various data sources, the power sector can constitute from 38% (ref. 7) to 51% (ref. 8) of China's national total CO2 emission in 2018. Also, it is predicted by the State Grid that the electricity demand in China would continue with its current fast growth rate until 2035 and maintain a high level towards 2060,9 highlighting the need to investigate the future development of China's power sector. Besides the anticipated technology transition in electricity generation, the chemical industry also needs to be decarbonized, which is especially relevant to China considering its dominance in global methanol and ammonia markets, currently being the world's largest producers of both chemicals.10,11 The near-term demands of methanol and ammonia in China are expected to increase at a constant rate12 and stabilize at the current value,13 respectively, while given the potential of both chemicals as liquid energy carriers,14,15 their future demands are unlikely to vanish in the long term, either.
However, due to the lack of oil and gas reserves, a heavy reliance on coal as the raw material for chemical synthesis is currently witnessed in China,16 leading to even higher carbon intensity than by other fossil-based processes.17 “Green” hydrogen (H2), referring to H2 produced from renewable resources (e.g., via water electrolysis), is believed to play an important role in the future decarbonization of the chemical industry,18 thus providing opportunities for integrating the chemical sector with the aforementioned power sector to form the structure of the electricity-chemical nexus.19
2 Efforts in energy and chemical system modeling and their coupling
The future planning of energy transition at a national scale has been intensively investigated with energy systems models (ESMs) in the literature.20 Typical ESM tools include the TIMES model21 by the International Energy Agency (IEA), the NEMS model22 by the U.S. Energy Information Administration (EIA) and the PRIMES model23 widely used in Europe. Specifically for China, Cheng et al.24 developed a multi-year, multi-region optimization model at annual temporal resolution, mainly aiming to tackle the spatially mismatched distribution of resources and demands in China. Similar studies include that by Guo et al.25 with a special focus on transmission planning and their subsequent work26 with seasonal temporal resolution on load dispatch. Li, Liu and Li27,28 expanded the scope of energy demand from power to also include coal, oil, natural gas, heat and hydrogen at monthly resolution. Meanwhile an increasing number of publications, e.g., our previous work29 and Song et al.,30 explicitly considered China's 2060 carbon neutrality target in energy planning after its announcement in late 2020. However, as revealed by Chang et al.,20 a common problem with the above models is the low temporal resolution involved for demand satisfaction, especially when it comes to electricity, which can only be stored with specialized energy storage technologies at a relatively high cost.31 In this regard, He et al.32 applied the SWITCH model33 to China's context with finer spatial and temporal resolutions considering hourly generation and load profiles at a provincial scale, but relatively low investment frequency and a simple unit commitment model for flexible power generators were used in the work. Yang et al.34 integrated the power and heat sectors in China to study renewable energy development while Chen et al.35 further incorporated flexible electric vehicles (EVs) and hydrogen demands with high resolution modeling; however, single-year planning is adopted in both models. The cost development of existing and emerging technologies in future energy systems, so-called technology learning, can be considered exogenously or endogenously in energy system models. Exogenous consideration of technology learning implies a cost reduction independent of the deployment level within the model. Endogenous learning correctly accounts for cost reduction by deployment but can cause run-away effects, where a particular technology becomes dominant as it moves down the learning curve. The ESO-XEL36 model, for example, considered endogenous learning while constraining technology deployment rates to avoid distorted capacity expansion decisions. In the basic TIMES model,21 exogenous technology costs were to be provided while in one of the model extensions, endogenous technology learning was enabled and the approach of either constraining the speed of capacity expansion or supplying future cost trajectories exogenously with trial-and-error was suggested to prevent massive initial investments. The ESONE model is considered a spatio-temporal capacity expansion and unit commitment model for the power and EV systems.37 Xiao et al.38 incorporated technology learning of wind and solar generation in China into the future planning of the power sector, but only at annual temporal resolution.The decarbonization of the chemical sector has also been studied in the literature, but typically new technologies are investigated without discussing the broader context of the national energy transition. For example, sustainability footprints of a variety of technology routes for petrochemical production were evaluated with planetary boundaries by Galán-Martín et al.39 while special focus was given to the low-carbon process design of methanol40 and ammonia41 synthesis in subsequent studies. Taking into account China's dominant role in the methanol market and favorable national policies for future development of methanol vehicles,42,43 the feasibility of forming a low-carbon “methanol economy” in China was analyzed in our previous work.44 Yao et al.45 conducted a well-to-wheel comparison between different fossil-based methanol fuel production methods while Chen et al.46 studied the economic and environmental performance of integrating solar energy into methanol production in China. The future demand for ammonia in China is predicted to be stable. The coal-to-ammonia process currently results in almost twice the amount of CO2 emissions compared to the coal-to-methanol process47 in China. Given the high technology maturity of the Haber–Bosch process which still produces over 90% of the ammonia worldwide,48 significant emission reduction can be expected if conventional fossil-based H2 production is substituted with renewable powered alternatives.49,50
Sector integration, especially between the power and industrial sectors, has great potential for facilitating the national energy transition towards carbon neutrality. However, existing ESM tools e.g., PRIMES and NEMS only model the chemical sector as a type of energy demand without detailed consideration of possible technology shifts within the chemical industry. The benefits of sector coupling via hydrogen were illustrated by He et al.51 with a case study of the U.S. Northeast region in 2050, but a full trajectory of such a transition was not developed. Song et al.30 and Chen et al.35 also included hydrogen in power system planning, but hydrogen demand was specified exogenously.
Overall, this work at hand applies the concept of an electricity-chemical nexus to study the most cost-effective transition pathway towards a carbon-neutral simultaneous supply of electricity, methanol and ammonia in China by the target year of 2060. High spatial and temporal resolution results are obtained through a bi-level optimization framework, which also adapts to future cost changes due to technology learning. Synergies between the power and chemical sectors during the transition are analyzed with a special emphasis on the future role of green methanol and ammonia as liquid energy carriers.
3 Bi-level optimization framework for energy transition planning
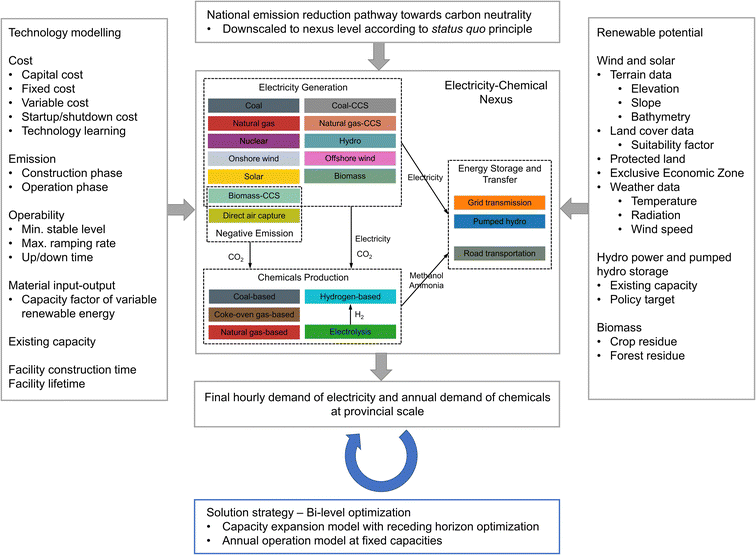
In order to study the most cost-effective transition pathway of China's power and chemical sectors towards carbon neutrality as well as the benefit of potential inter-sectorial integration, a nexus optimization framework is developed as shown in Fig. 1. In this work, electricity can be generated with flexibility from dispatchable thermal power plants including coal, natural gas and biomass, with or without integrated carbon capture and storage (CCS) facilities. According to China's current electricity technology mix,52 nuclear power is also involved to provide baseload while hydro, onshore wind, offshore wind and solar photovoltaic (PV) generation are considered the major variable renewable energy sources (VREs). The monthly variation in hydro power is obtained from historical data53 while the hourly capacity factors of wind and solar electricity are calculated with high-resolution weather data.54,55 Pumped hydro technology is included as well to provide supply side energy storage capacity for better matching hourly grid demand profiles reported by the State Grid.56 For the chemical sector, methanol and ammonia are not only produced from conventional fossil-based processes with coal, coke-oven gas and natural gas as feedstocks, but also directly synthesized from hydrogen supplied via flexibly operated water electrolysis connected to the power sector. Inter-provincial grid transmission of electricity and road transport of chemicals are also allowed between adjacent provinces to combat the problem of spatially uneven distribution of demands and resources in China. The current provincial demands of electricity and chemicals are collected from statistical yearbooks52 and first-hand surveys,29,44 respectively, while the future values are obtained from authoritative forecasts.9,12,13 Despite the significant efforts in predicting future demands in the aforementioned sources, some underlying assumptions could remain hard to verify. Therefore, a sensitivity analysis study on the nexus' transition pathway with respect to future electricity and chemical demands is conducted at the end of this work. Concretely, in the base case analysis of Section 4–6, future demands are projected based on current national policies and business-as-usual downstream (i.e., external to the nexus) consumption of relevant products. Considering the possible large-scale penetration of electricity into unconventional/emerging applications, e.g., electric vehicles and heating, a new scenario of accelerated electrification9 is included in the sensitivity analysis of Section 7. Currently, demand for methanol is mainly driven by conventional downstream products such as acetic acid, methyl tert-butyl ether and formaldehyde, as well as plastics via the methanol-to-olefins process, while that for ammonia is primarily attributed to nitrogen fertilizer synthesis.16,57,58 Taking into account the possibility of enhancing plastic recycling and increasing fertilizer efficiency in China, a new scenario of reduced chemical demand is modeled in which a 20% decrease in long-term methanol and ammonia demands from baseline projections is anticipated in accordance with the average value of various sources.16,57,58In this work, the national emission reduction pathway of China towards carbon neutrality is adopted from ref. 59 and subsequently downscaled proportionally to the electricity-chemical nexus according to the status quo principle.60 Concretely, greenhouse gas (GHG) emission targets at the national level are multiplied by the current share of emissions induced by China's power and chemical sectors in national total GHG emissions to obtain the corresponding targets at the nexus level. Life cycle inventories (LCIs) are considered with all GHG emissions converted to CO2-eq according to the IPCC 2013 100 year global warming potential (GWP-100a) published in ref. 61. For each technology, detailed data on direct inputs from the technosphere (i.e., intermediate exchanges) and outputs to the environment (i.e., elementary exchanges) that occurred in construction and operation phases are collected and/or mapped to the ecoinvent database62 as an intermediate to facilitate subsequent LCI computation. It is worth mentioning that a variety of impact assessment methods not limited to GWP-100a can be applied within the general methodology framework shown in Fig. 1, even including user-defined characterization factors such as planetary boundary analysis.29,44,63
In order to tackle the modelling complexity of both annual planning of new capacities over the entire horizon from now to 2060 and hourly scheduling of flexibly operable facilities during representative days of a year, a bi-level optimization framework is developed in this work. Given the relatively long construction time and life span of energy infrastructure, a future horizon over multiple years has to be considered to avoid short-sightedness in capacity expansion planning.20 On the other hand, optimization at high spatial and temporal resolution is desirable to reduce modelling error in operation scheduling, especially when VREs are heavily involved.64 A single model to solve both problems simultaneously would soon become intractable with scale due to the exploding number of variables, and a hierarchical structure of bi-level optimization is thus motivated. On the upper level, the capacity expansion model is solved with receding horizon optimization. During each planning horizon of 20 years, net present cost consisting of capital, fixed, variable and startup/shutdown costs discounted to the starting year is minimized with decision variables covering both construction and operation phases of various technologies. For computational tractability, coarser temporal resolution over a smaller number of representative days is used to model facility operation and product demands are satisfied with safety margins for compensation. The time increment for the upper-level model is set at 5 years, i.e., only the capacity expansion results over the first 5 years of a planning horizon are executed and the model is re-run from the sixth year onwards. With such a receding horizon formulation, the model can be updated and thus adaptive to various new data across iterations. In this work, technology learning curves are included to estimate the future capital expenditures of emerging technologies. After each iteration, the cumulative installation of a technology is updated with its capacity expansion decision during the first 5 years of the planning horizon and its capital and fixed costs for the next iteration can thus be calculated with the corresponding technology learning rate. Also, with high spatial resolution weather data, the capacity factors of wind and solar generation can differ for different locations within the same province. After each iteration, heuristics are applied towards wind and solar site selection, e.g., locations with higher annual average capacity factors are more favorable for new installations due to their lower levelized cost of electricity, and the provincial capacity factors of existing wind and solar facilities for the next iteration are refined by averaging over only the selected locations in that province.
After solving the upper-level capacity expansion model with the receding horizon optimization technique, the complete set of construction decisions for the entire time period until 2060 is passed to the lower-level annual operation model. Together with construction time and plant lifetime data, the utilizable capacities of different technologies in all years can be calculated, serving as capacity constraints in the lower-level model, which is run on a yearly basis and only optimizes over technology dispatch to reach the minimum annual operation cost. Since capacity expansion and operation are decoupled in the lower-level model, decision variables in the operation phase can be defined with greater temporal resolution over a larger number of representative days, thus achieving higher accuracy in the scheduling of facilities with operational flexibility. Apart from the treatment of construction related costs as determined in the lower-level model, construction emissions due to capacity expansion also need to be subtracted from annual total emission targets and only the remaining values are used as emission constraints for the operation phase. With the aforementioned formulation and solution strategy of bi-level optimization models, detailed mathematical equations are presented in ESI Section 1† while relevant results on China's transition pathway of the electricity-chemical nexus as well as the potential benefits of such sector coupling are discussed in the following sections.
4 Transition pathway of the electricity-chemical nexus in China towards carbon neutrality
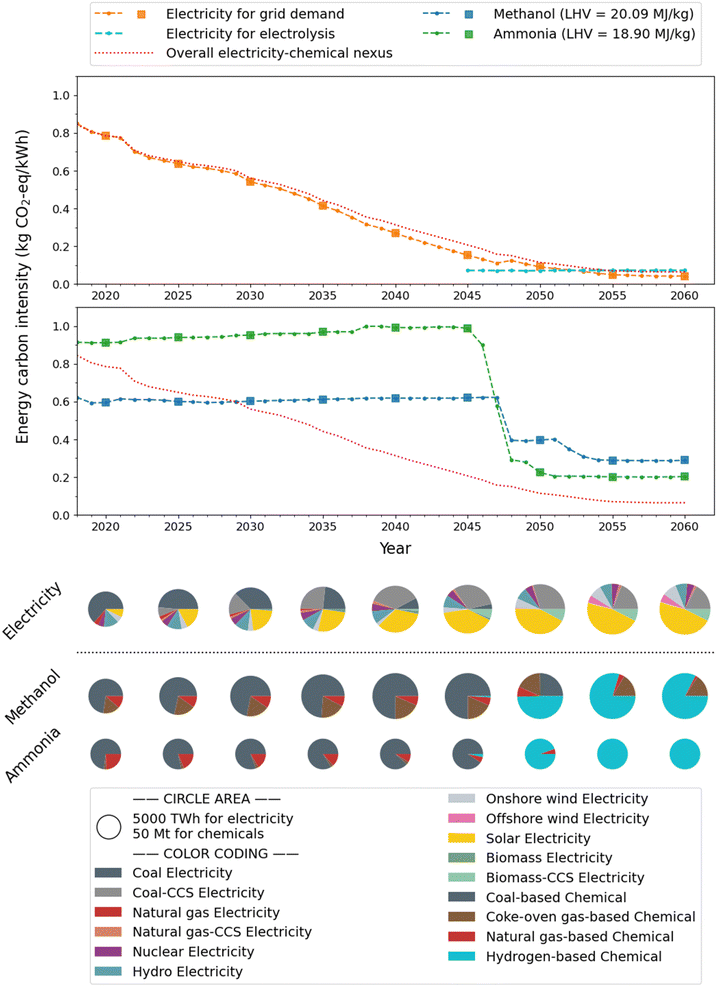
To study the resulting cost optimal transformation pathway of each sector within the electricity-chemical nexus, the life cycle carbon intensities measured in CO2-eq of final electricity, methanol and ammonia demands are plotted in Fig. 2 together with the production technology mixes in selected years. Note that in the calculation of carbon footprints (top part of Fig. 2), the GHG emissions induced by power consumed in water electrolysis are allocated to final chemical products in accordance with the life cycle approach.65 The electricity technology mixes (bottom part of Fig. 2) are plotted based on overall power generation covering both intermediate consumption and final grid demand to emphasize inter-sectorial integration under the nexus structure. The average carbon intensities of the chemical sector and the electricity-chemical nexus are measured in kg CO2-eq kW−1 h−1 with methanol and ammonia demands converted to energy units according to their respective lower heating values (LHVs).66Two distinct phases of decarbonization can be observed in Fig. 2 when the power and chemical sectors are co-optimized towards carbon neutrality, illustrating the phenomenon of burden shifting. In the first phase from now until 2045, the production mixes and carbon intensities of methanol and ammonia remain almost unchanged at the current levels and it is the fast decarbonization of the electricity sector that should be emphasized and drives the overall decrease in carbon intensity of both sectors. Subsequently, with the increasing gap between grid electricity (orange dashed line) and nexus (red dotted line) carbon intensities, the bottleneck of decarbonization gradually shifts to the chemical sector and the inter-sectorial integration eventually forms through green hydrogen production from water electrolysis when the electricity sector is sufficiently decarbonized around 2045. In the second phase of nexus decarbonization from 2045 to 2060, high shares of renewable energy in electricity mixes guarantee that a sufficient amount of low-carbon power can be supplied to electrolysis processes, which also provides opportunities to fully exploit the operational flexibility of electrolyzers as detailed in Section 5 and 6. Thus, a clear phase transition from conventional fossil-based production methods to their green hydrogen-based counterparts can be observed in the chemical sector after 2045, resulting in significant drops in carbon intensities of methanol and ammonia. Despite the sharp transition observed in Fig. 2, it is worth mentioning that constraints on the maximum rate of capacity expansion derived from historical data44 are enforced in the upper-level model as detailed in ESI Section 1,† and optimization ensures that sufficient green chemical plants are constructed before such a phase transition. Given the time-varying generation of dispatchable thermal power and VREs, the carbon intensities of electricity are different across hours. Therefore, the carbon intensities of power supply during the operation hours of electrolyzers can be extracted and are shown by the cyan dashed line after 2045 in Fig. 2. Since electrolysis is barely adopted until the second phase of energy transition, the cyan line is not plotted for previous years. It is interesting to see that despite the continued decarbonization of the electricity sector after 2045, the carbon intensity of electricity for electrolysis does not change across years, indicating that the scheduling of electrolysis is relatively picky for certain hours of the day when there is an excess of low-carbon electricity.
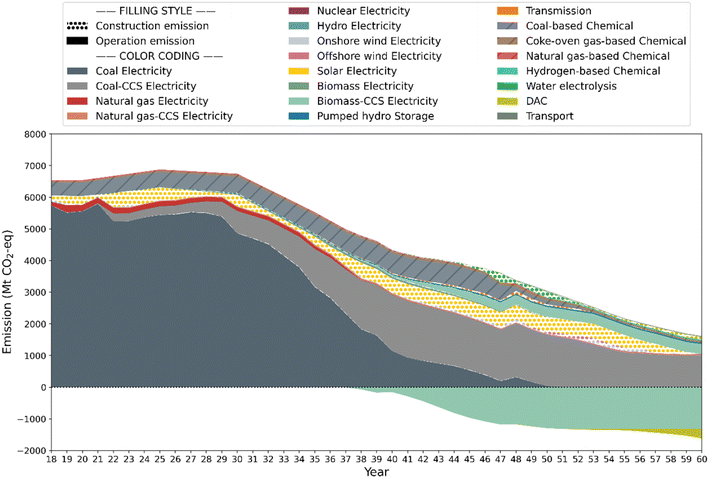
The corresponding GHG emission pathway of the electricity-chemical nexus from 2018 to 2060 is shown in Fig. 3. Despite that not all technologies' GHG emissions are clearly visible in Fig. 3, it is worth emphasizing that all technologies shown in the legend are considered in the optimization model and technology mixes at different points in time can be referred to in Fig. 2 above. Also, to prevent double-counting, unlike the treatment of carbon intensity, all electricity-related emissions are accounted for by power sector technologies and thus excluded from those of green chemical production and water electrolysis as shown in Fig. 3.
From Fig. 3, a continued decrease in GHG emissions in China's electricity and chemical sectors towards carbon neutrality can be observed after an initial increase to reach the peak before 2030. A reduction in nexus GHG emissions of almost 40% from the peak value is achieved in 10 years before the large-scale deployment of negative emission technologies (NETs) around 2040, while another 40% drop is realized in 20 years thereafter. By 2060, the remaining positive GHG emissions are offset exactly by negative CO2 emissions to achieve the net-zero target. As shown in Fig. 3, emissions that occurred in construction and operation phases are filled with colored dots and solid colors, respectively. As can be seen, for fuel-based electricity technologies, their operation emissions constitute the vast majority of LCIs while for intermittent renewable generation such as hydro, wind and solar power, almost all LCIs happen in the construction phase with negligible emissions during the operation phase observed. For the chemical sector, emissions are shaded with additional slanted lines in Fig. 3 for distinction and it can be seen that coal-based production remains the main contributor of GHG emissions until its future replacement by a hydrogen-based alternative. In order to facilitate such technology transition, a large number of water electrolyzers need to be built to supply green hydrogen with the corresponding emissions mainly observed from 2045 to 2055 as shown in Fig. 3. Besides the large-scale adoption of biomass generation integrated with CCS after 2040, the deployment of direct air capture (DAC) as another type of NET can also be gradually witnessed after 2050.
To summarize, the chemical sector can benefit from the power sector in forming an electricity-chemical nexus in the following two aspects. Firstly, considering the current high cost of electrolysis, technology shift in the chemical sector can be postponed until 2045 when the cost of electrolysis is expected to be significantly reduced due to future technological advancements.67 Secondly, the future electricity sector can supply enough low carbon energy sources for water electrolysis, thus facilitating deep decarbonization of the chemical sector through transformation into hydrogen-based processes. Besides the aforementioned benefits received by the chemical sector, the proposed nexus structure can also contribute to power sector's development as discussed in subsequent contents.
5 Enhanced technology learning and renewable penetration from sector coupling
Among the various power sector technologies considered in this work, coal, natural gas and nuclear generation are assumed to be mature. The technology learning rates of technologies with CCS integration are adopted from Heuberger et al.36 while those of renewable energy sources are obtained from the IEA.8 In order to study the effect of integrating the chemical sector with power sector planning, a reference scenario of the power sector alone optimized towards carbon neutrality is constructed with results shown in Fig. 4 for comparison.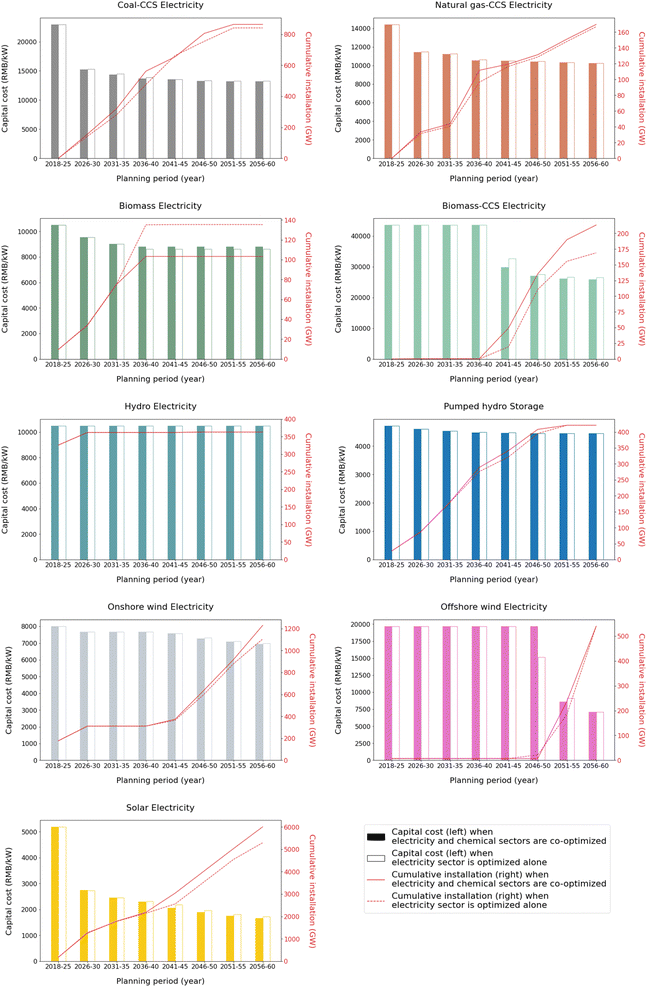 | ||
| Fig. 4 Comparison of power sector technology learning between electricity-chemical nexus and power sector standalone scenarios. | ||
From Fig. 4, it can be seen that technology learning of coal-CCS and natural gas-CCS generation is accelerated in the early years for the nexus scenario as compared to the power sector standalone scenario, which can be explained by the burden shifting effect from the chemical sector to the power sector in the first phase of nexus decarbonization until 2045. For biomass-based generation, since more sectors are covered in the nexus scenario to achieve carbon neutrality, the negative emission biomass-CCS technology is adopted on a larger scale while biomass power without CCS is better developed in the reference scenario. The developments for hydro-related technologies are almost identical under both scenarios due to the very low carbon intensity of hydro power and the unique supply side storage capability provided by pumped hydro storage. For wind and solar generation, technology learning progress is accelerated for the nexus scenario in later years due to the additional energy requirement from the chemical sector for green hydrogen production, as well as the more stringent emission constraint for the entire nexus to reach carbon neutrality. In particular, the capital cost of solar PV is decreased to 1658 RMB per kW and 1726 RMB per kW by 2060 in the electricity-chemical nexus and power sector alone scenarios, respectively, attributing a further cost reduction of 4% to accelerated technology learning driven by green chemical production. Regarding the seemingly abrupt decrease in capital cost as shown in Fig. 4, it is due to the fact that cumulative effects over 5 years are plotted in accordance with the frequency of running an upper-level model, which can be very significant for emerging technologies in China as shown by historical records.52 Similar to the chemical sector, growth rate limits are considered in capacity expansion optimization for the power sector as detailed in ESI Section 1.†
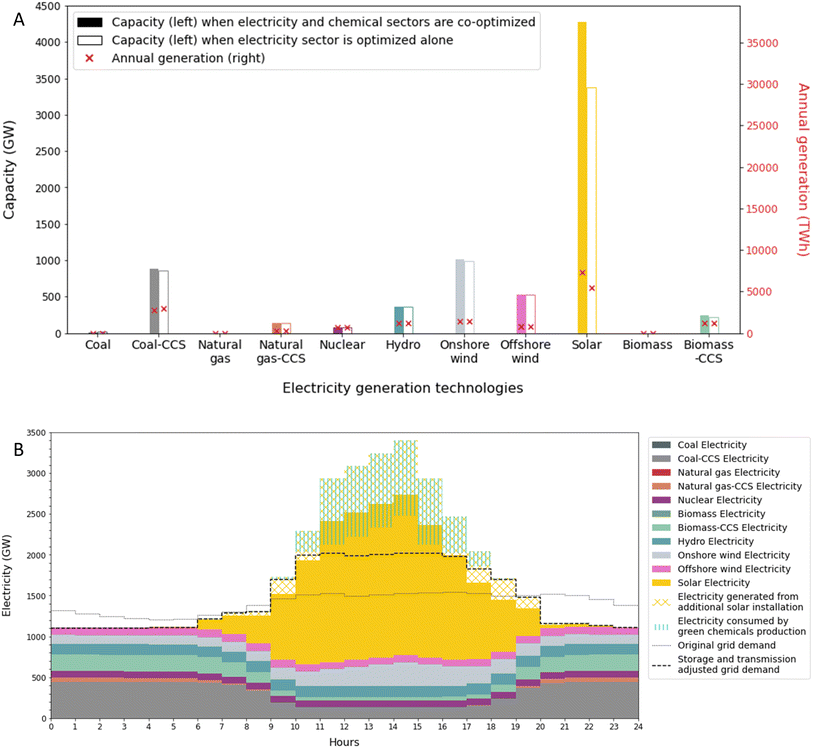
From the previous discussion, it can be seen that with the proposed nexus structure, a higher level of renewable penetration can be achieved in China's future energy system, which is also evidenced by the substantially higher solar capacity and annual generation by 2060 under the nexus scenario as compared to the power sector optimized alone scenario shown in Fig. 5(A).
The average day hourly dispatch profile shown in Fig. 5(B) is obtained by summing up the typical day technology operation profiles of all provinces, each averaged over 12 months of a year. The electricity generated by solar power is separated into two portions with the additional generation due to increased capacity under the nexus scenario as shown in Fig. 5(A) shaded with yellow cross lines. The actual power consumption profile of green chemical production is shaded with cyan vertical lines. Despite that total generation from additional solar installation roughly equals total consumption by green chemicals, their hourly profiles do not match as shown in Fig. 5(B), highlighting the contribution of operational flexibility from the chemical sector. In particular, more power is consumed during peak hours of solar generation while less consumption is observed during non-peak hours. As a result, the otherwise-would-be-curtailed generation from existing facilities is partially consumed during peak hours, thus mitigating the problem of renewable curtailment. Meanwhile, more solar power is “pushed” into the grid to satisfy final electricity demand with the additional installation during non-peak hours, further increasing the level of renewable penetration in the power grid. Concretely, the annual generation of coal-CCS technology in 2060 is reduced by about 10% from 3000 TW h in the power sector standalone scenario to 2700 TW h in the nexus scenario, as shown in Fig. 5(A). Therefore, through the integration of the chemical sector with the power sector, the benefit of increasing the share of renewable energy can be realized not only in the overall electricity generation mix, but also in the final grid demand supplied to other sectors outside the electricity-chemical nexus.
6 Role of green methanol and ammonia as temporal and spatial energy carriers
Annual generation and curtailment of variable renewable energy sources including hydro, onshore wind, offshore wind and solar power along with the transformation of the electricity-chemical nexus towards carbon neutrality are shown in Fig. 6. The highest renewable curtailment rate of nearly 20% is observed around 2045 just before the large-scale deployment of green chemical production. Thereafter, with the flexible operation of electrolysis that can be optimally scheduled only during peak hours of renewable generation as illustrated in Fig. 5(B), the problem of curtailed electricity can be significantly mitigated even with the continued increase in VRE deployment and stagnant grid demand after 2045. Finally, the curtailment rate falls below 5% by 2060 as shown in Fig. 6.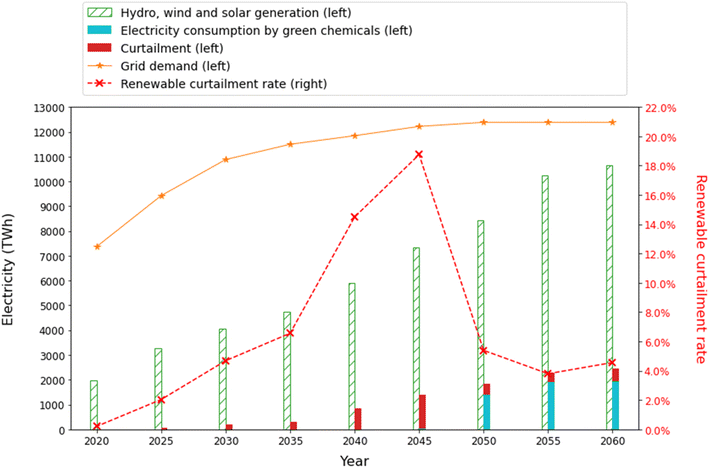 | ||
| Fig. 6 Annual renewable generation, intermediate consumption and curtailment under the electricity-chemical nexus. | ||
Besides the intra-day intermittency of VRE generation as previously shown in Fig. 5(B), the variation in resource availability can also be observed across longer time horizons. Through the formation of an electricity-chemical nexus, short term fluctuation in VRE generation is mainly handled with flexible operation of electrolyzers at an hourly scale while the mitigation of cross seasonal variation in VRE availability leverages the role of methanol and ammonia as energy carriers for long term storage. As shown in Fig. 7, the monthly total electricity generation from various technologies and consumption for different purposes are compared between two years along the future development of the electricity-chemical nexus before (2045) and after (2060) the large-scale production of green chemicals.
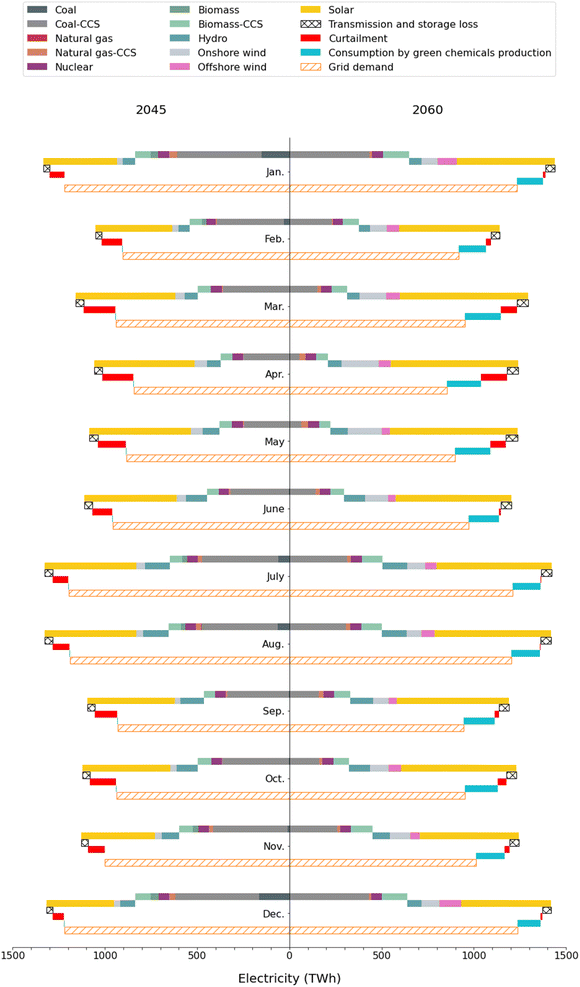 | ||
| Fig. 7 Comparison of power sector monthly operation under the electricity-chemical nexus between 2045 and 2060. | ||
As can be seen, grid demand remains almost stable from 2045 to 2060 while the deployment of VRE significantly increases due to the more stringent emission constraint and additional energy requirement of the chemical sector in later years. However, the total amount of curtailed power decreases in most months of 2060 as compared to 2045 due to the integration of green chemical production, resulting in a substantially lowered renewable curtailment rate. Given the relative ease and safety of long term storage for methanol and ammonia,14,15 their potential as future cross seasonal renewable energy carriers is exploited in the nexus optimization model by allowing flexible production schedules over different months and only requiring their demands to be satisfied on an annual basis. Concretely, it can be seen from Fig. 7 that more renewable generation is available during spring and summer than during autumn and winter. However, due to the significantly higher grid demands in summer and winter, more fossil-based power is actually generated in those months. Thus, more curtailment can be observed in transition seasons in 2045, resulting in more green chemical production scheduled during spring and autumn in 2060.
Besides the future usage of methanol and ammonia as temporal energy carriers for long term storage, their contribution to the nexus can also be realized from a spatial aspect through long distance transport of green chemicals across provinces.
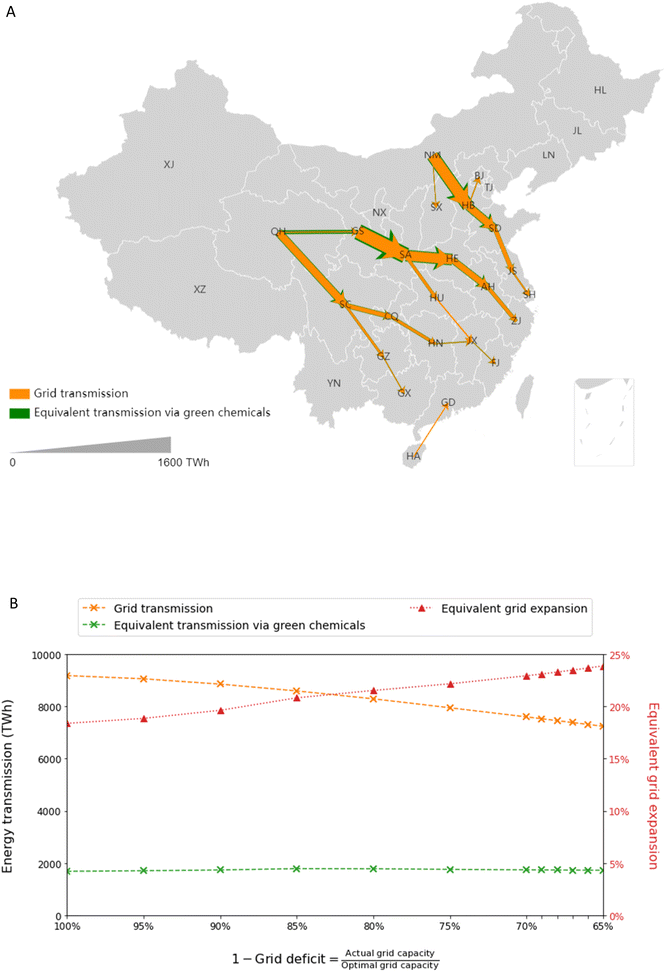
In China's future development of the electricity-chemical nexus dominated by renewable energy sources, the issue of spatial mismatch between demand centers in southeastern provinces and regions with abundant renewable resources, e.g., northern and northwestern provinces for wind and solar and southern provinces for hydro energy, has to be resolved.44 Inter-provincial electricity transmission through the power grid would play an increasingly important role in that aspect as illustrated in Fig. 8(A) by 2060. Meanwhile, as shown in Fig. 2, the carbon intensity of electricity consumed for green chemical production can be as low as 0.072 kg CO2-eq kW−1 h−1, which is slightly below that of solar electricity. Therefore, a significant amount of renewable energy is also converted into green methanol and ammonia through inter-sectorial integration and equivalently gets transmitted together with the inter-provincial transport of those energy carriers. As a result, future energy transmission can happen not only via electricity through the power grid, but also via green chemicals outside the grid, thus expanding the overall transmission capacity of the nexus. In particular, with the proposed nexus structure in 2060, about 9200 TW h electricity is transmitted through the grid while another 1700 TW h of clean energy is transmitted via green chemicals, resulting in an equivalent grid expansion of 18.4% as shown in Fig. 8(A).
In the current model, construction of new generation, storage and transmission facilities as well as their operation in the power sector are co-optimized together with methanol and ammonia production and transport. Therefore, the resulting grid capacity should always remain near optimal in terms of minimal net present cost. However, transmission planning in the real world can be nonideal and far from optimal. For example, curtailment of hydro68 and wind/solar69 power were observed in South and Northwest China, respectively, in recent years due to insufficient transmission capacities, while existing ultra high voltage direct current (UHV-DC) lines could also suffer from low utilization rates due to lack of negotiation and supporting facilities.70 To study the potential of green chemicals in tackling the problem of stagnation and saturation in the planning and construction of transmission corridors out of future energy hubs, a sensitivity analysis is conducted as shown in Fig. 8(B) where a deficit ratio is applied to the grid capacity of all inter-provincial transmission lines under the electricity-chemical nexus in 2060. A maximum deficit rate of 35% is used as the threshold below which the annual operation model returns no solution. As seen, if grid capacity was constrained, the amount of energy transmitted via the power grid would drop significantly while that transported via green chemicals could remain almost unchanged, even with very slight increments due to the substitution of coke-oven gas-based methanol production (see Fig. 2) by the hydrogen alternative. As a result, the ratio of equivalent grid expansion could increase from the original 18% to almost 24% at a grid deficit rate of 35%, further emphasizing the role of green chemicals as spatial energy carriers under insufficient grid transmission capacities.
7 Sensitivity of the transition pathway to future demands
As described in Section 3, new scenarios of incremental and decremental deviations in future electricity and chemical demands, respectively, from base case projections are established, which together with base case demands result in four different combinations. Similar to Fig. 2, the most cost-effective transition pathways of the electricity-chemical nexus under those new scenarios are obtained from the bi-level optimization model and plotted in Fig. 9 below. While the top and bottom subfigures correspond to base case electricity demand and accelerated electrification, respectively, the base case and reduced chemical demands are represented with dashed and solid lines, respectively, in each subplot.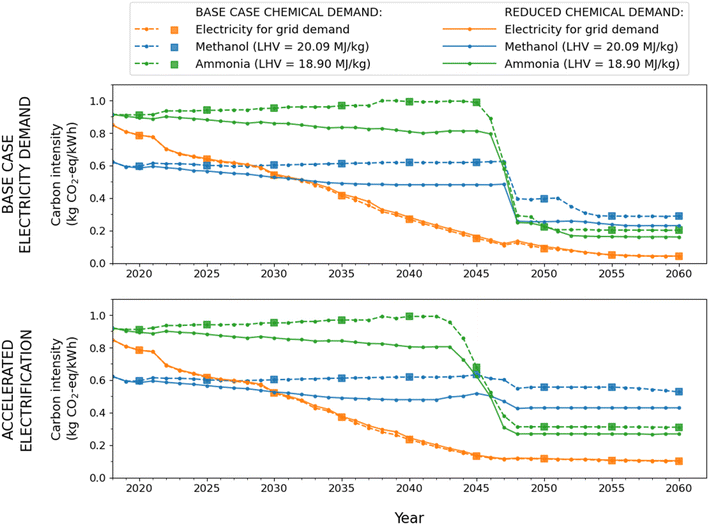 | ||
| Fig. 9 Optimal transition pathways of electricity-chemical nexus under different future demands for electricity and chemicals. | ||
As seen from Fig. 9, increased electricity demand leads to significant difficulty in the carbon neutral transition of the electricity-chemical nexus, especially for the second phase when unexploited renewable resources are limited. As a result, higher carbon intensities of about 0.1 kg CO2-eq kW−1 h−1 for grid electricity and 0.38–0.46 kg CO2-eq kW−1 h−1 for chemicals (depending on reduced or normal demands) by 2060 are witnessed under accelerated electrification scenarios, as compared to the values of 0.04 kg CO2-eq kW−1 h−1 grid and 0.21–0.26 kg CO2-eq kW−1 h−1 chemical demands for their base case counterparts. However, it is worth mentioning that the carbon footprint of electricity consumed in electrolysis remains at approximately 0.07 kg CO2-eq kW−1 h−1 for all scenarios, indicating that solar power continues to serve as the main energy source for green H2 as explained in Section 5. Regarding the chemical sector, lower demand benefits emission reduction, especially in the near-term when coal-based chemical production still dominates China's market and has to be expanded to satisfy increasing demands in the near future. Overall, despite the uncertainties in predicting future electricity and chemical demands, a distinct two-phase pattern before and after 2045, as detailed in Section 4, can still be observed in the transition of China's power and chemical sectors towards carbon neutrality.
8 Conclusion and future work
In conclusion, with the bi-level adaptive energy planning framework developed in this work, both capacity expansion and annual operation decisions are optimized at high resolution for the transition pathway of the electricity and chemicals sectors in China towards carbon neutrality by 2060. Significant decarbonization of the power sector in terms of both total GHG emissions and carbon intensity is first observed, while a clear phase transition from conventional fossil-based chemical production to hydrogen-based counterparts occurs only after 2045, when the cost of electrolysis is comparatively low and sufficient amount of renewable energy can be provided by the electricity sector. As compared to the reference scenario in which the power sector is optimized alone without considering the chemical sector, the proposed nexus structure accelerates technology learning of CCS-integrated and VRE generation as well as increases the level of renewable penetration in the final electricity mix. With the coupling of the power and chemical sectors after 2045, renewable curtailment is significantly reduced from nearly 20% to below 5%. While the operational flexibility of water electrolyzers contributes to mitigating intra-day hourly fluctuations in VRE generation, the cross seasonal variation in resource availability can be tackled with monthly varying production rates of methanol and ammonia given their suitability for long-term storage. Furthermore, the spatially discrete modelling reveals how inter-provincial transport of green chemicals allows the transport of renewable energy outside the power grid as liquid energy carriers. This expands the total energy transmission capacity over long distances and mitigates the imbalanced regional distribution of demands and resources in China. Finally, considering the uncertainty in future electricity, methanol and ammonia demand values, a brief sensitivity analysis on the optimal transition pathways with respect to demand predictions is conducted. The results show that higher electricity demand adds barriers to the second phase of transition while lower chemical demand accelerates emission reduction in the first phase; however, the distinct two-phase structure of transition remains valid under different demand scenarios.Currently, this work optimizes the coupling only between the power and chemical sectors in China towards carbon neutrality, yet the findings are believed to provide valuable insights. Given China's current coal-dominated energy structure and poor reserve in natural gas, the two-phase transition pathway of this study indicates that a shift in the power sector towards renewable energy is of first priority in decarbonizing the nexus, which is reasonable since without low-carbon electricity, neither direct electrification nor electrolytic H2 can realize their full potential. In the future, other sectors could be incorporated to form a full-scale system-wide study on energy transition, especially in the long-term. Concretely, the strategy of electrification can be adopted to further extend the nexus structure over the heating and transport sectors via technologies such as electric heating and electric vehicles. Meanwhile, a future hydrogen economy, with methanol/ammonia as its carrier, can be envisioned. For example, hydrogen heating and direct reduced iron (DRI) via H2 contribute to emission reduction in the cement and steel industries, respectively, while hydrogen vehicles/ships can complement the decarbonization of transportation over long distances.
Author contributions
Y. L.: conceptualization, data curation, investigation, methodology, software, visualization, writing – original draft. L. L.: validation, writing – review & editing. C. Z.: validation, writing – review & editing. Y. Z.: validation, writing – review & editing. X. W.: funding acquisition, validation, supervision, writing – review & editing.Conflicts of interest
There are no conflicts of interest to declare.Acknowledgements
This work was supported by the Tsinghua University-Siemens Ltd., China Joint Research Program and the Tsinghua University Institute for Carbon Neutrality. We sincerely appreciate the helpful discussions and suggestions from Dr Clara Heuberger and Prof. Li Zheng on this work.References
- United Nations, Framework Convention on Climate Change (UNFCC), The Paris Agreement, https://unfccc.int/process-and-meetings/the-paris-agreement/the-paris-agreement, accessed 5 April 2020 Search PubMed.
- Intergovernmental Panel on Climate Change (IPCC), Global Warming of 1.5 oC, https://www.ipcc.ch/sr15/, accessed 5 April 2020 Search PubMed.
- NASA, Climate Change and Global Warming, Global Temperature, https://climate.nasa.gov/vital-signs/global-temperature/, accessed 5 April 2020 Search PubMed.
- Intergovernmental Panel on Climate Change (IPCC), AR5 Synthesis Report: Climate Change, 2014, https://www.ipcc.ch/report/ar5/syr/, accessed 5 April 2020 Search PubMed.
- P. Friedlingstein, M. O'Sullivan, M. W. Jones, R. M. Andrew, J. Hauck, A. Olsen, G. P. Peters, W. Peters, J. Pongratz, S. Sitch, C. Le Quéré, J. G. Canadell, P. Ciais, R. B. Jackson, S. Alin, L. E. O. C. Aragão, A. Arneth, V. Arora, N. R. Bates, M. Becker, A. Benoit-Cattin, H. C. Bittig, L. Bopp, S. Bultan, N. Chandra, F. Chevallier, L. P. Chini, W. Evans, L. Florentie, P. M. Forster, T. Gasser, M. Gehlen, D. Gilfillan, T. Gkritzalis, L. Gregor, N. Gruber, I. Harris, K. Hartung, V. Haverd, R. A. Houghton, T. Ilyina, A. K. Jain, E. Joetzjer, K. Kadono, E. Kato, V. Kitidis, J. I. Korsbakken, P. Landschützer, N. Lefèvre, A. Lenton, S. Lienert, Z. Liu, D. Lombardozzi, G. Marland, N. Metzl, D. R. Munro, J. E. M. S. Nabel, S. I. Nakaoka, Y. Niwa, K. O'Brien, T. Ono, P. I. Palmer, D. Pierrot, B. Poulter, L. Resplandy, E. Robertson, C. Rödenbeck, J. Schwinger, R. Séférian, I. Skjelvan, A. J. P. Smith, A. J. Sutton, T. Tanhua, P. P. Tans, H. Tian, B. Tilbrook, G. Van Der Werf, N. Vuichard, A. P. Walker, R. Wanninkhof, A. J. Watson, D. Willis, A. J. Wiltshire, W. Yuan, X. Yue and S. Zaehle, Earth Syst. Sci. Data, 2020, 12, 3269–3340 CrossRef
.
- M. Matt, Climate Change: China Aims for ‘carbon Neutrality by 2060’, https://www.bbc.com/news/science-environment-54256826, accessed 11 April 2021 Search PubMed.
-
National Bureau of Statistics Department of Energy Statistics, China Energy Statistical Yearbook, China Statistics Press, Beijing, 2020 Search PubMed
.
-
IEA, World Energy Outlook 2020, Paris, 2020 Search PubMed
.
- State Grid Energy Research Institute, China Energy and Electricity Outlook, https://news.bjx.com.cn/html/20201202/1119479.shtml, accessed 30 April 2021 Search PubMed.
- M. Alvarado, IHS Chem. Bull., 2016, 3, 10–11 Search PubMed
.
-
National Minerals Information Center USGS, Nitrogen Data Sheet - Mineral Commodity Summaries: Nitrogen (Fixed) - Ammonia, 2020 Search PubMed
.
-
Argus, Argus Global Methanol Annual, 2018 Search PubMed
.
- H. Yang, China Chem. Rep., 2020, 31, 10–12 CrossRef
.
- C. F. Shih, T. Zhang, J. Li and C. Bai, Joule, 2018, 2, 1925–1949 CrossRef CAS
.
- J. Guo and P. Chen, Chem, 2017, 3, 709–712 CAS
.
-
IEA, The Future of Petrochemicals, Paris, 2018 Search PubMed
.
- Q. Chen, M. Lv, Y. Gu, X. Yang, Z. Tang, Y. Sun and M. Jiang, Joule, 2018, 2, 607–620 CrossRef CAS
.
-
IEA, Energy Technology Perspectives 2020, Paris, 2020 Search PubMed
.
- S. Abate, G. Centi, P. Lanzafame and S. Perathoner, J. Energy Chem., 2015, 24, 535–547 CrossRef
.
- M. Chang, J. Z. Thellufsen, B. Zakeri, B. Pickering, S. Pfenninger, H. Lund and P. A. Østergaard, Appl. Energy, 2021, 290, 116731 CrossRef
.
- IEA, IEA-ETSAP Optimization Modeling Documentation, https://iea-etsap.org/index.php/documentation, accessed 21 May 2021 Search PubMed.
- EIA, Documentation of the National Energy Modeling System (NEMS) Modules, https://www.eia.gov/outlooks/aeo/nems/documentation/, accessed 21 May 2021 Search PubMed.
- E3 Modelling, PRIMES Manual, https://e3modelling.com/modelling-tools/primes/, accessed 21 May 2021 Search PubMed.
- R. Cheng, Z. Xu, P. Liu, Z. Wang, Z. Li and I. Jones, Appl. Energy, 2015, 137, 413–426 CrossRef
.
- Z. Guo, L. Ma, P. Liu, I. Jones and Z. Li, Energy, 2016, 116, 1348–1359 CrossRef
.
- Z. Guo, R. Cheng, Z. Xu, P. Liu, Z. Wang, Z. Li, I. Jones and Y. Sun, Appl. Energy, 2017, 185, 556–572 CrossRef
.
- T. Li, P. Liu and Z. Li, Renew. Sustain. Energy Rev., 2020, 134, 110159 CrossRef
.
- T. Li, P. Liu and Z. Li, Process, 2021, 9, 160 CrossRef CAS
.
- Y. Li, S. Lan, M. Ryberg, J. Pérez-Ramírez and X. Wang, iScience, 2021, 24, 102513 CrossRef CAS PubMed
.
- S. Song, T. Li, P. Liu and Z. Li, Energy, 2022, 238, 122037 CrossRef
.
- L. Li, P. Liu, Z. Li and X. Wang, Comput. Chem. Eng., 2018, 115, 213–225 CrossRef CAS
.
- G. He, A. P. Avrin, J. H. Nelson, J. Johnston, A. Mileva, J. Tian and D. M. Kammen, Environ. Sci. Technol., 2016, 50, 5467–5473 CrossRef CAS PubMed
.
- J. Johnston, R. Henriquez-Auba, B. Maluenda and M. Fripp, SoftwareX, 2019, 10, 100251 CrossRef
.
- Y. Yang, H. Zhang, W. Xiong, D. Zhang and X. Zhang, Environ. Impact Assess. Rev., 2018, 73, 142–151 CrossRef
.
- X. Chen, Y. Liu, Q. Wang, J. Lv, J. Wen, X. Chen, C. Kang, S. Cheng and M. B. McElroy, Joule, 2021, 5, 2715–2741 CrossRef CAS
.
- C. F. Heuberger, E. S. Rubin, I. Staffell, N. Shah and N. Mac Dowell, Appl. Energy, 2017, 204, 831–845 CrossRef
.
- C. F. Heuberger, P. K. Bains and N. Mac Dowell, Appl. Energy, 2020, 257, 113715 CrossRef
.
- J. Xiao, G. Li, L. Xie, S. Wang and L. Yu, Energy Pol., 2021, 150, 112150 CrossRef CAS
.
- Á. Galán-Martín, V. Tulus, I. Díaz, C. Pozo, J. Pérez-Ramírez and G. Guillén-Gosálbez, One Earth, 2021, 4, 565–583 CrossRef
.
- D. Vázquez and G. Guillén-Gosálbez, Chem. Eng. Sci., 2021, 246, 116891 CrossRef
.
- S. C. D'Angelo, S. Cobo, V. Tulus, A. Nabera, A. J. Martín, J. Pérez-Ramírez and G. Guillén-Gosálbez, ACS Sustain. Chem. Eng., 2021, 9, 9740–9749 CrossRef
.
-
K. Zhao, A Brief Review of China's Methanol Vehicle Pilot and Policy, 2019 Search PubMed
.
-
C. Li, M. Negnevitsky and X. Wang, in Energy Procedia, Elsevier Ltd, 2019, vol. 160, pp. 324–331 Search PubMed
.
- Y. Li, S. Lan, J. Pérez-Ramírez and X. Wang, Sustain. Energy Fuels, 2020, 4, 6141–6155 RSC
.
- Y. Yao, Y. Chang, R. Huang, L. Zhang and E. Masanet, J. Clean. Prod., 2018, 172, 1381–1390 CrossRef CAS
.
- Q. Chen, Y. Gu, Z. Tang and Y. Sun, Energy Convers. Manag., 2019, 187, 63–75 CrossRef CAS
.
- Y. Huang, Q. Yi, J. X. Kang, Y. G. Zhang, W. Y. Li, J. Feng and K. C. Xie, Appl. Energy, 2019, 254, 113684 CrossRef CAS
.
- L. Wang, M. Xia, H. Wang, K. Huang, C. Qian, C. T. Maravelias and G. A. Ozin, Joule, 2018, 2, 1055–1074 CrossRef CAS
.
- Y. Bicer, I. Dincer, C. Zamfirescu, G. Vezina and F. Raso, J. Clean. Prod., 2016, 135, 1379–1395 CrossRef CAS
.
- H. Zhang, L. Wang, J. Van herle, F. Maréchal and U. Desideri, Appl. Energy, 2020, 259, 114135 CrossRef CAS
.
- G. He, D. S. Mallapragada, A. Bose, C. F. Heuberger-Austin and E. Gençer, Energy Environ. Sci., 2021, 14, 4635–4646 RSC
.
-
CEPY, China Electric Power Yearbook, China Electric Power Press, Beijing, 2018 Search PubMed
.
- State Power, Monthly Electricity Production of Hydropower in China, https://www.ceicdata.com/ Search PubMed.
- J. He, K. Yang, W. Tang, H. Lu, J. Qin, Y. Chen and X. Li, Sci. Data, 2020, 71, 1–11 Search PubMed
.
- Global Modeling and Assimilation Office (GMAO), 2015 Search PubMed.
- National Development and Reform Commission, Typical Power Load Curves of Provincial Power Grids, http://www.gov.cn/xinwen/2019-12/30/content_5465088.htm, accessed 7 September 2022 Search PubMed.
-
Energy Transitions Commission, China 2050: A Fully Developed Rich Net-Zero Economy, 2019 Search PubMed
.
-
Rocky Mountain Institute, Transforming China's Chemicals Industry, 2022 Search PubMed
.
-
X. Zhang, in 12th International Conference on Applied Energy, 2020 Search PubMed
.
- M. W. Ryberg, M. Owsianiak, J. Clavreul, C. Mueller, S. Sim, H. King and M. Z. Hauschild, Sci. Total Environ., 2018, 634, 1406–1416 CrossRef CAS PubMed
.
-
G. Myhre, D. Shindell, F.-M. Bréon, W. Collins, J. Fuglestvedt, J. Huang, D. Koch, J.-F. Lamarque, D. Lee, B. Mendoza, T. Nakajima, A. Robock, G. Stephens, T. Takemura and H. Zhang, in Climate Change 2013: the Physical Science Basis. Contribution of Working Group I to the Fifth Assessment Report of the Intergovernmental
Panel on Climate Change, ed. T. F. Stocker, D. Qin, G.-K. Plattner, M. M. B. Tignor, S. K. Allen, J. Boschung, A. Nauels, Y. Xia, V. Bex and P. M. Midgley, Cambridge University Press, Cambridge, United Kingdom and New York, NY, USA, 2013 Search PubMed
.
- G. Wernet, C. Bauer, B. Steubing, J. Reinhard, E. Moreno-Ruiz and B. Weidema, Int. J. Life Cycle Assess., 2016, 21, 1218–1230 CrossRef
.
- M. W. Ryberg, M. Owsianiak, K. Richardson and M. Z. Hauschild, Ecol. Indicat., 2018, 88, 250–262 CrossRef
.
- H. Teichgraeber and A. R. Brandt, Renew. Sustain. Energy Rev., 2022, 157, 111984 CrossRef
.
-
H. S. Matthews, C. T. Hendrickson and D. Matthews, Life Cycle Assessment: Quantitative Approaches for Decisions that Matter, Open access textbook, 2014 Search PubMed
.
- Hydrogen Tools, Lower and Higher Heating Values of Fuels, https://h2tools.org/hyarc/calculator-tools/lower-and-higher-heating-values-fuels, accessed 24 April 2021 Search PubMed.
-
IEA, The Future of Hydrogen, Paris, 2019 Search PubMed
.
- Outlook Weekly, Curtailment of Hydropower Occurred in Sichuan over the Years, http://www.sc.sgcc.com.cn/html/main/col12/2017-01/17/20170117153111682681547_1.html, accessed 11 July 2022 Search PubMed.
- Science and Technology Daily, National Energy Administration Calling off New Projects in Provinces with Serious Wind Power Curtailment, http://www.xinhuanet.com//politics/2017-03/03/c_129500331.htm, accessed 11 July 2022 Search PubMed.
- China Energy News, Seven UHV DC Capacities Idle over 30%, http://energy.people.com.cn/n1/2020/1216/c71661-31968207.html, accessed 11 July 2022 Search PubMed.
Footnote |
| † Electronic supplementary information (ESI) available. See DOI: https://doi.org/10.1039/d2se01749k |
| This journal is © The Royal Society of Chemistry 2023 |

