 Open Access Article
Pairing-specific microstructure in depletion gels of bidisperse colloids
Rony A.
Waheibi
and
Lilian C.
Hsiao
 *
*
Department of Chemical and Biomolecular Engineering, North Carolina State University, 911 Partners Way, Raleigh, NC 27606, USA. E-mail: lilian_hsiao@ncsu.edu
First published on 5th November 2024
Abstract
We report the ensemble-averaged and pairing-specific network microstructure formed by short-range depletion attractions in hard sphere-like colloidal systems. Gelation is induced by adding polystyrene molecules at a fixed concentration to colloids with different colloid bidispersity ratios (α = 1, 0.72, and 0.60) across a range of volume fractions (0.10 ≤ ϕ ≤ 0.40). 3D confocal microscopy imaging combined with a scale-invariant feature transform algorithm show that monodisperse colloids pack more efficiently, whereas increasing the size disparity leads to looser, more disordered, and sub-isostatic packings. Categorizing the structures formed by small and large particles reveal that certain cluster configurations may be favored due to the complex interplay between the differences in particle surface areas and attractive potentials. These pairwise bonds assemble to affect the density of tetrahedral and poly-tetrahedral clusters in bidisperse systems. With the exception of non-percolating samples at ϕ = 0.10, increasing the gel volume fraction leads to an increase in the number of nearest neighbors. However, the internal density within each cluster decreases, possibly due to kinetic arrest from the deeper potential wells of tetrahedral clusters at low volume fractions in which vertices are primarily made out of larger particles.
1 Introduction
Colloidal gels consist of space-spanning networks of particles interacting with a net attractive potential. They are found in a variety of coatings, flow slurries, pharmaceutics, and biologics due to their viscoelastic and load-bearing properties.1–3 Structure–property relationships that connect the topology and dynamics of a gel to its fundamental building blocks is of scientific and industrial interest.4–7 Depending on the strength and range of the attraction, percolated networks and arrested dynamics arise from either reaction-limited or diffusion-limited cluster aggregation, where rigid isostatic clusters composed of particles with ≥6 nearest neighbors are responsible for much of the rheological phenomena.6–14 These findings are primarily based upon studies that use colloidal hard spheres with a monodisperse size distribution.15,16The prevalence of size polydispersity in most technological applications has led to an increasing number of studies that focus on the microstructure, dynamics, and rheology of colloidal materials prepared from bidisperse particles.17–22 It is now understood that bidisperse and polydisperse packings are almost always denser than that of monodisperse particles due to geometrical factors that change the jamming fraction.23–28 In bidisperse systems, changing the size ratio of the particles and the overall volume fraction produce pronounced effects on the colloidal phase behavior. Even in non-Brownian hard sphere suspensions, the viscosity decrease seen when small particles are added to large ones is due to an increase in the jamming fraction with an increasing size ratio.25 Incorporating attractive interactions between particles generate additional complexity in the free energy landscape because of the preferential contact between particles with the largest surface areas and the deepest potential wells.29–31 The resultant structural changes are further convoluted by the differing electrostatics for particles of different sizes. Research investigating varying ratios of these attractive and repulsive forces has revealed changes in the phase diagram behavior, percolation, and clustering.32–38 For instance, Pandey and Conrad found that increasing the ratio of small to large particles in a colloidal depletion gel reduces the particle displacement significantly, an effect that is exacerbated by confinement.18 Increasing the volume fraction of large particles softens gels but only when the density of large particles exceeds a critical value.19 This softening effect is attributed to large particles that change the effective range of the attraction, which consequently shifts the gel line.
Early theoretical work into the phase diagram of colloid–polymer mixtures began with insights into the demixing of colloid-rich and colloid-poor regions.39–41 Identification of spinodal decomposition as a mechanism towards transient gelation (originally predicted from polymers42) and thus non-equilibrium dense clusters was identified by Verhaegh et al. through small angle X-ray scattering.43 Subsequent attempts to characterize the resulting cluster size distributions used a second virial coefficient equation of state to model the cluster size distributions, where the gelation phase boundary obtained from experiments coincides with predictions from spinodal decomposition.44,45 These studies imply that under sufficient polymer concentration gels form by first demixing into colloid-rich and colloid-poor regions, followed by subsequent kinetic arrest of dense clusters. Evidence of such clusters are provided in several other investigations where confocal microscopy, computer simulations, and scattering techniques are used to extract a microstructural cluster correlation length.9,46–51 Contrary to earlier observations where the internal volume fraction of gel clusters is constant at ϕg ≈ 0.57 regardless of the overall volume fraction or attraction strength,44 Whitaker and coworkers find that stronger gels contain a larger number of clusters with lower ϕg that is representative of a looser local structure.9 Others have shown the importance of self-limiting structural rearrangements of particles to the kinetic arrest of gels above the spinodal line.52–55 The precise mechanism for how colloidal gels differ from glasses in their dynamic arrest, examined through the lens of localized tetrahedral-shaped clusters,54,56–59 remains an active area of research.
Bidisperse colloids can have a strong impact on the phase behavior of gels because they change the underlying cluster size distributions through favoring specific types of local order.22,60 Consider the elastic packing of a set of large and small particles in a dense cluster, where the size difference between particles impacts local packing. From the perspective of a small particle, the solid angle occupied by a large particle means that, on average, small particles will have less space for contacting neighbors, 〈zi〉, than vice versa, leading to an expectation of 〈zL〉 > 〈zavg〉 > 〈zs〉.61 The geometric variations in the local environment, in addition to the available surface area and excluded volume changes that gives rise to different attractive and repulsive forces in depletion interactions, cause bi- and polydisperse gels to assemble with a higher variability in the local microstructure.35,62–64 As the size disparity increases, small particles can also fit into the interstitial spaces of contacting large particles and lead to non-monotonic changes in the local energy landscape and cluster sizes.35,60,65,66
A full characterization of the cluster structure requires moving away from ensemble-averaged parameters such as the radial distribution function and 〈z〉 to metrics that more closely represent the cluster-level bond orientation and structural ordering. In this work, we suspend monodisperse and bidisperse colloids in a density and refractive index-matched solvent containing trace amounts of salt and a fixed concentration of non-adsorbing polymer. Care is taken to account for the swelling of particles in the solvent. While hydrodynamic interactions such as near- and far-field lubrication forces play a part in the phase behavior and in the gravitational sedimentation of depletion gels,67–71 here, we only consider the nature of mechanically rigid clusters within the colloidal network. The 3D microstructure of the gels is fully captured using confocal laser scanning microscopy and an image processing algorithm with proven accuracy in identifying the centroids of particles in contact with one another. Ensemble-averaged and pairing-specific structural quantities are used to determine the relative degree of disorder as a function of size ratio and overall volume fraction. We find that gels with a moderate size disparity appears to generate the most disordered structure, as seen from parameters that include the number density of tetrahedral and poly-tetrahedral clusters within mechanically rigid subunits.
2 Methods
2.1 Sample preparation
All reagents were purchased from Sigma-Aldrich and used without further purification unless otherwise specified. Poly(12-hydroxystearic acid) (PHSA)-stabilized poly(methyl methacrylate) (PMMA) colloids of different sizes were synthesized by varying the monomer-to-PHSA ratio (MMA/PHSA = 17.7 to 19.8 wt/wt%) using a free radical polymerization reaction described in Pradeep and Hsiao.72 The hydrophobic dyes Coumarin-6 (excitation wavelength λex = 457 nm, emission wavelength λem = 501 nm) and Nile Red (λex = 559 nm, λem = 635 nm) were added during the synthesis step to generate fluorescent colloids for two-channel imaging. The colloids were cleaned by centrifugation with hexane and stored dry until use.Monodisperse colloids were combined to generate bidisperse systems of different size ratios (α = aS/aL, aS = radius of smaller particles, aL = radius of larger particles) as listed in Table 1. Colloidal depletion gels with α = 0.60, 0.72, 1.00 were prepared by suspending PHSA-PMMA colloids (refractive index nPMMA = 1.49, density ρPMMA = 1.18 g cm−3) at volume fractions of ϕ = 0.10, 0.20, 0.30, 0.40 in a density- and refractive index-matched solvent containing 66![[thin space (1/6-em)]](https://www.rsc.org/images/entities/char_2009.gif) :
:![[thin space (1/6-em)]](https://www.rsc.org/images/entities/char_2009.gif) 34 vol% of cyclohexylbromide (nCHB = 1.50, ρCHB = 1.32 g cm−3) and cis-decalin (ndecalin = 1.48, ρdecalin = 0.90 g cm−3). Tetrabutyl ammonium chloride salt was added at a concentration of 1 μM to provide charge screening (zeta potential ζ < 0.01 V73). Linear polystyrene (PS) (number average molecular weight Mn = 900
34 vol% of cyclohexylbromide (nCHB = 1.50, ρCHB = 1.32 g cm−3) and cis-decalin (ndecalin = 1.48, ρdecalin = 0.90 g cm−3). Tetrabutyl ammonium chloride salt was added at a concentration of 1 μM to provide charge screening (zeta potential ζ < 0.01 V73). Linear polystyrene (PS) (number average molecular weight Mn = 900![[thin space (1/6-em)]](https://www.rsc.org/images/entities/char_2009.gif) 000 g mol−1, weight average molecular weight Mw = 1
000 g mol−1, weight average molecular weight Mw = 1![[thin space (1/6-em)]](https://www.rsc.org/images/entities/char_2009.gif) 047
047![[thin space (1/6-em)]](https://www.rsc.org/images/entities/char_2009.gif) 500 g mol−1, radius of gyration Rg = 41 nm, c* = Mw/4π3/2Rg(0)3NAΨ* = 4.72 g L−1 where Rg(0) is the zero-concentration radius of gyration measured from static light scattering, NA is Avogadro's number, and Ψ* ≈ 0.24 is a correction factor for linear polymer74–76) was added as a non-adsorbing depletant to induce gelation. The concentration of PS, c, varies with colloidal volume fraction from c/c* = 1.02 to 1.05. Because the polymer concentration is close to the overlap concentration, the polymer itself cannot be treated as non-interacting due to the osmotic compressibility exerted between the chains. As a result, we recalculate the non-ideal radius of gyration for semi-dilute polymers, Rg(c), from the zero concentration radius of gyration, Rg(0), using the framework proposed by Zhou et al.74 The resulting Rg value is approximately 21 nm. In Table 1, we report our attractive range, ξ = Rg/a, as varying from 0.02 to 0.04 and calculate the net potential U/kT at contact by summing the Asakura-Oosawa and Yukawa potentials. Symbols with “S” and “L” subscripts indicate properties of small and large particles. The average particle size in bidisperse gels was obtained using aavg = aSxS + aLxL, where xS and xL are the number fractions of small and large particles. All gels were allowed to equilibrate for 60 minutes prior to imaging and structural analysis.
500 g mol−1, radius of gyration Rg = 41 nm, c* = Mw/4π3/2Rg(0)3NAΨ* = 4.72 g L−1 where Rg(0) is the zero-concentration radius of gyration measured from static light scattering, NA is Avogadro's number, and Ψ* ≈ 0.24 is a correction factor for linear polymer74–76) was added as a non-adsorbing depletant to induce gelation. The concentration of PS, c, varies with colloidal volume fraction from c/c* = 1.02 to 1.05. Because the polymer concentration is close to the overlap concentration, the polymer itself cannot be treated as non-interacting due to the osmotic compressibility exerted between the chains. As a result, we recalculate the non-ideal radius of gyration for semi-dilute polymers, Rg(c), from the zero concentration radius of gyration, Rg(0), using the framework proposed by Zhou et al.74 The resulting Rg value is approximately 21 nm. In Table 1, we report our attractive range, ξ = Rg/a, as varying from 0.02 to 0.04 and calculate the net potential U/kT at contact by summing the Asakura-Oosawa and Yukawa potentials. Symbols with “S” and “L” subscripts indicate properties of small and large particles. The average particle size in bidisperse gels was obtained using aavg = aSxS + aLxL, where xS and xL are the number fractions of small and large particles. All gels were allowed to equilibrate for 60 minutes prior to imaging and structural analysis.
| Parameter | Monodisperse | α = 0.72 ± 0.02 | α = 0.60 ± 0.02 |
|---|---|---|---|
| 2as (μm) | N/A | 1.12 ± 3% | 1.10 ± 3% |
| 2aL (μm) | N/A | 1.56 ± 4% | 1.82 ± 4% |
| 2aavg (μm) | 1.30 ± 4% | 1.34 ± 4% | 1.55 ± 4% |
| ξ S | N/A | 0.038 | 0.038 |
| ξ L | N/A | 0.027 | 0.023 |
| ξ | 0.032 | 0.031 | 0.027 |
| U S/kT | N/A | 10.0 | 10.2 |
| U L/kT | N/A | 14.2 | 16.5 |
| U avg/kT | 11.8 | 12.2 | 14.1 |
| x S/xL | N/A | 1 | 0.7 |
2.2 Imaging and image processing
A resonant scanning confocal laser scanning microscope (Leica SP8) equipped with a piezo-driven Z stage was used to capture the 3D gel microstructure. The image dimensions were 35.85 × 35.85 × 20.08 μm3 with a resolution of 512 × 512 × 287 px3. All imaging was performed using an oil-immersion 63× objective. Two-channel imaging (laser wavelengths λ = 488 nm and 552 nm) was used to obtain composite fluorescent images of the small and large particles without substantial dye crosstalk. Prior to imaging, well-mixed gels were added at 150 μL into a 2 mL glass vial attached to a #1.5 coverslip (thickness = 0.17 mm). Image volumes were captured at least 25 μm above the coverslip at three independent positions after samples were allowed to equilibrate for 60 minutes.Fig. 1(a) shows a representative 2D image of a monodisperse colloidal gel prepared at ϕ = 0.20. In colloidal gels where particles are in near contact, accurate particle centroid detection is challenging due to the large point spread function (PSF) in the z-axis of confocal microscopy images in addition to overlapping and convolved PSFs of neighboring particles in contact. We used a two-step image processing protocol involving deconvolution and a scale invariant feature transform (SIFT) technique,65 rather than the conventional algorithm that uses brightness-weighted intensities.77 Deconvolution suppresses the optical blurring induced by the overlapping PSFs and enhances the particle detection accuracy by reducing misplacement at the risk of introducing artifacts. These artifacts are removed as their DoG response is often much less intense, which indicates a spurious detection, or an otherwise inappropriate size. SIFT determines the particle position and size using a difference of Gaussians (DoG) procedure, where Gaussian blurs of increasing kernel sizes are applied to the deconvolved 3D image volume. Image volumes with different Gaussian kernels are subtracted from one another (Fig. 1(b)) to enhance the pixel intensity gradients at particle edges. Fig. 1(c) and (d) demonstrate that SIFT generates particle centroids that are much more accurate than that obtained from the brightness weighted intensity method.77
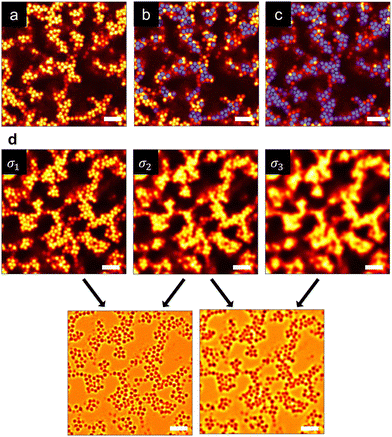 | ||
| Fig. 1 (a) A representative 2D raw image of a monodisperse colloidal gel (ϕ = 0.20). Representative overlay images show detected particles (blue circles) obtained using (b) a conventional brightness-weighted intensity algorithm77 and (c) the SIFT method. Scale bar represents 5 μm. (d) SIFT is used to process 3D image volumes through a difference of Gaussians method where blurs of increasing kernel sizes are applied to the raw image. Subtraction of processed images is used to identify particle size and position. | ||
Structural parameters were extracted from particle centroids found at locations beyond two particle diameters of the image boundaries. Using these centroids, we obtained a variety of ensemble-averaged structural parameters and categorized them based on their pairings with neighboring particles, namely: small–small (SS), small–large (SL), large–small (LS), and large–large (LL) pairings. Each particle was assigned a unique identifier to facilitate the tracking and analysis of the contact network microstructure.
3 Results and discussion
3.1 Structure of monodisperse and bidisperse colloidal gels
Fig. 2 plots the experimental data points on a colloidal phase diagram which was computed from the modified free volume theory and framework from Fleer and Gerthier.78,79 These lines differ from the ideal colloidal phase diagram using a correction factor that accounts for non-idealities in the polymer, where the overlap concentration is multiplied by a factor of .75 Although the diagram represents the phase behavior of monodisperse colloids, the gel line, which depends solely on the attractive range, shifts only marginally given the range of ξ that spans the bidisperse systems in this study.
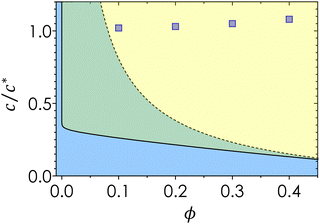 | ||
| Fig. 2 Phase diagram for monodisperse gels. The solid line represents the gas–liquid coexistence derived from generalized free volume theory,41,78 blue representing the fluid phase and green representing the gas-crystal coexistence. Dotted line represents the gel line above which spinodal decomposition occurs.78 Blue squares represent bulk conditions explored in this study. | ||
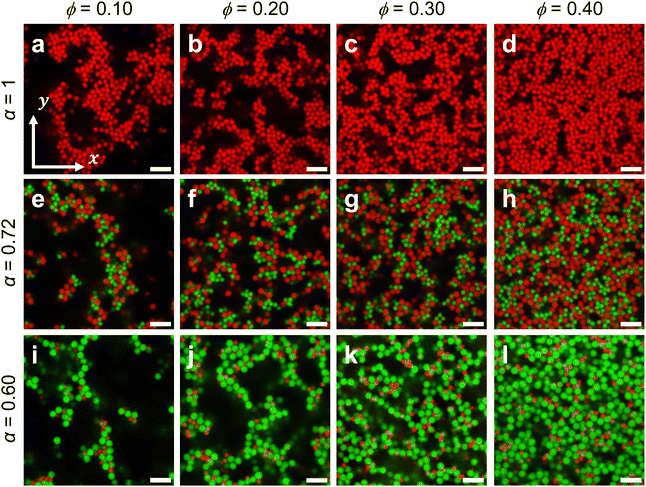
Fig. 3 shows representative images of colloidal gels across the range of ϕ and α explored in this study. Regardless of α, visual inspection shows that all samples prepared at ϕ = 0.10 (Fig. 3(a), (e) and (i)) do not percolate and remain as heterogeneous fluid clusters. Here, we define percolation as the complete tracing of a strand from one end of the 3D image volume to the opposite end. This discrepancy may arise from two mechanisms. First, it is possible that while parts of the sample has gelled, the highly heterogeneous nature of a dilute gel prepared at ϕ = 0.10 led to a lack of visualization of any space-spanning clusters.71,80 Second, the long range electrostatics (Debye length, κ−1 = 68 nm) may have slowed the formation of percolated clusters such that they were not found within the experimental timeframe. Other studies on colloidal depletion gels with much lower colloid volume fractions have shown that clusters can percolate with sufficient waiting time.33,37,81
Above ϕ = 0.10, contact networks are formed by an increasing density of colloids in near contact, concomitant with a reduction in the overall spatial heterogeneity. For monodisperse colloids (α = 1) (Fig. 3(a)–(d)), there is a subtle local order in which colloids are arranged in a Bernal-like spiral and where the spiral ordering decreases with increasing ϕ. This feature likely emerges due to the increased ergodicity of colloids at low ϕ, or in other words, the lower packing density enables monodisperse colloids to pack more efficiently by allowing them to explore their local energy landscape within experimental time scales.82
The observation of local order is significantly reduced in bidisperse colloidal gels (α = 0.72 and 0.60), because the non-equilibrium and attractive nature of colloidal depletion gels kinetically traps individual colloids at higher ϕ and therefore limits them to only explore the local free-energy minima. Moreover, outside of known crystalline phases of specific size ratios and stoichiometries, bidisperse gels have no known crystalline phases to most efficiently pack into.24,60 Decreasing the bidispersity ratio (α = 0.60) results in gel networks (Fig. 3(i)–(l)) with finer strands and branches. The strand-like morphology is likely due to the greater packing density of larger particles around smaller ones, which reduces the excluded volume and leads to a higher local attraction strength. Finer strands are typically seen in depletion gels of higher attraction strengths,9 in gels of anisotropic colloids where certain packing configurations are thermodynamically more favorable,83–85 and in the morphogenesis of bacterial colonies when depletion attractions are present.86 The finer strands found in bidisperse systems may correlate with a decrease in larger locally favored structures, which are associated with both the mechanical stability and resistance to thermal fluctuations of colloidal gels.81
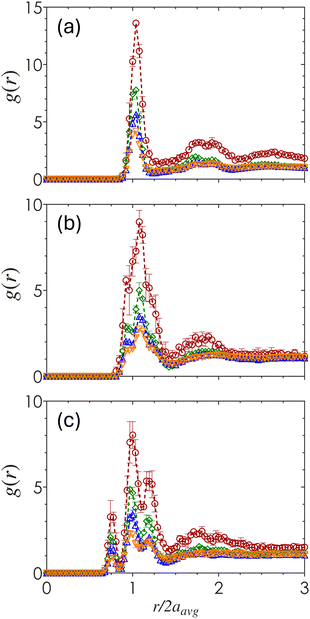
3.2 Radial distribution function
The short-range packing density is quantified by the radial distribution function, g(r), obtained by computing the density-normalized probability of finding a particle centroid a distance r away from a reference particle. Fig. 4 shows how g(r) varies across ϕ and α as a function of the pairwise centroid separation normalized by the average particle radius, r/2aavg. Across all three α values, the peaks of g(r) decrease with increasing ϕ which reflects the formation of a more evenly distributed amorphous material. For α = 1 (Fig. 4(a)), there is a single distinct first maximum at r/2aavg slightly above 1, with an additional emergence of a double peak near the second coordination shell that is especially prominent for gels at ϕ = 0.10 and 0.20. Within this double peak, this first peak corresponds to the characteristic distance associated with the distance of two poles in a 2-tetrahedral structure, while the second corresponds to the secondary coordination shell. Although the double peaks exist to some extent, the overall structure remains primarily amorphous.As α decreases, the sharpness of both the first and second peaks decrease in magnitude and increase in broadness, with an increased splitting of the first peak into multiple peaks clustered around r/2aavg = 1. These results show that the presence of different particle sizes disrupts the emergence of short-range order. Once the size disparity is sufficiently large (α = 0.60) (Fig. 4(c)), the split first peaks emerge at distances equivalent to the separation between SS, SL, and LL particle contacts. The magnitude of the SL peak is the largest, indicating that pairings between particles of different sizes are the most common.
3.3 Ensemble-averaged and pairing-specific contact number
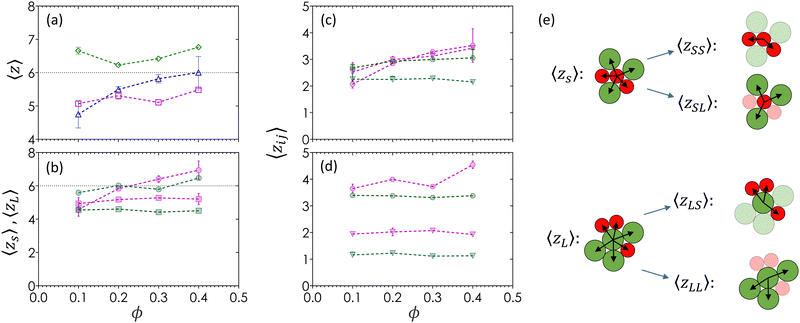
The average contact number, 〈z〉, is a measure of the mean number of nearest neighbors around a reference particle. Particles are considered to be in contact if the distance separating centroids is less than or equal to the average of their respective first minima in g(rmin), an approximation that allows us to establish a point of reference with the existing colloidal literature.15,19Fig. 5(a) shows 〈z〉 as a function of ϕ for all three α. Gels of monodisperse colloids (α = 1) show 〈z〉 values that are greater than that of the Maxwell isostaticity criterion for minimal rigidity in 3D (〈ziso〉 = 6),73 and are greater than gels of bidisperse colloids across all ϕ values. There is a slight decrease in 〈z〉 between ϕ = 0.10 and 0.20 as the gel structure evolves from compact fluid clusters to a percolated network. When α = 0.72, the value of 〈z〉 increases from 4.7 ± 0.5 to 6.0 ± 0.5 with increasing ϕ. The value of 〈z〉 remains relatively constant at 5.2 across all ϕ values when α = 0.60. Both sets of bidisperse colloids display 〈z〉 values that are smaller than Maxwell's criterion, suggesting a reduced mechanical rigidity when compared to monodisperse systems. Moreover, smaller α results in more amorphous structures that scale independently of ϕ.Fig. 5(b) shows the breakdown of 〈z〉 into 〈zs〉 and 〈zL〉 for bidisperse gels as a function of ϕ. For both bidisperse systems, small particle contacts are less frequent and show no significant change with respect to ϕ (〈zs〉 = 5.0 for α = 0.72, 〈zs〉 = 4.2 for α = 0.60). The lack of dependence implies that 〈zs〉 has reached a maximum value based on its available surface area and is not a function of ϕ. The lower 〈zs〉 value for α = 0.60 relative to 0.72 is a geometric result from large particles occupying more surface area than small particles. This trend is known in dense suspensions, where small particles have fewer neighbors than large particles in the same sample.61,87 Unlike small particles, large particles show a ϕ-dependence where 〈zL〉 increases with ϕ. At α = 0.72, 〈zL〉 rises from a value of 4.2 at ϕ = 0.10 to 〈zL〉 = 7.0 at ϕ = 0.40. This increase is less pronounced when α = 0.60, where 〈zL〉 increases from 5.7 to 6.2 due to stoichiometry. Gels at ϕ = 0.60 have an average of 10 large particles to every 7 small particles. Since the surfaces of small particles are fully occupied by contacts, large particles only find new contacts with other large particles that still have unoccupied spaces on their surfaces, leading to new LL contacts.
Bidispersity plays a significant role in the particle pairings due to a greater amount of surface area available for large particles to connect with more neighbors. Fig. 5(c) and (d) further separate the contact numbers into the average number of contacts by pairing, 〈zij〉, for a colloid i of radius ai with another colloid j of radius aj, calculated as zij = zizjxi/z, where xi is the number density of colloid i.23Fig. 5(e) visually depicts the relationship between average contact number by size (Fig. 5(b)) and the different contact pairing types (Fig. 5(c) and (d)). In both bidisperse systems, the number of SS and SL contacts (green) remain constant across all ϕ, while the number of LS and LL contacts (magenta) increase with ϕ. These results suggest that contacts between large particles are limited by stoichiometry and surface area in finer strands found at low ϕ. A moderate bidispersity of α = 0.72 appears to spatially constrain all large particle contacts, while a smaller bidispersity ratio of α = 0.60 allows small particles to fit between interstitial spaces regardless of ϕ.
3.4 Ensemble-averaged and pairing-specific angular distribution function
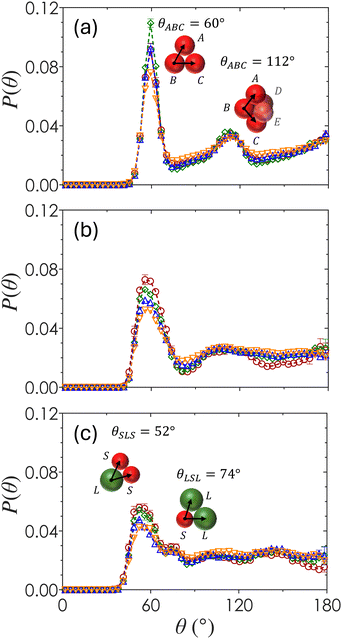
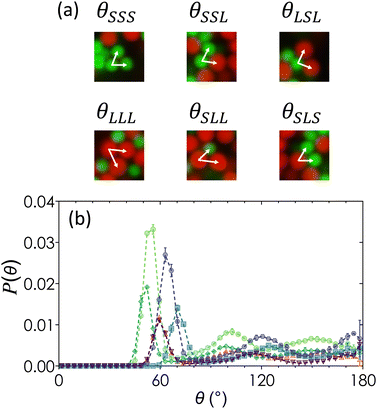
The ensemble-averaged angular distribution function, P(θ), represents the probability of finding two particles at an angle θ with respect to a reference particle as shown in Fig. 6. Peaks in the plot of P(θ) show favored orientations formed by neighboring colloids as a function of both ϕ and α. For α = 1 (Fig. 6(a)), a sharp peak emerges at θ = 60°, corresponding to three contacting neighbors packed as a uniform triangle. These triangles compose the faces of tetrahedra that form in systems of attractive spheres due to the minimized local potential energy landscape.88 The broader secondary peak at θ = 112° emerges from the geometric union of two tetrahedral structures to form a 2-tetrahedra, seen in the inset of Fig. 6(a). The magnitude of the first peak at θ = 60° is greatest for monodisperse colloids at ϕ = 0.20, which is the minimum ϕ in this study that produces a space-spanning network due to the largest numbers of locally ordered tetrahedral clusters that make up spirals.82 There is little variation of P(θ) as a function of ϕ when α = 1, suggesting that most of the particles form locally ordered tetrahedral structures regardless of their overall packing density.For α = 0.72 (Fig. 6(b)), the P(θ) peaks at θ = 58° and 110° are smaller in magnitude and shifted as compared to that of α = 1. As ϕ increases, the first maximum decreases slightly in magnitude and there is a general smoothing of the curve beyond the first maxima, indicating that the distribution of angles between bonded particles and hence the degree of disorder increases with ϕ. At the largest particle size disparity of α = 0.60 (Fig. 6(c)), the first maximum splits into two peaks at θ = 52° and 74°, corresponding to the angle between two small particles with a large reference particle and two large particles with a small reference particle (inset in Fig. 6(c)). As ϕ increases, the magnitude of the peak at θ = 52° decreases, suggesting that smaller particles become less likely to pair with one another. The curves are generally smooth at θ > 74° with the pronounced presence of small secondary maxima and minima at α = 0.60. This shows that gels formed with a higher bidispersity ratio have a greater degree of local order. A small dip in P(θ = 180°) at α = 0.60 and ϕ = 0.10 indicates that particles tend not to align in a straight chain in this specific set of gels.
Because the primary g(r) peaks for gels of α = 0.60 (Fig. 4(a)) are at r/2aavg values that are characteristic of SS, SL and LS, and LL pairs, we separate P(θ) into pairing-specific distributions as shown in Fig. 7, which plots the frequency of three-body configurations normalized by the total number of particles. For any three-body configuration where particles A and C are in contact with the reference particle B, θABC indicates the angle formed by particles A and C at vertex B. An example is shown in Fig. 7(a). There are six unique permutations of pairings including SSS, LLL, SLL, SLS, SSL, and LSL. Once separated, each triplet pairing has the geometrically predicted peaks expected due to excluded volume effects.
The reduction in the local order observed in Fig. 4(b) is a consequence of competition of different triplet interaction types. For moderately bidisperse gels (α = 0.72), triplet pairings of SSS and LLL are the least frequent pairing, followed by LSL and SLS configurations, and finally by the most common LSS and SLL configurations. These probabilities are not fully explained by random independent events that would otherwise give rise to equal probability distributions. For pairings that are inversions of each other, such as SSL and SLL, the reason for the increased prevalence of SLL could be due to the increased surface area of large particles. Because we are working with non-equilibrium structures above the gel line in Fig. 2, equilibrium arguments such as those proposed by Meng and coworkers88 do not fully explain why triplet pairings favor rotationally asymmetric structures. The variety of angles at which peaks emerge suggest an increased disorder, but further confirmation would be required through higher-order cluster analysis. This is especially true for the secondary peaks, which becomes relevant in the analysis of structures such as pentagonal bipyramids which are associated with fivefold symmetry that are known to be associated with the emergence of gel solidity.59
3.5 Number density of tetra- and poly-tetrahedral structures
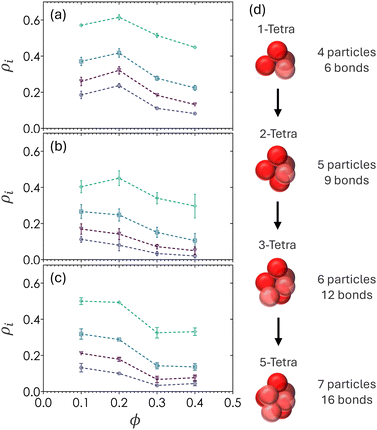
Fig. 8 shows the probability of finding particles in various forms of tetrahedral structures (ρ1T), 2-tetrahedral structures (ρ2T), 3-tetrahedral structures (ρ3T), and 5-tetrahedral structures (ρ5T). Tetrahedra are defined by four particles making contact with one another, with no angular constraints since bidisperse colloids produced tetrahedra with irregular facets. The 5T structures, defined as particles with 7 particles and 16 bonds, serve as a relaxed analog for pentagonal bipyramids. The number density of any tetrahedral or polyhedral structure i is defined as ρi = Ni/N where Ni is the number particles belonging to structure i and N is the total number of particles in the image volume. Additionally, a particle counted in ρ1T will also count as a particle belonging to ρ2T and higher order hierarchical structures. For example, ρ2T requires the union of two tetrahedral structures.The highest frequency peaks in Fig. 6 align with the expected peaks of tetrahedral structures, suggesting that 1T is the lowest free energy configuration in colloidal depletion gels with short-range attractions. There is an increase in the number of all tetrahedral structures from ϕ = 0.1 to ϕ = 0.2 which corresponds to the formation of percolating networks, where the subpopulation of single tetrahedra is always the largest (ρ1T > ρ2T > ρ3T > ρ5T). All tetrahedral densities decrease when ϕ > 0.2, that is, the number density of tetrahedral structures decreases with increasing ϕ and therefore contain looser packing. This counterintuitive observation implies that the overall particle volume fraction is directly correlated with the volume fraction of a cluster (〈z〉 increases as ϕ increases), but that the density of a cluster decreases (ρ1T decreases as 〈z〉 and ϕ both increase) beyond the gelation threshold of ϕ = 0.20.
Fig. 6 and 8 show that there are fewer regular tetrahedral structures in bidisperse colloids due to the existence of higher order, spatially disordered configurations where the bond angle θ deviates from 60°.60 The value of ρ1T is slightly higher for gels at α = 0.60 as compared to α = 0.72. This may be due to the stoichiometric ratio of 7 small particles to 10 large particles in α = 0.60 and a ratio of 1![[thin space (1/6-em)]](https://www.rsc.org/images/entities/char_2009.gif) :
:![[thin space (1/6-em)]](https://www.rsc.org/images/entities/char_2009.gif) 1 in gels at α = 0.72. Due to the the differences in both stoichiometry and occupied volume of large particles, α = 0.60 gels have a higher partial volume fraction of large particles. As a result, gels at α = 0.60 can be considered to have a higher degree of local order than ones prepared at α = 0.72.
1 in gels at α = 0.72. Due to the the differences in both stoichiometry and occupied volume of large particles, α = 0.60 gels have a higher partial volume fraction of large particles. As a result, gels at α = 0.60 can be considered to have a higher degree of local order than ones prepared at α = 0.72.
3.6 Discussion
The major findings are shown in Fig. 9 and can be summarized as follows. First, gels of bidisperse colloids with a moderate size ratio (α = 0.72) display the most disordered microstructure regardless of whether the observation frame is at the macroscopic or cluster level. Second, LSS and SLL triplet are the most common pairings observed in gels of bidisperse colloids. Finally, increasing ϕ leads to a higher 〈z〉 across the board, but the probability of finding single tetrahedral structures, ρ1T, and of other poly-tetrahedral structures decrease beyond the gelation threshold of ϕ = 0.20.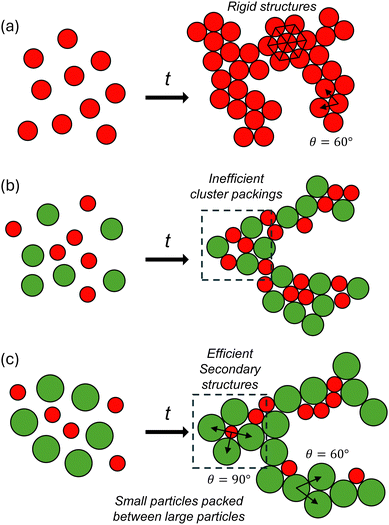 | ||
| Fig. 9 Schematic of the structural packing observed in gels with size ratios (a) α = 1, (b) α = 0.72, and (c) α = 0.60. | ||
Bidispersity introduces re-entrant behavior in that signatures of local order are greatest for the monodisperse system (α = 1) and for colloids with the largest size ratio (α = 0.60). All structural parameters used in this study indicate that the gels at α = 0.72 have the most disordered microstructure. Stoichiometric reasons notwithstanding, the reason why this moderate size ratio produces a locally and globally amorphous packing could be due to competing mechanisms where thermodynamics favor certain cluster structures, but mechanical caging effects hinder the particles from forming densely packed tetrahedra. The number of tetrahedral and poly-tetrahedral structures is further controlled by the geometrical constraints on the translational degrees of freedom, which are different depending on the size ratio.
Let us first consider what the cluster volume fraction should be from a purely geometry-based jamming perspective. For a monodisperse Brownian hard sphere system with no net external stress, as in the case of our samples under discussion, the quasi-static jamming point for a random close packed system is ϕRCP = 0.64–0.66 depending on the size polydispersity of the particles.89 In 3D systems, the isostatic point for hard spheres is 〈z〉 = 6. Adding bidispersity increases both ϕRCP and 〈z〉 in ways that depend on the size and the volumetric mixing ratio (β = 0.28 for α = 0.72 and β = 0.13 for α = 0.60) of the small and large particles. Singh and coworkers performed computer simulations on non-Brownian particles with various mixing ratios and report the variation of ϕRCP with α and β.25 Their data show that in hard sphere systems with no attractive interactions where 0.60 ≤ α ≤ 1 and 0.15 ≤ β ≤ 0.40 (note that Singh et al. use the symbols Δ for size ratio and α for the stoichiometric ratio, with slightly different definitions from ours), ϕRCP should be between 0.66–0.67. The value of ϕRCP can be thought of as the internal cluster volume of a gel, but only if the mechanism of gel formation were to be purely mechanical in nature, driven only by entropic caging and nothing else, as equilibrium spinodal decomposition might suggest.45
Yet the true cluster volume fraction ϕg in depletion gels is likely much lower than the expected value of ϕRCP = 0.64–0.67, meaning that jamming or glass transition is not necessarily the mechanism for gelation. Our data are also supported by other evidence in the literature, for example in the cluster volume fractions and size distributions reported by Lu et al. (ϕg ≈ 0.57), Whitaker et al. (0.35 ≤ ϕg ≤ 0.5), and by Tsurusawa and Tanaka (ϕg ≈ 0.30, albeit defined as the fraction of clustered pentagonal bipyramids).9,45,59 While we do not report ϕg in this study, the parameters ρ1T, ρ2T, ρ3T, and ρ5T serve as indirect measures of the densest clusters that are formed in a gel, since tetrahedra and poly-tetrahedra are defined only when four particles make contact with one another. Overall isostatic rigidity is unnecessary (〈z〉 can be ≤6) because tetrahedral structures can form with hypostatic packings as long as the local cluster coordination number is 〈zc〉 ≥ 3. Our results are therefore in support of the notion that the mechanism of glass formation is completely different from that of depletion gelation, in which the kinetic arrest in a gel is not necessarily driven by the formation of dense clusters except at the lowest attraction strengths and highest volume fractions. This mechanism only happens very close to the phase boundaries in weak and highly concentrated gels.59 A similar phenomenon is seen in the depletion-driven gelation of anisotropic colloidal discoids.84,90
In the case of bidisperse systems, these arguments about the nature of gelation remain valid, with the exception that pairings between small and large particles influence both the jamming threshold and the pairwise attractive and repulsive potential. We observe that large particle vertices are more frequent than equivalent pairings with small particle vertices where P(θSLL) > P(θSSL), as seen in Fig. 7(c). This observation could be a consequence of the increased surface area availability of the large particles, or due to an increased attractive strength of the bond, or from a combination of the two. In addition, the different electrostatic contributions and stronger repulsive forces for large particles compared to small particles may be contributing to the anisotropic structures and favorability of asymmetric clusters seen in Fig. 7.19,34,35 These factors strongly influence not only the initial formation of the gel but also the rate of bond rupture and reformation in depletion gels.55,91 SS bonds (U = −10.2 kT) have a higher likelihood of rupturing as opposed to SL/LS (U = −14.1 kT) or LL (U = −16.5 kT) bonds with deeper potential wells. Once a bond ruptures, freely diffusing or hopping particles are more likely to find a large particle due to both the unoccupied surface area and larger excluded volume compared to small particles.23,61,87,92 These rearrangements during the aging process increase the frequency of large bond vertices which may influence the ordering process of neighbors and secondary structures in bidisperse systems. Although tetrahedral and polytetrahedral clusters play a key role during glass formation,57,58 this process proceeds homogeneously and at higher volume fractions than explored in this study, whereas the gels here are formed primarily through kinetic arrest. Our results show that cluster formation occur even in non-percolated samples and suggest that locally favored structures do not form by vitrification, similar to the results shown by Tsurusawa et al.59 Further validation through algorithms such as the topological cluster classification system may be able to further reveal hidden higher order local structures,53,56 especially when investigating the differences between glass and gel identities.
It would be interesting to investigate the dynamics of the particles within gel clusters as measuring the particle mobility within clusters may provide additional clarity on how bidisperse gels differ from bidisperse glasses. Although not being considered in this study, the effects of lubrication forces, osmotic pressure of concentrated colloids, and many-body interactions will become important when studying particle dynamics in Brownian colloidal systems especially if gravitational settling is present.67,93,94 Future work could also investigate why LL contacts are the only ones that increase in frequency with increasing ϕ, since cluster structure and bond lifetime are both important in connecting to the gel viscoelasticity.10,95 The findings here were somewhat analogous to those reported by Singh et al.,25 where the colloid stoichiometry and size ratio are both important parameters in differentiating the microstructure of bidisperse systems from their monodisperse counterparts. A larger set of bidispersity ratios and stoichiometry, perhaps combined with different types of colloids and depletants, would more definitively determine if these results are generalizable to a broad set of colloidal materials.
4 Conclusions
We investigated the gel structure formed by monodisperse and bidisperse colloids in the presence of a short-range depletion interaction. The application of SIFT as an image processing technique allowed the accurate identification of particle centroids in 3D despite the overlapping PSFs that are omnipresent when imaging micron-sized colloids in direct contact with their nearest neighbors. The results show that a moderate bidispersity ratio of α = 0.72 gives rise to the most disordered clusters and bulk microstructure, quantified by ensemble-averaged quantities including the g(r), 〈z〉, P(θ), and also with pairing-specific quantities including 〈zij〉, P(θABC), and ρNT. Fig. 9 shows that both thermodynamic and jamming effects compete in the formation of gel clusters with different internal densities, where kinetic arrest from attractive interactions become more important than geometrical constraints when quenching deep within the gelation phase diagram. The competing mechanisms also explain why hypostatic packings with 〈z〉 ≤ 6 can be found in colloidal gels that still support substantial amounts of elastic stress. The internal cluster volume fraction, indirectly implied by the density of tetrahedral and poly-tetrahedral clusters, decrease with increasing ϕ beyond the gelation threshold. These measurements confirm the hypothesis that the mechanism for gelation may be fundamentally different from that of the entropic glass transition, where the phase behavior is mediated by the size disparity and stoichiometry of bi- or polydisperse colloids. The unique cluster structures that are found in these far-from-equilibrium systems are therefore useful tuning knobs when designing the functional and mechanical properties of soft colloidal matter.Data availability
The code for image processing is sourced from the PyrTrack v1.0 GitHub repository at https://github.com/MathieuLeocmach/pyrtrack with DOI: https://doi.org/10.1039/c2sm27107a. All data in this manuscript is available at the following GitHub repository: https://github.com/RonyWaheibi/Bidisperse_Submission_DataAvailability.Conflicts of interest
There are no conflicts to declare.Acknowledgements
We thank Ron Larson, Shravan Pradeep, Abhinendra Singh, and Karen Daniels for scientific discussions, with acknowledgements to anonymous Reviewer 2 who informed us of seminal work in the literature.15,33–35,37,56,58,62,71,81,83 This work is supported by a National Science Foundation grant (DMR-2104726).Notes and references
- J. J. Richards, J. B. Hipp, J. K. Riley, N. J. Wagner and P. D. Butler, Langmuir, 2017, 33, 12260–12266 CrossRef CAS.
- K. Lee, M. Das, M. Pitell and C. L. Wirth, J. Colloid Interface Sci., 2023, 633, 712–722 CrossRef CAS PubMed.
- A. Langford, T. Horwitz, E. Adu-Gyamfi, C. Wiley, E. Holding, D. Zimmermann, A. A. Ignatius and S. Ohtake, J. Pharm. Sci., 2020, 109, 1460–1466 CrossRef CAS PubMed.
- J. A. Lewis, J. Am. Chem. Soc., 2000, 83, 2341–2359 CAS.
- V. K. de Souza and P. Harrowell, Proc. Natl. Acad. Sci. U. S. A., 2009, 106, 15136–15141 CrossRef CAS.
- Z. M. Sherman, A. M. Green, M. P. Howard, E. V. Anslyn, T. M. Truskett and D. J. Milliron, Acc. Chem. Res., 2021, 54, 798–807 CrossRef CAS.
- A. Smith, G. J. Donley, E. Del Gado and V. M. Zavala, ACS Nano, 2024, 18, 28622–28635 CrossRef PubMed.
- S. M. Fenton, P. Padmanabhan, B. K. Ryu, T. T. D. Nguyen, R. N. Zia and M. E. Helgeson, Proc. Natl. Acad. Sci. U. S. A., 2023, 120, e2215922120 CrossRef CAS.
- K. A. Whitaker, Z. Varga, L. C. Hsiao, M. J. Solomon, J. W. Swan and E. M. Furst, Nat. Commun., 2019, 10, 2237 CrossRef.
- M. Bantawa, B. Keshavarz, M. Geri, M. Bouzid, T. Divoux, G. H. McKinley and E. Del Gado, Nat. Phys., 2023, 1–7 Search PubMed.
- M. Nabizadeh, F. Nasirian, X. Li, Y. Saraswat, R. Waheibi, L. C. Hsiao, D. Bi, B. Ravandi and S. Jamali, Proc. Natl. Acad. Sci. U. S. A., 2024, 121, e2316394121 CrossRef CAS.
- E. Del Gado, A. Liu and C. P. Royall, J. Chem. Phys., 2023, 159, 040401 CrossRef CAS PubMed.
- D. Mangal and S. Jamali, Soft Matter, 2024, 20, 4466–4473 RSC.
- N. Dagès, L. V. Bouthier, L. Matthews, S. Manneville, T. Divoux, A. Poulesquen and T. Gibaud, Soft Matter, 2022, 18, 6645–6659 RSC.
- C. P. Royall, M. A. Faers, S. L. Fussell and J. E. Hallett, J. Phys.: Condens. Matter, 2021, 33, 453002 CrossRef CAS PubMed.
- W. C. K. Poon, J. Phys.: Condens. Matter, 2002, 14, R859 CrossRef CAS.
- D. Kittipoomwong, D. J. Klingenberg and J. C. Ulicny, J. Rheol., 2005, 49, 1521–1538 CrossRef CAS.
- R. Pandey and J. C. Conrad, Soft Matter, 2013, 9, 10617–10626 RSC.
- R. Pandey and J. C. Conrad, Phys. Rev. E, 2016, 93, 012610 CrossRef.
- D.-H. Jeong, M. K. H. Lee, V. Thiévenaz, M. Z. Bazant and A. Sauret, J. Fluid Mech., 2022, 936, A36 CrossRef CAS.
- B. M. Guy, C. Ness, M. Hermes, L. J. Sawiak, J. Sun and W. C. K. Poon, Soft Matter, 2019, 16, 229–237 RSC.
- J. Wang, B. Hyun-jong Lee and G. Arya, Nanoscale, 2020, 12, 5091–5102 RSC.
- A. Baule, F. Morone, H. J. Herrmann and H. A. Makse, Rev. Mod. Phys., 2018, 90, 015006 CrossRef CAS.
- P. I. O’Toole and T. S. Hudson, J. Phys. Chem. C, 2011, 115, 19037–19040 CrossRef.
- A. Singh, C. Ness, A. K. Sharma, J. J. de Pablo and H. M. Jaeger, Phys. Rev. E: Stat., Nonlinear, Soft Matter Phys., 2024, 110, 034901 CrossRef.
- M. Hermes and M. Dijkstra, Europhys. Lett., 2010, 89, 38005 CrossRef.
- Y. Zhou and G. Arya, Nat. Commun., 2022, 13, 7976 CrossRef CAS.
- S. Lopez-Godoy, P. Díaz-Leyva and A. Kozina, Adv. Colloid Interface Sci., 2022, 308, 102748 CrossRef CAS.
- A. Parola and L. Reatto, Mol. Phys., 2015, 113, 2571–2582 CrossRef CAS.
- V. J. Anderson and H. N. W. Lekkerkerker, Nature, 2002, 416, 811–815 CrossRef CAS.
- J. L. Harden, H. Guo, M. Bertrand, T. N. Shendruk, S. Ramakrishnan and R. L. Leheny, J. Chem. Phys., 2018, 148, 044902 CrossRef.
- A. Yethiraj and A. van Blaaderen, Nature, 2003, 421, 513–517 CrossRef CAS PubMed.
- C. P. Royall, D. G. A. L. Aarts and H. Tanaka, J. Phys.: Condens. Matter, 2005, 17, S3401 CrossRef CAS.
- A. Malins, S. R. Williams, J. Eggers, H. Tanaka and C. P. Royall, J. Phys.: Condens. Matter, 2009, 21, 425103 CrossRef PubMed.
- C. L. Klix, K.-i Murata, H. Tanaka, S. R. Williams, A. Malins and C. P. Royall, Sci. Rep., 2013, 3, 2072 CrossRef PubMed.
- M. Kohl, R. F. Capellmann, M. Laurati, S. U. Egelhaaf and M. Schmiedeberg, Nat. Commun., 2016, 7, 11817 CrossRef CAS.
- C. P. Royall, Soft Matter, 2018, 14, 4020–4028 RSC.
- M. Gimperlein, J. N. Immink and M. Schmiedeberg, Soft Matter, 2024, 20, 3143–3153 RSC.
- A. P. Gast, C. K. Hall and W. B. Russel, J. Colloid Interface Sci., 1983, 96, 251–267 CrossRef CAS.
- P. N. Pusey, W. C. K. Poon, S. M. Ilett and P. Bartlett, J. Phys.: Condens. Matter, 1994, 6, A29 CrossRef CAS.
- H. N. W. Lekkerkerker, W. C.-K. Poon, P. N. Pusey, A. Stroobants and P. B. Warren, Europhys. Lett., 1992, 20, 559–564 CrossRef CAS.
- C. A. Miller and D. D. Miller, Colloids Surf., 1985, 16, 219–223 CrossRef CAS.
- N. A. M. Verhaegh, D. Asnaghi, H. N. W. Lekkerkerker, M. Giglio and L. Cipelletti, Phys. A, 1997, 242, 104–118 CrossRef CAS.
- P. J. Lu, J. C. Conrad, H. M. Wyss, A. B. Schofield and D. A. Weitz, Phys. Rev. Lett., 2006, 96, 028306 CrossRef PubMed.
- P. J. Lu, E. Zaccarelli, F. Ciulla, A. B. Schofield, F. Sciortino and D. A. Weitz, Nature, 2008, 453, 499–503 CrossRef CAS.
- W.-H. Shih, W. Y. Shih, S.-I. Kim, J. Liu and I. A. Aksay, Phys. Rev. A: At., Mol., Opt. Phys., 1990, 42, 4772–4779 CrossRef CAS PubMed.
- S. A. Shah, Y.-L. Chen, S. Ramakrishnan, K. S. Schweizer and C. F. Zukoski, J. Phys.: Condens. Matter, 2003, 15, 4751 CrossRef CAS.
- A. D. Dinsmore and D. A. Weitz, J. Phys.: Condens. Matter, 2002, 14, 7581 CrossRef CAS.
- S. Ramakrishnan, Y.-L. Chen, K. S. Schweizer and C. F. Zukoski, Phys. Rev. E: Stat., Nonlinear, Soft Matter Phys., 2004, 70, 040401 CrossRef CAS PubMed.
- S. Ramakrishnan, V. Gopalakrishnan and C. F. Zukoski, Langmuir, 2005, 21, 9917–9925 CrossRef CAS.
- Y. Jiang and R. Seto, Nat. Commun., 2023, 14, 2773 CrossRef CAS PubMed.
- J. Colombo, A. Widmer-Cooper and E. Del Gado, Phys. Rev. Lett., 2013, 110, 198301 CrossRef PubMed.
- A. Malins, S. R. Williams, J. Eggers and C. P. Royall, J. Chem. Phys., 2013, 139, 234506 CrossRef.
- D. Richard, J. Hallett, T. Speck and C. P. Royall, Soft Matter, 2018, 14, 5554–5564 RSC.
- R. N. Zia, B. J. Landrum and W. B. Russel, J. Rheol., 2014, 58, 1121–1157 CrossRef CAS.
- P. C. Royall, S. R. Williams, T. Ohtsuka and H. Tanaka, Nat. Mater., 2008, 7, 556–561 CrossRef.
- M. Leocmach and H. Tanaka, Nat. Commun., 2012, 974 CrossRef PubMed.
- P. C. Royall, S. R. Williams and H. Tanaka, J. Chem. Phys., 2018, 148, 044501 CrossRef PubMed.
- H. Tsurusawa and H. Tanaka, Nat. Phys., 2023, 19, 1171–1177 Search PubMed.
- R. A. LaCour, T. C. Moore and S. C. Glotzer, Phys. Rev. Lett., 2022, 128, 188001 CrossRef CAS.
- M. Clusel, E. I. Corwin, A. O. N. Siemens and J. Brujić, Nature, 2009, 460, 611–615 CrossRef CAS.
- I. Zhang, R. Pinchaipat, N. B. Wilding, M. A. Faers, P. Bartlett, R. Evans and C. P. Royall, J. Chem. Phys., 2018, 148, 184902 CrossRef PubMed.
- H. Tsurusawa, M. Leocmach, J. Russo and H. Tanaka, Sci. Adv., 2019, 5, eaav6090 CrossRef.
- D. J. Koeze, L. Hong, A. Kumar and B. P. Tighe, Phys. Rev. Res., 2020, 2, 032047 CrossRef CAS.
- M. Leocmach and H. Tanaka, Soft Matter, 2013, 9, 1447–1457 RSC.
- M. Shimono and H. Onodera, Rev. Metall., 2012, 109, 41–46 CrossRef CAS.
- Z. Varga, G. Wang and J. Swan, Soft Matter, 2015, 11, 9009–9019 RSC.
- R. Harich, T. W. Blythe, M. Hermes, E. Zaccarelli, A. J. Sederman, L. F. Gladden and W. C. K. Poon, Soft Matter, 2016, 12, 4300–4308 RSC.
- J. M. Kim, J. Fang, A. P. R. Eberle, R. Castañeda-Priego and N. J. Wagner, Phys. Rev. Lett., 2013, 110, 208302 CrossRef.
- J. D. Graaf, W. C. K. Poon, M. J. Haughey and M. Hermes, Soft Matter, 2019, 15, 10–16 RSC.
- C. P. Royall, J. Eggers, A. Furukawa and H. Tanaka, Phys. Rev. Lett., 2015, 114, 258302 CrossRef PubMed.
- S. Pradeep and L. C. Hsiao, Soft Matter, 2020, 16, 4980–4989 RSC.
- L. C. Hsiao, R. S. Newman, S. C. Glotzer and M. J. Solomon, Proc. Natl. Acad. Sci. U. S. A., 2012, 109, 16029–16034 CrossRef CAS PubMed.
- X. Zhou, L. Lei, Y. Zeng, X. Lu, F. Liang, L. Zhang and G. Lin, J. Colloid Interface Sci., 2023, 631, 155–164 CrossRef CAS.
- T. Yasuda, N. Sakumichi, U.-I. Chung and T. Sakai, Phys. Rev. Lett., 2020, 125, 267801 CrossRef CAS PubMed.
- T. Ohta and Y. Oono, Phys. Lett. A, 1982, 89, 460–464 CrossRef.
- J. C. Crocker and D. G. Grier, J. Colloid Interface Sci., 1996, 179, 298–310 CrossRef CAS.
- G. J. Fleer and R. Tuinier, Adv. Colloid Interface Sci., 2008, 143, 1–47 CrossRef CAS.
- M. Leocmach, The colloid toolkit, 2015 DOI:10.5281/zenodo.31286.
- H. Tsurusawa, S. Arai and H. Tanaka, Sci. Adv., 2020, 6, eabb8107 CrossRef CAS PubMed.
- S. Griffiths, F. Turci and C. P. Royall, J. Chem. Phys., 2017, 146, 014905 CrossRef PubMed.
- A. I. Campbell, V. J. Anderson, J. S. van Duijneveldt and P. Bartlett, Phys. Rev. Lett., 2005, 94, 208301 CrossRef.
- I. Zhang, C. P. Royall, M. A. Faers and P. Bartlett, Soft Matter, 2013, 9, 2076–2084 RSC.
- L. C. Hsiao, B. A. Schultz, J. Glaser, M. Engel, M. E. Szakasits, S. C. Glotzer and M. J. Solomon, Nat. Commun., 2015, 6, 8507 CrossRef CAS PubMed.
- L. C. Hsiao and S. Pradeep, Curr. Opin. Colloid Interface Sci., 2019, 43, 94–112 CrossRef CAS.
- S. G. L. Corte, C. A. Stevens, G. Cárcamo-Oyarce, K. Ribbeck, N. S. Wingreen and S. S. Datta, Morphogenesis of bacterial colonies in polymeric environments, 2024, https://www.biorxiv.org/content/10.1101/2024.04.18.590088v1, Pages: 2024.04.18.590088, Section: New Results Search PubMed.
- E. I. Corwin, M. Clusel, A. O. N. Siemens and J. Brujić, Soft Matter, 2010, 6, 2949–2959 RSC.
- G. Meng, N. Arkus, M. P. Brenner and V. N. Manoharan, Science, 2010, 327, 560–563 CrossRef CAS PubMed.
- Y. C. Saraswat, L. C. Hsiao and E. Kerstein, J. Rheol., 2024, 68, 205–217 CrossRef CAS.
- P.-K. Kao, M. J. Solomon and M. Ganesan, Soft Matter, 2022, 18, 1350–1363 RSC.
- E. Zaccarelli, J. Phys.: Condens. Matter, 2007, 19, 323101 CrossRef.
- E. Santiso and E. A. Müller, Mol. Phys., 2002, 100, 2461–2469 CrossRef CAS.
- P. Padmanabhan and R. Zia, Soft Matter, 2018, 14, 3265–3287 RSC.
- L. C. Johnson and R. N. Zia, Soft Matter, 2021, 17, 3784–3797 RSC.
- M. Nabizadeh and S. Jamali, Nat. Commun., 2021, 12, 4274 CrossRef CAS.
| This journal is © The Royal Society of Chemistry 2024 |

