Ce–Mn bimetallic oxide-doped SPEEK/SPPO blend composite membranes to induce high oxidative tolerance and proton conductivity for hydrogen fuel cells†
Sk Miraz
Hossain‡
ab,
Pratyush
Patnaik‡
 ab,
Suman
Sarkar
 ab,
Ritika
Sharma
ab and
Uma
Chatterjee
 *ab
*ab
aMembrane Science and Separation Technology Division, CSIR-Central Salt and Marine Chemicals Research Institute, Bhavnagar, 364002, India. E-mail: umac@csmcri.org; umac@csmcri.res.in
bAcademy of Scientific and Innovative Research (AcSIR), Ghaziabad, 201002, India
First published on 30th April 2024
Abstract
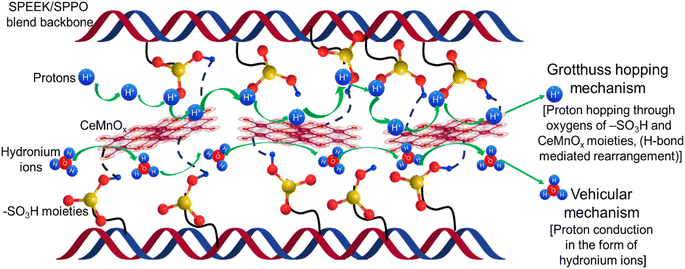
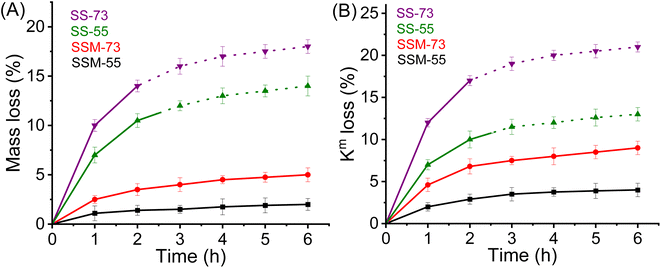
Utilizing the potential of transition metals to quench free radicals in hydrogen fuel cells, we prepared cerium–manganese-based bimetallic oxide (CeMnOx) nanostructures by alkali-aided deposition precipitation to harness as fillers in hydrocarbon-based polymer electrolyte membranes (PEMs). To improve the stability of the PEMs, a blend of sulfonated poly ether ether ketone (SPEEK) and sulfonated poly(2,6-dimethyl-1,4-phenylene oxide) (SPPO) with different weight ratios was employed as a membrane backbone. The interfacial adhesion and coupling configuration of three-dimensional CeMnOx with sulfonic moieties of blend polyelectrolytes enhances the bound water content in the PEMs. It also constructs an extensive hydrogen bonding network with proton transport channels, uplifting the proton conductivity (Km) by promoting vehicular and Grotthuss-type transport. Reversible redox cycling of Ce3+–Ce4+ and Mn2+–Mn3+ endorses the quenching of harsh radicals and augments the oxidative stability of the membranes. Composite PEMs exhibit only 4–9% mass loss and 2–5% Km loss after exposure to Fenton's solution. SSM-73 membrane showed a peak power density of 431.2 mW cm−2 with a maximum current density of 1272.6 mA cm−2 at 75 °C in 100% RH and showed a high OCV retention of 88% over 50 h. The fuel cell performance of SSM-73 was 50% higher than that of its corresponding blend membrane, i.e., SS-73, which showed a peak power density of 287 mW cm−2 and a maximum current density of 872.3 mA cm−2.
1. Introduction
In spite of advancements in the modern world, fossil fuels remain the primary source of global energy consumption.1,2 As a result, a conundrum has emerged, necessitating the development of environmentally benign alternative energy sources. Proton exchange membrane fuel cells (PEMFCs) have attracted substantial attention in the energy sector due to their high energy conversion efficiency, eco-friendly operation, zero emissions, fast refueling, and scalability.3,4 PEMFCs are membrane-based electrochemical devices that convert chemical energy into electrical energy. Although redox flow batteries (RFBs) function the same way, there is continuous supply of fuel to fuel cells in PEMFCs, enabling them to deliver uninterrupted electrical energy, unlike charge–discharge in RFBs.5 Polymer electrolyte membranes (PEMs) composed of a polymeric backbone integrated with charged functional groups are the most crucial components in fuel cells as they allow for preferential transfer of ions, enable circuit completion, and prevent mixing of reactants inside the fuel cell device.6 Nafion, a perfluorosulfonic acid polymeric membrane, is widely recognized as the state-of-the-art PEM and has achieved commercial success due to its extraordinarily high hydrated conductivity and mechanical and chemical stability.7 However, at elevated temperatures and low humidity, Nafion suffers from shortcomings such as poor proton conductivity and degraded mechanical stability.7,8 Moreover, the complex synthetic process and high cost of the Nafion membrane challenge scientists to develop alternative, cost-effective, and more robust PEMs.Aromatic non-fluorinated PEMs, basically sulfonated derivatives of poly(arylene ethers), have attracted the attention of many researchers as potential PEMs for fuel cells due to their ease of sulfonation, controllable degree of sulfonation and high film-forming ability.9 The use of sulfonated poly ether ether ketone (SPEEK),10,11 sulfonated polysulfone (SPSf),12 sulfonated polyethersulfone (SPES),13 sulfonated poly(2,6-dimethyl-1,4-phenylene oxide) (SPPO),14 sulfonated polystyrene and its derivatives,15 and sulfonated polybenzimidazole16 as potential PEMs for PEMFCs has been reported so far. Among these PEMs, SPEEK and SPPO have drawn much attention due to their easy synthetic process, commercial availability, and low cost of poly ether ether ketone (PEEK) and poly(2,6-dimethyl-1,4-phenylene oxide) (PPO). Nevertheless, these sulfonated PEMs have weak chain mobility and average power density.17 A higher degree of sulfonation (DoS) is necessary to enhance ionic conductivity. However, the increased number of sulfonic acid groups elevates the ion exchange capacity (IEC), resulting in higher water uptake, which leads to dimensional instability.18 One more eminent hurdle of these hydrocarbon-based PEMs is their poor oxidative stability. These hydrocarbon-based PEMs are intrinsically prone to radical-induced membrane deterioration, leading to high H2 crossover and low performance in PEMFCs.19 H2 crossover induces an exothermic reaction between H2 and O2, possibly resulting in pinholes in the PEMs. Harshly, the chemical reactions at the cathode sides of the cell also craft ˙OH, ˙H, and ˙OOH radicals, accountable for the chemical invasion on the membrane and catalyst layers.20,29 Hence, it is desirable to construct such PEMs that can overcome the above-mentioned limitations to achieve remarkable PEMFC performance.
Plentiful approaches such as blending SPEEK or SPPO with other polymers,21,22 crosslinking of SPEEK,23 and grafting of PEEK/SPEEK24 to enhance the chemical and mechanical stabilities have been reported. However, these techniques are inefficient in providing desirable current and power density. Among several methodologies, embedding inorganic fillers in the polymer matrix has proven to be a facile and impactful technique to enhance the membrane properties of PEMFCs.25 Furthermore, if the integrating composite material is proton-conductive, it will trigger the overall conductivity of the membrane. It will produce additional nano pathways for proton conduction and also enhance the synergistic interaction between the polymeric backbone and the filler.26 In the search for suitable fillers, transition metal-based doping is highly preferable due to their anti-oxidative attributes, which will mitigate the oxidative decomposition of the membranes.27 There are reports using Ce, Zr, Mn, Fe, and Ti-based ions, oxides, MOFs, MXenes, or bimetallic oxides as intercalating agents into PEMs, resulting in improved chemical stability.7,28–36 Crown ethers, organic anti-oxidants, silica supports, and hetero-polyacids embedded in transition metal ions have also been investigated as fillers for the improved oxidative stability of PEMs.37–39 However, there are some shortcomings in doping fillers into a polymer matrix, such as introducing phase separation and agglomeration in the membrane.26 Under certain conditions, it may also obstruct the sub-nano proton conduction channels, resulting in lower proton conductivity and PEMFC performance. Hence, it is essential to tune the filler loading to achieve accelerated conductivity, open circuit voltage (OCV), and power density.
Among the radicals generated during PEMFC operation, ˙OH is specifically more harmful to non-fluorinated aromatic hydrocarbon-based membranes. ˙OH attacks the aromatic rings at a rate constant of 109 to 1010 M−1 s−1, which is much higher than the kinetics with fluorinated membranes (approx. 106 M−1 s−1).40 Studies revealed that cerium (Ce) is a prominent free radical scavenger among transition metals and can also be treated as a repairing agent in sulfonated hydrocarbon-based polymeric membranes.19 The unique anti-oxidant and catalytic attributes of Ce nanoparticles are mainly due to the simultaneous existence of Ce3+ and Ce4+ ions and their reversible redox cycling between both oxidation states. Direct doping of CeO2 in the polymer matrix will not result in better PEMFC performance due to the major existence of Ce4+ in CeO2, while the main anti-oxidative property of Ce is due to its Ce3+ state.41 Hence, Ce nanoparticles with some structural modifications are preferable for doping in the PEMs. Similar to Ce, Mn also exhibits redox catalytic properties as well as anti-oxidant behavior. Both Ce3+ and Mn2+ ions can be treated as radical scavengers as they quench almost 89% and 46% of ˙OH radicals, respectively when the doping is only about 1% with respect to the sulfonated hydrocarbon membrane.36,37 However, the hydrogen pre-coverage of Mnm+ ions is superior to that of Cen+, resulting in higher proton conduction. To achieve the optimal properties of these two transition metals, Sharma et al. synthesized and incorporated a CeMnOx bimetallic oxide into a SPEEK polymer electrolyte to fabricate a stable PEM for enhanced performance and durability in PEMFCs and achieved a peak power density of 88 mW cm−2 at 90 °C in 100% RH.36 After several cycles of operation in PEMFCs, the anti-oxidative nature of Ce/Mn may suffer a little degradation at high RH.37 Hence, it is only the SPEEK membrane that performs the electrochemical reaction under harsh conditions. Although SPPEK exhibits excellent physicochemical and electrochemical properties, it has some bottlenecks in terms of stability. SPPO exhibits slightly better mechanical, tensile, and oxidative stabilities than those of SPEEK. Hence, the SPEEK/SPPO blend polymer electrolyte may be chosen to achieve the most favorable combination of electrochemical properties and stability to construct PEMs. This combination may help resist the radical attack without compromising on the proton conductivity to generate high current and power densities in PEMFC applications.
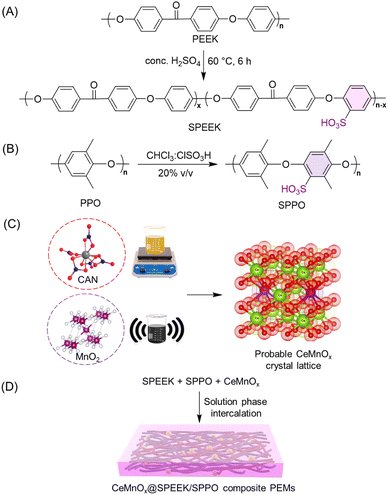
Considering all the above-mentioned facts, we propose CeMnOx bimetallic oxide-incorporated SPEEK/SPPO blend membranes to fabricate chemically stable PEMs for PEMFCs. The degree of sulfonation of SPPO was kept lower than that of SPEEK, to provide high oxidative tolerance in the blend membranes. A series of PEMs have been fabricated with different weight ratios of SPPO to SPEEK (70/30 w/w and 50/50 w/w, keeping a fixed CeMnOx loading of 2% w/w). The impact of the CeMnOx on the physicochemical and electrochemical properties has been thoroughly investigated. Our novelty lies in the blending chemistry and an optimized loading of CeMnOx to produce optically transparent CeMnOx@SPEEK/SPPO hybrid PEMs for enhanced performance and durability in hydrogen fuel cells. The present work comes with a wider scope and can beat the monopoly of perfluorinated membranes in the modern world of fuel cell technologies.
2. Experimental
2.1. Materials
PEEK (Solvay, KetaSpire® 820 P), PPO (Merck), sulfuric acid (H2SO4, Qualigens, 98%), chlorosulfonic acid (CSA, Research Lab, 97%), chloroform (CHCl3, SRL Chemicals, 99%), dimethylacetamide (DMAc, Research Lab, 99.5%), dimethyl sulfoxide (DMSO, 99%, Finar), deuterated dimethyl sulfoxide (DMSO-d6, 99.9%, TCI), ceric ammonium nitrate (CAN, Molychem, 98%), manganese dioxide (MnO2, SRL Chemicals, 99%), sodium hydroxide (NaOH, Fisher Scientific, 97%), hydrogen peroxide (H2O2, Research Lab, 30%), nitric acid (HNO3, Research Lab, 69%), ferrous chloride (FeCl2·6H2O, Loba Chemie, 97%), hydrochloric acid (HCl, Qualigens, 37%), sodium chloride (NaCl, Research Lab, 99%), and a Nafion 117-containing solution (Merck, 5% v/v) were purchased and used. Fuel cell accessories, including gas diffusion layer (GDL), platinum catalyst (DURA-lyst, 40% Pt on Vulcan XC72), and gaskets were obtained from Sainergy Fuel Cell India Pvt Ltd. Ultrapure water was used in all experimental techniques.2.2. Synthetic procedures for materials and membranes
 | (1) |
 | (2) |
 | (3) |
 | (4) |
![[thin space (1/6-em)]](https://www.rsc.org/images/entities/char_2009.gif) :
:![[thin space (1/6-em)]](https://www.rsc.org/images/entities/char_2009.gif) 30 w/w with a filler loading of 2%, with the first ‘S’ representing SPEEK, the second ‘S’ representing SPPO, and M representing the filler material). A blend membrane without the incorporation of a CeMnOx material was also fabricated to compare the PEMFC performance abbreviated as SS-73 (with first ‘S’ representing SPEEK, second ‘S’ representing SPPO, 7 corresponding to 70% weight content, and 3 corresponding to 30% weight content). Similarly, the other two PEMs were constructed by changing the SPEEK/SPPO content to 50
30 w/w with a filler loading of 2%, with the first ‘S’ representing SPEEK, the second ‘S’ representing SPPO, and M representing the filler material). A blend membrane without the incorporation of a CeMnOx material was also fabricated to compare the PEMFC performance abbreviated as SS-73 (with first ‘S’ representing SPEEK, second ‘S’ representing SPPO, 7 corresponding to 70% weight content, and 3 corresponding to 30% weight content). Similarly, the other two PEMs were constructed by changing the SPEEK/SPPO content to 50![[thin space (1/6-em)]](https://www.rsc.org/images/entities/char_2009.gif) :
:![[thin space (1/6-em)]](https://www.rsc.org/images/entities/char_2009.gif) 50 w/w and named SSM-55 (with filler) and SS-55 (without filler). A blank SPEEK membrane was also prepared for comparison purposes. Moreover, PEMs with different SPEEK/SPPO ratios (w/w) were also fabricated for comparison purposes (refer to Table S1†).
50 w/w and named SSM-55 (with filler) and SS-55 (without filler). A blank SPEEK membrane was also prepared for comparison purposes. Moreover, PEMs with different SPEEK/SPPO ratios (w/w) were also fabricated for comparison purposes (refer to Table S1†).
2.3. Characterizations
2.4. Membrane electrode assembly and PEMFC testing
The membrane electrode assembly (MEA) with a fuel cell stack of 16 cm2 was fabricated using commercial Pt/C (40% w/w) as both the cathode and anode catalysts. The Pt catalyst was loaded on a commercially supplied gas diffusion layer (GDL, ML coated). In brief, 50 mg of Pt catalyst was finely dispersed in IPA using an ultrasonicator for 1 h. Subsequently, 30% Nafion 117-containing solution (5% v/v) was added to it and sonicated for further 30 min. The resulting catalyst slurry was coated onto the GDL (brush coating) to obtain a catalyst loading of 0.5 mg cm−2 on both the GDLs. Now, a membrane piece of dimension 7.5 cm × 7.5 cm was sandwiched between the prepared electrodes by hot-pressing at 90 °C for 3 min at 30 kN cm−2. Then, the resulting MEA was placed with Teflon gaskets and assembled in a fuel cell stack. The PEMFC performance of the PEMs was evaluated using a fuel cell test station (FCT) supplied by Fuel Cell Technologies, Inc., USA. H2 and O2 gases were allowed to pass through the anode and cathode at a flow rate of 60 and 150 mL min−1, respectively, through a bubble humidifier. The PEMFC performance was evaluated at a cell temperature of 75 °C at 100% RH. The fuel cell testing was performed several times to get equilibrated data.2.5. Durability test
The oxidative resistance and durability of the MEAs of the blend membranes (SS-73 and SS-55) and the composite PEMs (SSM-73 and SSM-75) were further investigated by the accelerated stress test (AST) with a slightly modified DoE protocol. The OCV of the single-cell PEMFC was evaluated as a function of time for 50 h. The cell temperature was maintained at 75 °C with a low humidity of 30% RH throughout the test. The anode compartment was fed with pure H2 gas at 100 mL min−1, and the cathode side was fed with O2 gas at 150 mL min−1. The OCV of the cell was measured using the same FCT. Moreover, the conductivity loss of the prepared PEMs after the durability test was also evaluated by EIS using CH Instruments, Inc. (CHI608E) in the fuel cell setup with the working electrode on the cathode side and the reference and counter electrodes on the anode side under similar conditions.3. Results and discussion
3.1. Structure of SPEEK, SPPO, and CeMnOx
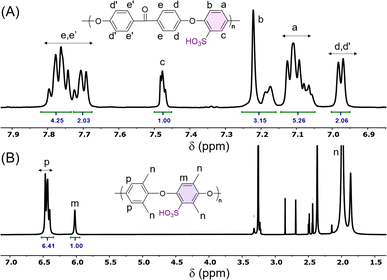
The direct electrophilic substitution of hydrophilic sulfonic acid groups on the PEEK polymeric backbone was done at the ortho position to the aryl ether linkage rather than to the aryl keto linkage (Scheme 1). This is due to the presence of a higher electronic density at the aryl ether linkage, which is highly prone to electrophilic substitution.43 The structure of SPEEK was determined by its 1H NMR spectra using DMSO-d6 as the solvent (Fig. 1). The single signal present at δ = 7.5 ppm is due to the aromatic proton present next to the C–SO3H linkage. This confirms the successful sulfonation of the PEEK backbone. Besides, multiplet signals at δ = 7.15 and 7.25 ppm are ascertained to other hydrogen atoms present in the SPEEK backbone. The DoS was evaluated using the 1H NMR spectra and calculated to be 64.65%, which can be correlated with the DoS obtained using IEC, which is 58%. Similarly, the synthesis of SPPO also follows a similar substitution mechanism. The addition of sulfonic acid moieties in the PPO backbone was confirmed by 1H NMR spectroscopy using DMSO-d6 as the solvent (Fig. 1, only compound signals have been shown to avoid the merging of solvent and compound signals). The SPPO structure is mainly characterized by two prominent signals at δ = 6.43 ppm (aromatic ring protons) and δ = 6.02 ppm (protons parallel to sulfonic acid groups) and utilized to evaluate DoS, which comes out to be 24.13%. Moreover, a range of split signals from δ = 1.9–2.5 ppm can be ascribed to the benzylic protons in SPPO. These split signals are due to the change in the electronic environment near the benzylic protons by due to the effect of sulfonic acid groups in the SPPO polymeric backbone.45Further, the assessment of functional groups in SPEEK, SPPO, and blend PEMs was done by ATR-IR analysis (Fig. 2A and B). From the curves, the broad band near 3000–3600 cm−1 is ascribed to the O–H stretching vibrations of the sulfonic acid groups present in SPEEK, SPPO, and blend PEMs. This peak also represents the O–H vibrations due to the moisture content absorbed by the hydrophilic –SO3H segments.43,45 Higher moisture trapping due to the addition of a hydrophilic CeMnOx material in the PEMs produces a broader transmission band in SSM-73 and SSM-55. Moreover, a band at ≈1647 cm−1 is observed in SPEEK and the blend PEMs is ascertained to the existence of aromatic carbonyl groups in the SPEEK backbone, which is absent in SPPO. Additionally, all membranes exhibit bands at ≈1306 cm−1, ≈1079 cm−1, ≈1024 cm−1, and ≈706 cm−1 due to the C–H, O![[double bond, length as m-dash]](https://www.rsc.org/images/entities/char_e001.gif) S
S![[double bond, length as m-dash]](https://www.rsc.org/images/entities/char_e001.gif) O, S
O, S![[double bond, length as m-dash]](https://www.rsc.org/images/entities/char_e001.gif) O stretching and O
O stretching and O![[double bond, length as m-dash]](https://www.rsc.org/images/entities/char_e001.gif) S
S![[double bond, length as m-dash]](https://www.rsc.org/images/entities/char_e001.gif) O bending vibrations, respectively.36 In the filler-loaded PEMs, i.e., SSM-73 and SSM-55, some weak bands are added at the fingerprint IR regions due to the transmission exhibited by the chemical bonds of CeMnOx nanostructures. Some bands at 515 cm−1, 523 cm−1, 531 cm−1, 550 cm−1, and 600 cm−1 can be attributed to the vibrational frequency of Ce–O and Mn–O bonds of the CeMnOx crystal lattice.49,50 This confirms the successful incorporation of the CeMnOx nanostructures in the PEMs.
O bending vibrations, respectively.36 In the filler-loaded PEMs, i.e., SSM-73 and SSM-55, some weak bands are added at the fingerprint IR regions due to the transmission exhibited by the chemical bonds of CeMnOx nanostructures. Some bands at 515 cm−1, 523 cm−1, 531 cm−1, 550 cm−1, and 600 cm−1 can be attributed to the vibrational frequency of Ce–O and Mn–O bonds of the CeMnOx crystal lattice.49,50 This confirms the successful incorporation of the CeMnOx nanostructures in the PEMs.
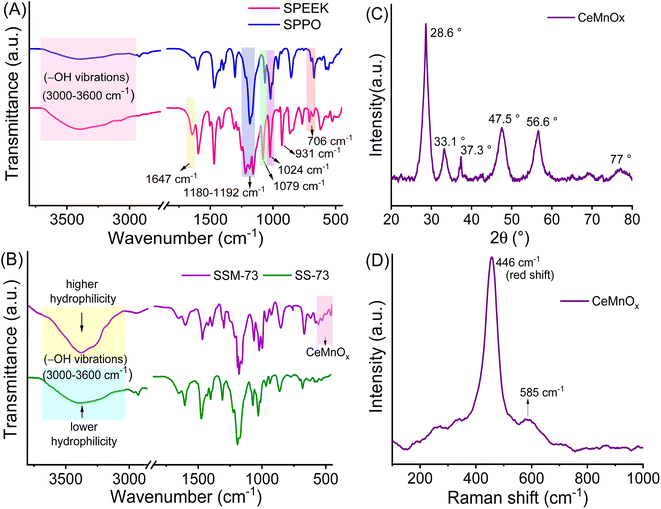 | ||
| Fig. 2 ATR-IR spectra of (A) SPEEK and SPPO and (B) SSM-73 and SS-73 respectively. (C) and (D) XRD pattern and Raman spectra of CeMnOx. | ||
The textural structure and phases of CeMnOx were studied by WAXS analysis (Fig. 2C). The WAXS curve of the prepared material covered diffraction lines pertaining to CeOx (cerianite, PDF 43-1002, JCPDS: 01-081-1984) phases at diffraction angles of 2θ = 28.6° (1 1 1), 33.2° (2 0 0), 47.6° (2 2 0), and 56.86° (3 1 1). Similarly, the diffraction pattern is assigned to the crystal planes of MnOx (ramsdellite, PDF 44-142 and pyrolusite, PDF 24-735, JCPDS: 01-072-1984) phases at 2θ = 37.78°, 41.2°, 43°, and 77.46° (3 0 1). It is worth noticing that the WAXS curve of the CeMnOx nanostructure exhibits sharp diffraction peaks for the CeOx phase (2θ = 28.6°, 33.1°, 47.5°, 56.6°), which signifies the existence of well-crystallized and ordered cerium oxides within it. Meanwhile, the diffraction peaks corresponding to MnOx (2θ = 37.3°, 77°) are weaker than those of CeOx, which indicates the abundance of Mnn+ in the highly dispersed solution with lower crystallinity.51 Hence, the overall crystallinity in the CeMnOx nanostructures tends to decrease compared to CeO2, promoting more defective crystallite sites. These defects manifest the increment of Ce3+ per total Ce ions (Cet), which is highly favorable for scavenging the harsh ˙OH and ˙OOH radicals.52 The crystallite size (Dcrystal) of Ce phases was obtained using the Debye–Scherrer equation (eqn (S7), ESI†). The Dcrystal value for the (1 1 1) plane of Ce (in CeMnOx) was calculated to be 5.67 nm, whereas for CeO2, it is 3.5 nm, indicating the enhancement of the surface area and volume of the crystal lattice in the CeMnOx nanostructure. The vibrational modes of CeMnOx were illustrated by its Raman spectrum analysis (Fig. 2D). The spectrum is primarily dominated by the vibrational band at 446 cm−1 due to the fluorite structured degenerated F2g Raman active mode (Ce–O–Ce symmetrical stretching), followed by a weak satellite band at 585 cm−1 due to the defect-induced mode (D mode) of cerium oxides.14,53 The successful Mn doping in the crystal lattice leads to a red shift of F2g Ce–O–Ce symmetrical stretching to 446 cm−1 from 460 cm−1, which is observed for CeO2 nanoparticles.30
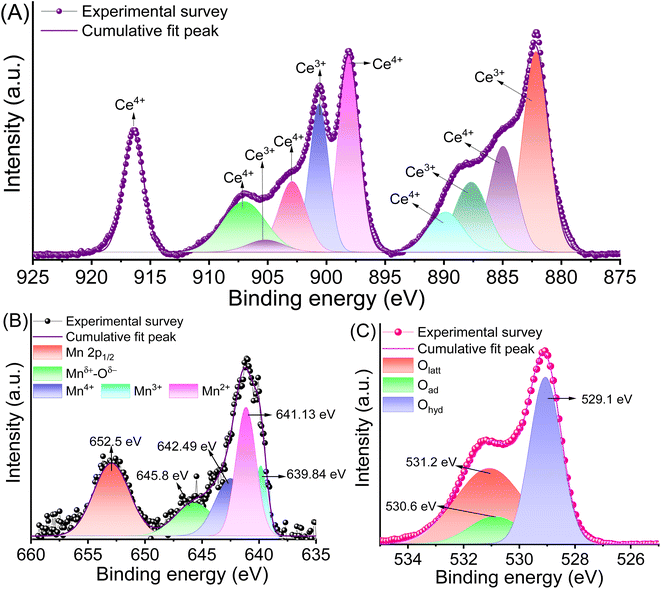
The chemical valence states and bonds of Cen+ and Mnm+ in CeMnOx were evaluated by XPS (Fig. S1, ESI† and Fig. 3). Fig. 3A displays the XPS profiles of Cen+ in their 3d5/2 and 3d3/2 spin states. The abundance of Ce3+ is ascertained to four deconvoluted peaks located at 882.1 eV (3d5/2), 887.6 eV (3d5/2), 900.6 eV (3d3/2), and 905.2 eV (3d3/2). Similarly, there are six peaks for Ce4+ 3d states, which are ascribed to the peaks present at 884.9 eV (3d5/2), 889.8 eV (3d5/2), 898.1 eV (3d5/2), 902.8 eV (3d3/2), 907.1 eV (3d3/2), and 916.4 eV (3d3/2). The Ce3+ content in the prepared CeMnOx was evaluated using [Ce3+]/[Cet] ratio (from the XPS curves), which comes out to be 42%. It is worth noting that the alkali-assisted preparation strategy of the CeMnOx nanostructure enhanced the abundance of Ce3+ ions, as evident from the XPS profiles. Fig. 3B represents the 2p1/2 and 2p3/2 profile of Mnm+ moieties. The presence of Mn2+, Mn3+, and Mn4+ states in the CeMnOx samples is evident from the deconvoluted peaks assigned precisely to binding energies of 639.8 eV, 641.1 eV, and 642.5 eV, respectively. A weak band at 645.8 can be ascribed to Mnm+ oxides (Mnδ+–Oδ−) in the nanostructure framework.51 Additionally, three types of O 1s chemical states are observed in the XPS spectrum. The lattice oxygen state (Olatt) is located at 529.1 eV. The adsorbed oxygen state (Oad), such as O2− or O− is present at 530.6 eV. These Oad values are also responsible for the defects creating oxygen vacancies.54 Finally, hydrophilic adsorbed oxygen (Ohyd) such as water or hydroxyl moieties (H2O or HO−) is assigned at a binding energy of 531.2 eV (Fig. 3C). Generally, the abundance of Ce3+ states in a nanostructure promotes oxygen vacancies.55 This implies that the prepared CeMnOx nanostructures contain desirable oxygen vacancies and promote ion conduction.
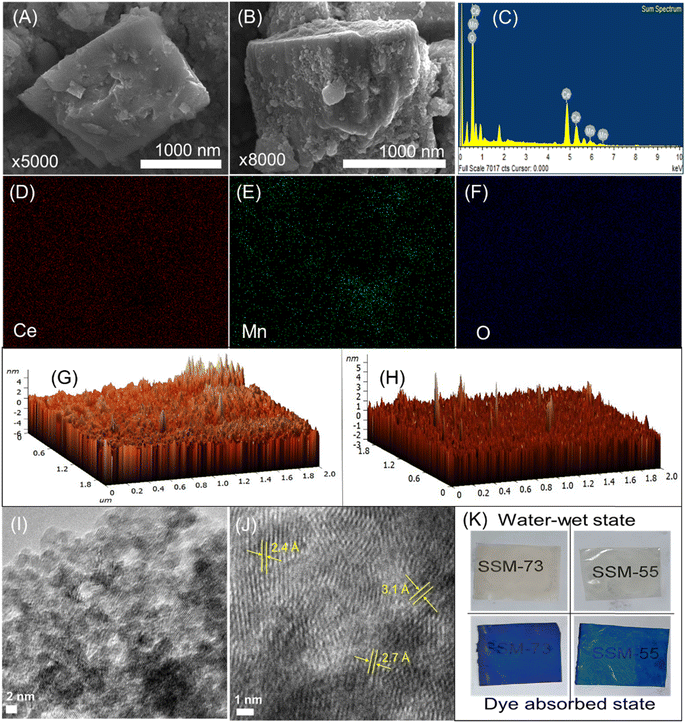
The morphology of the prepared PEMs was studied by their cross-sectional FE-SEM analysis (Fig. S2, ESI† and Fig. 4A and B). The SEM images illustrated featureless morphology with a smooth surface without cracks or pinholes. Hence, the PEMs are dense and can reduce the fuel crossover in PEMFCs. Fig. 4A, B and S3, ESI,† manifest the FE-SEM images of the prepared nanostructures. The shapes of CeMnOx nanostructures look like a fusion of octahedron-cubic structures. The EDX elemental mapping further presents the distribution of Ce, Mn, and O segments in the composite material (Fig. 4C–F and S4, ESI†). The [Ce]/[Mn] ratio was calculated to be 14/1, indicating that the desired quantity of Mn is perfectly coupled with Ce to impart catalytic activity in PEMFCs. Moreover, the surface FE-SEM images of SSM-73 and SS-73 are shown in Fig. S3,† along with their EDX elemental mapping illustrating the distribution of elements within the membranes. The presence of Ce, Mn, and a higher amount of O in SSM-73 indicates the successful incorporation of CeMnOx into the membrane. Furthermore, upon analyzing the EDX data from different sections of the same membrane sample, it is observed that the weight and atomic content of C, S, O, Ce, and Mn almost remained similar, which confirms the uniform distribution of the fillers in the membrane. The topography and phase separation behavior in the PEMs were investigated by AFM analysis (Fig. 4G, H, S5 and S6, ESI†). The AFM images show no microphase separation and support nanophase-separated morphology. This suggests the successful incorporation of CeMnOx into the SPEEK/SPPO polyelectrolyte without any agglomeration. However, a filler loading higher than 2% resulted in agglomeration in the PEMs. The roughness in the PEMs is within the nanoscale range, suggesting a smooth surface of the fabricated PEMs. The dark domains in the AFM image can be assigned to the hydrophilic phases within the PEMs, whereas the bright domains represent the hydrophobic regions. The TEM analysis also reveals the crystal lattice fringes of CeMnOx, which are associated with the (1 1 1), (1 0 0), and (1 1 0) planes due to Ce (Fig. 4I and J). This can also be correlated with the XRD pattern of the material, indicating the successful synthesis of CeMnOx with crystalline nature. The uniform distribution of the fillers and the nanophase-separated morphology in the PEMs is also supported by their TEM analysis. Fig. S7, ESI,† shows the TEM images of the composite PEMs, demonstrating the distribution of the fillers in the polymer matrix. The presence of lattice fringes, as well as the bright and dark domains representing hydrophobic and hydrophilic moieties in the polymer, indicates the distribution of fillers throughout the membrane. The uniform negative charge distribution on the prepared PEMs was confirmed by the dye test. The blue color from the dye was uniformly absorbed by the hydrophilic moieties, which suggests a co-continuous charge distribution throughout the PEMs and virgin SPEEK membrane, implying a uniform phase in PEMs similar to SPEEK (Fig. 4K and S8, ESI†).
3.2. Stability of the composite PEMs
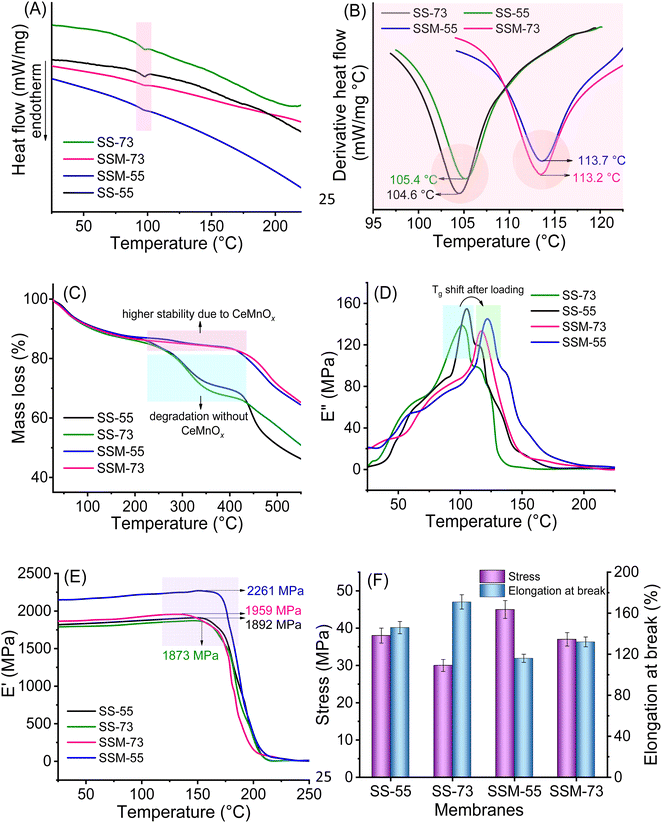
The overall stability of the PEMs was analyzed in terms of their thermal, mechanical, tensile, and chemical stability. The Tg value of the PEMs was evaluated by their DSC analysis (Fig. 5A and B). The useful temperature range for PEMFC testing and the hot pressing for MEA fabrication can be deduced concerning the Tg values of the membranes. All PEMs showed single Tg, which confirms an outstanding miscibility between SPEEK, SPPO, and the filler.54 The Tg value of the PEMs follows the order of SS-73 (104.6 °C) < SS-55 (105.4 °C) < SSM-73 (113.2 °C) < SSM-55 (113.7 °C). The higher the SPPO content, the higher the Tg value. From the Tg values, it is clear that the incorporation of CeMnOx nanostructures enhanced the Tg value of the membranes. It is known that the increase in hydrophilicity and charge in the membranes results in a decrease in the Tg value. However, in this case, the filler chemically interacts with the polymeric backbone (via H-bonding and bridge interactions) and impedes early glassy transition.The thermal stability of the PEMs was further evaluated by TGA (Fig. 5C). All the PEMs exhibited three stages of degradation. The first decomposition, around 90–130 °C, can be attributed to the loss of moisture and bound water content (due to hydrophilic sulfonic groups and filler) present in the samples. Enhanced thermal stability of the composite PEMs (SSM-55 and SSM-73) compared to that of the blend membranes (SS-55 and SS-73) is evident from the second-stage thermo-responsive degradation at 270–410 °C, attributed to the disruption of the sulfonic acid groups. It is worth noting that SSM-55 and SSM-73 show minimal weight loss in the range of 270–410 °C compared to SS-55 and SS-73 due to the intercalation of CeMnOx in the composite PEMs. This can be explained in terms of H-bond network formation between the filler and the sulfonic acid groups in the membrane matrix, resulting in enhanced stability of the composite PEMs. The last stage of degradation at >440 °C is due to the decomposition of the hydrocarbon-based polymeric backbone. Comparing the blend PEMs, SS-55 exhibits a higher thermal stability than that of SS-73 due to the presence of a higher SPPO content in the former. The mechanical stability of the PEMs was investigated using a DMA. The Tg values obtained from the DSC curves can be correlated with the loss modulus vs. temperature curves (Fig. 5D). The maxima of the loss modulus curves indicate the Tg value of the prepared membranes. Fig. 5E represents the storage modulus vs. temperature curves for the prepared PEMs. The SSM-55 membrane possesses the highest mechanical stability with a storage modulus of 2261 MPa followed by SSM-73 (1959 MPa), SS-55 (1892 MPa), and SS-73 (1873 MPa). CeMnOx imparts high mechanical strength in the membranes by holding the polymeric chains via chemical interactions.
The tensile property of the PEMs was evaluated by their stress–strain analysis using UTM in the water-wet state (Fig. 5F). SS-73 shows the lowest tensile stress of 30 MPa, as it was fabricated using only the blend polyelectrolyte with 70% (w/w) of SPEEK. Although SS-55 was also prepared using the blend solution, a higher SPPO content in SS-55 provides extra tensile strength with a stress value of 38 MPa. Composite PEMs, i.e., SSM-55 and SSM-73, exhibited higher tensile stress (45 MPa and 37 MPa, respectively) than the blend membranes. This indicates that the addition of CeMnOx in the polymer matrix provides chain support by creating a three-dimensional network structure and H-bonding. The engineering strain of the PEMs was evaluated using their elongation at break (%) value. In this case, SS-73 exhibited the highest elongation of 171% due to the presence of a maximum amount of SPEEK in the membrane, which is followed by SS-55, SSM-73, and SSM-55 with elongation values of 146%, 132%, and 116%, respectively. Contrary to the tensile stress values, the composite PEMs show a lower tensile strain than the blend membranes. Incorporating CeMnOx into the blend membranes enhances the rigidity of the membrane, resulting in low flexibility, reduced chain mobility, and lower elongation values.56 A higher filler loading will increase the tensile stress and lower the elongation, making the membrane brittle. Hence, a fixed filler loading of 2% (w/w) provides a perfect stress–strain balance for PEMFC applications. Finally, the chemical stability of the prepared PEMs was investigated via exposure with Fenton's reagent (see later).
The stability trend (thermal, mechanical, and tensile) of all the prepared PEMs indicates that SSM-55 exhibits the highest overall stability compared to others, whereas SS-73 and SS-55 without any filler show lower stability. This can be explained in terms of chemical interactions present in the membrane matrix. In the sulfonated hydrocarbon-based SPEEK/SPPO blend membranes, besides strong H-bonding between –SO3H moieties, multiple other chemical interactions such as permanent dipole–dipole interaction (keto–keto and sulfone–sulfone), weak London forces acting between aromatic polymer chains, and π–π interactions are present.57 All these forces together minimize the strong H-bonding interactions in the PEMs. When CeMnOx is added as a filler to the membrane matrix, it comes in between the polymer chains forming a three-dimensional structure that impedes dipole–dipole and London interactions between the aromatic chains. Moreover, the hydrophilic oxygen-rich surface of CeMnOx itself comprises H-bonding and bridge interactions with the polymer backbone, which provides extra strength to the membranes.14 Hence, composite PEMs are highly preferable for electrochemical energy devices. The stability analysis of the prepared PEMs also reveals that blending of SPPO is essential to enhance the oxidative stability of the SPEEK membrane even though radical scavengers are already in use. The sulfonation of PEEK is more facile, resulting in a greater degree of sulfonation than that of SPPO. This increased sulfonation leads to higher water uptake and swelling ratios, potentially causing dimensional and mechanical degradation of the PEMs. The blending of SPPO not only enhances oxidative stability but also provides additional mechanical and dimensional stability to the membrane.
3.3. Physical and electrochemical analyses
| Parameters | Membranes | |||
|---|---|---|---|---|
| SS-73 | SS-55 | SSM-73 | SSM-55 | |
| a K m* represents Km at 80 °C. | ||||
| Thickness (μm) | 62.0 | 58.0 | 61.0 | 59.0 |
| WU (%) | 37.2 ± 0.8 | 36.3 ± 0.6 | 41.2 ± 1.2 | 39.4 ± 1.0 |
| SR (%) | 29.2 ± 0.7 | 26.8 ± 0.7 | 30.5 ± 0.9 | 28.5 ± 0.8 |
| IEC (meq g−1) | 1.70 ± 0.03 | 1.68 ± 0.02 | 1.36 ± 0.02 | 1.32 ± 0.02 |
| χ m (meq cm−3) | 0.45 | 0.47 | 0.33 | 0.36 |
| λ hyd | 12.1 | 12.0 | 16.8 | 16.6 |
| Surface resistance (Ω) | 0.63 | 0.79 | 0.52 | 0.56 |
| K m (mS cm−1) | 12.7 | 9.4 | 15.0 | 13.5 |
| K m* (mS cm−1) | 23.2 | 19.2 | 26.7 | 24.3 |
| E a (kJ mol−1) | 11.39 | 12.54 | 9.47 | 10.89 |
IEC is one of the pivotal properties of a PEM, which is directly proportional to the degree of sulfonation, indicating the –SO3H content in the membrane. The proton conduction mechanism is significantly affected by their IEC values, especially the Grotthuss-type migration as it reflects the hopping sites embedded in the membrane. The IEC values of the PEMs follow the order of SSM-55 (1.32 meq g−1) < SSM-73 (1.36 meq g−1) < SS-55 (1.67 meq g−1) < SS-73 (1.70 meq g−1). Unlike WU, the IEC of the composite PEMs is lower than the blend membranes. This can be demonstrated by two factors; (i) charge dilution: –SO3H partially interacts with CeMnOx and is not fully available for interaction with foreign cations, and (ii) electrostatic repulsion: high valence states of Cen+ and Mnm+ repel the cations electrostatically and impede chemical interactions with –SO3H moieties.14
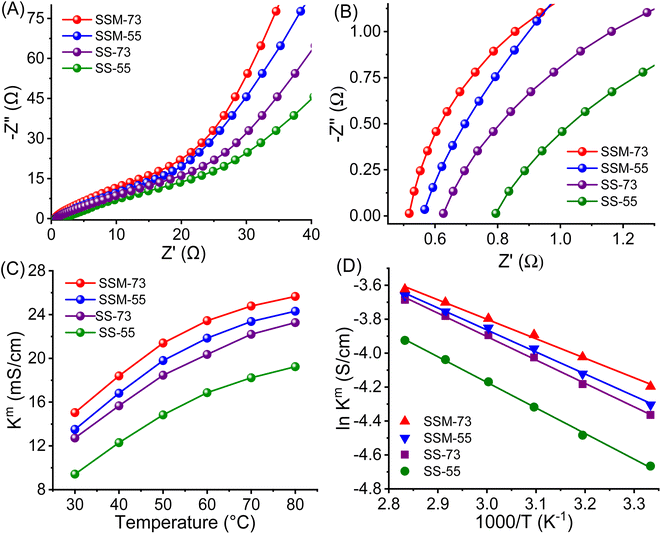 | ||
| Fig. 6 (A) Nyquist plot, (B) magnified Nyquist plot, (C) Kmvs. temperature curves, and (D) Arrhenius plot of the prepared PEMs. | ||
The proton transport properties of the PEMs were further assessed by their temperature-dependent conductivities and portrayed in Fig. 6C. Similar to WU, the Km value of all the prepared PEMs increased gradually with temperature. SSM-73 showed a Km value of 26.7 mS cm−1 at 80 °C, which is 78% higher than its Km value at RT (15.0 mS cm−1). The flexible chain mobility and activated water content at higher temperatures increase the entropy of the system, promoting proton transport kinetics. Further, the Ea value of the PEMs has been elucidated from the Arrhenius plot (Fig. 6D and eqn (S9)†). It is well known that Nafion exhibits an Ea value of ≈10 kJ mol−1. From the prepared PEMs, SSM-73 displayed an Ea value of 9.47 kJ mol−1, whereas other PEMs showed higher Ea values than that of Nafion. The Ea values for SSM-55, SS-73, and SS-55 are 10.89 kJ mol−1, 11.39 kJ mol−1, and 12.54 kJ mol−1, respectively. Integrating with the proton conducting parameter, SSM-73 exhibits the least proton transport barrier, resulting in the lowest Ea values among all.
The prominent factor governing oxidative stability is the simultaneous existence of Ce3+/Ce4+ ions and Mn2+/Mn3+ ions in the composite PEMs. These metal ions act as radical scavengers and protect the membrane backbone from radical attack. The main trait which is responsible for the protection from ˙OH radicals is the Ce3+ ion. Ce3+ reacts with ˙OH to produce Ce4+ and ˙OOH radicals. Similarly, Mn2+ reacts with ˙OH and forms Mn3+. The rate constant for the reaction of ˙OH with Ce3+ is quite higher (3 × 10⁸ M−1 s−1) than with Mn2+ (0.4 × 10⁸ M−1 s−1).61 Ce4+ and Mn3+ further oxidize ˙OOH and H2O2 to regenerate Ce3+ and Mn2+ ions respectively, along with O2. This redox cycling goes on over the fuel cell testing period and restricts the radicals from harming the membrane. Hence, the respective quenching chemistry of Ce3+ and Mn2+ states present in the CeMnOx nanostructures serves as efficient protectors from the chemical degradation of the membranes. Fig. S10 and S11 (ESI)† show the MEA condition after multiple single-cell PEMFC testing and the durability test. It is clear from the images that the prepared MEAs are devoid of any pinholes or cracks and stable after the durability test.
Moreover, the effect of CeMnOx bimetallic oxides over their individual oxides, i.e., CeO2 and MnO2 as fillers was explored using the SSM-73 membrane with 2% filler loading each. The oxidative stability in terms of mass and Km loss of the PEMs using all these fillers is displayed in Fig. S12, ESI.† It is worth noting that the oxidative stability of SSM-73 using a CeMnOx filler is higher than that of CeO2 and MnO2. The higher oxidative stability of CeMnOx can be ascertained to its higher Ce3+ content. The insertion of Mnm+ ions into the crystal lattice of CeO2 distorts its lattice with an increased Ce3+ content. However, in the CeO2 nanoparticles, the Ce4+ content is higher than the Ce3+ content. As Ce3+ plays a superior role in sustaining oxidative tolerance over Ce4+, CeMnOx exhibited a higher oxidative stability than that of CeO2. Moreover, SSM-73 using a MnO2 filler exhibited the least oxidative stability compared to CeO2 and CeMnOx. This may be due to the lower efficiency of Mn2+/Mn3+ as a free radical scavenger than that of Ce3+/Ce4+. Furthermore, WU and Km of SSM-73 using these fillers were also compared, and are shown in Table S2.† CeMnOx outplays other materials as fillers, as it imparts higher Km in SSM-73. This is because the doping of Mnm+ in the CeO2 lattice creates more oxygen vacancies, which helps in proton conduction. The corresponding Nyquist plots using CeMnOx, CeO2, and MnO2 as fillers are depicted in Fig. S13, ESI.† Considering the above-mentioned facts, it is clear that the CeMnOx bimetallic oxide is more effective as the filler than its individual oxides. Furthermore, to assess the acid stability of composite PEMs employing CeMnOx and CeO2 as fillers, two pieces of SSM-73 membranes with 2% filler loading were immersed in 3 M, 6 M, and 9 M HCl for 7 days. The acid stability was measured in terms of mass loss of the respective PEM samples. SSM-73 with CeMnOx and CeO2 filler exhibited a negligible mass loss of 0.2–0.3% in 3 M HCl, indicating that the composite PEMs are highly stable in 3 M HCl. However, SSM-73 with CeMnOx exhibited a mass loss of 6.2% and 17.7% in 6 M and 9 M HCl, respectively, whereas it showed a mass loss of 6.7% and 18.8% using CeO2 as the filler in 6 M and 9 M HCl, respectively. It is noteworthy that the acid stabilities of SSM-73 with CeMnOx and CeO2 fillers is close to each other. From the above-mentioned experiment, it can be inferred that the Mnm+ doping in the CeO2 lattice to prepare the CeMnOx bimetallic oxide does not exert a significant influence on the acid stability of the PEMs. However, the oxidative stability of the PEMs showed a remarkable superiority using CeMnOx as fillers over CeO2 or MnO2.
The physicochemical, electrochemical, and oxidative stability analysis of the other prepared blend PEMs with different SPEEK/SPPO ratios is shown in Table S3, ESI.† Although SS-91 and SS-82 exhibited higher Km values than that of SS-73, their high WU and low oxidative stability make them dimensionally unstable and prone to radical attack, respectively. Consequently, pristine and composite membranes based on SS-91 and SS-82 were not considered for further investigations, i.e., hydrogen fuel cell testing and OCV degradation test. It is worth noting that the Km value decreases as the SPPO content increases in the blend PEMs (due to lower DoS of SPPO than that of SPEEK). Therefore, there is no need to construct blend PEMs with a higher SPPO content than the SPEEK content as it will lower the Km value and fuel cell performance of the PEMs. Hence, blend PEMs were fabricated only up to a SPEEK/SPPO ratio of 50/50 (w/w). Considering the above-mentioned properties (Table S3†), only SS-73 and SS-55 were only considered for further investigation.
3.4. Single-cell PEMFC studies
The single-cell H2–O2 fuel cell performance of all the prepared PEMs, i.e., SSM-73, SSM-55, SS-73, and SS-55, was investigated by their polarization curves represented in Fig. 8A. In terms of thermal, mechanical, and chemical stabilities, SSM-55 is a better candidate, whereas in terms of proton conducting attributes, IEC, and Ea SSM-73 should be a better candidate. All the prepared PEMs showed an OCV of 0.91–0.95 V, which assures them as a potential candidate for fuel cells. The single-cell stack packed with all the prepared MEAs (16 cm2 each) showed a cell resistance in the range of 62–68 mΩ, reducing the total ohmic loss in the system. The cell resistance follows the order of SSM-73 (62 mΩ) < SSM-55 (64 mΩ) < SS-73 (67 mΩ) < SS-55 (68 mΩ). This suggests that the prepared membranes are highly conducting and exhibit lower resistance as a fuel cell components. As the resistance of other components, such as electrodes and bipolar plates remains constant, the resistance of the PEM becomes the sole determinant of the total cell resistance or ohmic loss in the system. The lower membrane resistance results in reduced ohmic losses in the fuel cell system. After testing the respective MEAs in the FCT, SSM-73 showed a peak power density of 431.2 mW cm−2 and a maximum current density of 1272.6 mA cm−2 at 75 °C (100% RH), which is the highest among all the other prepared PEMs. This is followed by the SSM-55 membrane with a maximum power density of 370.5 mW cm−2 and a current density of 1078.1 mA cm−2. As the CeMnOx loading is the same in SSM-73 and SSM-55 (2%, w/w), a higher conductivity (26.7 mS cm−1 at high temperature) and an optimum balance between membrane hydrophilicity and mass transport in the former is responsible for its better PEMFC performance. It is true that the conductivity of the membrane primarily facilitates proton transport and may not directly influence the performance in the low-voltage region, it indirectly impacts the overall cell performance. Higher proton conductivity ensures efficient proton transport within the membrane, which can help maintain a stable proton gradient across the MEA interface. However, the relationship between membrane hydrophilicity and gas transport resistance is indeed complex. It is true that higher hydrophilicity can enhance the water retention of the membrane and may lead to the accumulation of water and flooding issues in the cell, which will increase the gas transport resistance. However, the architecture of the prepared composite PEMs is so designed that it imposes a balance between the hydrophilicity and the mass transport within the fuel cell. SSM-73 with 2% filler loading showed improved water management property, which helps maintain proper hydration levels within the membrane and fuel cell system. This, in turn, inhibits the flooding issue, facilitating proton conduction and ensuring efficient mass transport of reactants (primarily oxygen), thereby leading to improved performance of SSM-73 at low-voltage regions. The SS-73 membrane displayed a peak power density of 286.9 mW cm−2 (34% lesser than SSM-73) and a maximum current density of 872.3 mA cm−2 (40% lesser than SSM-73) under the same operational conditions. However, the pristine SPEEK membrane without incorporation of filler exhibited a peak power density of 230.7 mW cm−2 and a maximum current density of 692.3 mA cm−2 at 75 °C (100% RH) (Fig. S14, ESI†). Moreover, the impact of filler loading at three different levels, namely 1%, 2%, and 3%, on the fuel cell performance has been investigated. The fuel cell performance was less favorable in cases where the filler loading was either 1% or 3%. SSM-73 with 1% filler loading demonstrated a peak power density of 330 mW cm−2 and a maximum current density of 959 mA cm−2, whereas SSM-73 with 3% filler loading showed a peak power density of 364 mW cm−2 with a maximum current density of 1056 mA cm−2 under similar conditions. The performance with 1% filler loading was inferior to that with 2% loading, mainly due to the relatively limited influence of fillers at the lower loading level. However, when the filler content was increased to 3%, it resulted in agglomeration on the membrane, which prevented it from effectively contributing to fuel cell performance.14 The Nyquist plot of SSM-73 with filler loadings of 1%, 2%, and 3% is shown in Fig. S15, ESI.† The surface resistance of SSM-73 with 2% filler loading exhibits the lowest resistance of 0.52 Ω followed by 3% filler loading (0.55 Ω) and 1% filler loading (0.57 Ω). This can be clearly correlated with the fuel cell performance of SSM-73 using different filler loadings (w/w).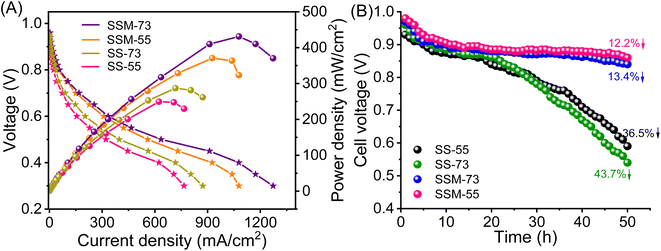 | ||
| Fig. 8 (A) Polarization curves of the prepared PEMs at 75 °C and 100% RH. (B) Durability test in terms of OCV measurements with respect to time. | ||
Besides Fenton's test, the chemical stability of the prepared MEAs was evaluated by AST. Fig. 8B displays the OCV variation of the cell as a function of time at an operating temperature of 75 °C at 30% RH. Comparing SS-73 and SS-55, it is revealed that the OCV of SS-73 is higher than that of SS-55 initially. The higher OCV of SS-73 than that of SS-55 was maintained over a period of 28 h, after which the OCV decay was more pronounced in SS-73 than in SS-55. After 50 h, the OCV decay for SS-55 was 36.5%, which is lower than that of SS-73 (43.7%). SS-55 resists the free radical attack more than SS-73 due to its higher SPPO content, which imparts better oxidative stability in the former. The addition of CeMnOx in the membrane matrix dramatically enhances the OCV retention of SSM-73 and SSM-55. CeMnOx as the antioxidant plays the role of free radical scavengers and mitigates the radical attack on the polymeric backbone. SSM-55 exhibited the least OCV decay of 12.2% followed by SSM-73, which showed an OCV decay of 13.4%. The durability test of the prepared PEMs can be correlated with the oxidative stability analysis using Fenton's reagent. Furthermore, the enhancement of oxidative stability using SPPO as a blend material was further validated by the durability test of these membranes. A new SPEEK membrane without any SPPO content having 2% CeMnOx loading was prepared and exposed to its durability test. SSM-73 (blend composite PEM) exhibited an OCV degradation of 13.4%, whereas the SPEEK composite membrane displayed an OCV degradation of 16.2% after 50 h of accelerated stress test. Moreover, the Km retention of the PEMs after the accelerated stress test was also measured to evaluate the durability in terms of conductivity (Fig. S16, ESI†). The Km value of the PEMs after the durability test follows the order of SSM-73 (23.5 mS cm−1) > SSM-55 (22.3 mS cm−1) > SS-73 (19.7 mS cm−1) > SS-55 (16.5 mS cm−1). However, it is worth noting that the Km decay percentage of SSM-73 is slightly higher at 6.5%, than that of SSM-55, which had a Km decay of 6%. This discrepancy is attributed to the higher oxidative stability of SSM-55, as confirmed by the results from Fenton's test. Moreover, the hydrogen crossover experiments were conducted by linear sweep voltammetry (LSV), and are represented in Fig. S17, ESI.† The H2 crossover was measured by its hydrogen crossover current with hydrogen flowing at the anode (100 mL min−1) and nitrogen at the cathode (300 mL min−1), 75 °C cell temperature and 100% RH. The scan rate was kept constant at 50 mV s−1, ranging from 0 to 0.8 V. The maximum current in the LSV curves indicates a higher H2 crossover through the respective MEA. This is because a higher current suggests more hydrogen gas is crossing over from the anode to the cathode side through the membrane and splits into proton and electron also at the cathode side. The H2 crossover experiments suggest that the composite PEMs exhibited lesser H2 crossover than their parent blend membranes. The real-time acid stability of the PEMs was accessed using the cross-sectional FE-SEM images of the prepared MEAs before and after the fuel cell performance and durability (accelerated stress test) analysis. The cross-sectional FE-SEM images of the MEAs are presented in Fig. 9. It is clear from these images that the membranes sandwiched between the two gas diffusion electrode layers are devoid of any cracks or pinholes, suggesting robust acid stability of the PEMs under real fuel cell testing conditions. Furthermore, after the AST, the product water eluent was systematically collected and subjected to UV-visible spectroscopy to examine any component leakage from the composite PEMs.62 It is clear from Fig. S18, ESI,† that CeMnOx-dispersed water showed an absorbance peak at 313 nm, whereas there is no significant absorbance for the product water obtained during the AST, indicating no traces of CeMnOx leaching out from the composite PEMs. However, there may be a possibility of CeMnOx leaching, which remains in the catalyst layer when it interacts with ionic species such as Nafion ionomers, which may not be detected in the eluent. Table 2 shows the comparison of the fuel cell performance of the reported membranes with our prepared PEMs, which indicates the high potential of the prepared PEMs for better performance and durability in PEMFCs.
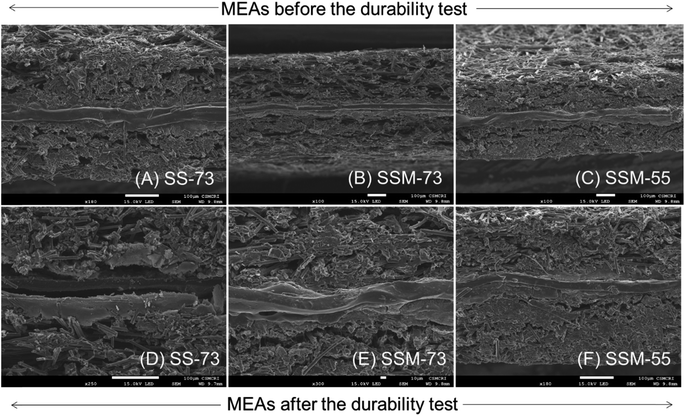 | ||
| Fig. 9 Cross-sectional FE-SEM images of the prepared MEAs before and after the durability test: (A and D) SS-73, (B and E) SSM-73, (C and F) SSM-55. | ||
| Sl no. | Membrane | Peak power density (mW cm−2) | Maximum current density (mA cm−2) | Ref. |
|---|---|---|---|---|
| 1 | SPEEK/SGO | 378 | 830 | 63 |
| 2 | SPEEK/HPW@MIL 101 | 383 | 784 | 64 |
| 3 | C-SP90/SP90NF | 485 | 1750 | 65 |
| 4 | SPEEK/W-SBA-15 | 405 | 785 | 66 |
| 5 | SPEEK–CNT–FA-6 | 672 | 1625 | 67 |
| 6 | SPAEK/f-SiO2 | 445 | 700 | 68 |
| 7 | M-SP/DMNPs@HPW-2 | 433 | 1180 | 69 |
| 8 | mPTA–Si/SPEEK | 180.87 | 690 | 70 |
| 9 | SSM-73 | 431.2 | 1272.6 | This work |
| 10 | SSM-55 | 370.5 | 1078.1 | This work |
4. Conclusions
In summary, three-dimensional CeMnOx bimetallic oxide nanostructures have been synthesized and employed as fillers to fabricate composite polymer electrolyte membranes for H2–O2 fuel cells. The blending chemistry of SPEEK and SPPO was utilised to design highly stable CeMnOx@SPEEK/SPPO hydrocarbon-based membranes. The filler loading was optimized and fixed at 2% (w/w) in composite membranes. In this work, four typical membranes, namely two blend membranes (with different blending ratio) and two composite blend membranes, were fabricated. All the membranes showed nanophase separated morphology, indicating the excellent miscibility of the blend polyelectrolyte and the filler. Apparent reinforcement in stability and proton conductivity was manifested in the composite membranes due to the consistent distribution of CeMnOx nanostructures over the polymer matrix. The outshining properties of the composite membranes are due to (i) a higher volume of CeMnOx, which increases the bound water content and (ii) the formation of H-bond networks, coupling configurations, and bridge interactions of fillers with sulfonic acid segments in the membrane, which enhances stability and creates sub-nano pathways for proton conduction. CeMnOx endorses both vehicular and Grotthuss-type pathways, resulting in fast proton conduction (26.77 mS cm−1 for SSM-73 at 80 °C) and low activation energy barrier (9.47 kJ mol−1 for SSM-73) in the composite PEMs. Moreover, the existence of Ce3+ and Mn2+ in the filler helps in the radical scavenging to produce outstanding oxidative stability with a negligible mass loss of 5–8% and a minimal Km loss of 2–5% in the composite membranes. The composite PEMs (SSM-73 and SSM-55) showed >86% of OCV retention after 50 h of accelerated stress test, confirming their enhanced durability compared to SS-55 and SS-73. The representative SSM-73 membrane exhibited a peak power density of 431.2 mW cm−2 and the highest current density of 1272.6 mA cm−2 at 75 °C and 100% RH, which proves the potential of the composite membrane as a meritorious candidate for hydrogen fuel cells.Author contributions
Uma Chatterjee: conceptualization, methodology, supervision, funding acquisition, project administration, and writing – review and editing. Sk Miraz Hossain: writing – review and editing, methodology, investigation, and formal analysis. Pratyush Patnaik: writing – original draft, investigation, and formal analysis. Suman Sarkar: data curation, validation, and visualization. Ritika Sharma: visualization and formal analysis.Conflicts of interest
There are no conflicts to declare.Acknowledgements
CSIR-CSMCRI publication number: 89/2023. UC acknowledges CSIR Hydrogen Technology Program (HCP-0044), CSIR in-house project MLP-0076, and DST-SERB (CRG/2023/001542) for financial support. We thank the analytical division and the central instrumentation facility of CSIR-CSMCRI for analytical support.References
- Z. J. Baum, L. L. Diaz, T. Konovalova and Q. A. Zhou, ACS Omega, 2022, 7, 32908–32935 CrossRef CAS PubMed.
- Y. Wang, D. F. R. Diaz, K. S. Chen, Z. Wang and X. C. Adroher, Mater. Today, 2020, 32, 178–203 CrossRef CAS.
- P. Patnaik, R. Mondal, S. Sarkar, A. Choudhury and U. Chatterjee, Int. J. Hydrogen Energy, 2022, 47, 41920–41931 CrossRef CAS.
- I. Staffell, D. Scamman, A. V. Abad, P. Balcombe, P. E. Dodds, P. Ekins, N. Shah and K. R. Ward, Energy Environ. Sci., 2019, 12, 463–491 RSC.
- R.-A. Felseghi, E. Carcadea, M. S. Raboaca, C. N. Trufin and C. Filote, Energies, 2019, 12, 4593 CrossRef CAS.
- D. W. Shin, M. D. Guiver and Y. M. Lee, Chem. Rev., 2017, 117, 4759–4805 CrossRef CAS PubMed.
- Y. Liu, J. Zhang, X. Zhang, Y. Li and J. Wang, ACS Appl. Mater. Interfaces, 2016, 8, 20352–20363 CrossRef CAS PubMed.
- X. Ge, F. Zhang, L. Wu, Z. Yang and T. Xu, Macromolecules, 2022, 55, 3773–3787 CrossRef CAS.
- M. Pirali-Hamedani and S. Mehdipour-Ataei, Polym. Adv. Technol., 2017, 28, 1495–1503 CrossRef CAS.
- N. A. M. Harun, N. Shaari and N. F. H. N. Zaiman, Int. J. Energy Res., 2021, 45, 19671–19708 CrossRef CAS.
- P. Hosseinabadi, K. Hooshyari, M. Javanbakht and M. Enhessari, New J. Chem., 2019, 43, 16232–16245 RSC.
- J. Li, H. Wu, L. Cao, X. He, B. Shi, Y. Li, M. Xu and Z. Jiang, ACS Appl. Nano Mater., 2019, 2, 4734–4743 CrossRef CAS.
- S. Gahlot, P. P. Sharma, V. Kulshrestha and P. K. Jha, ACS Appl. Mater. Interfaces, 2014, 6, 5595–5601 CrossRef CAS PubMed.
- S. M. Hossain, P. Patnaik, R. Sharma, S. Sarkar and U. Chatterjee, ACS Appl. Mater. Interfaces, 2024, 16, 7097–7111 CrossRef CAS PubMed.
- J. Shin, B. Chang, J. Kim, S. Lee and D. Suh, J. Membr. Sci., 2005, 251, 247–254 CrossRef CAS.
- S. Subhadarshini, J. S. Sravan, O. Sarkar, S. V. Mohan, T. K. Roy and T. Jana, ACS Appl. Energy Mater., 2023, 6, 1422–1438 CrossRef CAS.
- S. Takamuku, A. Wohlfarth, A. Manhart, P. Räder and P. Jannasch, Polym. Chem., 2015, 6, 1267–1274 RSC.
- J. Pan, L. Zhu, J. Han and M. A. Hickner, Chem. Mater., 2015, 27, 6689–6698 CrossRef CAS.
- T. de Wild, T. Nemeth, T. M. Nolte, T. J. Schmidt, T. Nauser and L. Gubler, J. Electrochem. Soc., 2021, 168, 054514 CrossRef CAS.
- J. Wu, X. Z. Yuan, J. J. Martin, H. Wang, J. Zhang, J. Shen, S. Wu and W. Merida, J. Power Sources, 2008, 184, 104–119 CrossRef CAS.
- M. I. Khan, A. Shanableh, S. Shahida, M. H. Lashari, S. Manzoor and J. Fernandez, Membranes, 2022, 12, 263 CrossRef CAS PubMed.
- A. R. Kim, M. B. Poudel, J. Y. Chu, M. Vinothkannan, R. S. Kumar, N. Logeshwaran, B.-H. Park, M.-K. Han and D. J. Yoo, Composites, Part B, 2023, 254, 110558 CrossRef CAS.
- Y. Yagizatli, A. Sahin and I. Ar, Int. J. Hydrogen Energy, 2022, 47, 40445–40461 CrossRef CAS.
- H. Li, G. Zhang, W. Ma, C. Zhao, Y. Zhang, M. Han, J. Zhu, Z. Liu, J. Wu and H. Na, Int. J. Hydrogen Energy, 2010, 35, 11172–11179 CrossRef CAS.
- W. Wu, Y. Li, P. Chen, J. Liu, J. Wang and H. Zhang, ACS Appl. Mater. Interfaces, 2016, 8, 588–599 CrossRef CAS PubMed.
- A. Choudhury, P. Patnaik, R. Mondal, S. Sarkar and U. Chatterjee, Chem. Eng. J., 2023, 451, 138901 CrossRef CAS.
- X. Liu, Y. Li, M. Li, N. Xie, J. Zhang, Y. Qin, Y. Yin and M. D. Guiver, J. Membr. Sci., 2021, 629, 119282 CrossRef CAS.
- S. Mukhopadhyay, A. Das, T. Jana and S. K. Das, ACS Appl. Energy Mater., 2020, 3, 7964–7977 CrossRef CAS.
- A. M. Baker, J. H. Dumont, R. Mukundan, S. G. Advani, A. K. Prasad, D. Spernjak and R. L. Borup, ECS Trans., 2017, 80, 643–650 CrossRef CAS.
- R. Zhiyan, L. Qingbing, H. Youxiu, D. Rui, L. Jia, L. Jia and L. Jianguo, RSC Adv., 2021, 11, 32012–32021 RSC.
- D. Zhao, B. L. Yi, H. M. Zhang and H. M. Yu, J. Membr. Sci., 2010, 346, 143–151 CrossRef CAS.
- L. Gubler and W. H. Koppenol, J. Electrochem. Soc., 2011, 159, B211–B218 CrossRef.
- Z. Wang, J. Ren, Y. Sun, L. Wang, Y. Fan, J. Zheng, H. Qian, S. Li, J. Xu and S. Zhang, J. Membr. Sci., 2022, 645, 120193 CrossRef CAS.
- M. Vinothkannan, B. Son and S. Shanmugam, J. Mater. Chem. A, 2022, 10, 8975–8988 RSC.
- A. R. Kim, M. Vinothkannan, K. H. Lee, J. Y. Chu, B. Park, M. Han and D. J. Yoo, Int. J. Energy Res., 2022, 46, 4835–4851 CrossRef CAS.
- J. Sharma, P. Upadhyay, S. Mishra and V. Kulshrestha, Int. J. Hydrogen Energy, 2023, 48, 10941–10954 CrossRef CAS.
- V. D. C. Tinh and D. Kim, J. Membr. Sci., 2020, 613, 118517 CrossRef.
- C. D'Urso, C. Oldani, V. Baglio, L. Merlo and A. S. Aricò, J. Power Sources, 2016, 301, 317–325 CrossRef.
- S.-H. Shin, A. Kodir, D. Shin, S.-H. Park and B. Bae, Electrochim. Acta, 2019, 298, 901–909 CrossRef CAS.
- G. V. Buxton, C. L. Greenstock, W. P. Helman and A. B. Ross, J. Phys. Chem. Ref. Data, 1988, 17, 513–886 CrossRef CAS.
- P. Eriksson, A. A. Tal, A. Skallberg, C. Brommesson, Z. Hu, R. D. Boyd, W. Olovsson, N. Fairley, I. A. Abrikosov, X. Zhang and K. Uvdal, Sci. Rep., 2018, 8, 6999 CrossRef PubMed.
- V. Yadav, A. Rajput, N. H. Rathod and V. Kulshrestha, Int. J. Hydrogen Energy, 2020, 45, 17017–17028 CrossRef CAS.
- V. Sharma, P. Upadhyay, N. H. Rathod, J. Sharma, S. Mishra, S. K. Raj, V. Kishore and V. Kulshrestha, Int. J. Hydrogen Energy, 2023, 48, 37784–37795 CrossRef CAS.
- X. Li, C. Liu, H. Lu, C. Zhao, Z. Wang, W. Xing and H. Na, J. Membr. Sci., 2005, 255, 149–155 CrossRef CAS.
- S. Mishra, J. Sharma, N. H. Rathod and V. Kulshrestha, ACS Appl. Energy Mater., 2022, 5, 4850–4860 CrossRef CAS.
- B. Kruczek, in Polyphenylene Oxide and Modified Polyphenylene Oxide Membranes, Springer US, Boston, MA, 2001, pp. 61–104 Search PubMed.
- R. Guan, C. Gong, D. Lu, H. Zou and W. Lu, J. Appl. Polym. Sci., 2005, 98, 1244–1250 CrossRef CAS.
- R. Mondal, S. Pal, P. Patnaik, D. V. Bhalani, S. K. Gupta, U. Chatterjee and S. K. Jewrajka, Desalination, 2022, 531, 115682 CrossRef CAS.
- J. Su, H. Song and C. Wang, Adv. Funct. Mater., 2019, 29, 1907154 CrossRef CAS.
- M. E. Culica, A. L. Chibac-Scutaru, V. Melinte and S. Coseri, Materials, 2020, 13, 2955 CrossRef CAS PubMed.
- H. Zhao, F. Dong, W. Han and Z. Tang, Ind. Eng. Chem. Res., 2019, 58, 18055–18064 CrossRef CAS.
- Y. Lee, G. He, A. J. Akey, R. Si, M. Flytzani-Stephanopoulos and I. P. Herman, J. Am. Chem. Soc., 2011, 133, 12952–12955 CrossRef CAS PubMed.
- H. He, X. Lin, S. Li, Z. Wu, J. Gao, J. Wu, W. Wen, D. Ye and M. Fu, Appl. Catal., B, 2018, 223, 134–142 CrossRef CAS.
- G. Xiao, S. Xin, H. Wang, R. Zhang, Q. Wei and Y. Lin, Ind. Eng. Chem. Res., 2019, 58, 5388–5396 CrossRef CAS.
- S. Cai, D. Zhang, L. Zhang, L. Huang, H. Li, R. Gao, L. Shi and J. Zhang, Catal. Sci. Technol., 2014, 4, 93–101 RSC.
- S. Pal, A. Choudhury, P. Patnaik, S. Sarkar and U. Chatterjee, Int. J. Hydrogen Energy, 2022, 47, 41806–41819 CrossRef CAS.
- E. Sgreccia, J.-F. Chailan, M. Khadhraoui, M. L. Di Vona and P. Knauth, J. Power Sources, 2010, 195, 7770–7775 CrossRef CAS.
- V. Bhadja, U. Chatterjee and S. K. Jewrajka, RSC Adv., 2015, 5, 40026–40035 RSC.
- P. Patnaik, S. M. Hossain, S. Pal, S. Sarkar, R. Sharma and U. Chatterjee, J. Membr. Sci., 2023, 688, 122105 CrossRef CAS.
- S. Pal, R. Mondal and U. Chatterjee, Renewable Energy, 2021, 170, 974–984 CrossRef CAS.
- F. D. Coms, H. Liu and J. E. Owejan, ECS Trans., 2008, 16, 1735–1747 CrossRef CAS.
- A. K. Undrajavarapu, R. Sakthivel, A. Sethi, B. M. Dass, S. D. Bhat and V. M. Dhavale, New J. Chem., 2023, 47, 14960–14971 RSC.
- R. Kumar, M. Mamlouk and K. Scott, RSC Adv., 2014, 4, 617–623 RSC.
- B. Zhang, Y. Cao, Z. Li, H. Wu, Y. Yin, L. Cao, X. He and Z. Jiang, Electrochim. Acta, 2017, 240, 186–194 CrossRef CAS.
- D. Han, J. Zhang, C. Wang, P. Hu and Y. Liu, Int. J. Hydrogen Energy, 2024, 52, 11–24 CrossRef CAS.
- V. Elumalai, C. K. K. Sravanthi and D. Sangeetha, Appl. Nanosci., 2019, 9, 1163–1172 CrossRef CAS.
- G. Sivasubramanian, K. Hariharasubramanian, P. Deivanayagam and J. Ramaswamy, Polym. J., 2017, 49, 703–709 CrossRef CAS.
- K. H. Lee, J. Y. Chu, A. R. Kim and D. J. Yoo, Int. J. Energy Res., 2019, 43, 5333–5345 CrossRef CAS.
- D. Han, J. Sun, J. Ge, H. Guo, J. Zhang, C. Wang, P. Hu and Y. Liu, Int. J. Hydrogen Energy, 2024, 57, 301–314 CrossRef CAS.
- M. H. Mohamed, H. Ilbeygi, J. Jaafar, M. Aziz, M. H. D. Othman and M. A. Rahman, Int. J. Hydrogen Energy, 2022, 47, 10736–10746 CrossRef CAS.
Footnotes |
| † Electronic supplementary information (ESI) available. See DOI: https://doi.org/10.1039/d4ta00470a |
| ‡ These authors contributed equally. |
| This journal is © The Royal Society of Chemistry 2024 |

