3D printing of Rg3-loaded hydrogel scaffolds: anti-inflammatory and scar-formation related collagen inhibitory effects for scar-free wound healing†
Xusen
Wang‡
,
Pengyu
Wei‡
,
Cewen
Hu
,
Huajing
Zeng
and
Zengjie
Fan
 *
*
Key Laboratory of Dental Maxillofacial Reconstruction and Biological Intelligence Manufacturing of Gansu Province, School of Stomatology, Lanzhou University, Lanzhou 730000, People's Republic of China. E-mail: zjfan@lzu.edu.cn
First published on 10th April 2024
Abstract
During the process of wound healing, the stimulation of inflammatory factors often leads to abnormal proliferation of blood vessels and collagen, ultimately resulting in scar formation. To address this challenge, we fabricate a novel dermal extracellular matrix (DECM) hydrogel scaffold loaded with ginsenoside Rg3 (Rg3) using 3D printing technology. Mesoporous silica nanoparticles (MSNs) are introduced into the system to encase the Rg3 to control its release rate and enhance its bioavailability. We systematically evaluate the biological, physicochemical, and wound healing properties of this scaffold. In vitro studies demonstrate that the hydrogel exhibits excellent biocompatibility and solid-like rheological properties, ensuring its successful printing. In vivo studies reveal that the composite hydrogel scaffolds effectively accelerate wound healing and achieve scar-free wound healing within three weeks. Histological and immunohistochemical (IHC) analyses show that the composite hydrogel scaffolds reduce the inflammatory response and inhibit excessive collagen accumulation. These combined effects underscore the potential of our approach in effectively inhibiting scar formation.
1. Introduction
Wound healing is a complex and dynamic process that comprises three main phases, including haemostasis, inflammation, proliferation, and remodelling.1 This process involves intricate interactions between multiple cell types and biochemical cascades.2,3 Disruption of this process and excessive collagen deposition in fibroblasts can lead to non-regenerative healing and scar formation, presenting a significant physical and psychological threat to patients.4,5The specific mechanism of scar formation remains to be further explored.6 However, reduced apoptosis and excessive fibroblast growth have been demonstrated to play an essential role in scar formation. Currently, the primary clinical approach for treating established scars is surgical excision. However, this method is plagued by drawbacks such as a high recurrence rate, extensive trauma, and susceptibility to infection. Furthermore, various physical therapies like laser therapy, radiation therapy, and cryotherapy have been employed in scar treatment, but their effectiveness is often limited. On the other hand, preventing scar formation typically involves injecting drugs into the affected areas. Steroids are the most commonly used drugs for this purpose, but these methods frequently encounter issues such as a short drug release time, and imprecise control over the injection range leading to potential drug overuse. Additionally, steroid medications may have adverse effects on other systems within the human body.7,8
Recent studies have indicated that ginsenoside Rg3 (Rg3) can inhibit the production of pro-inflammatory cytokines, such as TNF-α, IL-1β, and IL-6, thereby suppressing excessive inflammation during hypertrophic scar formation. Additionally, it can induce apoptosis in human fibroblasts.9 Therefore, we hypothesized that Rg3 might be a potential drug for preventing scar formation. However, it is often difficult for it to work alone due to its poor water solubility and low bioavailability.10 In recent years, nanoparticle-based drug delivery systems have emerged as a promising approach to enhance drug efficacy. Mesoporous silica nanoparticles (MSNs) have garnered attention as a research hotspot for small molecule drug carriers, owing to their excellent biocompatibility, high stability, uniform pore size, and adjustable surface chemical properties.11,12 Our hypothesis is that by incorporating Rg3 into MSNs, we can leverage the loading and slow-release characteristics of nanoparticles. This strategy would enable us to control the drug release rate, thereby preventing excessive drug accumulation in particular body regions. By improving the biosafety profile of Rg3, we can prolong its therapeutic effects and maintain a consistent local drug concentration for an extended duration. Based on this, we proposed to use MSNs as Rg3 drug carriers to improve drug efficacy.
However, relying solely on the MSNs/Rg3 system is not sufficient to achieve scar-free wound healing, proper wound care is also crucial. Compared to other materials, the extracellular matrix (ECM) has been widely used due to the advantages of extensive tissue sources, low antigenicity, and the ability to simulate the natural extracellular matrix microenvironment to the greatest extent.13 Therefore, we intend to choose a porcine dermal extracellular matrix (DECM) as a bio-scaffold material for wound regeneration.14
Furthermore, with the advancement of wound management technology, there is an increasing urgency to rapidly, cost-effectively, and on a large scale develop personalized wound dressings. 3D bioprinting technology has been extensively studied for skin, bone, cartilage, and heart repair due to its capability to produce sophisticated and complex scaffold structures.15,16 However, the poor mechanical properties of ECM hydrogels are well-known, leading to poor shape fidelity and low stability of printed structures.17 To address this deficiency, we increase the concentration of DECM bio-ink on the one hand, and on the other hand, the introduction of MSNs could enhance the viscosity of the bio-ink, thereby improving its mechanical properties.
Herein, this study aimed to prepare a novel Rg3-loaded DECM hydrogel wound dressing via 3D printing and nano-loading technologies to achieve the purpose of scar-free healing. We first evaluated the biocompatibility, swelling and degradation properties, and rheological properties of the DECM hydrogel inks, then investigated the effects of hydrogel scaffolds on wound healing and scar inhibition through wound healing experiments and histological analyses. The results showed that the drug-loaded hydrogel scaffold could inhibit wound inflammation and collagen accumulation by releasing Rg3, thus inhibiting scar formation.
2. Materials and methods
2.1 Materials
The following materials were used in this study: porcine skin (Dingxi Erzhi Road, Chengguan District, Lanzhou, China); ginsenoside Rg3 (Dilger Medical Technology, Nanjing, China); DNA assay kit (TransGen Biotech, Beijing, China); fetal bovine serum (FBS) and DMEM/F-12 (Hyclone, USA); MTT kit, calcein-AM/PI kit, EDU-488 kit and trypsin (Meilunbio, Dalian, China); collagen I and collagen III antibodies (Col I and III) (Affinity Biosciences, USA); VEGF, CD31 and TGF-β antibodies (Bioss, Beijing, China); hexadecyl trimethyl ammonium bromide (CTAB), tetraethyl orthosilicate (TEOS) and acetonitrile (For HPLC) (Sigma-Aldrich, USA); phosphate buffered saline (PBS) (Biosharp, Hefei, China); and dimethyl sulfoxide (DMSO), pepsin, 1-ethyl-3-(3-dimethylaminopropyl) carbodiimide hydrochloride (EDC-HCl), N-hydroxy succinimide (NHS), sodium dodecyl sulfate (SDS) and other reagents (Aladdin, Shanghai, China).2.2 Preparation of the DECM bio-ink
DECM bio-ink was prepared as described in the literature.18 The full-thickness skin was separated from the dermis by mechanical layering to remove the epidermis, subcutaneous fat, and connective tissue. Then a decellularization process was performed. After three freeze–thaw cycles, the porcine skin was treated sequentially with the following solutions on a thermostatic shaker at 300 rpm: 0.25% trypsin for 6 hours with three rinses using deionized water for 15 minutes each; 70% ethanol for 10 hours, 3% H2O2 for 15 minutes with three rinses using deionized water for 15 minutes each; 1% Triton X-100 in 0.26% EDTA and 0.69% Tris for 6 hours, after which the solution was replaced again and stirred for 16 hours, with three rinses using deionized water for 15 minutes each; 0.1% peracetic acid and 4% ethanol for 2 hours, with two rinses using PBS for 15 minutes each, and two rinses using deionized water for 15 minutes each. Finally, the decellularized porcine skin was lyophilized, crushed, and stirred continuously for one week in porcine pepsin solution (1 mg mL−1, 0.01 N hydrochloric acid). After balancing the salt concentration with PBS and neutralizing the pH with NaOH, large particles were filtered out, and the solution was stored at 4 °C.2.3 Synthesis of MSNs and loading of Rg3 into MSNs
MSNs were synthesized by the sol–gel method.19,20 In detail, 0.5 g CTAB was dissolved into 60 mL of 20% ethanol solution, followed by the addition of 2 M sodium hydroxide into the solution. The solution was heated to 80 °C and stirred at 600 rpm for 1 hour. Then, 2.8 mL of TEOS was added dropwise to the solution, maintaining the same speed and temperature for 8 hours. Afterward, the solution was extracted and washed three times alternately with anhydrous ethanol and deionized water, followed by vacuum drying overnight at 60 °C. Finally, the collected white powder was calcined in a muffle furnace at 550 °C for 6 hours to obtain MSNs.MSNs-Rg3 was prepared by centrifugation. Rg3 and MSNs were weighed at a ratio of 1![[thin space (1/6-em)]](https://www.rsc.org/images/entities/char_2009.gif) :
:![[thin space (1/6-em)]](https://www.rsc.org/images/entities/char_2009.gif) 3 (m/m) and dissolved in an appropriate amount of anhydrous ethanol, followed by centrifugation after stirring at a constant rate for 12 hours at room temperature. Subsequently, the samples were dried in a vacuum drying oven at 25 °C for 12 hours to obtain a solid dispersion of MSNs-Rg3. The encapsulation rate and loading rate of drugs were determined by high-performance liquid chromatography (HPLC) (Agilent 1260, America) and calculated using the following equations:
3 (m/m) and dissolved in an appropriate amount of anhydrous ethanol, followed by centrifugation after stirring at a constant rate for 12 hours at room temperature. Subsequently, the samples were dried in a vacuum drying oven at 25 °C for 12 hours to obtain a solid dispersion of MSNs-Rg3. The encapsulation rate and loading rate of drugs were determined by high-performance liquid chromatography (HPLC) (Agilent 1260, America) and calculated using the following equations:
| Encapsulation rate = (W0 − W1)/W0 | (1) |
| Loading rate = (W0 − W1)/(W0 + W2 − W1) | (2) |
2.4 Drug release in vitro
![[thin space (1/6-em)]](https://www.rsc.org/images/entities/char_2009.gif) :
:![[thin space (1/6-em)]](https://www.rsc.org/images/entities/char_2009.gif) 45), the volumetric flow rate of 0.3 mL min−1, detection wavelength of 203 nm, column temperature of 25 ± 0.5 °C, and sample volume of 5 μL.
45), the volumetric flow rate of 0.3 mL min−1, detection wavelength of 203 nm, column temperature of 25 ± 0.5 °C, and sample volume of 5 μL.
2.5 Cell viability
The cytotoxicity of the hydrogels was assayed by the MTT method. The groups were set up according to the concentrations of MSNs and MSNs/Rg3 added to the DECM hydrogel (0.5, 1.0, 1.5, and 2.0 mg mL−1), namely control, DECM, DECM-0.5MSNs, DECM-0.5MSNs/Rg3, DECM-1MSNs, DECM-1MSNs/Rg3, DECM-1.5MSNs, DECM-1.5MSNs/Rg3, DECM-2MSNs, and DECM-2MSNs/Rg3. An appropriate amount of the hydrogel sample was placed into a 96-well plate and sterilized. The collected logarithmic growth phase L929 cells were then transferred to 96-well plates (1 × 10⁴ cells per well) and incubated at 37 °C, 5% CO2, and DMEM/F-12 medium containing 10% FBS. After coculturing for 1, 2, and 4 days, the MTT solution was added to the 96-well plates for 4 hours. The supernatant was discarded, and 150 μL of DMSO was added to dissolve the remaining blue-purple crystalline methanogens. Finally, the absorbance of the solution was detected and recorded at 490 nm using an enzyme marker.2.6 Calcein-AM/PI staining for live dead cells and Edu-488 cell proliferation staining
Considering that the higher the concentration of drugs, the stronger the inhibitory effect on cells, we selected the following groups (control, DECM, DECM-2MSNs, and DECM-2MSNs/Rg3) to coculture with L929 cells and performed calcein-AM/PI staining and EDU-488 cell proliferation staining to more intuitively observe the growth state and proliferation of cells.An appropriate amount of hydrogel samples was placed into a 12-well plate and sterilized. The collected logarithmic growth phase L929 cells were then transferred to 12-well plates (2 × 10⁴ cells per well) and incubated for 24 hours at 37 °C and 5% CO2. Then staining was performed according to the calcein-AM/PI kit and EDU-488 kit. The samples were immediately observed under an inverted fluorescence microscope and quantitatively analyzed using ImageJ.
2.7 Swelling ratio and degradation ratio
The lyophilized hydrogel samples (3 samples per group) were immersed in PBS at 37 °C, and then the samples were removed at 12, 24, 48, and 72 hours. The swelling rate (SR) was determined after gently absorbing the water with absorbent paper and is defined as follows:| SR = (Wt − W0)/W0 × 100% | (3) |
The hydrogels (3 samples per group) were placed in 37 °C PBS to test their degradation properties. Each group of hydrogels was weighed and placed in Petri dishes containing 10 mL PBS, removed at the given time points (2, 4, 6, 8, 10, 15, 20, 25, and 30 days), gently blotted out, and weighed. The degradation effect was evaluated by calculating the weight loss during the degradation time intervals. The degradation rate (DR) is defined as follows:
| DR = (Wt − Wd)/Wt × 100% | (4) |
2.8 Rheological analysis
The rheological properties of bio-inks were tested using a stress-controlled rheometer (Austria, Anton Paar). Before testing, the samples were pre-shared for 1 minute to ensure close contact between the ink and the plate. The relationship between the ink viscosity and the shear rate was obtained at shear rates of 0.01–1000 s−1, and the oscillatory stress function G′ and G′′ modulus were obtained by the stress scanning test at a frequency of 1 Hz.2.9 3D bioprinting scaffolds
A digital model of the printing scaffold was designed using 3Ds MAX 2020 software. The printing was then extruded through a 20 G (600 μm) diameter needle using a 3D bioprinter (Envision Tec, Germany) at a pressure of 0.4 bar and a rate of 18 mm s−1. Finally, the printing scaffolds were crosslinked in a vacuum drying oven at 37 °C for 40 min. Furthermore, to visualize the microstructure of the scaffolds, we used a scanning electron microscope (SEM, JSM-5600LV) to observe the scaffold structure.2.10 In vivo wound healing
Eighteen male SD rats, weighing 180 g, were randomly selected and kept in an animal laboratory at a temperature of 25 ± 2 °C. Then, they were randomly divided into four groups: I. control; II. DECM; III. DECM-2MSNs; and IV. DECM-2MSNs/Rg3. All animals were anesthetized, and wound models of approximately 1 cm2 area were created on their dorsal skin. Wound healing was recorded by photographing on day 0, 4, 7, 14, and 21. The four groups of animals were respectively sacrificed on day 4, 7, 14, and 21, and the wound tissue was immediately excised. The samples were fixed and dehydrated in a 10% formaldehyde solution. Then the tissue samples were embedded in paraffin for H&E staining and Masson's trichrome staining. To detect the vascularization and collagen accumulation, the expression levels of Col I, Col III, VEGF, CD31, and TGF-β were detected by IHC staining. All staining results were photographed with a white light microscope and quantitatively analyzed using ImageJ. The animal experiments conformed to the guidelines of the Ministry of Science and Technology of the People's Republic of China on the care of laboratory animals. All experimental protocols were approved by the Ethics Committee of the School of Stomatology, Lanzhou University (no. LZUKQ-2019-011).2.11 Statistical analysis
For this study, at least three replicates of each experiment were conducted. The data were analyzed using GraphPad Prism 9.5 software and presented as mean ± standard deviation (SD). In the statistical analysis, “ns” indicates non-significance, while *p < 0.05, **p < 0.01, ***p < 0.001, and ****p < 0.0001 are considered statistically significant differences. One-way ANOVA was employed to assess the significant variances between groups.3. Results and discussion
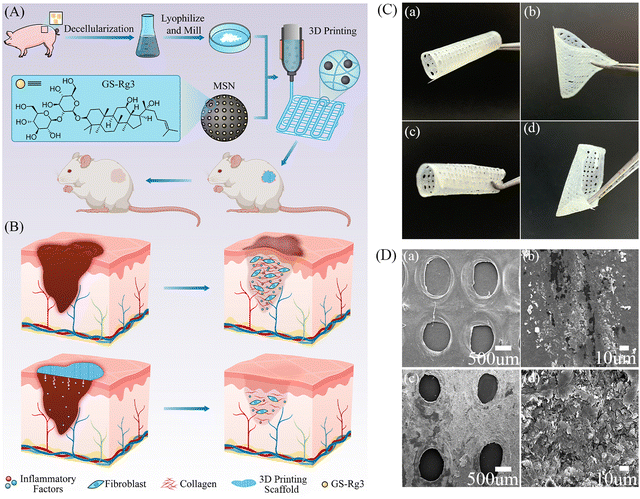
As illustrated in Fig. 1A, to truly mimic the microenvironment of wound healing and accelerate wound healing, we prepared DECM bio-inks by decellularization and introduced MSNs into the DECM to improve the printing performance as well as prolong the sustained release of Rg3. Here, the critical role of Rg3 should be highlighted as it can inhibit the inflammatory response and excessive accumulation of collagen, which hinders scar formation (Fig. 1B). In addition, to achieve a personalized, rapid, large-scale, and low-cost preparation of hydrogel wound dressing, we developed a 3D-printed DECM hydrogel scaffold for application in a full-thickness wound defect model. As envisioned, the prepared hydrogel could accelerate wound healing within 21 days, with a pattern similar to scarless healing.3.1 Preparation of DECM bio-ink
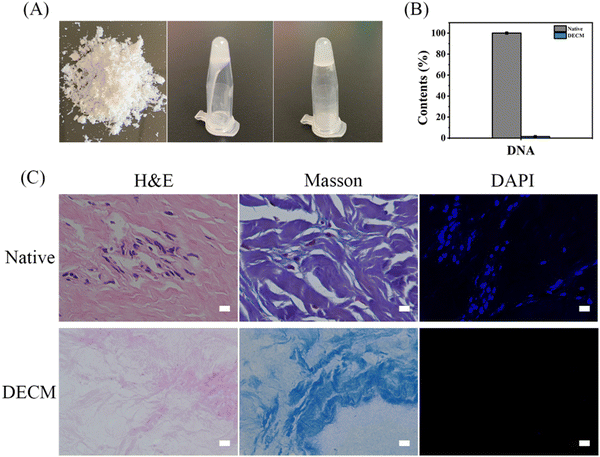
After decellularization, the DECM hydrogel bio-ink was successfully prepared (Fig. 2A). The crucial aspect of decellularization involves removing DNA from tissues. Studies suggest that ECM containing small amounts of dsDNA (less than 50 ng mg−1 protein or 3% W/V dsDNA) does not trigger immune rejection upon transplantation into heterospecifics.21 The dsDNA content in native skin and DECM was quantified using a high-throughput DNA assay kit. As shown in Fig. 2B, about 98.57% of dsDNA was removed after the decellularization process. Similarly, H&E staining images showed few cellular remnants in DECM, while collagen was still preserved. This composition is similar to the natural matrix that can form an ECM microenvironment for skin defect healing (Fig. 2C).3.2 Characterization of MSNs and drug release in vitro
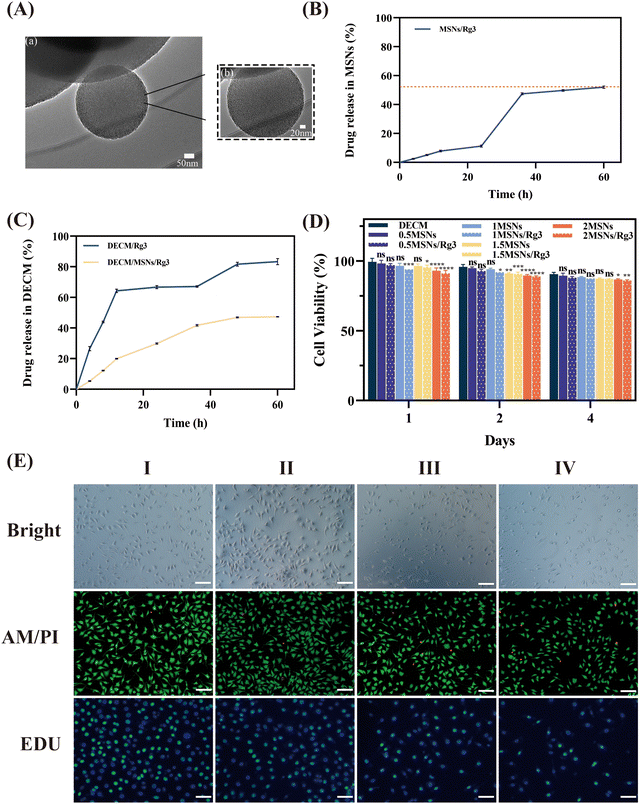
The synthesized MSNs appeared as a white powder and formed uniform pore channels from the center to the periphery under a TEM (Fig. 3A). Analysis using Nano Measure 1.2 software yielded an average diameter of MSNs of approximately 278 nm and a pore size of 2.47 nm (Fig. S1, ESI†).Rg3, a bioactive compound in traditional Chinese medicine, has been reported to reduce scar formation by inhibiting the inflammatory response and collagen hyperplasia.22 Through HPLC detection, we determined that the encapsulation rate of Rg3 in MSNs was approximately 49.03%, and the drug loading rate was approximately 14.05%.
Subsequently, we evaluated the release behavior of Rg3 in vitro. As depicted in Fig. 3B, MSNs/Rg3 exhibited a relatively stable release overall, with a cumulative release of 52.02% by 60 hours. Interestingly, the release rate significantly increased from 24–36 hours compared to 0–24 hours, which we speculate may be attributed to two reasons: one is that some of the drug adhered to the surface, and some entered the pore channel, the latter requiring a longer time to be released than the former; another is that the smaller pore size of MSNs reduces the dissolution rate of the drug. It has been reported that the smaller pore size results in reduced penetration of the dissolution medium into the pores of the carrier, and there is less chance that the drug molecules will be released from the carriers, leading to an increase in the release rate from 24–36 hours.23
To confirm that the introduction of MSNs can prolong the action time of Rg3 in the hydrogel, we compared the release rates of MSNs/Rg3 and Rg3 in the hydrogel. The results, as shown in Fig. 3C, indicate that when MSNs were not introduced into the system, Rg3 in the hydrogel was almost completely released within 24 hours, with rapid release observed within the first 12 hours. The sudden increase in the Rg3 content between 36 and 48 hours is mainly due to the disintegration of the DECM hydrogel, causing the Rg3 dispersed within the hydrogel to be rapidly released. Studies have shown that the rapid release of a large amount of Rg3 within a short period can be toxic to cells and ultimately affect wound healing.24 In contrast, MSNs/Rg3 exhibited a slow-release trend in the hydrogel, with sustained release of Rg3 observed within 48 hours, maintaining an effective drug concentration. Additionally, the release rate and amount of the drug within the first 12 hours were significantly lower than that of Rg3, which is beneficial for wound healing.
3.3 Cytocompatibility and cell proliferation of hydrogels
We examined the cytocompatibility of DECM hydrogels with different concentrations of MSNs and MSNs/Rg3 using the MTT method. Fig. 3D displays the cell viability of L929. By the fourth day of co-cultivation with the cells, the survival rates were as follows: the pure hydrogel DECM group had a cell survival rate of 90.59 ± 1.28%, the 0.5MSN group had 89.57 ± 1.83%, the 0.5MSNs/Rg3 group had 88.17 ± 0.86%, the 2MSN group had 86.81 ± 0.59%, and the 2MSNs/Rg3 group had 86.07 ± 0.57%. Overall, all groups of hydrogels exhibited good cytocompatibility, with a cell survival rate above 85%. The addition of Rg3 did not significantly change the safety of the hydrogel. All groups had a cell survival rate greater than 85%, indicating excellent biocompatibility.To more visually assess the growth state of cells when co-cultured with materials and the effect of Rg3 on cell proliferation, we conducted calcein-AM/PI staining and EDU-488 cell proliferation staining. As depicted in Fig. 3E, under the brightfield microscope, we observed that the cell density of the control, DECM, and DECM-2MSNs groups was slightly higher, with typical round or flattened star-shaped cell morphology and prominent cytoplasmic protrusions. In contrast, the DECM-2MSNs/Rg3 group exhibited marginally lower cell density, and some cells displayed apoptotic morphology characterized by reduced cell volume, the disappearance of protrusions, and compromised cellular status, indicating that the presence of Rg3 affected the expected cell growth. Calcein-AM/PI staining results demonstrated that L929 cells in all four hydrogel groups grew well. The control and DECM groups had few dead cells (green for live cells and red for dead cells), while the DECM-2MSNs and DECM-2MSNs/Rg3 groups had slightly more dead cells, with the latter displaying lower cell density. Edu-488 staining is a rapid and efficient method for detecting cell proliferation using nucleoside incorporation, and proliferating cells were labeled with green fluorescence. Among the four groups, the positive proliferation signals in the control, DECM, and DECM-2MSNs groups were more pronounced compared to the DECM-2MSNs/Rg3 group, indicating that the presence of Rg3 could inhibit the proliferation of L929 cells.
Based on the above analyses, considering that the DECM-2MSNs/Rg3 group had more drug loading and a more substantial inhibitory effect on cells, we chose this group as the experimental group for the subsequent experiments, and also set up a blank control group (control) and two positive control groups (DECM and DECM-2MSNs).
3.4 Swelling and degradation behaviors in vitro
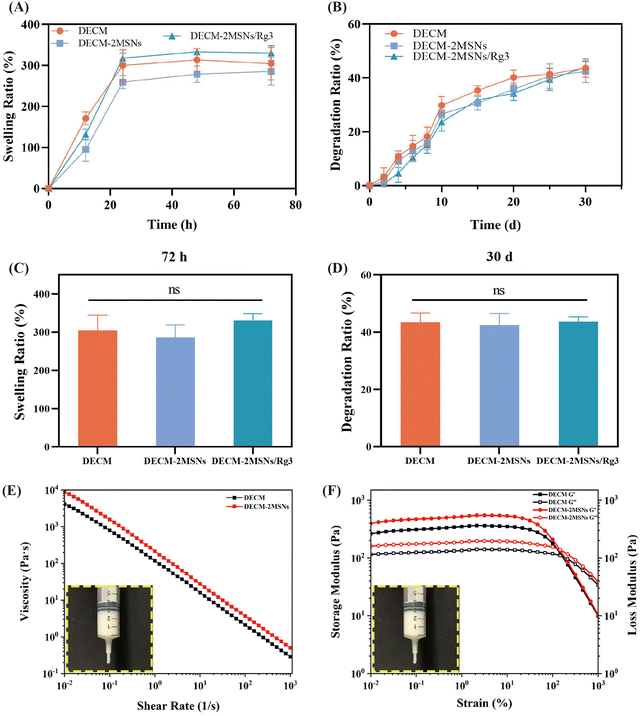
The swelling capacity of hydrogels is an essential parameter for ensuring high water absorption ability.25 As shown in Fig. 4A, the swelling ratios of all three groups of hydrogels increased with time. It exhibited a rapid increase within 24 hours and then presented a slowing trend, resulting in the hydrogels gradually reaching the swelling equilibrium. Furthermore, data analysis at 72 hours showed no significant difference in the swelling ratios of the three groups (Fig. 4C).In addition, we also assessed the degradation properties of the three hydrogel groups in PBS (Fig. 4B). The results indicated that all three hydrogel groups exhibited degradation over time, with a faster degradation rate in the initial 10 days that gradually slowed down. On day 30, the weights of DECM, DECM-2MSNs, and DECM-2MSNs/Rg3 hydrogels had decreased by 43.67%, 42.36%, and 44.04% respectively. Similar to the dissolution rate, there was no statistically significant difference in the degradation rate among the three groups (Fig. 4D).
3.5 Rheological analysis of bio-inks
Rheological properties directly affect the printing performance of hydrogels. Bio-inks with higher viscosity and appropriate strength are beneficial for maintaining the shape and stability of the printed scaffold.26Fig. 4E showed that the viscosity of all hydrogel solutions decreased with increasing shear rate, exhibiting similar shear thinning behavior, indicating that the bio-inks have rheological properties suitable for extrusion through the nozzle. Furthermore, the addition of MSNs enhanced the viscosity of the bio-ink, which was beneficial for improving the fidelity and stability of the scaffold. Subsequently, we studied the dynamic G′ and G′′ of hydrogel bio-inks at 25 °C. Fig. 4F showed that the storage modulus (G′) of both two groups was more significant than the loss modulus (G′′) over the entire strain range of 0.01–100%, indicating the solid-like rheological properties of the hydrogels and their ability to retain the shape after crosslinking.27,283.6 3D printed hydrogel scaffolds
DECM hydrogel is well known for its poor mechanical properties. In this experiment, we improved the mechanical properties of DECM by increasing the concentration of the bio-ink and controlling the temperature of the printing abutment. In addition, the introduction of MSNs would help improve the printing performance, which had been discussed in the rheological analysis. Fig. 1C and Fig. S1 (ESI†) showed that the 3D-printed DECM scaffolds had good supportability and stability. They could be folded into different shapes without obvious deformation or breakage, closely resembling the properties of natural skin. Scanning electron microscopy (SEM) images showed that both DECM and DECM-2MSN scaffolds had a continuous porous structure (Fig. 1D), which facilitates the transport of nutrients, oxygen, water, and metabolic wastes within the platform and thus promoted wound healing.293.7 Wound healing
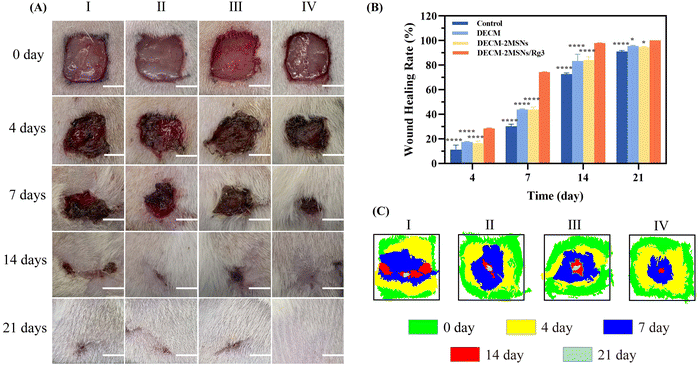
Rat models of full-thickness skin defects with an area of 1 cm2 were used to assess the effect of hydrogel scaffolds on wound healing and scar formation. The macroscopic images of wound healing at different time intervals were recorded, as shown in Fig. 5A. The wound healing rates on day 21 were 91.11%, 95.57%, and 94.70% in the control, DECM, and DECM-2MSN groups, respectively, with varying degrees of crusting on the wound surface (Fig. 5B). In contrast, the DECM-2MSNs/Rg3 group achieved a wound healing rate of 100% on day 21. In terms of wound healing area, the wounds in the DECM-2MSNs/Rg3 group were completely healed with no wounds or scars remaining, while there were still 10 mm2, 4.5 mm2, and 5.3 mm2 of unhealed wounds in the control, DECM, and DECM-2MSNs groups on day 21, which was significantly higher than the other three groups and had a flatter and smoother wound healing.3.8 Histological and immunohistochemical analysis of scar-related factors
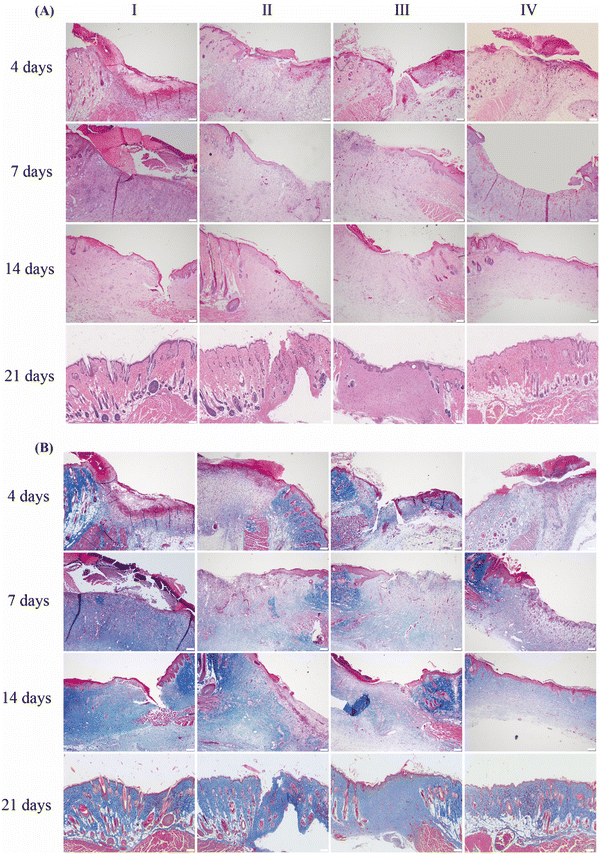
Studies have confirmed that continuous activation and proliferation of fibroblasts during wound repair, leading to excessive collagen deposition, is the biological basis of scar formation. In addition, excessive deposition of VEGF and TGF-β can also lead to pathological scar formation.30–34 Therefore, assessing the wound healing process at the molecular level is crucial to control scarring.We performed histological and IHC staining on the wound tissues to evaluate its healing characteristics. The results of H&E staining showed that the wound areas of the four groups on day 4 were mainly characterized by an acute inflammatory reaction, with varying degrees of inflammatory cell infiltration. On day 7, there was neo-epithelial hyperplasia at the wound edges and attenuated inflammatory response compared to the groups on day 4. The inflammatory reaction presented the following changing trend: control > DECM ≈ DECM-2MSNs > DECM-2MSNs/Rg3. The decreased inflammatory response in DECM-2MSNs/Rg3 groups could be attributed to the anti-inflammatory effect of Rg3. On day 14, the skin defects in the DECM-2MSNs/Rg3 group were almost completely healed, with only the skin appendages such as hair follicles and sweat glands yet to be restored. In contrast, the wounds in the other three groups were not fully healed, with incomplete epidermis and significant infiltration of inflammatory cells. On day 21, the DECM-2MSNs/Rg3 group had completely healed, exhibiting smooth and uniform regenerated epithelium with clear boundaries between the epidermis and dermis. However, the regenerated epithelium in the remaining three groups showed variations in thickness and defect area (Fig. 6A).
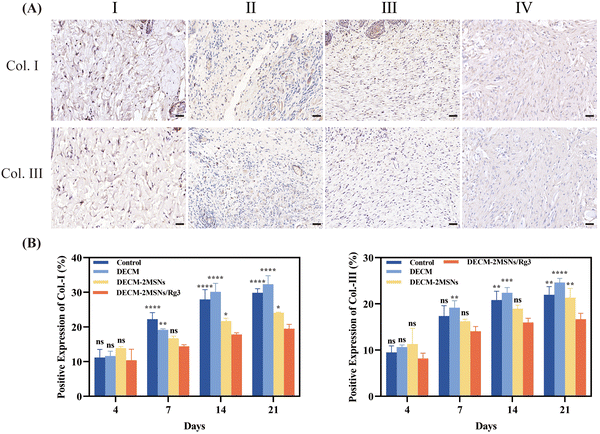
Masson's trichrome staining showed a gradual increase in collagen content from day 4 to day 21 in all four groups of wound tissue. On day 21, the control, DECM, and DECM-2MSN groups had significantly more collagen than the DECM-2MSNs/Rg3 group. Additionally, it can be observed that the collagen in the group is arranged in an orderly manner, aligning with the original collagen orientation in the skin tissue and having a similar thickness (Fig. 6B).35 IHC analysis of Col-I and III also confirmed this result (Fig. 7 and Fig. S2, ESI†). From the IHC results, we can quantitatively measure collagen deposition at the wound site. On day 21, the levels of Col-I were 29.85%, 32.3%, and 24.12% in the control, DECM, and DECM-2MSNs groups, respectively, while Col-III levels were 21.97%, 24.6%, and 21.32%. However, the content of Col-I and Col-III in the DECM-2MSNs/Rg3 group was significantly lower at only 19.4% and 16.6%, respectively. Moreover, during the later stages of wound healing, while the production of Col-I and Col-III notably accelerated in the other groups, this speed remained almost unaltered in the DECM-2MSNs/Rg3 group. Through statistical analysis, we can see that during the initial stages of wound healing, there were no significant differences in the amounts of Col-I and Col-III among the groups. However, significant differences began to appear after day 14, suggesting that Rg3 could inhibit collagen accumulation in the later stages of wound healing, thereby impeding scarring,36,37 without affecting the normal healing of the wound.
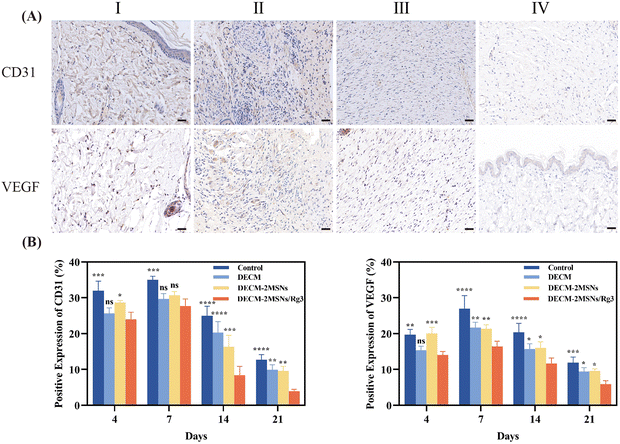
IHC staining of CD31 and VEGF in Fig. 8 and Fig. S3 (ESI†) showed that the vascular density in the wound area was significantly lower in the DECM-2MSNs/Rg3 group than in the other three groups, with an increasing trend of vascular density from day 4 to day 7 and a decrease in vascular density from day 14 to day 21. It was due to the predominant inflammatory response in the early stage of wound healing, where inflammatory cells could produce many proangiogenic mediators. On day 21, the control, DECM, and DECM-2MSNs groups had CD31 levels of 12.6%, 9.9%, and 9.5%, respectively, while the levels of VEGF were 11.9%, 9.4%, and 9.5% respectively. In contrast, the DECM-2MSNs/Rg3 group exhibited significantly lower CD31 and VEGF levels, at only 3.8% and 5.9%, respectively, which were half the levels of the other three groups. This indicates that Rg3 can reduce the formation of blood vessels during the wound healing process, preventing excessive and disordered proliferation of granulation tissue at the wound site, thereby reducing scar formation.38,39
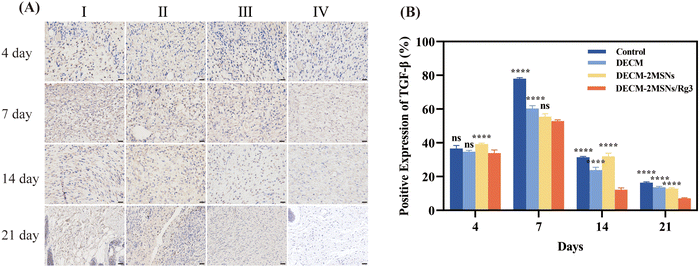
IHC staining analysis of TGF-β showed that the group with DECM-2MSNs/Rg3 had significantly lower TGF-β positive expression in the wound area than the remaining three groups and showed the same change trend as collagen content and vascular density on day 4, 7, 14, and 21 (Fig. 9). On day 21, the DECM-2MSNs/Rg3 group had a TGF-β content of only 7.0%, which is half of the average value in the other three groups (14.26%). These results suggest that Rg3 can reduce the content of vascular and TGF-β, and thus plays a potential role in inhibiting scar formation.40,41
3.9 Limitations
There may be some potential limitations in this study. For instance, the self-adhesive capability that enables printed scaffolds to adhere independently to wounds and function is not present in the scaffold prepared in this study. Therefore, it still requires traditional fixation methods for application during use. In the upcoming research phase, we plan to leverage the multi-nozzle 3D printing technology to incorporate an adhesive functional layer into this scaffold, effectively addressing the limitations of conventional scaffolds. Additionally, in future studies, we aim to explore novel Rg3 carriers, such as metal–organic frameworks (MOFs), and other drug delivery systems to enhance the scaffold's antibacterial properties by leveraging the characteristics of metal ions. Furthermore, obtaining regulatory approval for products containing bioactive substances poses a challenge for safety reasons, impeding the clinical and market advancement of related products. Hence, our next research phase will focus on modifying the microstructure and components of the scaffold to alter the wound healing microenvironment, aiming to achieve scar-free wound healing without relying solely on biofactors. It is anticipated that the outcomes of this research will offer promising prospects for clinical application.4. Conclusions
This study involves creating a temperature-sensitive DECM hydrogel scaffold using 3D bioprinting technology and integrating scar-inhibiting properties through nano-loading technology. Additionally, it presents a strategy for expanding the customization of personalized wound dressings. The scaffold demonstrates outstanding biocompatibility and enhances drug availability, resulting in a significant prolongation of its therapeutic effect. Histological and IHC evaluations confirm the scar-inhibiting efficacy of the Rg3-loaded scaffold in vivo. In conclusion, this innovative wound dressing offers a novel therapeutic approach for scar-free wound healing, and the utilization of 3D bioprinting technology extends to the field of tissue engineering. Looking forward, we anticipate that with advancements in in situ 3D printing technology and improvements in tissue cultivation and separation techniques, customized tissue-engineered skin derived from the body's own tissues without external bioactive substances could emerge as a significant research direction in the realm of skin wound healing.Conflicts of interest
The authors declare that they have no known competing financial interests or personal relationships that could have appeared to influence the work reported in this paper.Acknowledgements
Z. F. acknowledges the support from the National Natural Science Foundation of China (82272500 and 81571829), the Natural Science Foundation of Gansu Province (20JR10RA597), the Gansu Science and Technology Program (22JR11RA211), the Fundamental Research Funds for the Central Universities (lzujbky-2021-ct08 and lzujbkj-2019-ct07), the Innovation-driven Empowerment Engineering Project of Gansu province (GXH20230817-12), the Lanzhou Science and Technology Plan Project (2023-2-59), and the Open Subject Foundation of Key Laboratory of Dental Maxillofacial Reconstruction and Biological Intelligence Manufacturing (20JR10RA653-ZDKF20210101).References
- G. C. Gurtner, S. Werner, Y. Barrandon and M. T. Longaker, Nature, 2008, 453, 314–321 CrossRef CAS PubMed.
- N. Ganapathy, S. S. Venkataraman, R. Daniel, R. J. Aravind and V. B. Kumarakrishnan, J. Pharm. BioAllied Sci., 2012, 4, S334–S337 CrossRef PubMed.
- A. C. de, O. Gonzalez, T. F. Costa, Z. de, A. Andrade and A. R. A. P. Medrado, An. Bras. Dermatol., 2016, 91, 614–620 CrossRef PubMed.
- S. Jimi, A. Saparov and S. Takagi, Front. Cell Dev. Biol., 2021, 9, 659089 CrossRef PubMed.
- H. J. Lee and Y. J. Jang, Int. J. Mol. Sci., 2018, 19, 711 CrossRef PubMed.
- L. Cheng, X. Sun, C. Hu, R. Jin, B. Sun, Y. Shi, L. Zhang, W. Cui and Y. Zhang, Acta Biomater., 2013, 9, 9461–9473 CrossRef CAS PubMed.
- C. Liu, R. Lu, M. Jia, X. Xiao, Y. Chen, P. Li and S. Zhang, Chem. Mater., 2023, 35, 2588–2599 CrossRef CAS.
- J. Lv, H. Ma, G. Ye, S. Jia, J. He, W. Jiaduo, J. Ma, Y. Qu, K. Gou and R. Zeng, Mater. Des., 2023, 226, 111655 CrossRef CAS.
- Y. Xiao, D. Xu, H. Song, F. Shu, P. Wei, X. Yang, C. Zhong, X. Wang, W. E. Müller, Y. Zheng, S. Xiao and Z. Xia, Int. J. Nanomed., 2019, 14, 5989–6000 CrossRef CAS PubMed.
- L. Li, J. Ni, M. Li, J. Chen, L. Han, Y. Zhu, D. Kong, J. Mao, Y. Wang, B. Zhang, M. Zhu, X. Gao and G. Fan, Drug Delivery, 2017, 24, 1617–1630 CrossRef CAS PubMed.
- F. Ávila-Salas, A. Marican, S. Pinochet, G. Carreño, O. Valdés, B. Venegas, W. Donoso, G. Cabrera-Barjas, S. Vijayakumar and E. F. Durán-Lara, Pharmaceutics, 2019, 11, 447 CrossRef PubMed.
- Z. Li, Y. Zhang and N. Feng, Expert Opin. Drug Delivery, 2019, 16, 219–237 CrossRef CAS PubMed.
- M. H. Murdock, S. David, I. T. Swinehart, J. E. Reing, K. Tran, K. Gassei, K. E. Orwig and S. F. Badylak, Tissue Eng., Part A, 2019, 25, 663–676 CrossRef CAS PubMed.
- Y. Dong, S. A, M. Rodrigues, X. Li, S. H. Kwon, N. Kosaric, S. Khong, Y. Gao, W. Wang and G. C. Gurtner, Adv. Funct. Mater., 2017, 27, 1606619 CrossRef.
- P. F. Egan, Materials, 2019, 12, 2355 CrossRef CAS PubMed.
- A. Zaszczyńska, M. Moczulska-Heljak, A. Gradys and P. Sajkiewicz, Materials, 2021, 14, 3149 CrossRef PubMed.
- J. Wang, Y. Liu, S. Su, J. Wei, S. E. Rahman, F. Ning, G. Christopher, W. Cong and J. Qiu, Polymers, 2019, 11, 1873 CrossRef CAS PubMed.
- M. T. Wolf, K. A. Daly, E. P. Brennan-Pierce, S. A. Johnson, C. A. Carruthers, A. D’Amore, S. P. Nagarkar, S. S. Velankar and S. F. Badylak, Biomaterials, 2012, 33, 7028–7038 CrossRef CAS PubMed.
- R. I. Nooney, D. Thirunavukkarasu, Y. Chen, R. Josephs and A. E. Ostafin, Chem. Mater., 2002, 14, 4721–4728 CrossRef CAS.
- Y.-B. Zhang, X.-F. Qian, Z.-K. Li, J. Yin and Z.-K. Zhu, J. Solid State Chem., 2004, 177, 844–848 CrossRef CAS.
- J. Kim, I. Kyong Shim, D. Gyu Hwang, Y. Na Lee, M. Kim, H. Kim, S.-W. Kim, S. Lee, S. Cheol Kim, D.-W. Cho and J. Jang, J. Mater. Chem. B, 2019, 7, 1773–1781 RSC.
- T. Xu, R. Yang, X. Ma, W. Chen, S. Liu, X. Liu, X. Cai, H. Xu and B. Chi, Adv. Healthcare Mater., 2019, 8, 1900123 CrossRef PubMed.
- X. Zheng, S. Feng, X. Wang, Z. Shi, Y. Mao, Q. Zhao and S. Wang, Asian J. Pharm. Sci., 2019, 14, 275–286 CrossRef PubMed.
- W. Wang, K. Li and W. Xiao, J. Ginseng Res., 2024, 48, 129–139 CrossRef PubMed.
- D. Kim, S. Kim and S. Jung, Polymers, 2021, 13, 202 CrossRef CAS PubMed.
- F. Hafezi, S. Shorter, A. G. Tabriz, A. Hurt, V. Elmes, J. Boateng and D. Douroumis, Pharmaceutics, 2020, 12, 550 CrossRef CAS PubMed.
- C. M. C. Filho, P. V. A. Bueno, A. F. Y. Matsushita, B. H. Vilsinski, A. F. Rubira, E. C. Muniz, D. M. B. Murtinho and A. J. M. Valente, Polymers, 2020, 12, 877 CrossRef CAS PubMed.
- S. Magli, G. B. Rossi, G. Risi, S. Bertini, C. Cosentino, L. Crippa, E. Ballarini, G. Cavaletti, L. Piazza, E. Masseroni, F. Nicotra and L. Russo, Front. Chem., 2020, 8, 524 CrossRef CAS PubMed.
- X.-F. Wang, Y. Song, Y.-S. Liu, Y. Sun, Y. Wang, Y. Wang and P.-J. Lyu, PLoS One, 2016, 11, e0157214 CrossRef PubMed.
- J. T. Daniels, G. S. Schultz, T. D. Blalock, Q. Garrett, G. R. Grotendorst, N. M. Dean and P. T. Khaw, Am. J. Pathol., 2003, 163, 2043–2052 CrossRef CAS PubMed.
- H. P. Ehrlich, Adv. Wound Care, 2013, 2, 113–121 CrossRef PubMed.
- L. Ma, C. Gan, Y. Huang, Y. Wang, G. Luo and J. Wu, Burns Trauma, 2014, 2, 2321–3868 Search PubMed 130191.
- M. Monavarian, S. Kader, S. Moeinzadeh and E. Jabbari, Tissue Eng., Part B, 2019, 25, 294–311 CrossRef PubMed.
- M. Takeo, W. Lee and M. Ito, Cold Spring Harbor Perspect. Med., 2015, 5, a023267 CrossRef PubMed.
- X. Zhang, Z. Wang, H. Jiang, H. Zeng, N. An, B. Liu, L. Sun and Z. Fan, Sci. Adv., 2023, 9, eadh1415 CrossRef CAS PubMed.
- Z. Chen, L. Xiao, C. Hu, Z. Shen, E. Zhou, S. Zhang and Y. Wang, Acta Biomater., 2023, 164, 240–252 CrossRef CAS PubMed.
- X. Guo, F. Xiu, H. Bera, Y. F. Abbasi, Y. Chen, L. Si, P. Liu, C. Zhao, X. Tang, Y. Feng, D. Cun, X. Zhao and M. Yang, Carbohydr. Polym., 2023, 317, 121085 CrossRef CAS PubMed.
- S. Korntner, C. Lehner, R. Gehwolf, A. Wagner, M. Grütz, N. Kunkel, H. Tempfer and A. Traweger, Adv. Drug Delivery Rev., 2019, 146, 170–189 CrossRef CAS PubMed.
- T. A. Wilgus, Adv. Wound Care, 2019, 8, 671–678 CrossRef PubMed.
- C. M. Smith, R. Hambly, S. Gatault, L. F. Iglesias-Martinez, S. Kearns, H. Rea, V. Marasigan, K. Lynam-Loane, S. Kirthi, R. Hughes, J. M. Fletcher, W. Kolch and B. Kirby, Br. J. Dermatol., 2023, 188, 290–310 CrossRef PubMed.
- S. Chawla and S. Ghosh, Acta Biomater., 2018, 69, 131–145 CrossRef CAS PubMed.
Footnotes |
| † Electronic supplementary information (ESI) available. See DOI: https://doi.org/10.1039/d3tb02941g |
| ‡ The first two authors contributed equally to this work and should be considered co-first authors. |
| This journal is © The Royal Society of Chemistry 2024 |

