 Open Access Article
Enzyme-free detection of creatinine as a kidney dysfunction biomarker using TiO2 flow-through membranes†
Nilem
Khaliq
 ace,
Ghafar
Ali
 *b,
Muhammad Asim
Rasheed
 *a,
Maaz
Khan
 b,
Wazir
Muhammad
 d,
Patrik
Schmuki
 c and
Shafqat
Karim
 b
b
aDepartment of Physics and Applied Mathematics, Pakistan Institute of Engineering and Applied Sciences (PIEAS), Islamabad 45650, Pakistan. E-mail: masimr22@gmail.com
bNanomaterials Research Group (NRG), Physics Division, PINSTECH, Islamabad 44000, Pakistan. E-mail: ghafarali@kaist.ac.kr
cDepartment of Materials Science and Engineering, University of Erlangen-Nuremberg, Martensstrasse 7, D-91058 Erlangen, Germany
dDepartment of Physics (Medical Physics – CAMPEP Accredited), Charles E. Schmidt College of Science, Florida Atlantic University (FAU), Boca Raton, FL 33431, USA
eDepartment of Physics, Women University Swabi, Swabi, Khyber Pakhtunkhwa, Pakistan
First published on 2nd December 2024
Abstract
TiO2 nanotube flow-through membranes (TNTsM) were fabricated via anodization of Ti foil and explored as a biosensing platform for creatinine detection. The electrodes were prepared in different configurations including TNT membrane with top surface up (TNTsMTU/TNPs/FTO), TNT membrane with bottom surface up (TNTsMBU/TNPs/FTO), TNT membrane with top surface up containing nanograss (TNTsMNG/TNPs/FTO), and TNTs/NPs/FTO and TiO2 nanoparticles (TNPs) film on fluorine doped tin oxide (TNPs/FTO). Electrochemical studies depict the higher electrochemical activity (sensitivity ∼19.88 μA μM−1 cm−2) of TNTsMTU/TNPs/FTO towards creatinine compared to other configurations. This exceptional performance of the TNTsMTU/TNPs/FTO electrode results from the flow-through nature of TNTsM and the removal of the bottom oxide barrier layer through etching in H2O2. The underlying layer of TiO2 NPs also contributes to the higher current response of the TNTsMTU/TNPs/FTO. The relevance of the biosensor structural design is demonstrated by the increased amperometric response of TNTsMTU/TNPs/FTO and greater redox peak current in cyclic voltammograms. Furthermore, the higher selectivity, stability, and reproducibility of the electrode can be due to the suitable redox potential, chemical stability, and controlled fabrication process of TNT membranes.
Introduction
Creatinine detection has a significant importance due to its clinical relevance as a biomarker associated with several diseases related to renal, thyroidal, and muscular dysfunctions. It is a metabolic byproduct of creatine phosphate produced by muscles, filtered through blood by the kidneys and then excreted out of the body via urine.1,2 Typically in a healthy individual, creatinine concentration in blood serum ranges from 60 to 110 mM for men and 45 to 90 mM for women.3 The creatinine level may exceed this value up to 500 mM, which is a sign of severe renal dysfunction and requires immediate treatment such as dialysis or kidney transplant. A high creatinine level can also be an indication of drug consumption or clinical treatments e.g. acetylcholine inhibitors, cyclosporine, and chemotherapy. Therefore, careful monitoring of the creatinine level in blood and urine samples is important for assessing human health. The traditional approach for creatinine detection consists of the colorimetric Jaffe method which requires sophisticated clinical laboratories.1,4 This procedure involves reacting picric acid with the methylene moiety of creatinine in an alkaline medium. As a result, a yellowish-red solution known as a creatinine picrate complex is formed and subsequently subjected to colorimetric analysis. Even though the Jaffé method is widely used for clinical creatinine detection, temperature changes and sample pH variations can cause optical interferences and analytical errors. These interferences may cause a diagnosis to be made incorrectly. Moreover, pigmented compounds like bilirubin and specific drugs can have an impact on the colorimetric analysis.5 Consequently, there is a great deal of research being done on alternative creatinine biosensing techniques that allow for quick and accurate point-of-care analysis.1Among recent detection techniques, electrochemical biosensors have drawn a lot of attention due to their ease of handling, portability, appropriate sensitivity, low cost, miniaturized biosensing devices, flexibility for point-of-care detection, and repetitive clinical analysis.1,3,6 Most of the reports involve enzyme based electrochemical creatinine detection. The procedure involves the immobilization of multiple enzymes (e.g. creatininase and creatinase) on the electrode surface for enzymatic reactions with creatinine to detect electroactive products.7 In general, creatinine biosensors with a detectable electrochemical response are based on subsequent enzymatic reactions that measure ammonia or hydrogen peroxide, which are the major influencing species of creatine.8,9
Regarding enzyme stability, there are consistent differences in the electrochemical activity of enzymatic biosensors. The sensor needs to be calibrated as a result. The biosensor response time is also influenced by the thickness of the enzyme film.10 These electrodes, however, are sensitive, unstable, and have a narrow concentration range, which reduces the electrode specificity. This has led the scientists to uncover the magic of nanotechnology by the development of non-enzymatic biosensors using suitable nanomaterials. Among those, electrochemical biosensors are the most promising for fabricating point-of-care devices and offering higher sensitivity and stability. However, the electrode material and the fabrication process play a critical role in the performance of the biosensor.11
Sriramprabha et al. reported hydrothermally derived Fe2O3 which was distributed on a polyaniline (PANI) matrix through oxidative polymerization to form nanocomposites. The nanocomposite was pasted on the glassy carbon electrode and used for the non-enzymatic detection of creatinine in serum samples in the linear concentration range from 0.03 to 45 mM with a detection limit of 5.41 μM.12 Kumar et al. reported on the use of zwitterion-functionalized cuprous oxide nanoparticle-coated screen-printed carbon electrodes for the non-enzymatic detection of creatinine. The biosensor active material was fabricated by surface engineering of Cu2O nanoparticles with N-hexadecyl-N,N dimethyl-3-ammonio-1-propanesulfonate zwitterions. The biosensor shows a linear concentration range of 10 to 200 μM and detection limit of 5.0 μM in human serum samples.13 A flexible screen-printed carbon electrode has been explored by Manikandan and his group for the detection of creatinine in serum and urine samples.14 They opted for electrochemical activation of carbon-coated paper as an analytical device (ePAD*). The activation leads to the growth of stable carboxyl (C![[double bond, length as m-dash]](https://www.rsc.org/images/entities/char_e001.gif) O, COOH) groups on the edge planes of the carbon surface. This electrode shows a linear detection range of 0.03 to 45 mM with a detection limit of 5.41 μM. Copper based electrochemical biosensors have also been extensively explored. Mehta et al. reported electrodeposited copper nanoparticles on porous polymelamine formaldehyde for creatinine detection with a sensitivity of 3.8 mA nM−1 cm−2.15 Ashakirin and his co-workers synthesized copper nanoparticle integrating poly (methyl methacrylate–co–divinylbenzene) molecularly imprinted polymer (Cu2O@MIP) using electrodeposition. The electrode shows a sensitivity of 2.16 A nM−1 cm−2.16 The abovementioned studies used different types of nanocomposite materials with various ranges of sensitivity towards creatinine detection. However, the aforementioned materials require multiple active materials, as well as complex fabrication methods and steps. Therefore, a simple and cost-effective technique is required for fabrication of creatinine biosensors with comparable performance.
O, COOH) groups on the edge planes of the carbon surface. This electrode shows a linear detection range of 0.03 to 45 mM with a detection limit of 5.41 μM. Copper based electrochemical biosensors have also been extensively explored. Mehta et al. reported electrodeposited copper nanoparticles on porous polymelamine formaldehyde for creatinine detection with a sensitivity of 3.8 mA nM−1 cm−2.15 Ashakirin and his co-workers synthesized copper nanoparticle integrating poly (methyl methacrylate–co–divinylbenzene) molecularly imprinted polymer (Cu2O@MIP) using electrodeposition. The electrode shows a sensitivity of 2.16 A nM−1 cm−2.16 The abovementioned studies used different types of nanocomposite materials with various ranges of sensitivity towards creatinine detection. However, the aforementioned materials require multiple active materials, as well as complex fabrication methods and steps. Therefore, a simple and cost-effective technique is required for fabrication of creatinine biosensors with comparable performance.
Anodic TNTs owing to their various inherent qualities including chemical stability, affordability, and exceptional biocompatibility have attracted a lot of attention lately as a substrate material in biosensing.17–19 The anodization procedure has been used to fabricate various morphologies as it is a versatile technique and has been employed for the fabrication of highly ordered and vertically aligned TNTs.20–24 Furthermore, it provides great control over the experimental parameters which in turn defines the geometry and structure of the nanotubes, e.g. diameter, length, wall structure, thickness, and crystallinity.20,22,24 A lot of morphological variations of TiO2 nanotubes e.g. classic TNTs, bamboo-like TNTs, membranes, spaced tubes, branched tubes, and single as well as double-walled nanotubes can be achieved by varying anodizing parameters such as voltage, time, water content, nature of electrolyte, and temperature etc.24–27 The general feature of fabricating an oxide layer on the surface of metals via anodic oxidation is the good adhesion to the substrates, vertical alignment of nanotubes, and the schottky/metal type contact which facilitates directional charge flow and enhances the electrode performance in biosensing.28 Meanwhile, the morphology of the electrode material plays a determining role in biosensing as the total surface area and diffusion of the electrolyte inside the nanotubes is affected by the tube diameter, length, and wall structure.29–34 On the other hand, the electron mobility and electrical conductivity is highly dependent on the crystal phase of TNTs where anatase is considered as the highly conductive phase compared to the other two phases of TiO2 and their mixtures.35–38
The classic nanotubes (TNTs attached with a Ti-substrate) exhibit relatively higher resistivity values compared to a single TNT on a SiO2 substrate when measured via two-probe and four-probe methods.39,40 This fact can be ascribed to the rutile phase grown at the bottom of the nanotubes which reduces the conductivity by an order of magnitude. This problem can be solved by annealing TNTs after separating them from the underlying Ti-substrate in the form of membranes (free-standing TNT arrays).40 Several physical and chemical means have been employed for the separation of the TNT layer from its substrate; however, much cautions should be taken as the membranes are extremely fragile and can easily break under a small mechanical stress.41–45 It has been reported that fluoride ions play a critical role in the detachment process of TNTs from their substrate.41,45,46 During anodization, the fluoride ions due to their higher mobility pass through the compact oxide layer forming a tubular structure under the applied field and accumulate at the interface of the oxide film and metal substrate in the form of a thin layer of soluble oxy-fluoride.47 This layer can serve as a sacrificial layer and facilitate the detachment of TNT arrays. The functionality of the TNTsM is also highly dependent on the top surface morphology of the nanotube e.g. the residual oxide layer, the nanograss formation or clean and open tube tops.41,46–48 In some cases, a remnant of the initial oxide layer left over or the formation of nanograss due to the extended etching (specifically during the membrane separation process) closes the tube's top openings which restricts the diffusion of electrolyte or ionic species and are not favorable for electrochemical sensor fabrication. Here, we have presented an appropriate growth of anodic TNT layers followed by controlled chemical etching to form free-standing flow-through membranes and utilized them to study the electrochemical behavior of their different morphological orientations in creatinine biosensing.
Materials and methods
Titanium sheets with a thickness of 0.1 mm and a purity of 99.6% were purchased from GoodFellow, England, UK. Ethylene glycol (EG), ammonium fluoride (NH4F), H2O2 and transparent TiO2 paste were obtained from Sigma-Aldrich, USA. Other chemicals including creatinine, creatine, urea, glucose, and ascorbic acid (AA) were acquired from Sinopharm Chemical Regent Co. Ltd, China. De-ionized (DI) water was used in all experiments, and all the compounds were utilized as-received, requiring no additional processing.Fabrication of free-standing and flow-through TNT membranes
A highly ordered TNTsM was fabricated in EG containing 173.6 mM NH4F and 5 wt% H2O via anodization as shown in Scheme 1. Prior to anodization, Ti foil was degreased in acetone, ethanol, and DI water each for 10 min in a sonication bath (step 1). The first-step anodization was performed at 60 V for 20 min to grow a 10 μm thick nanotubular array followed by the removal of the nanotubes by sonication (step 2). The removal of the oxide layer generated during the first-step anodization leaves a pattern of the bottom of the nanotube (foot print) on the Ti-substrate which behaves as the preferred initiation sites (patterned) for the nanotube growth during the second-step anodization. The second-step anodization was carried out under similar conditions to those followed during the first-step anodization. Before any other process, the samples were annealed in air at 250 °C for 30 min in order to dehydrate the nanotubes and to increase the chemical stability of the layer (step 3). Afterwards, the samples were further anodized (step 4) for 10 min under the same experimental parameters to grow a thin nanotubular layer underneath the annealed TNT array layer. The samples were then treated with pure H2O2 solution for 1 h (step 5). The underlying nanotube layer is amorphous and was selectively dissolved in H2O2 without affecting the stable annealed upper TNT layer. This results in the detachment of the upper tubular layer from the lower Ti-substrate and a free-standing TNT layer is obtained. Further dissolution of the nanotube bottom leads to the open tube bottom morphology and flow-through membranes were obtained. The membranes having a diameter of 0.8 cm are then transferred to a porous ceramic block covered by quartz slides from the top and dried overnight (step 6). The nanotubes were then annealed at 450 °C in air for 2 h to achieve the required anatase phase keeping the membrane sandwiched between the ceramic block and quartz slide to prevent it from bending and cracking.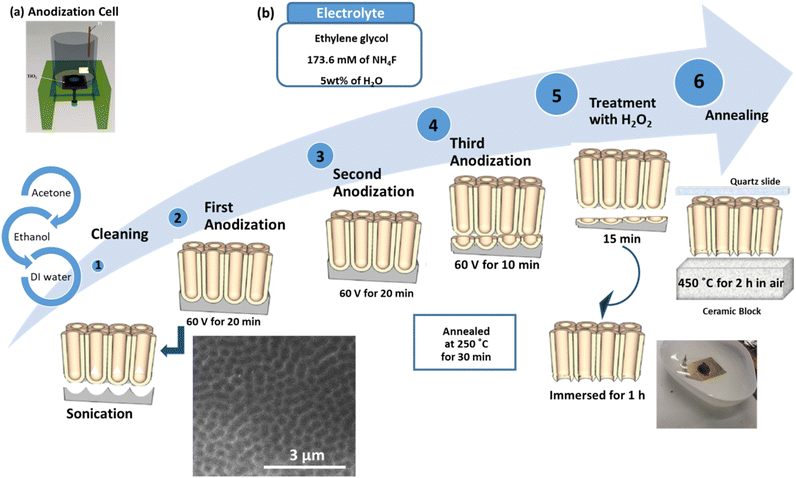 | ||
| Scheme 1 (a) Anodization cell and (b) fabrication process of free-standing and flow-through TNT membranes. | ||
Characterization
Determination of the morphology of the materials was carried out using a field emission scanning electron microscope (Hitachi FE-SEM S4800, Japan). To ascertain the chemical bonding and crystal structure of the samples, X-ray Photoelectron Spectroscopy (XPS, PHI 5600, US) and X-ray Diffraction (XRD, X'pert Philips PMD, CuKα 1.54056 Å) were employed respectively.Electrochemical studies
A Zahner instrument (IM6 ex, Germany) was used to perform electrochemical impedance spectroscopy (EIS) in the frequency range of 1 MHz to 10 mHz at open circuit potential. An electrochemical workstation (Biologic SP-300, France) was used to perform Cyclic Voltammetry (CV) and Amperometry. All the experiments were carried out in an electrochemical cell with a three-electrode configuration where TNTs and TNTsM with different configurations served as the working electrode with an exposed area of 0.35 cm2, Pt foil served as the counter electrode and saturated calomel (Hg/Hg2Cl2) was used as the reference electrode. A 0.1 M phosphate buffer solution (PBS) with pH 7.0 was used as an electrolyte for all the electrochemical studies. A stock solution of 10 mM creatinine was prepared in DI water and further diluted as per the requirement.Results and discussion
Field emission scanning electron microscopy (FESEM)
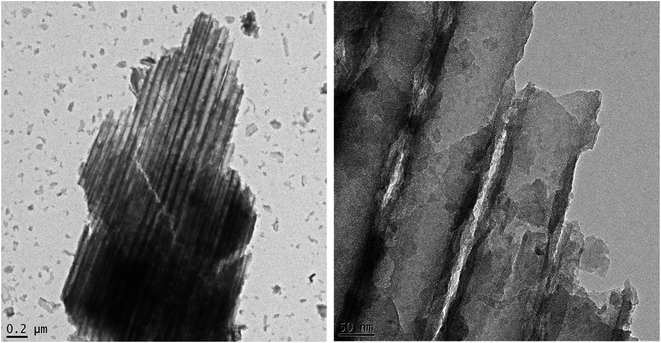
To investigate the morphology of the free-standing flow-through TNTsM, FESEM was utilized. Fig. 1a–i show SEM images of the top, bottom, and cross-sectional views of TNTs, TNTsMTU and TNTsMG. The SEM top view of the TNT layer shows close packed tube morphology with an outer tube diameter of ∼100 nm (Fig. 1a). The bottom view of the TNTs (Fig. 1b) shows densely packed nanotubes with closed tubes at the bottom of the untreated samples in any kind of etchant solution. The inset clearly shows the formation of double walled morphology at the nanotube bottom. A cross-sectional view of TNTs near the bottom is also given in supplementary data Fig. S1.† The cross-sectional view at low magnification (Fig. 1c) shows smooth nanotube wall morphology with a tube length of about 10 μm. The FESEM image of the top view of the TNT membrane (Fig. 1d) shows open nanotube morphology with comparatively thin tube walls and a relatively higher tube diameter (150 nm) compared to the TNT layer due to the treatment in H2O2 solution for obtaining a flow-through membrane. The bottom of the TNT membrane (Fig. 1e) shows homogeneously open tube bottoms to a large extent, illustrating the successful dissolution of the bottom oxide layer (barrier layer) without affecting the nanotube morphology. The bottom view also shows a double walled nanotube morphology (inset image) which is the conventional characteristic of TNTs fabricated in organic electrolytes. The inner diameter of TiO2 nanotubes at the bottom is relatively smaller than the inner diameter of the nanotubes at the top due to the conical shape formation of the nanotubes which is in line with the literature.24 The cross-sectional image of the TNT membrane (Fig. 1f) shows a smooth nanotube wall morphology which again depicts that treatment with H2O2 did not significantly alter the tube wall morphology due to its chemical stability achieved via annealing. Fig. 1g shows a SEM image of the top view of the TNT membrane after extensive etching in H2O2 solution. It shows the formation of a nanograss layer over the top surface nanotubes which covers and blocks the tube opening. The nanograss is the residue of the collapsed nanotube tops due to etching in H2O2 for a longer period of time. The bottom image (Fig. 1h) does not show much difference compared to the bottom view of the TNT membrane etched for 1 h. This fact can be ascribed to the formation of double walled morphology of the nanotube at the bottom surface which is chemically more stable than the top portion (single walled) of the membrane. The cross-sectional view (Fig. 1i) shows the rough nanotube wall morphology due to extensive etching which may increase the roughness of the nanotubes or sometimes introduce partial porosity within the nanotube walls. The cross-sectional image further depicts the thickness of the nanograss layer which is about 2 μm. The formation of smooth TNTs can be further confirmed by TEM images as shown in Fig. 2a and b. As depicted from the TEM images, the diameter of the tube is of the order of 100 nm with tube wall thickness of 15–20 nm.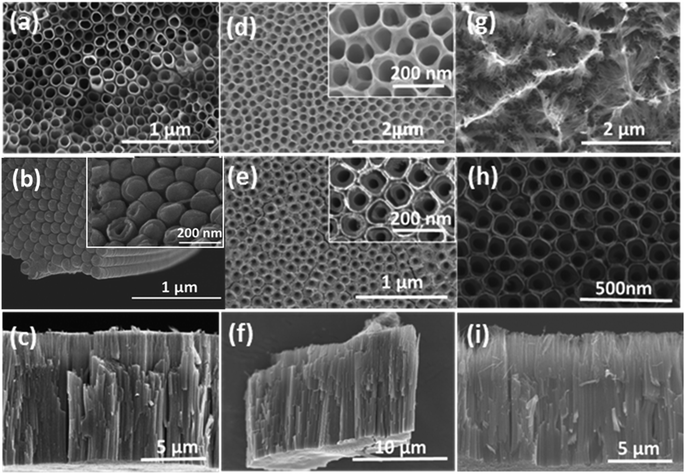 | ||
| Fig. 1 FESEM images showing (a, d and g) top, (b, e and h) bottom, and (c, f and i) cross-sectional views of (a and b) TNTs, (d and e) TNTsM, and (g and h) TNTsMNG. | ||
X-ray photoelectron spectroscopy
Fig. 3a–c show the high resolution XPS spectra of Ti 2p, O 1s, and C 1s for TNTs, TNTsMTU, TNTsMBU and TNTsMNG. The Ti 2p spectra (Fig. 3a) show two distinct peaks at around 464.20 eV and 458.73 eV which is due to the Ti 2p doublet (Ti 2p1/2 and Ti 2p3/2). The O 1s spectra (Fig. 3b) show a main peak located at ∼529.90 eV due to the metal-oxide bond and another small shoulder peak due to the adsorbed OH species or water content at the surface. Both the Ti 2p and O 1s spectra show similar trends for all samples as the main constituent of TiO2 nanotubes and membranes are Ti and O. The C1s spectra (Fig. 3c) show a major peak position at 284.90 eV while the peaks located at 286.70 eV and 288.50 eV correspond to the carbon from carbonaceous fragments of the EG adsorbed on the nanotube surface.49 Moreover, the peak at 288.50 eV is more prominent in the case of the TiO2 membrane bottom up configuration and with nanograss which can be ascribed to the double walled morphology at the tube bottoms containing an inner carbon rich layer (v-shaped) and the exposed inner wall surface due to wall splitting respectively.50,51Fig. 3d shows the deconvolution of C 1s for TNTsM. Fitting shows that the C 1s perfectly fits with three peaks with sufficient intensity.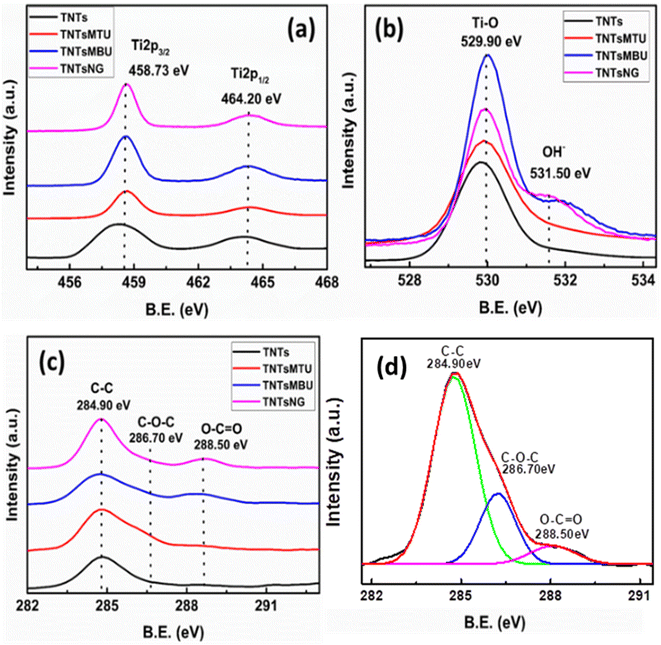 | ||
| Fig. 3 High resolution XPS spectra of TNTs, TNTsMTU, TNTsMBU and TNTsMNG for (a) Ti 2p, (b) O 1s, and (c) C 1s. (d) Deconvolution of the C 1s spectra for TNTsM. | ||
X-ray diffraction
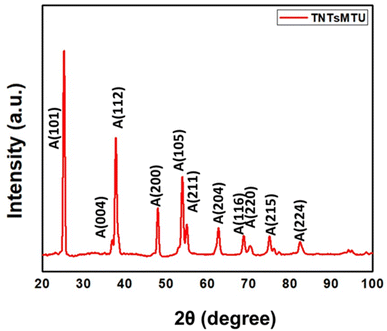
Fig. 4 displays the XRD pattern of TNTsMTU thermally treated at 450 °C for 2 h. The diffraction peaks located at 25.19 (101), 36.82 (004), 37.77 (112), 47.93 (200), 53.92 (105), 54.95 (211), 62.61 (204), 68.71 (116), 70.41 (220), 75 (215), and 82.41 (224) are indexed to the crystal planes of anatase TiO2 (JCPDS card #01-071-1166). This demonstrated that the free-standing membrane of TNTs undergoes a complete transformation from the amorphous to the anatase phase during thermal annealing at 450 °C for 2 h in air (after being removed from the Ti-substrate). Additionally, it has been previously noted that annealing of nanotubes attached to Ti metal substrates also causes the thermal oxidation of metallic Ti, which leads to the development of an undesirable rutile phase at the metal/oxide interface.52 Nonetheless, a very notable advantage provided in the case of membranes (free-standing TNTs separated from the Ti-substrate) is the transformation of anatase into rutile at much higher temperature.50 Furthermore, no notable difference in the XRD pattern was observed for other configurations of TNTsM.Fabrication of free-standing flow-through membrane based biosensing platforms
To prepare the electrode as a biosensing platform, five different electrode configurations have been achieved (Scheme 2b). The free-standing flow-through membranes were transferred to the FTO substrate in the form of a TNT membrane with top surface up (TNTsMTU/TNPs/FTO), TNT membrane with bottom surface up (TNTsMBU/TNPs/FTO), TNT membrane with top surface up containing nanograss (TNTsMG/TNPs/FTO), TNTs with closed bottom TNTs/TNPs/FTO and TiO2 NPs (TNPs/FTO) film. In order to obtain nanotubes with top surface up (TNTsMTU/TNPs/FTO) configuration, the membrane is transferred to the FTO substrate facing the tubes top of membrane upward (Scheme 2b(i)). In the bottom up configuration (TNTsMBU/TNPs/FTO), the membrane is flipped and transferred to the FTO positioning the nanotube bottom up (Scheme 2b(ii)). In the case of the membrane with collapsed residues of extensively etched nanotubes with nanograss formation, (TNTsMG/TNPs/FTO), the nanograss side is facing up (Scheme 2b(iii)). For comparison, simple TNTs were detached from the Ti substrate (with closed nanotube bottom morphology) and transferred to the FTO in the form of tube top up configuration (TNTs/TNPs/FTO) (Scheme 2b(iv)). A thin layer of commercially available TiO2 NPs is used as an adhesive medium between the membrane and the substrate in order to obtain better electrical contact as shown in Scheme 2a. As a reference, a thin layer of TiO2 NPs (with the same thickness as that used for the adhesion medium for the membrane) on FTO (TNPs/FTO) is also fabricated for electrochemical studies (Scheme 2b(v)).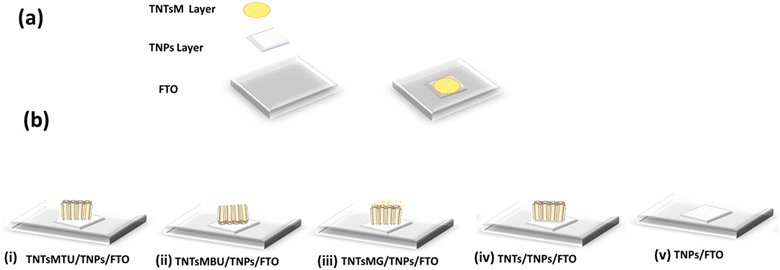 | ||
| Scheme 2 (a) Preparation procedure and (b) various configurations of the free-standing flow-through membrane based biosensing platforms. | ||
Electrochemical studies
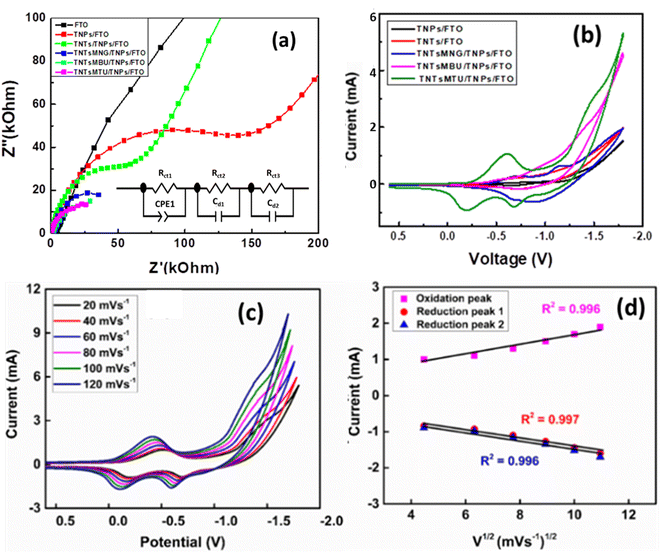
Fig. 5a shows the EIS Nyquist plots of TNTsMTU/TNPs/FTO, TNTsMBU/TNPs/FTO, TNTsMNG/TNPs/FTO, TNTs/TNPs/FTO and TNPs/FTO obtained in 0.1 M KCl solution. The results show a decrease in the arc of the semicircle of the Nyquist plots in the order TNTsMTU/TNPs/FTO < TNTsMBU/TNPs/FTO < TNTsMNG/TNPs/FTO < TNPs/FTO < TNTs/TNPs/FTO. A significant decrease in the interfacial resistance is observed for the TNTsMTU/TNPs/FTO configuration which can be due to the contribution from both the TiO2 nanotube membrane and the underlying TiO2 NP layer. Interestingly, TNTsMNG/TNPs/FTO also has considerably low resistance due to the higher surface area of the nanograss. Moreover, the interfacial resistance for the TNTsMBU/TNPs/FTO configuration is also significantly reduced. The thick barrier layer formed at the interface of the nanotube bottoms and metal surface was completely dissolved for open tube bottom morphology by treatment in H2O2 is the main reason for the lower resistance. The TiO2 NP layer on FTO exhibits comparatively lower interfacial resistance than the TNTs/TNPs/FTO. As the bottom of the simple TiO2 nanotubes remains closed, shielding the underlying adhesive TiO2 NP layer, less contribution can be added through TiO2 NPs.Electrochemical detection of creatinine on TNTsMTU/TNPs/FTO
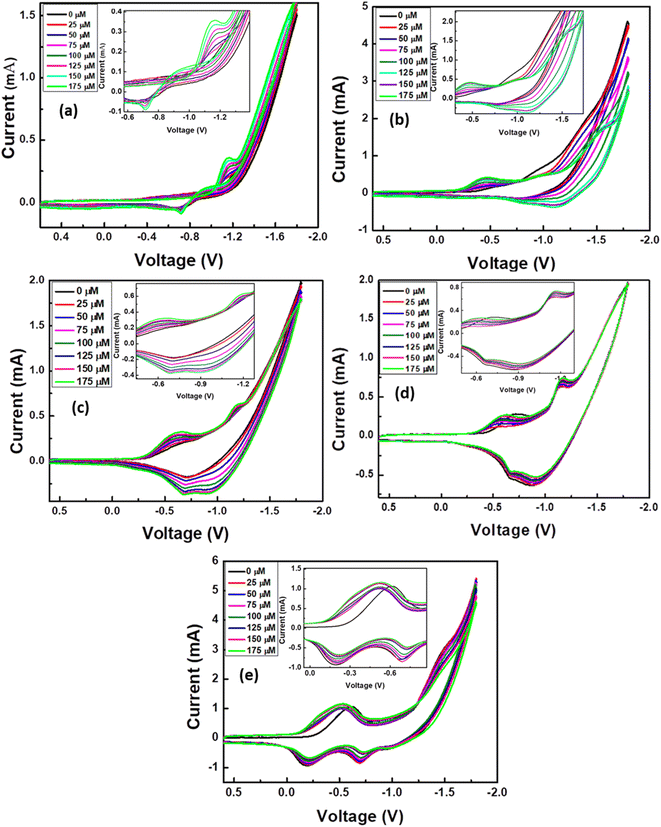
Fig. 5b shows CV of the TNPs/FTO, TNTs/TNPs/FTO, TNTsMNG/TNPs/FTO, TNTsMBU/TNPs/FTO, and TNTsMTU/TNPs/FTO electrodes in 0.1 M PBS at pH 7.0. The CV of the TNPs/FTO (black curve) electrode consists of a reduction peak at −0.67 V and an oxidation peak at −0.9 V which corresponds to the reduction of oxygen on the surface of the electrode. A similar trend is observed for TNTs/TNPs/FTO with a slight shift in the redox potential (red curve). The CV of TNTs/TNPs/FTO shows small redox peaks at −1.1 V and −0.6 V. The peak at −1.1 V can be due to oxygen reduction on TiO2 nanotubes, and the other peak is the corresponding oxidation peak in the reverse cycle. The CV curve for TNTsMNG/TNPs/FTO shows two oxidation peaks at −0.696 V and −1.137 V and their corresponding reduction peaks are observed at −0.68 V and −0.88 V. In the case of TNTsMTU/TNPs/FTO, the CV trend changes significantly and an oxidation peak at −0.6 V followed by two reduction peaks at −0.68 V and −0.21 V are observed. This fact can be ascribed to the flow-through nature of the membranes where the electrolyte can easily penetrate and pass through the membranes towards the TiO2 NPs layer which can further contribute to the response current. However, the TNTsMBU/TNPs/FTO electrodes have predominant oxidation and reduction peaks at −0.9 V and −0.7 V respectively. The intensity of the response current for TNTsMTU/TNPs/FTO is relatively higher than that of other configurations due to the higher surface area and low carbon content of the nanotubes with top up configuration compared to the nanotubes with bottom up configuration. The effect of the sweep rate on the CV of TNTsMTU/TNPs/FTO is shown in Fig. 5c. In response to the increasing sweep rate, the redox current increases with a slight shift in the redox potential. Fig. 5d shows the plot of redox peaks current vs. square root of the scan rate. A linear dependence of the redox current on the V1/2 shows the diffusion controlled process for analyte detection. TNTsMTU/TNPs/FTO offers a suitable morphology with open tube tops which facilitate electrolyte diffusion inside the flow-through membranes. Moreover, the combined synergistic effect of TiO2 NPs can cause increased electrochemical performance.The effect of adding different concentrations of creatinine to the electrolyte on the redox current for all electrode configurations is presented in Fig. 6a–e. The oxidation current increases upon increasing the analyte concentration in all electrodes illustrating an enhanced electrocatalytic performance towards creatinine detection. Insets of CV in Fig. 6 show the enlarged peak of the redox species for all images. The linear response plots for each analyte concentration vs. redox peak current for all samples have also been included and are presented in Fig. S2.† As depicted from the figure, the oxidation and reduction peak current increases upon increasing the concentration of creatinine for TNPs/FTO (Fig. S2a†), TNTs/TNPs/FTO (Fig. S2b†), and TNTsMNG/TNPs/FTO (Fig. S2c†). However, the reduction peaks for TNTsMBU/TNPs/FTO (Fig. S2d†) and TNTsMTU/TNPs/FTO (Fig. S2e†) decrease upon increasing the creatinine concentration due to increased oxygen reduction reaction.
The amperometric responses of TNPs/FTO, TNTs/TNPs/FTO, TNTsMNG/TNPs/FTO, TNTsMBU/TNPs/FTO and TNTsMTU/TNPs/FTO are presented in Fig. 7a. As depicted in CV (Fig. 5b), TNTsMTU/TNPs/FTO shows the highest response current and fast response time in response to the addition of various creatinine concentrations. This can be due to the fact that the functionality of the TNTsM is highly dependent on the top surface morphology of the nanotubes e.g. the residual oxide layer, the nanograss formation or clean and open tube tops.41,46–48 In some cases, a remnant of the initiation oxide layer left over or the formation of nanograss due to extant etching (specifically during the membrane separation process) closes the tube top openings which restricts the diffusion of electrolyte or ionic species and is not favourable for electrochemical sensors. In case of TNTsMBU/TNPs/FTO, the classic nanotubes exhibit relatively higher resistivity values.39,40 This fact can be ascribed to the bottom grown rutile phase which reduces the conductivity by an order of magnitude. This problem can be solved by annealing the TNTs after separating them from the underlying metal substrate in the form of membranes (free-standing TNT arrays).40
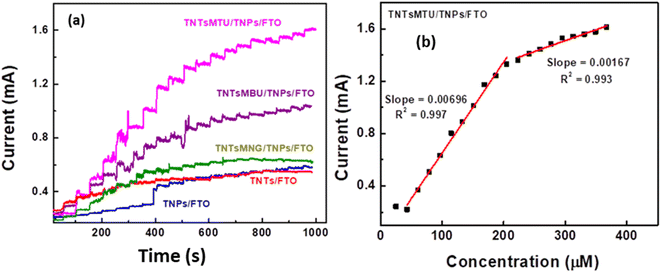 | ||
| Fig. 7 Amperometric response of TNTs upon successive addition of creatinine, (b) corresponding linear calibration curves of TNTsMTU electrodes. | ||
The calibration curves (concentration vs. response current) for TNPs/FTO, TNTs/TNPs/FTO, TNTsMNG/TNPs/FTO, TNTsMBU/TNPs/FTO and TNTsMTU/TNPs/FTO which have been extracted from their amperometric response (Fig. 7a) are presented in Fig. 7b and S3.†Table 1 shows the values of sensitivity, linear range of concentrations and low detection limit for TNPs/FTO, TNTs/TNPs/FTO, TNTsMNG/TNPs/FTO, TNTsMBU/TNPs/FTO, and TNTsMTU/TNPs/FTO. The sensitivity of the fabricated electrode is obtained by dividing the slope of the calibration curve (Fig. 7b and S3†) by the surface area of the electrode (0.3 cm2). It can be seen that the highest sensitivity of ∼2.6 μA μM−1 cm−2 is achieved for TNTsMTU/TNPs/FTO with a wider linear detection range of 25–200 μM (200–400 μM for the second part of the curve fit). All other electrode configurations show comparatively lower sensitivity towards creatinine detection with comparable linear detection range. The highest electrochemical performance of the TNTsMTU/TNPs/FTO system can be ascribed to its higher surface area, flow-through nature of the membrane which allows the diffusion of electrolyte into the nanotube channels and the combined synergistic effect of the TNT membrane and the underlying TiO2 NPs layer. Furthermore, the removed barrier layer at the tube bottom by H2O2 treatment could lead to fast electron transfer to the substrate.
| S. no. | Sample | Sensitivity | Detection range | Detection limit |
|---|---|---|---|---|
| 1 | TNPs/FTO | 2.2 μA μM−1 cm−2 | 25–151 μM and 169–259 μM | 5 μM |
| 2 | TNTs/TNPs/FTO | 4.06 μA μM−1 cm−2 | 25–133 μM and 133–313 μM | 5 μM |
| 3 | TNTsMNG/TNPs/FTO | 7.45 μA μM−1 cm−2 | 25–187 μM and 205–313 μM | 5 μM |
| 4 | TNTsMBU/TNPs/FTO | 12.85 μA μM−1 cm−2 | 25–169 μM and 187–387 μM | 5 μM |
| 5 | TNTsMTU/TNPs/FTO | 19.88 μA μM−1 cm−2 | 25–200 μM and 200–400 μM | 5 μM |
In the literature several materials have been explored for non-enzymatic sensing of creatinine. Table 2 presents a comparison of the most recently explored materials for enzyme-free creatinine detection. The table contains the values of their sensitivity, detection range and detection limit. The result shows a decent sensitivity has been offered by TNTsMTU/TNPs/FTO compared to other non-enzymatic systems. Furthermore, the higher rate of stability with promising sensitivity makes TNTsMTU/TNPs/FTO favorable for creatinine detection. Fig. 8a–e show the amperometric response of all the electrodes by adding a low concentration of creatinine. A 5 μM creatinine solution was added dropwise at different intervals of time and the corresponding current response was recorded. It is observed that all the electrodes have significant current response at very low creatinine concentrations. However, TNTsMTU/TNPs/FTO (Fig. 8e) shows higher current response compared to other electrodes.
| S. no. | Sample | Electrolyte | Sensitivity | Detection range | Detection limit | Storage stability | References |
|---|---|---|---|---|---|---|---|
| 1 | Copper nanoparticles supported over polymelamine formaldehyde eCu-PMF | PBS | 0.32 mA nM−1 cm−2 and 3.8 mA nM−1 cm−2 | 100 fM–60 mM | 15 days | 15 | |
| 2 | Pd/Cu2O/PPy nanocomposite | PBS | 0.207 μA | 0.1 to 150 μM | 0.05 μM | 200 cycles | 56 |
| 3 | Au–Ag bimetallic nanoparticles | PBS | 137.0 μA mM−1 | 0.8 mM | 57 | ||
| 4 | Zwitterion-functionalized cuprous oxide nanoparticles (Cu2O NPs) | PBS | 10 to 200 μM | 5.0 μM | 6 months | 13 | |
| 5 | MXene-supported cobalt-MOF-based nanocomposite CoMOF-MXene@CB | PBS | 1.1 μA μM−1 cm−2 | 10 to 800 μM | 0.005 μM | 60 days | 58 |
| 6 | Copper nanoparticle film on nickel foam (Cu NP film/NF) | PBS | 306 μA mM−1 cm−2 | 0.25–24 mM | 0.17 mM | — | 59 |
| 7 | Cobalt–gold bimetallic nanoparticle modified platinum electrode | PBS | 0.621 μA mM−1 cm−2 for (6.4–51.2 mM) and 1.135 μA mM−1 cm−2 for (51.2–83.2 mM) detection ranges | 6.4 to 83.2 mM | 2.25 mM | — | 60 |
| 8 | Copper nanoparticle integrating poly (methyl methacrylate-co-divinylbenzene) molecularly imprinted polymer (Cu2O@MIP) | PBS | 2.16 A nM−1 cm−2 | 0–75 nM | 22 nM | 5 weeks | 16 |
| 9 | Cu2O–Au nanohybrids | Biofluids | — | 10.0–200 μM | 0.72 μM | 180 days | 61 |
| 1.00–35.0 mM | |||||||
| 10 | TNTsMTU/TNPs/FTO | PBS | 19.88 μA μM− 1 cm− 2 | 25–200 μM and 200–400 μM | 5 μM | 45 days | Present work |
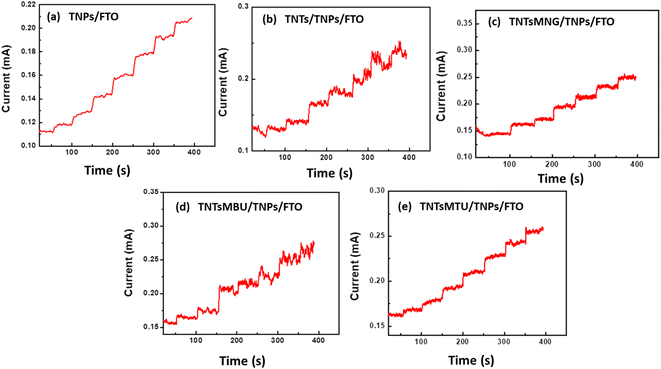 | ||
| Fig. 8 Amperometric response of (a) TNPs/FTO, (b) TNTs/TNPs/FTO, (c) TNTsMNG/TNPs/FTO, (d) TNTsMBU/TNPs/FTO and (e) TNTsMTU/TNPs/FTO at low concentrations of creatinine. | ||
TiO2 is an n-type material which converts O2 to O2−under the applied potential. O2− reacts with H2O and electrons to produce H2O2 and hydroxyl radicals (˙OH). These ˙OH radicals react with creatinine and convert it to urea through five distinct intermediates throughout the oxidation of creatinine (CRN). Demethyl creatinine (DMC), creatol (CTL), methyl guanidine (MG), guanidine (G), and urea (U) were the reaction intermediates identified in the literature.53 At first the creatinine undergoes demethylation at C-7 forming demethyl creatinine, which is followed by the synthesis of methyl guanidine. Both compounds showed rapid production rates. Since the sole reduced carbon atoms in creatinine are found at locations C-5 in the cyclic structure and C-7 in the methyl group, these places are more prone to oxidizing species reactions, including those involving hydroxyl radicals (HO˙).54,55 Thereafter, a transition phase happens at position 5, DMC is oxidized and hydroxylated, yielding guanidine in the end. Creatol also emerged right away, but its concentration stayed incredibly low, indicating that it is highly susceptible to additional oxidation. The rate of guanidine production is slow. The last unique intermediate to be detected at neutral pH is urea. However, urea (U), guanidine (G), and methyl guanidine (MG) production needs extended time to appear during the oxidation of creatinine. To further investigate the oxidation of creatinine through hydroxyl radicals at the electrode, UV-vis spectroscopy was utilized. Isopropanol was employed as the hydroxyl radical scavenger in the study. UV visible spectra of 1 mM creatinine solution were recorded and it served as the control sample as shown in Fig. S4.† The spectra show an absorption peak of creatinine at 230 nm. Another spectrum for 1 mM creatinine solution was again recorded after electrochemical analysis. This shows that the intensity of the spectra for creatinine solution after electrochemical analysis is reduced. Subsequently, 5 ml of concentrated isopropanol was added to 40 ml of electrolyte solution containing 1 mM creatinine and the corresponding electrochemical response was recorded. 2 ml of the solution was then extracted from the electrochemical cell and the UV spectra were measured. The results show that the peak corresponding to creatinine absorption (red) is lower than the peak measured for the same concentration of creatinine in the presence of isopropanol (blue) after electrochemical analysis. The same trend is recorded for 2 mM creatinine solution. The low oxidation rate of creatinine for both concentrations in the presence of isopropanol can be attributed to the quenching of hydoxyl species. Therefore, it is suggested that the hydroxyl species are the ones which stimulate creatinine oxidation.
Interference and stability of TNTsMTU/TNPs/FTO
Fig. 9a shows the effect of various interfering species on the response current of TNTsMTU/TNPs/FTO. The result depicts that the biosensor shows a negligible response current towards the injection of other interfering species within the electrolyte compared to the addition of 20 μM creatinine. Fig. 9b shows the stability data of TNTsMTU/TNPs/FTO acquired from its amperometric response. The sample was tested after regular intervals of time (7 days) for the same concentration of creatinine. The efficiency was measured with reference to the current response of the fresh electrode. After testing the same sample for six consecutive weeks the TNTsMTU/TNPs/FTO retains 92% of its activity.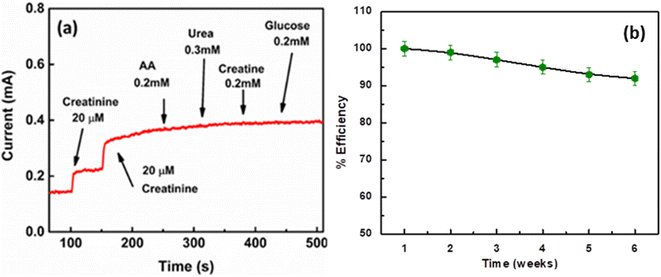 | ||
| Fig. 9 Amperometric response of TNTsMTU/TNPs/FTO upon successive addition of creatinine along with other interfering species, (b) stability response of TNTsMTU/TNPs/FTO for different time intervals. | ||
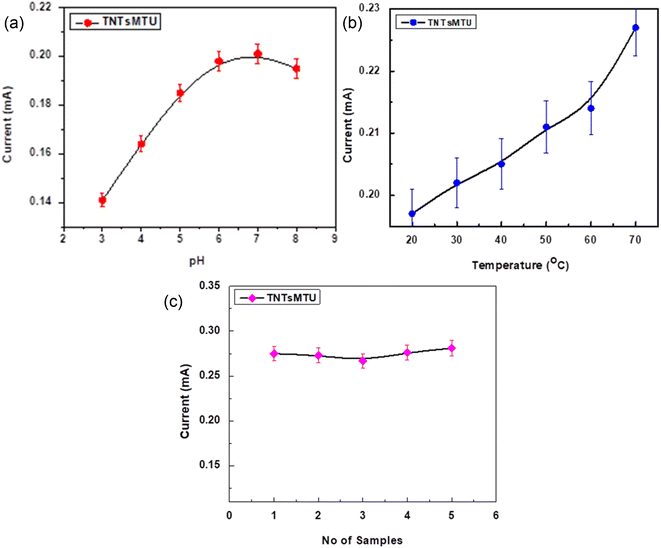
Fig. 10a shows the response current of TNTsMTU/TNPs/FTO at different values of pH. The pH of the buffer solution was adjusted from 3.0 to 8.0 to determine the maximum electrochemical response of the electrode using CV. The result demonstrates that when the electrolyte's pH is raised from an acidic to a neutral value, the peak current increases. The highest anodic current is measured at pH 7.0. The redox reaction to creatinine in basic medium is slightly reduced upon further increase in pH value. These observations explain the fast oxidation of nitrogen and demethylation of carbon at higher pH which increases nitrogen mineralization during the oxidation process. The formation of nitrates becomes slower at acidic pH and as a result MG transforms more slowly.53 Thus, all studies are conducted at pH 7.0. Fig. 10b illustrates that the sensing behavior of TNTsMTU/TNPs/FTO for creatinine detection changes in response to temperature variation. The electrode manifests a clear tendency of raising the response current due to an increase in the diffusion rate of the redox species with temperature increase. The reproducibility of TNTsMTU/TNPs/FTO was tested by fabricating five distinct samples (Fig. 10c). The results reveal a small variation in the response current (for 37 μM creatinine) with an RSD value of 1.1%. These findings demonstrate that the existing method for creatinine analysis is reliable and falls within the error limit (5%).
Real sample analysis of creatinine on TNTsMTU/TNPs/FTO
Instead of using a buffer solution, TNTsMTU/TNPs/FTO was used to analyze creatinine in real samples of human blood serum. The amperometric response current was measured after adding a certain amount of 5 mM creatinine stock solution to the electrochemical cell using the conventional standard addition method. The diluted serum samples were spiked with a known amount of creatinine and the corresponding increase in the current response was measured. A graph was plotted between the concentration of the analyte on the x-axis and the response current on the y-axis. The unknown concentration of creatinine in the serum sample has been determined by extrapolating the linear curve to the x-axis. The intercept on the x-axis gives the value of unknown concentration of the creatinine in serum. These results were then compared with the data acquired from the standard calorimetric method by taking into account the dilution factor of the serum.The concentrations measured by the suggested approach and the standard calorimetric method shown in Table 3 were compared in order to calculate the relative errors. It is evident from the results that there is good agreement between the two methods and the suggested approach is a viable means of accurately determining creatinine in human samples. The above results show the higher electrochemical activity of TNTsMTU/TNPs/FTO towards creatinine. This exceptional performance of the TNTsMTU/TNPs/FTO electrode results from the flow-through nature of TNTsMTU/TNPs/FTO and the underlying layer of TiO2 NPs. Complexation of the creatinine with TiO2 increases the anodic current response during analysis. The relevance of the biosensor structural design is demonstrated by the increase in amperometric response of TNTsMTU/TNPs/FTO and greater redox peak current in CV. All the studies with human blood serum samples were performed with the permission of the institutional ethical board and all the ethical procedures have been followed throughout the studies.
| Samples | Commercial sensor | Proposed sensor | Relative errors (%) |
|---|---|---|---|
| 1 | 60 μM | 57.5 μM | 4.1 |
| 2 | 155 μM | 163.2 μM | 5.2 |
| 3 | 230 μM | 218.7 μM | 4.9 |
| 4 | 323 μM | 323 μM | 3.8 |
Conclusions
The present findings validate the higher electrochemical response of TNT membranes with different electrode configurations compared to TNTs. The flow-through behaviour and the removal of the bottom oxide barrier layer via etching in H2O2 have significantly increased the electrochemical activity for creatinine detection. Furthermore, the higher selectivity, stability, and reproducibility of the electrode can be due to the suitable redox potential, chemical stability, and controlled fabrication process of TiO2 membranes. The idea explored here can be utilized for other applications e.g. solar cells and H2 evolution where other functional materials can be incorporated into TNT structures where localized harvesting and junction formation are required.Data availability
All the experimental data related to this work have been included in the manuscript in the form of figures and tables. The raw data will be available upon reasonable request.Author contribution
N. K., G. A. and M. A. R. conceived the idea and designed the study. N. K. and G. A. carried out experiments and performed characterization and interpreted the results. N. K. prepared the initial draft of the manuscript. M. K., W. M. and S. K. revised the initial draft and helped in its improvement by technical contributions. W. M. also helped in the processing and analyzing the data. G. A. and P. S. funded the studies and contributed in analyzing the experimental results and finalizing the manuscript. All authors were involved in the discussion and writing of the manuscript. N. K. and G. A. drafted the revised manuscript with inputs and comments from all authors.Conflicts of interest
There are no conflicts to declare.Acknowledgements
The authors gratefully acknowledge the Higher Education Commission (HEC) of Pakistan for providing financial support for this research work through grant No. (I-8/HEC/HRD/2017/17726). Financial support from DFG Germany within the framework of its Excellence Initiative for the Cluster of Excellence “Engineering of Advanced Materials” is thankfully acknowledged.References
- C. L. Gonzalez-Gallardo, N. Arjona, L. Álvarez-Contreras and M. Guerra-Balcázar, Electrochemical Creatinine Detection for Advanced Point-of-Care Sensing Devices: A Review, RSC Adv., 2022, 12(47), 30785–30802, 10.1039/d2ra04479j.
- P. Dasgupta, V. Kumar, P. R. Krishnaswamy and N. Bhat, Serum Creatinine Electrochemical Biosensor on Printed Electrodes Using Monoenzymatic Pathway to 1-methylhydantoin Detection, ACS Omega, 2020, 5(35), 22459–22464, DOI:10.1021/acsomega.0c02997.
- U. Lad, S. Khokhar and G. M. Kale, Electrochemical Creatinine Biosensors, Anal. Chem., 2008, 80(21), 7910–7917, DOI:10.1021/ac801500t.
- R. K. Rakesh Kumar, M. O. Shaikh and C. H. Chuang, A Review of Recent Advances in Non-Enzymatic Electrochemical Creatinine Biosensing, Anal. Chim. Acta, 2021, 1183, 338748, DOI:10.1016/j.aca.2021.338748.
- R. B. Jadhav, T. Patil and A. P. Tiwari, Trends in Sensing of Creatinine by Electrochemical and Optical Biosensors, Appl. Surf. Sci. Adv., 2024, 19, 100567, DOI:10.1016/j.apsadv.2023.100567.
- Z. Saddique, M. Faheem, A. Habib, I. UlHasan, A. Mujahid and A. Afzal, Electrochemical Creatinine (Bio)Sensors for Point-of-Care Diagnosis of Renal Malfunction and Chronic Kidney Disorders, Diagnostics, 2023, 13(10), 1–18, DOI:10.3390/diagnostics13101737.
- Y. Luo, T. Zhao, Y. Dai, Q. Li and H. Fu, Flexible Nanosensors for Non-Invasive Creatinine Detection Based on Triboelectric Nanogenerator and Enzymatic Reaction, Sens. Actuators, A, 2021, 320, 112585, DOI:10.1016/j.sna.2021.112585.
- M. Ortiz, M. L. Botero, A. Fragoso and C. K. O'Sullivan, Amperometric Detection of Creatinine in Clinical Samples Based on Gold Electrode Arrays Fabricated Using Printed Circuit Board Technology, Electroanalysis, 2020, 32(12), 3054–3059, DOI:10.1002/elan.202060446.
- S. K. Ponnaiah and P. Prakash, Carbon Dots Doped Tungstic Anhydride on Graphene Oxide Nanopanels: A New Picomolar-Range Creatinine Selective Enzymeless Electrochemical Sensor, Mater. Sci. Eng. Carbon, 2020, 113, 111010, DOI:10.1016/j.msec.2020.111010.
- R. Cánovas, M. Cuartero and G. A. Crespo, Modern Creatinine (Bio)Sensing: Challenges of Point-of-Care Platforms, Biosens. Bioelectron., 2019, 130, 110–124, DOI:10.1016/j.bios.2019.01.048.
- J. Hopkins, K. Fidanovski, A. Lauto and D. Mawad, All-Organic Semiconductors for Electrochemical Biosensors: An Overview of Recent Progress in Material Design, Front. Bioeng. Biotechnol., 2019, 7, 1–8, DOI:10.3389/fbioe.2019.00237.
- R. Sriramprabha, M. Sekar, R. Revathi, C. Viswanathan and J. Wilson, Fe2O3/Polyaniline Supramolecular Nanocomposite: A Receptor Free Sensor Platform for the Quantitative Determination of Serum Creatinine, Anal. Chim. Acta, 2020, 1137, 103–114, DOI:10.1016/j.aca.2020.09.004.
- R. K. Rakesh Kumar, M. O. Shaikh, A. Kumar, C. H. Liu and C. H. Chuang, Zwitterion-Functionalized Cuprous Oxide Nanoparticles for Highly Specific and Enzymeless Electrochemical Creatinine Biosensing in Human Serum, ACS Appl. Nano Mater., 2023, 6(3), 2083–2094, DOI:10.1021/acsanm.2c05020.
- R. Manikandan, J. H. Yoon, J. Lee and S. C. Chang, Non-Enzymatic Disposable Paper Sensor for Electrochemical Detection of Creatinine, Microchem. J., 2024, 204, 111114, DOI:10.1016/j.microc.2024.111114.
- D. Mehta, A. Kafle and T. C. Nagaiah, Flexible Electrochemical Sensor for Highly Sensitive and Selective Non-Enzymatic Detection of Creatinine via Electrodeposited Copper over Polymelamine Formaldehyde, J. Mater. Chem. B, 2023, 11(46), 11103–11109, 10.1039/d3tb01528a.
- S. Nur Ashakirin, M. H. M. Zaid, M. A. S. M. Haniff, A. Masood and M. F. Mohd Razip Wee, Sensitive Electrochemical Detection of Creatinine Based on Electrodeposited Molecular Imprinting Polymer Modified Screen Printed Carbon Electrode, Meas. J. Int. Meas. Confed., 2023, 210, 112502, DOI:10.1016/j.measurement.2023.112502.
- N. Khaliq, M. A. Rasheed, G. Cha, M. Khan, S. Karim, P. Schmuki and G. Ali, Development of Non-Enzymatic Cholesterol Bio-Sensor Based on TiO2 Nanotubes Decorated with Cu2O Nanoparticles, Sens. Actuators, B, 2020, 302, 127200, DOI:10.1016/j.snb.2019.127200.
- K. S. Mun, S. D. Alvarez, W. Y. Choi and M. J. Sailor, A Stable, Label-Free Optical Interferometric Biosensor Based on TiO2 Nanotube Arrays, ACS Nano, 2010, 4(4), 2070–2076, DOI:10.1021/nn901312f.
- N. Khaliq, M. A. Rasheed, M. Khan, M. Maqbool, M. Ahmad, S. Karim, A. Nisar, P. Schmuki, S. O. Cho and G. Ali, Voltage-Switchable Biosensor with Gold Nanoparticles on TiO2Nanotubes Decorated with CdS Quantum Dots for the Detection of Cholesterol and H2O2, ACS Appl. Mater. Interfaces, 2021, 13(3), 3653–3668, DOI:10.1021/acsami.0c19979.
- D. Regonini, A. Satka, A. Jaroenworaluck, D. W. E. Allsopp, C. R. Bowen and R. Stevens, Factors Influencing Surface Morphology of Anodized TiO2 Nanotubes, Electrochim. Acta, 2012, 74, 244–253, DOI:10.1016/j.electacta.2012.04.076.
- J. M. Macak, H. Tsuchiya, L. Taveira, S. Aldabergerova and P. Schmuki, Smooth Anodic TiO2 Nanotubes, Angew. Chem., 2005, 44, 7463–7465, DOI:10.1002/anie.200502781.
- J. M. Mack, H. Tsuchiya and P. Schmuki, High-Aspect-Ratio TiO2 Nanotubes by Anodization of Titanium, Angew. Chem., Int. Ed., 2005, 44, 2100–2102, DOI:10.1002/anie.200462459.
- J. M. Macak, H. Tsuchiya, A. Ghicov, K. Yasuda, R. Hahn, S. Bauer and P. Schmuki, TiO2 Nanotubes: Self-Organized Electrochemical Formation, Properties and Applications, Curr. Opin. Solid State Mater. Sci., 2007, 11(1–2), 3–18, DOI:10.1016/j.cossms.2007.08.004.
- P. Roy, S. Berger and P. Schmuki, TiO 2 Nanotubes : Synthesis and Applications Angewandte, Angew. Chemie Int. Ed., 2011, 2904–2939 CAS.
- D. Fang, Z. Luo, K. Huang and D. C. Lagoudas, Effect of Heat Treatment on Morphology , Crystalline Structure and Photocatalysis Properties of TiO 2 Nanotubes on Ti Substrate and Freestanding Membrane, Appl. Surf. Sci., 2011, 257(15), 6451–6461, DOI:10.1016/j.apsusc.2011.02.037.
- S. Ozkan, N. T. Nguyen, A. Mazare, I. Cerri and P. Schmuki, Controlled Spacing of Self-Organized Anodic TiO2 Nanotubes Selda, Electrochem. commun., 2016, 69, 76–79, DOI:10.1016/j.elecom.2016.06.004.
- G. Ali, H. J. Kim, J. J. Kim and S. O. Cho, Controlled Fabrication of Porous Double-Walled TiO2 Nanotubes via Ultraviolet-Assisted Anodization, Nanoscale, 2014, 6(7), 1–6 RSC.
- Y. Liu, B. Zhou, W. Cai, Z. Jin, Q. Zheng, X. Zhu, J. Li, J. Zhang, J. Bai and L. Li, Self-Organized TiO2 Nanotube Array Sensor for the Determination of Chemical Oxygen Demand, Adv. Mater., 2008, 20, 1044–1049 CrossRef.
- P. Xiao, Y. Zhang and G. Cao, Effect of Surface Defects on Biosensing Properties of TiO2 Nanotube Arrays, Sens. Actuators, B, 2011, 155(1), 159–164, DOI:10.1016/j.snb.2010.11.041.
- P. Xiao, B. G. Betzaida, G. Qing, L. Dawei and C. Guozhong, TiO 2 Nanotube Arrays Fabricated by Anodization in Different Electrolytes for Biosensing, Electrochem. commun., 2007, 9, 2441–2447, DOI:10.1016/j.elecom.2007.07.020.
- D. Wang, Y. Liu, B. Yu, F. Zhou and W. Liu, TiO2 Nanotubes with Tunable Morphology, Diameter, and Length: Synthesis and Photo-Electrical/Catalytic Performance, Chem. Mater., 2009, 21(7), 1198–1206, DOI:10.1021/cm802384y.
- J. Bai and B. Zhou, Titanium Dioxide Nanomaterials for Sensor Applications, Chem. Rev., 2014, 114, 10131–10176, DOI:10.1021/cr400625j.
- K. Arkusz, E. Paradowska and M. Nycz, Influence of Thermal Modification and Morphology of TiO2 Nanotubes on Their Electrochemical Properties for Biosensors Applications, J. Nanosci. Nanotechnol., 2018, 18(5), 3713–3721, DOI:10.1166/jnn.2018.14685.
- B. Munirathinam and L. Neelakantan, Role of Crystallinity on the Nanomechanical and Electrochemical Properties of TiO 2 Nanotubes, JEAC, 2016, 770, 73–83, DOI:10.1016/j.jelechem.2016.03.032.
- B. J. Morgan, D. O. Scanlon and G. W. Watson, Small Polarons in Nb- and Ta-Doped Rutile and Anatase TiO 2, J. Mater. Chem., 2009, 19, 5175–5178, 10.1039/b905028k.
- K. Pomoni, M. V. Sofianou, T. Georgakopoulos, N. Boukos and C. Trapalis, Electrical Conductivity Studies of Anatase TiO 2 with Dominant Highly Reactive { 0 0 1 } Facets, J. Alloys Compd., 2013, 548, 194–200, DOI:10.1016/j.jallcom.2012.08.136.
- Y. Furubayashi, T. Hitosugi and Y. Yamamoto, A Transparent Metal : Nb-Doped Anatase TiO2, Appl. Phys. Lett., 2005, 86, 252101–252104, DOI:10.1063/1.1949728.
- S. X. Zhang, D. C. Kundaliya, W. Yu and S. D. Niobium Doped, Intrinsic Transparent Metallic Anatase versus Highly Resistive Rutile Phase, J. Appl. Phys., 2013, 013701, DOI:10.1063/1.2750407.
- M. Stiller, J. Barzola-Quiquia, I. Lorite, P. Esquinazi, R. Kirchgeorg, S. P. Albu and P. Schmuki, Transport Properties of Single TiO2 Nanotubes, Appl. Phys. Lett., 2013, 103(17), 1–5, DOI:10.1063/1.4826640.
- M. Hattori, K. Noda, T. Nishi, K. Kobayashi, H. Yamada and K. Matsushige, Investigation of Electrical Transport in Anodized Single TiO2 Nanotubes, Appl. Phys. Lett., 2013, 102(4), 1–5, DOI:10.1063/1.4789763.
- G. Cha, P. Schmuki and M. Altomare, Free Standing Membranes to Study the Optical Properties of Anodic TiO 2 Nanotube Layers, Chem.–Asian J., 2016, 11(5), 789–797, DOI:10.1002/asia.201600523.
- G. Liu, K. Wang, N. Hoivik and H. Jakobsen, Progress on Free-Standing and Flow-through TiO 2 Nanotube Membranes, Sol. Energy Mater. Sol. Cells, 2012, 98, 24–38, DOI:10.1016/j.solmat.2011.11.004.
- Y. Hu, T. Yang, X. Wang and K. Jiao, Highly Sensitive Indicator-Free ACHTUNG RE Impedance Sensing of DNA ACHTUNG RE Hybridization Based on Poly (m -Aminobenzenesulfonic Acid)/TiO 2 Nanosheet Membranes with Pulse Potentiostatic Method Preparation, Chem.–Eur. J., 2010, 16, 1992–1999, DOI:10.1002/chem.200901870.
- L. Guo, Y. Jing and B. P. Chaplin, Development and Characterization of Ultra Fi Ltration TiO 2 Magnel Phase Reactive Electrochemical Membranes, Environ. Sci. Technol., 2016, 50, 1428–1436, DOI:10.1021/acs.est.5b04366.
- J. E. Yoo, A. Alshehri, S. Qin and M. Bawaked, Establishing High Photocatalytic H2 Evolution from Multiwalled Titanate Nanotubes, ChemCatChem, 2020, 12, 2951–2956, DOI:10.1002/cctc.202000281.
- G. Cha, M. Altomare, T. Nguyen, N. Taccardi and K. Lee, Double-Side Co-Catalytic Activation of Anodic TiO2 Nanotube Membranes with Sputter-Coated Pt for Photocatalytic H 2 Generation from Water/Methanol Mixtures, Asian Chem. Editor. Soc, 2017, 12, 314–323, DOI:10.1002/asia.201601356.
- G. Cha, M. Altomare and N. T. Nguyen, Double-Side Cocatalytic Activation of Anodic TiO2 Nanotube Membranes with Sputter-Coated Pt for Photocatalytic H2 Generation from Water-Ethanol Mixtures, Chem.–Asian J., 2017, 12, 314–323 CrossRef CAS PubMed.
- G. Cha, P. Schmuki and M. Altomarea, Anodic TiO 2 Nanotube Membranes : Site-Selective Pt-Activation and Photocatalytic H 2 Evolution, Electrochim. Acta, 2017, 258, 302–310 CrossRef CAS.
- S. Noothongkaew, O. Thumthan and K. S. An, Minimal Layer Graphene/TiO2 Nanotube Membranes Used for Enhancement of UV Photodetectors, Mater. Lett., 2018, 218, 274–279, DOI:10.1016/j.matlet.2018.02.033.
- K. Lee, A. Mazare and P. Schmuki, One-Dimensional Titanium Dioxide Nanomaterials : Nanotubes, Chem. Rev., 2014, 114, 9385–9454, DOI:10.1021/cr500061m.
- P. Roy, D. Kim, K. Lee, E. Spiecker and P. Schmuki, TiO2 Nanotubes and Their Application in Dye-Sensitized Solar Cells, Nanoscale, 2010, 2(1), 45–59, 10.1039/b9nr00131j.
- J. Xi, N. Al Dahoudi, Q. Zhang, Y. Sun and G. Cao, Effect of Annealing Temperature on the Performances and Electrochemical Properties of TiO 2 Dye-Sensitized Solar Cells, Sci. Adv. Mater., 2012, 4(7), 727–733, DOI:10.1166/sam.2012.1339.
- M. G. Antoniou, U. Nambiar and D. D. Dionysiou, Investigation of the Photocatalytic Degradation Pathway of the Urine Metabolite, Creatinine: The Effect of PH, Water Res., 2009, 43(16), 3956–3963, DOI:10.1016/j.watres.2009.06.015.
- M. G. Antoniou, J. A. Shoemaker, A. A. de la Cruz and D. D. Dionysiou, LC/MS/MS Structure Elucidation of Reaction Intermediates Formed during the TiO2 Photocatalysis of Microcystin-LR, Toxicon, 2008, 51(6), 1103–1118, DOI:10.1016/j.toxicon.2008.01.018.
- M. G. Antoniou and D. D. Dionysiou, Application of Immobilized Titanium Dioxide Photocatalysts for the Degradation of Creatinine and Phenol, Model Organic Contaminants Found in NASA's Spacecrafts Wastewater Streams, Catal. Today, 2007, 124(3–4), 215–223, DOI:10.1016/j.cattod.2007.03.054.
- A. Nagarajan, V. Sethuraman and R. Sasikumar, Non-Enzymatic Electrochemical Detection of Creatinine Based on a Glassy Carbon Electrode Modified with a Pd/Cu2O Decorated Polypyrrole (PPy) Nanocomposite: An Analytical Approach, Anal. Methods, 2023, 15(11), 1410–1421, 10.1039/d3ay00110e.
- A. Nene, C. Phanthong, W. Surareungchai and M. P. B. Somasundrum, J. Solid State Electrochem., 2023, 27(10), 2869–2875, DOI:10.1007/s10008-023-05571-1.
- D. Roy, R. Singh, S. Mandal and N. Chanda, An MXene-Supported Cobalt-MOF Nanocomposite-Printed Electrochemical Sensor with High Sensitivity for Blood Creatinine Detection in Point-of-Care Settings, Anal. Methods, 2024, 6183–6192, 10.1039/d4ay01063a.
- H. Hou, Y. Liu, X. Li, W. Liu and X. Gong, Rapid Electrodeposition of Cu Nanoparticle Film on Ni Foam as an Integrated 3D Free-Standing Electrode for Non-Invasive and Non-Enzymatic Creatinine Sensing, Analyst, 2024, 149(10), 2905–2914, 10.1039/d4an00162a.
- R. Meera, P. K. Neena, A. Pradeep, G. Nair B., S. Punathil Vasu and T. G. Satheesh Babu, Non-Enzymatic Electrochemical Detection of Urine Creatinine Using Cobalt-Gold Bimetallic Nanoparticles, J. Electrochem. Soc., 2024, 171(6), 067504, DOI:10.1149/1945-7111/ad4e71.
- R. K. R. Kumar, A. Kumar, M. O. Shaikh, C. Y. Liao and C. H. Chuang, Enzymeless Electrochemical Biosensor Platform Utilizing Cu2O-Au Nanohybrids for Point-of-Care Creatinine Testing in Complex Biological Fluids, Sens. Actuators, B, 2024, 399, 134787, DOI:10.1016/j.snb.2023.134787.
Footnote |
| † Electronic supplementary information (ESI) available. See DOI: https://doi.org/10.1039/d4na00562g |
| This journal is © The Royal Society of Chemistry 2025 |

