
 Open Access Article
 This Open Access Article is licensed under a
 Creative Commons Attribution 3.0 Unported Licence
Solving ZIB challenges: the dynamic role of water in deep eutectic solvents electrolyte†
E. Emanuele *a,
G. Batignanib,
G. Cerulloc,
G. Leitaa,
N. Madathiparambil Mohananb,
E. Maibd,
M. Martinatib,
C. Melee,
T. Scopignob and
B. Bozzinia
*a,
G. Batignanib,
G. Cerulloc,
G. Leitaa,
N. Madathiparambil Mohananb,
E. Maibd,
M. Martinatib,
C. Melee,
T. Scopignob and
B. Bozzinia
aDepartment of Energy, Politecnico di Milano, via Lambuschini 4, 20156 Milano, Italy
bDipartimento di Fisica, Universitá di Roma “La Sapienza”, Roma I-00185, Italy
cIFN-CNR, Dipartimento di Fisica, Politecnico di Milano, Piazza Leonardo da Vinci 32, I-20133 Milano, Italy
dCenter for Life Nano Science Center for Life Nano Science @Sapienza, Istituto Italiano di Tecnologia, Viale Regina Elena 291, I-00161 Roma, Italy
eDepartment of Innovation Engineering, University of Salento, Via Monteroni, 73100 Lecce, Italy
First published on 6th March 2025
Abstract
Zinc-ion batteries (ZIBs) emerge as a promising technology in the post-lithium-ion era, offering high theoretical energy density, lower manufacturing costs, and enhanced safety. Zn2+ solvation plays a crucial role in the performance and durability of ZIBs, that warrant research since they are still far from industrial standards. As far as Zn2+ solvation is concerned, in aqueous electrolytes, two types of water molecules are found: free water molecules and solvated water molecules that participate in Zn2+ solvation structure [Zn(H2O)6]2+. The free water easily reacts with metallic Zn at the electrode/electrolyte interface, leading to a range of parasitic processes that critically impact durability: hydrogen evolution, passivation, and anode shape changes. Alternative electrolytes such as Deep Eutectic Solvents (DESs) can be used to modulate the Zn solvation shell and limit free water molecules, while still preserving the green and safe characteristics of aqueous-based ones. The electrolyte–electrode interface and zinc solvation structure are effectively tuned by adjusting the hydration percentage of DES, leading to improved Zn plating and stripping processes. This study investigates the electrochemical behavior of zinc in ethaline DES with varying water contents, transitioning from water-in-salt to salt-in-water structures. Electrokinetic and electro-crystallization analyses were performed using cyclic voltammetry and chronoamperometry, complemented by galvanostatic cycling tests of Zn|Zn symmetric cells while ions speciation and DES transitions were followed by Spontaneous Raman, Stimulated Raman Scattering (SRS) and Impulsive Stimulated Raman Scattering (ISRS) spectroscopies. Moreover, in situ Surface-Enhanced Raman spectroscopy (SERS) was used to follow the interface changes and organic component degradation. The results highlight the impact of hydration on the electrochemical stability and zinc deposition mechanisms, providing crucial insights for optimizing ZIB anode performance.
1. Introduction
Lithium-ion batteries (LIBs) dominate the energy storage market due to their high energy density, long cycle life, lightweight design, and rapid charging capabilities.1 However, growing concerns regarding safety and the limited availability of lithium resources have driven the exploration of alternative energy storage systems.2 ZIBs have emerged as a promising alternative, offering substantial technological potential. These advantages include high theoretical energy density, cost-effective manufacturing, abundant raw materials, and enhanced safety features.3–5 ZIBs typically operate with neutral or weakly acidic aqueous electrolytes, but face several challenges, such as hydrogen evolution, passivation, and shape changes at the Zn anode.6,7In aqueous electrolytes, water molecules exist in two forms: free water molecules and solvated water molecules that participate in the Zn2+ solvation structure, [Zn(H2O)6]2+. The solvation effect weakens the O–H bond, accelerating water decomposition during zinc deposition, while free water easily reacts with metallic Zn at the electrode|electrolyte interface, leading to the aforementioned irreversible processes.8,9
Reducing the number of free water molecules in the electrolyte is thus critical for minimizing side reactions and improving Zn plating/stripping reversibility. DESs offer a potential alternative to aqueous electrolytes, allowing modulation of the Zn solvation shell while retaining the environmentally friendly and safe properties of water-based systems. DESs are mixtures of two components: a hydrogen bond donor (e.g., amides, carboxylic acids, or polyols) and a hydrogen bond acceptor (e.g., quaternary ammonium salts), forming a eutectic mixture with a melting point lower than that of the individual components.10 DESs share similar properties with ionic liquids (ILs), such as good thermal stability, low vapor pressure, and high electrochemical stability, but with advantages such as lower cost, non-toxicity, and biodegradability.11–14
Although DESs have many advantageous properties for battery applications, their sluggish kinetics, high viscosity and low ionic diffusivity pose significant challenges for electrochemical applications.15 To address these drawbacks, water can be added as a cosolvent to reduce viscosity and increase the diffusion coefficient of electroactive species without disrupting the eutectic structure, up to a hydration limit of 40–50 vol%.16 The addition of water to DES can modify both the electrolyte–electrode interface (tuning the thickness) and the Zn2+ solvation structure. It is thus crucial to develop a grasp over the tuning capabilities of the solution chemistry and of the electrode–electrolyte interfacial structure and chemistry. In principle, the combined use of DES and water provides a flexible tool to achieve this goal.
Ibrahimi et al. demonstrated that the addition of a cosolvent to a ChCl/Urea DES solution significantly alters zinc deposition kinetics, affecting the nucleation process and shifting from a 2D nucleation mechanism in pure DES to a 3D progressive nucleation mechanism with the cosolvent.17,18 Water acts as an effective cosolvent, reducing viscosity and enhancing conductivity, forming a “water-in-eutectic” structure. However, beyond a certain hydration level, the system transitions from a “water-in-eutectic” structure to a typical aqueous solution, making careful hydration control crucial.19
Batteries cycled with controlled hydration levels demonstrate better cycling performance compared to anhydrous systems.20–24 For example, Yang et al. reported that a hydrated DES (Zn(ClO4)2·6H2O/SN) achieved dendrite-free Zn plating/stripping with a 98% cathodic efficiency and stable polarization voltage.22 Similarly, Han et al. demonstrated that Zn(ClO4)2·6H2O/MSM electrolytes enabled stable Zn plating/stripping for over 2000 hours at 0.05 mA cm−2, with stable voltage even at high current densities (2 mA cm−2).20 In other studies, cells with Zn(TFSI)2-sulfonane-H2O electrolytes cycled stably for over 8800 hours at 0.5 mA cm−2 and over 9600 hours at 1 mA cm−2,21 and cells using Znotf/EG/H2O maintained stable performance for 4500 hours at higher current densities.23
Despite these promising results, the role of water in DES remains unclear, with claims suggesting that no “free” water exists in these systems. Instead, water molecules are believed to interact directly with DES components in a “confined” state within the eutectic framework.24 Water increases conductivity, ion diffusivity, and dissociation, leading to a lower activation energy and improved reaction kinetics. A finely tuned water-deficient solvation structure has been shown to enable high ion dissociation while suppressing detrimental water activity.23 For example, Shi et al. demonstrated that zinc electrodeposition involves successive desolvation reactions, with the aquo complex desolvation energy being lower than that of other species.25 Abbott et al. further studied Zn coordination in ChCl/U and ChCl/EG DESs, showing that when ZnSO4 is dissolved in anhydrous ethaline, [ZnCl4]2− is formed and stabilized by choline.16,26 Our previous work27 revealed unusual voltammetric behavior due to Zn2+ coordination in DESs, characterized by a cathodic peak corresponding to Zn deposition from an intermediate Zn species (Z), formed through the reduction or deprotonation of choline chloride (ChCl) and/or ethylene glycol (EG). In ref. 27, we investigated the effect of different cathodic materials on the kinetics of Zn electrodeposition. However, a mechanistic understanding of the effect of water on the eutectic network and Zn solvation, as it relates to electrochemical performance, was completely lacking.
While several studies have reported improved cycling stability in hydrated DES systems, to the best of our knowledge, the unusual voltammetric behavior and potential-time transients observed in hydrated DES electrolytes have not been extensively explored.
In this study, we investigate the electrochemistry of Zn in ethaline (DESEG) with varying water contents (0 wt%, 1 wt%, 3 wt%, 10 wt%, 20 wt%, and 50 wt%), transitioning from a “water-in-salt” structure to a “salt-in-water” structure. Our goal is to understand the role of water in Zn coordination, the eutectic structure, and the formation of the Z intermediate. Electrokinetic and electro-crystallization studies were conducted using cyclic voltammetry (CV) and chronoamperometry (CA), complemented by galvanostatic cycling tests in Zn|Zn symmetric CR2032 coin cells. Additionally, the Zn solvation structure was investigated using a combination of vibrational spectroscopies, including Spontaneous Raman, Stimulated Raman Scattering (SRS), and Impulsive Stimulated Raman Scattering (ISRS). Interfacial changes and decomposition of the electrolyte were followed by in situ Surface-Enhanced Raman Spectroscopy (SERS). This multi-technique approach provides valuable insights into the Zn plating reaction and offers a framework for optimizing DES hydration, reducing free water content, and mitigating the main drawbacks associated with eutectic electrolytes.
2. Materials and methods
2.1. Synthesis of deep eutectic solvents
![[thin space (1/6-em)]](https://www.rsc.org/images/entities/char_2009.gif) :1 molar ratio) at a temperature of 70 °C for 1 h until a homogeneous colorless solution was obtained. Then, ZnSO4 was added to ethaline to obtain a 0.3 M solution used as electrolyte for coin cell cycling.
:1 molar ratio) at a temperature of 70 °C for 1 h until a homogeneous colorless solution was obtained. Then, ZnSO4 was added to ethaline to obtain a 0.3 M solution used as electrolyte for coin cell cycling.2.2. Coin cell fabrication
Cycling tests were carried out in symmetric CR2032 coin cells. The electrodes were Zn disks 12 mm in diameter, punched from 250 μm thick foil. The separator consisted of glass microfiber disks 19 mm in diameter and 260 μm thick. An amount of 120 μL of electrolyte, prepared as described in Section 2.1.1 and 2.1.2, was added to the cell.2.3. Electrochemical measurements
2.4. Electrolyte characterization
The pump and the probe pulses used for the broadband ISRS experiment34–37 are synthesized from a Yb laser, which generates 1030 nm pulses at a 20 kHz repetition rate and with an energy of 0.5 mJ. The pump is obtained by a home-made non-collinear optical parametric amplifier,29 which generates ultra-broadband (700–1000 nm) pulses,38 compressed down to 10 fs by a pair of chirped mirrors.39 The fluence is controlled by a variable attenuator and the energy acting on the sample is maintained below 800 nJ per pulse. The broadband probe pulse is synthesized using the same method as in the SRS experiments, by focusing a small fraction (approximately 1 μJ) of the laser beam onto a 3 mm sapphire crystal, obtaining a broadband white light continuum. The pump and the prob pulses are then focused onto the sample in a non-collinear geometry (∼5°).
3. Results and discussion
The electrokinetic and electrode reaction processes governing Zn electrodeposition in ethaline, with varying degrees of hydration, were investigated using CV on both stationary and rotating disk electrodes, as well as CA measurements.Initially, stationary CV was performed using ethaline without ZnSO4 at 30 °C, under different hydration levels (Fig. 1, panel B). The scan started cathodically from −1.25 V vs. Ag/AgCl (to prevent Zn electrode corrosion) and extended to −1.8 V, at a scan rate of 10 mV s−1.
 | ||
| Fig. 1 (A) schematic representation of solvation regimes presents in eutectic solvents, the transition of the eutectic/H2O systems from a “water-in-eutectic” to an ordinary “aqueous solution” regime. (B) Cyclic voltammograms performed at 10 mV s−1 on stationary Zn electrode of pure ethaline DES with different percentage of water content. (C) Cyclic voltammograms performed at 10 mV s−1 on stationary Zn electrode of 0.3 M ZnSO4 DESEG with different water contents. (D–F) Cyclic voltammograms performed at 10 mV s−1 on RDE electrode of 0.3 M ZnSO4 DESEG with 0%, 10% and 20% water fractions, respectively. | ||
The cathodic potential limits reported for anhydrous DES EG are attributed to the reduction of choline ions (Ch+) or ethylene glycol. As described in our previous work,27 quaternary ammonium salts can undergo electrochemical decomposition, leading to the formation of trimethylamine and ethanol radicals or dimethylaminoethanol and methyl radicals. Furthermore, the trimethylamine formed can be deprotonated by either OH− or H˙, forming HCN.
When water is added to the anhydrous eutectic electrolyte, an increase in current density is observed along with a slight decrease in the electrochemical stability window (ESW). The widening of the ESW can be achieved due to the suppression of water splitting in low-hydration electrolytes. In contrast, water clusters and free-water molecules in highly hydrated eutectic electrolytes promote the transfer of protons/hydroxides, thus favoring the hydrogen evolution reaction (HER).
When water is added into the hydrogen bond network of the eutectic system, intrinsic H2O–H2O hydrogen bonds break, forming clusters of choline–H2O and chloride–H2O hydrogen bonds. Consequently, water hydrates the pure DES by sequestering around the cholinium cation and chloride anion, although the DES structure remains intact up to a water content of approximately 40–50%.40 The observed mechanisms can be summarized as shown in Fig. 1A. The newly formed clusters limit the diffusion and separation of proton/hydroxide ion products, inhibiting water activity. Additionally, the stronger O–H bond in H2O, due to the formation of choline–H2O and Cl–H2O bonds (disappearance of the Raman stretching band at 3628 cm−1), further increases the difficulty of water splitting.
The hydrated electrolytes show a higher current density compared to the anhydrous one, primarily due to differences in viscosity. The high viscosity of anhydrous DES arises from the hydrogen bonds and van der Waals interactions that limit ion and molecular mobility, increasing resistance to fluid flow.41 Hydration, on the other hand, reduces viscosity by decreasing the number of HBA–HBD hydrogen bonds per molecule as water content increases, facilitating ion mobility.42
Cyclic voltammograms of ethaline with 0.3 M ZnSO4 are shown in Fig. 1 (panel C). This study focuses on the Zn deposition process and, therefore, the cathodic electrode reactions. The voltammetric response varies depending on the water content in the electrolyte. Arrows and numbers are added to track the CVs behavior during the scan.
When ZnSO4 is dissolved in anhydrous ethaline, the [ZnCl4]2− species is formed and stabilized by choline. The specific coordination of Zn2+ results in unique voltammetric behavior, characterized by backward cathodic peak in the cathodic branch.27
Although tetrachlorozincate is the dominant species, it does not appear to be the complex from which Zn is deposited, as [ZnCl4]2− has a highly negative reduction potential. Mechanistic studies of Zn electrodeposition onto various cathodic materials suggest that the metal is formed via the reduction of an intermediate Zn-containing species (Z). The organic components of the eutectic solvents can be dehydrogenated at negative potentials, forming RO−, which can replace one or more chloride ligands in [ZnCl4]2−. As a result, the intermediate species Z is formed, and the corresponding peak appears only in the backward scan, after the potential has reached the voltage required for the formation of RO−.27
Previous in situ SERS studies of the DES-EG|Au interface revealed that at potentials lower than −1.5 V vs. Ag/AgCl, CN− groups were adsorbed onto the electrode surface and desorbed at positive potentials.
Therefore, at potentials below −1.5 V vs. Ag/AgCl, two concurrent effects occur: the reduction of the electrolyte and the blocking of the electrode surface. When the surface is blocked, potentially by degradation products of the DES or adsorbed hydrogen, depending on the hydration, as evidenced by the appearance of a new peak at 2045 cm−1 in the DESEG|Au interface SERS data (reported below), the concentration of Z in the diffusion layer increases.
As the scan moves toward more positive potential, the blocking layer desorbs, allowing zinc deposition from Z, as shown by a reduction peak in the backward scan.
When water is added, a low current density forward peak becomes visible, and this behaviour remains consistent up to a water content of 10% wt. Notably, the peak current is always highest during the reverse scan.
At 20% wt, the voltammograms show a cathodic peak on the initial cathodic sweep, unlike those recorded with less hydrated DES. This phenomenon is likely due two concurrent effect: a reduced ESW and a less blocked electrode surface. As stated above, the narrow ESW found with higher hydration is due to water decomposition. Water molecules hydrogen-bonded to DES components can be reduced at cathodic potentials, forming H˙ radicals, which may participate in the decomposition of organic components. This side reaction can generate RO− ligands at less negative cathodic potentials that contribute to the formation of the Z intermediate increasing the number of reactants that undergo reduction already in the forward scan. Moreover, SERS measurements revealed that at 20% wt, only the peak related to Au–H stretching is present.
At 50% wt the reduction peak is already present in the ongoing scan with an increased current density. As hydration increases in the eutectic system, Zn2+ coordination changed, forming [ZnCl3(H2O)]− (this will be discuss better on the basis of Raman measurements). The water molecule in the Zn2+ coordination sphere has a lower energy barrier than chloride for stepwise desolvation, meaning [ZnCl3(H2O)]− has a lower dissociation energy than [ZnCl4]2−, resulting in faster desolvation and reduced nucleation overpotentials. The increased current density is therefore, attributed to the following processes: (i) higher concentration of the Z species in the bulk electrolyte; (ii) the reduced electrode surface blocking, enabled by water contents of 20%wt and higher and (iii) the change in Zn solvation environment in the hydrated electrolyte.
To better understand the role of the Z intermediate in Zn deposition, we performed Rotating disk electrode (RDE) voltammetry on a glassy carbon electrode. RDE measurements reported in Fig. 1, (panel D–F) displays similar voltammetric behavior as observed in stationary conditions from our previous study27 and CVs at a Zn electrode, reported above. Specifically, a cathodic peak appears only during the reverse scan toward positive potential. When the water concentration is kept below 10%, the current density of the reverse cathodic peak decreases as the rotation speed increases. This supports the hypothesis of the formation of a Z intermediate species. When the ligand RO− or the intermediate species Z are formed, they are transported away from the electrode surface to the bulk solution by hydrodynamic forces, leading to a decrease in Zn deposition as the rotation speed increases.
At 20% water content, RDE measurements revealed an increase in the cathodic peak current, which grows with increasing rotation speed—contrary to the trend seen in less hydrated electrolytes. This suggests that the Z species are present at higher concentrations or already in the bulk electrolyte, supporting the hypothesis of a higher concentration of RO− ligands. These findings align with the mechanistic study by Vieira et al., which observed similar behavior when NaOC2H5 was added to a ChEG DES.43,44
Notably, no limiting current plateau was observed, even at higher rotation speeds, possibly indicating a slow adsorption/desorption process at the electrode surface.
Building upon the CVs and RDE results, CA measurements were conducted to provide additional insight into the kinetics of Zn deposition and the role of water in modifying electrochemical processes.
In Fig. 2, potential-time transients obtained by imposing current densities of 0.5 mA cm−2 and 1 mA cm−2 for 1800 s are reported. These conditions were selected for comparison with the cycling experiment detailed further on.
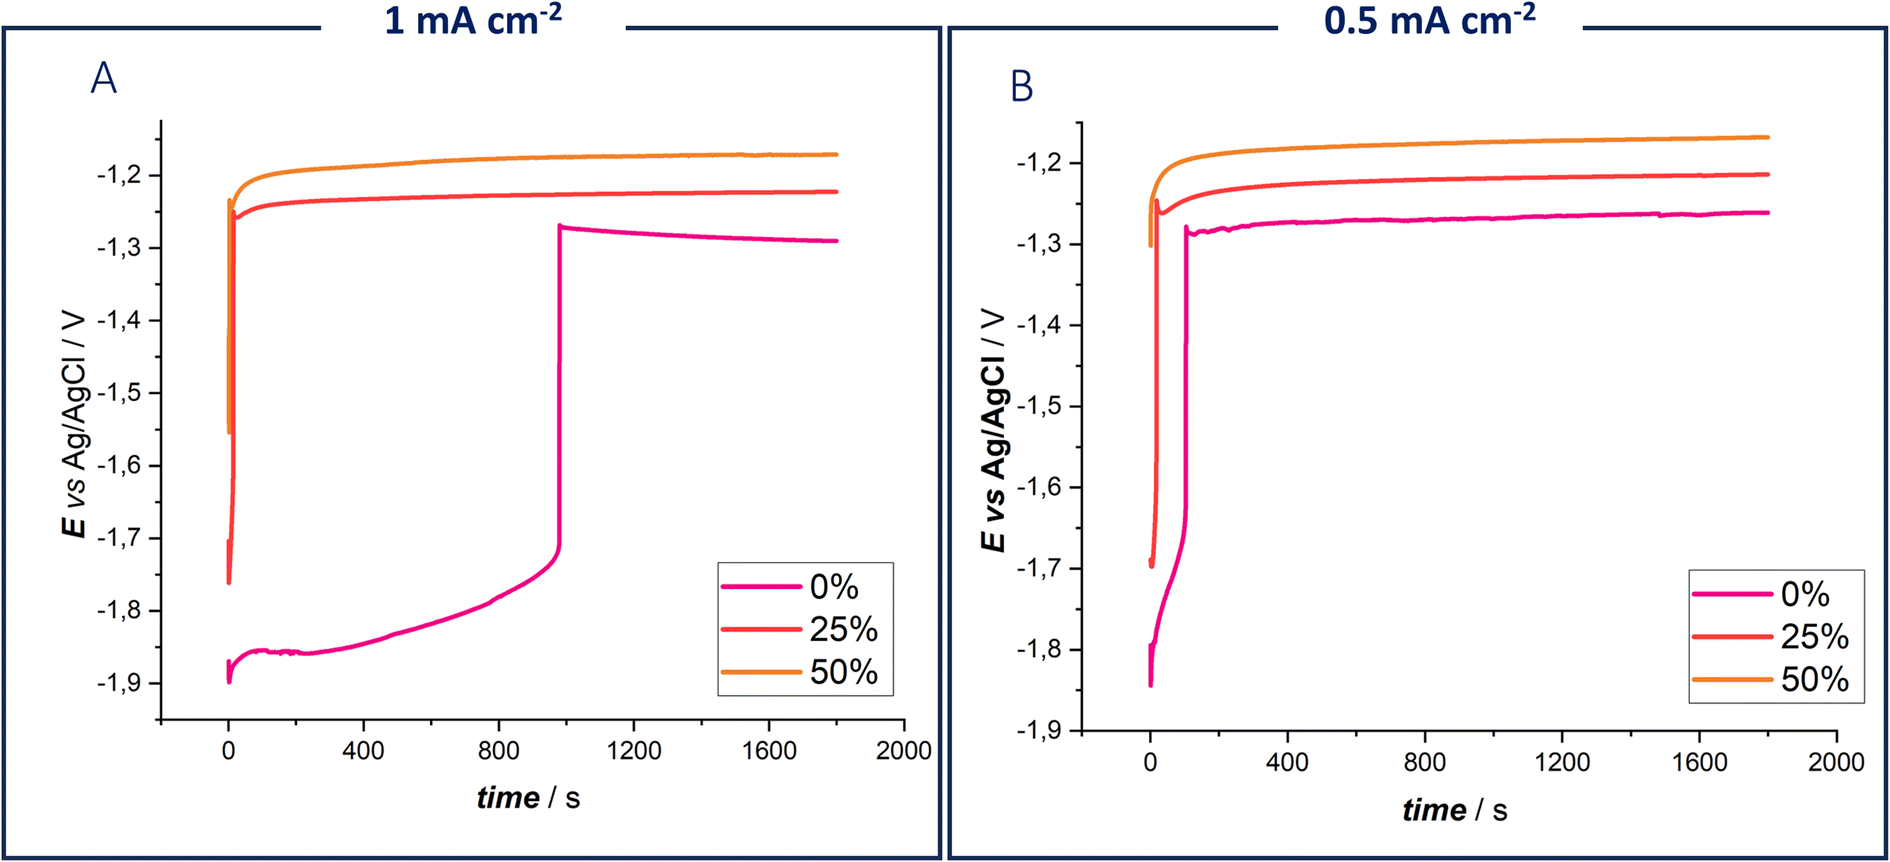 | ||
| Fig. 2 Chronopotentiograms of 0.3 M ZnSO4 DES EG with 0%, 10% and 20% water fractions, using a Zn electrode at 25 °C at 1 mA cm−2 (A) and 0.5 mA cm−2 (B). | ||
The measurements revealed that, in the absence of water, the chronopotentiometry curve exhibited a higher initial potential before transitioning to a lower one. This effect becomes more pronounced with increasing current density (Fig. 2, panel A). Anhydrous DES requires an initial initiation step, which supports the hypothesis of forming an intermediate Z species. This initiation step begins at −1.9 V vs. Ag/AgCl, coinciding with the electrochemical potential window reported in Fig. 1B. The increased concentration of intermediate Zn species in the diffusion layer, due to both the desolvation process and electrolyte reduction, is evident in the chronopotentiometric response. It can be concluded that Zn deposition commences only when a sufficient amount of Z species is formed. These findings confirm the dual role of water in modifying Zn coordination and facilitating Zn deposition, as observed in the voltametric studies.45
To explore from the spectroscopic viewpoint the influence of water on Zn coordination, hydrogen bonds, and its activity, spontaneous Raman spectroscopy (SR), Stimulated Raman spectroscopy (SRS) and Impulsive Stimulated Raman Spectroscopy(ISRS) were carried out. In Fig. 3, spontaneous Raman spectra of DESEG with different water contents are reported. To maintain the concentration of Zn2+ constant, the hydration level was adjusted by adding a 0.3 M ZnSO4 solution. Distinct shifts in peak frequencies and intensities are observed in the low-wavenumber region related to ν(Zn2+–ligand) 250–350 cm−1 and ν(SO42−) 920–1000 cm−1, as well as in the high-wavenumber region related to ν(O–H) 3000–3800 cm−1. These shifts are indicative of evolving hydrogen bonding networks and solvation dynamics with differing hydration levels.
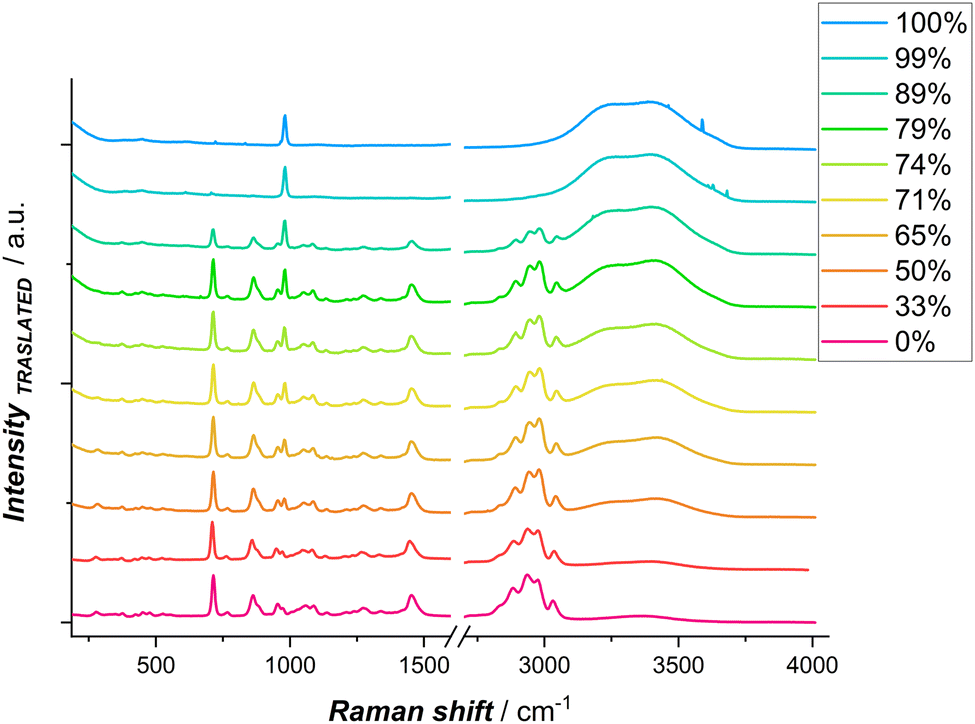 | ||
| Fig. 3 Spontaneous Raman spectra of DESEG-H2O hybrid electrolytes with different wt% (0%, 50%, 65%, 71%, 74%, 79%, 89%, 99% and 100%); the spectra are shifted vertically for clarity. | ||
In a dilute ZnCl2 aqueous solution, chlorine anions exist as free ions. In such systems, the solvation shell of Zn2+ is predominantly characterized by water molecules, forming [Zn(H2O)6]2+, which exhibits a Raman peak at ∼390 cm−1.46,47 Other possible cations present include [ZnCl(H2O)5]+ or [ZnCl(H2O)3]+, where one chlorine anion is found in the first solvation shell of Zn2+. Additionally, various Zn–Cl species may exist in aqueous solution, such as ZnCl2, [ZnCl3]−, [ZnCl4]2−. The [ZnCl4]2− ion predominates when an excess of chloride anions is present, as is the case in ethaline, exhibiting a characteristic peak around 275–290 cm−1.
In order to explore hydration and ion-paring in DESEG electrolyte, we compared pure anhydrous ethaline, in which no Zn–ligand signal is present, and anhydrous ethaline with different concentrations of ZnSO4. A ZnSO4 (0.3 M) solution, in which no chloride complex formation occurs, was chosen to enable the identification of differences in Raman shift. The specific choice of sulfate stems from the fact that a polyatomic anion like sulfate with different coordination interaction leads to significant changes in the spectrum of the complexed sulfate. Hence, it becomes feasible to distinguish between bands corresponding to uncomplexed sulfate and those associated with the complexed form.
Spontaneous Raman Spectra of Anhydrous ethaline measured with different ZnSO4 concentration are reported in Fig. S2.† Interestingly, at 0.1 M ZnSO4 a new peak appears at 279 cm−1, which is assigned to [ZnCl4]2−.46,48–53 Raman studies with different concentrations of ZnCl2 by Medea et al.50 assigned vibrational modes at 277, 283 and 300 cm−1 to [ZnCl4]2−, [ZnCl3]− and ZnCl2 respectively. When the water fraction is increased in the eutectic network, the peak at 279 cm−1 is blue shifted (Fig. 4A–C). The blue shifted peak indicates a shorter Zn–Cl bond length, which can be attributed to the formation of lower complex ions: water molecules enter the first sheath of the Zn coordination shell forming [ZnCl3(H2O)]−.
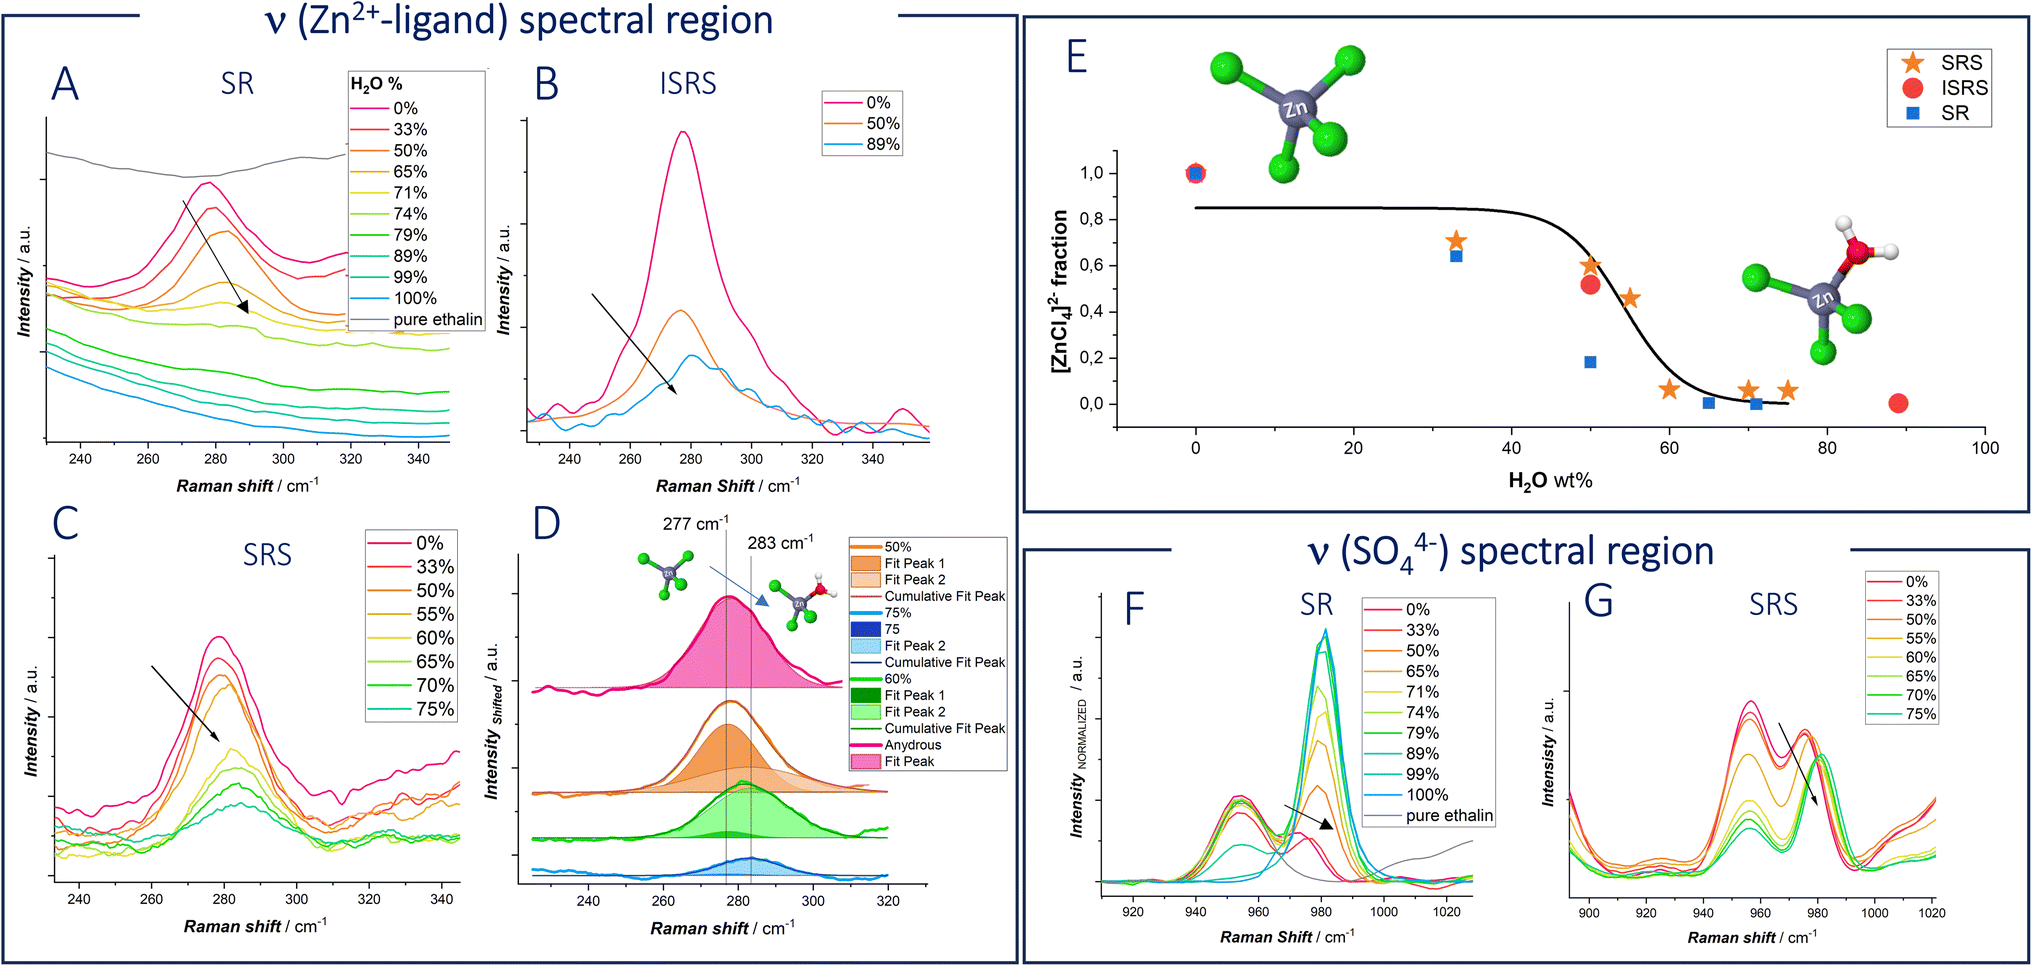 | ||
| Fig. 4 (A–D) ν(Zn–ligand) and (F and G) ν(SO42−) spectra for pure anhydrous ethaline and DESEG-H2O hybrid electrolytes with the indicated water wt%: (A) spontaneous Raman; (B) Impulsive Stimulated Raman Scattering (ISRS); (C) Stimulated Raman Scattering (SRS); (D) fitted SRS curves. (E) [ZnCl4]2− fraction estimated for the fitting of the spectra of panels (A–D). (F) Spontaneous Raman. (G) SRS. | ||
It is worth noting that, increasing the concentration of water in the eutectic electrolyte leads to a notable increase of the fluorescence background in the Spontaneous Raman spectra: this reduces the signal-to-noise ratio, especially affecting the signal in the ν(Zn–ligand) range. In response to this challenge, we combined Spontaneous Raman with Stimulated Raman spectroscopy (SRS) and Impulsive Stimulated Raman Spectroscopy (ISRS). In both SRS and ISRS, indeed, the Raman features are engraved on top of the probe beam, thereby enabling efficient suppression of the isotropic fluorescence background (as detailed in the ESI, Fig. S3–S5†).28,35 In addition, significant signal enhancement is achieved through stimulated excitation of vibrational coherences, leading to faster data acquisition and improved sensitivity.51 Such advantages make SRS and ISRS superior for applications requiring rapid and sensitive molecular analysis. We specifically chose these techniques to unravel the vibrational response of the Zn–ligand stretching peak, ensuring more accurate and detailed spectral information.
Also, for SRS and ISRS spectra reported in panels B–D of Fig. 4 and S6† show the same blue shift detected with Spontaneous Raman spectroscopy. Fig. 4E quantifies the fraction of [ZnCl4]2− as a function of water content in the solvent mixture, derived from the fitting of the ν(Zn–ligand) bands shown in panels (B–D). Specifically, the [ZnCl4]2− and ZnCl3− modes at 277 cm−1 and 283 cm−1, respectively, were fitted with Gaussian functions, and the species fraction was calculated as the ratio of the fitted peak areas. Fit examples are reported for the case of SRS data in Fig. 4D.
The experimental data, gathered from SR, ISRS and SRS, exhibit a sigmoidal trend. At low water content, [ZnCl4]2− is the dominant species, with its fraction decreasing around 50% of water content. It is important to note that ISRS is particularly effective at measuring the Raman peak even at high water concentrations, where other techniques may face challenges due to reduced signal intensity.
In panels (F and G) the SR and SRS Raman peaks centered at ca. 981 cm−1, assigned to the ν(SO42−) vibration,52 are found to exhibit a significant red shift between aqueous 0.3 M ZnSO4 and 0.3 M ZnSO4 in DES EG. This shift indicates stronger coordination in the eutectic electrolyte. Sulfate, which is almost as good an H-bond acceptor as water, can form stronger hydrogen bonds with EG and Ch+, indicating the presence of distinct complex species rather than hydrated ions. Moreover, upon water addition, a blue shift is observed. The behavior of the sulfate anion mirrors the coordination changes observed with zinc cations. In fact, water molecules hydrate deep eutectic solvents, displacing one or more ligands from the first coordination shell of the ion.
We exploited the high specific sensitivity of Raman spectroscopy to single out the differences in chemical environment of water between the pure aqueous solvent (Fig. 5C and indicated plots of panels (A and B)) and hydrated DES (panels A, B and D of Fig. 5). The Raman O–H stretching band of water was deconvoluted using five Gaussian functions (Fig. 5B) centered at 3030 cm−1 (DAA-OH, single donor–double acceptor), 3212 cm−1 (DDAA-OH, double donor–double acceptor), 3416 cm−1 (DA-OH, single donor–single acceptor), 3552 cm−1 (DDA-OH, double donor–single acceptor), and 3628 cm−1 (free-OH) as previously reported.53
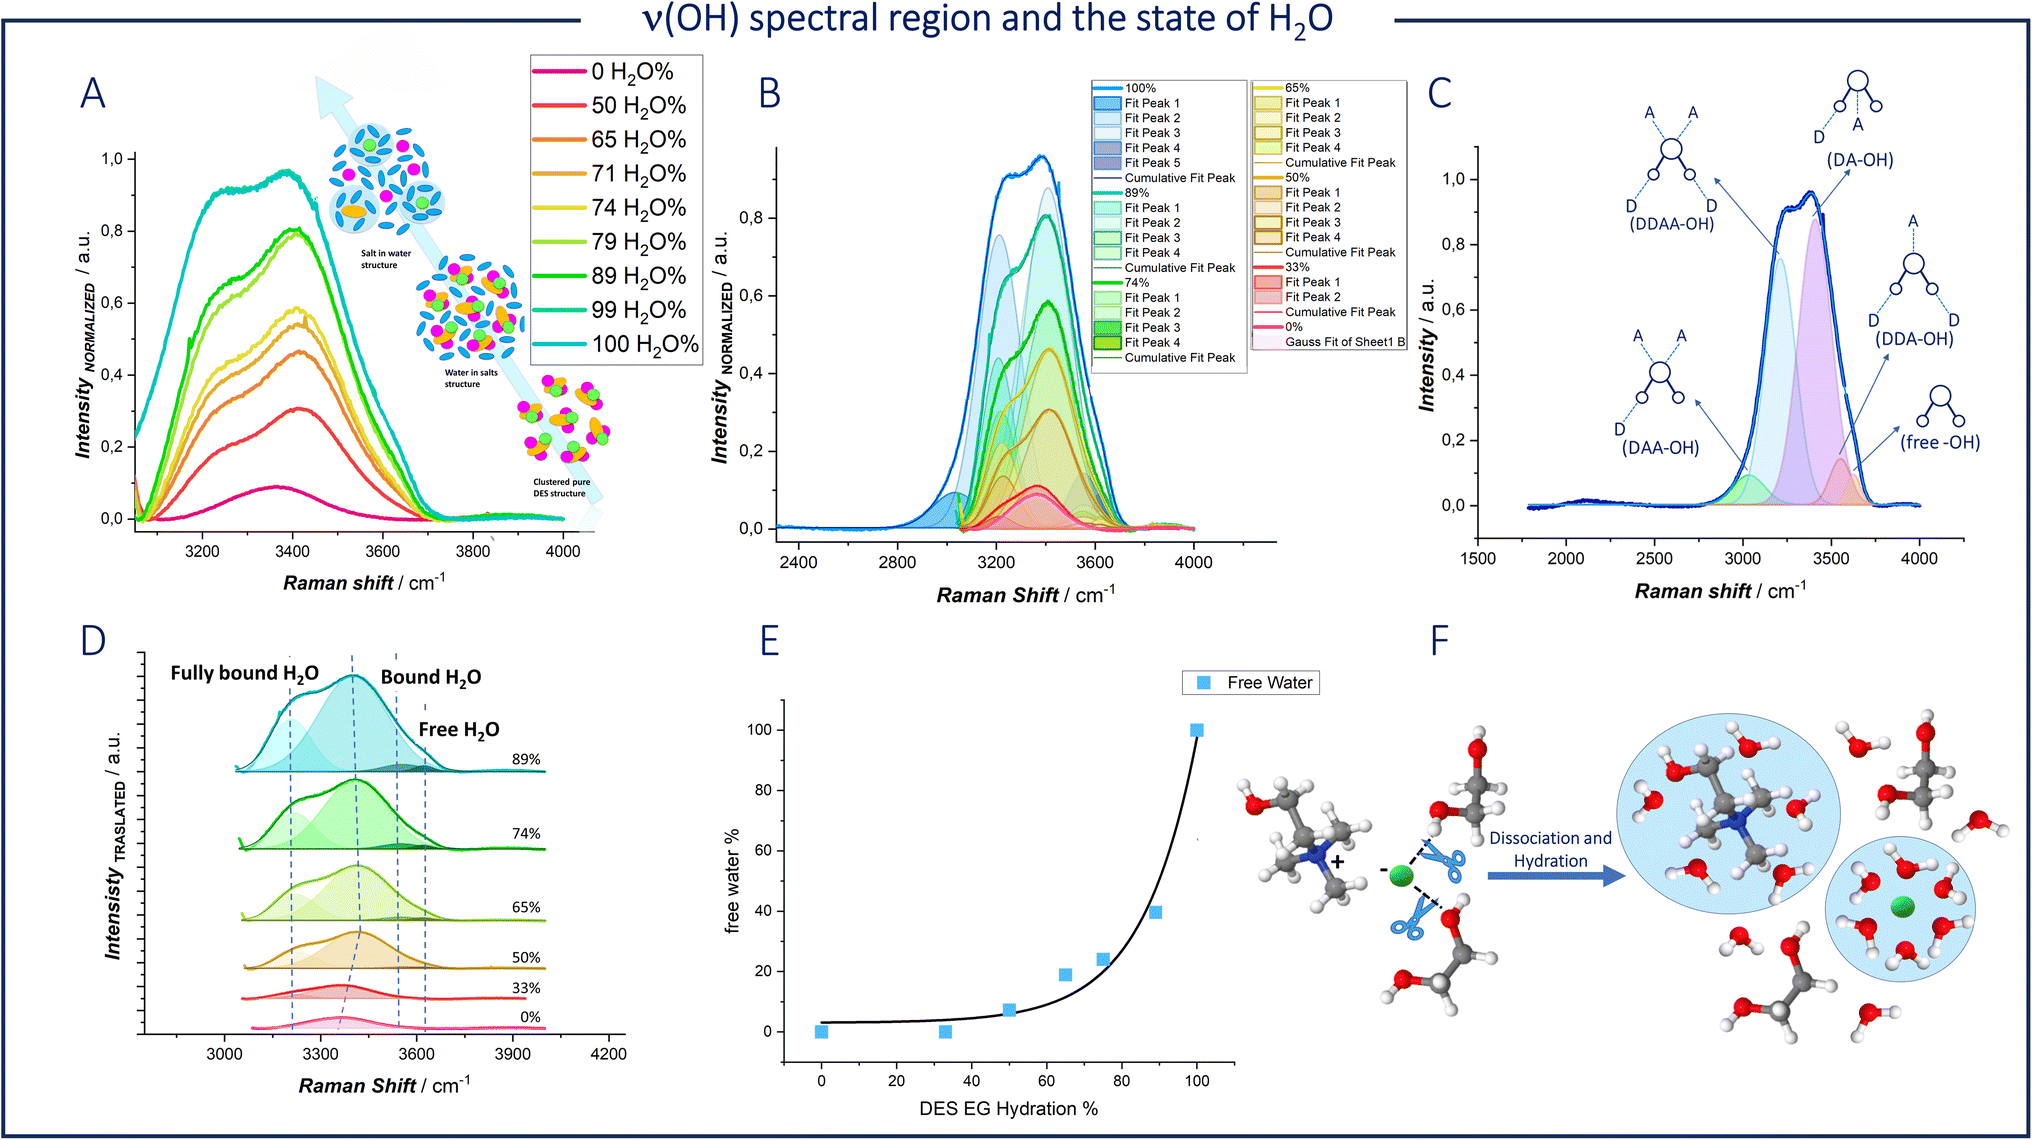 | ||
| Fig. 5 (A) Spontaneous Raman spectra in the ν(OH) region, for DESEG-H2O hybrid electrolytes with the indicated water fractions. (B) The fitted Raman spectra of panel (A). (C) Schematic diagram of water environment and Raman peak assignment. (D) Translated fitted Raman spectra of panel (B). (E) The proportions and total of bulk free H2O as a function of the water fraction. (F) Schematic of the coordination environment of DESEG before and after hydration. The white, gray, red, blue, green, balls represent hydrogen, carbon, oxygen, nitrogen atoms and chloride anion, respectively. | ||
Thus, based on the peak positions, five types of water environments in a water-based solution can be assigned, as schematized in Fig. 5C:
(i) Fully bonded water (DDAA), where one water molecule is involved in four hydrogen bonds (two as a donor and two as an acceptor).
(ii) Not-fully hydrogen-bonded water (DDA, DA, and DAA).
(iii) Free water molecules.
Hydrogen bonding weakens the covalent O–H bond in water, lowering its vibration frequency. In deep eutectic solvents with a water content below 50%, the free water peak is not observed. As the water content decreases, the clusters of water molecules disintegrate, eliminating the DDAA environment. As dilution proceeds, hydrogen bonds between the components of the DES are broken, forming new bonds between the DES components and water.
At high water concentrations, interstitial water leads to stronger interactions between water molecules and Cl− ions, as well as between water molecules and choline molecules, thereby preventing these components from interacting with each other (Fig. 5F). Although Cl− and Ch+ can form stronger hydrogen bonds with water and are thus the first to be solvated in the eutectic network, ethylene glycol contains a large number of hydroxyl groups and can act as both a proton donor and a proton acceptor, bonding with water in multiple ways.54
Different solvation regimes are present in the mixtures, with chloride (and the solvent as a whole) becoming partially and then fully hydrated: this corresponds to the transition of the eutectic/H2O systems from a “water-in-eutectic” to an ordinary “aqueous solution” regime (Fig. 1A).
The fitted ν(OH) Raman bands were used to quantify the fraction of the free H2O environment configuration (Fig. 5E). A significant decrease of 92.8% in the fitted area of free H2O can be observed. As shown in Fig. 5D, there is a significant change in the peak related to bound O–H at 3416 cm−1, which is assigned to the OH group present in both water and DES. During the dilution process, a blue shift is observed when the H2O percentage is less than 50%. In contrast, a red shift appears when the H2O percentage exceeds 50%. The same shift was reported by Ying Wang et al.54 for a mixed solution of ethylene glycol and water. The authors correlate this phenomenon with a change in the hydrogen bonding of water related to a transition in the association structure between EG and H2O.
To summarize, the predominant form of intermolecular hydrogen bonding observed was between the DES components and water, and the dominant Zn solvation structure is ZnCl42− at water contents lower than 50%. With the progressive addition of water, Cl−, Ch+ and EG molecules still form H-bond with their neighbor H2O, but there are a large number of water molecules interacting with each other. At the same time, one water molecule enters the first coordination shell of Zn forming [ZnCl3]−.
In order to clarify the role of surface reactivity of water molecules and the formation of degradation byproducts of organic DES components, SERS was employed: the SERS-active Au electrode was selected as in our previous study.27 Fig. 6 reports potential-dependent SERS spectra, measured in situ in the potential range investigated by CV with DESEG containing different water fractions in the absence of Zn2+ in solution.
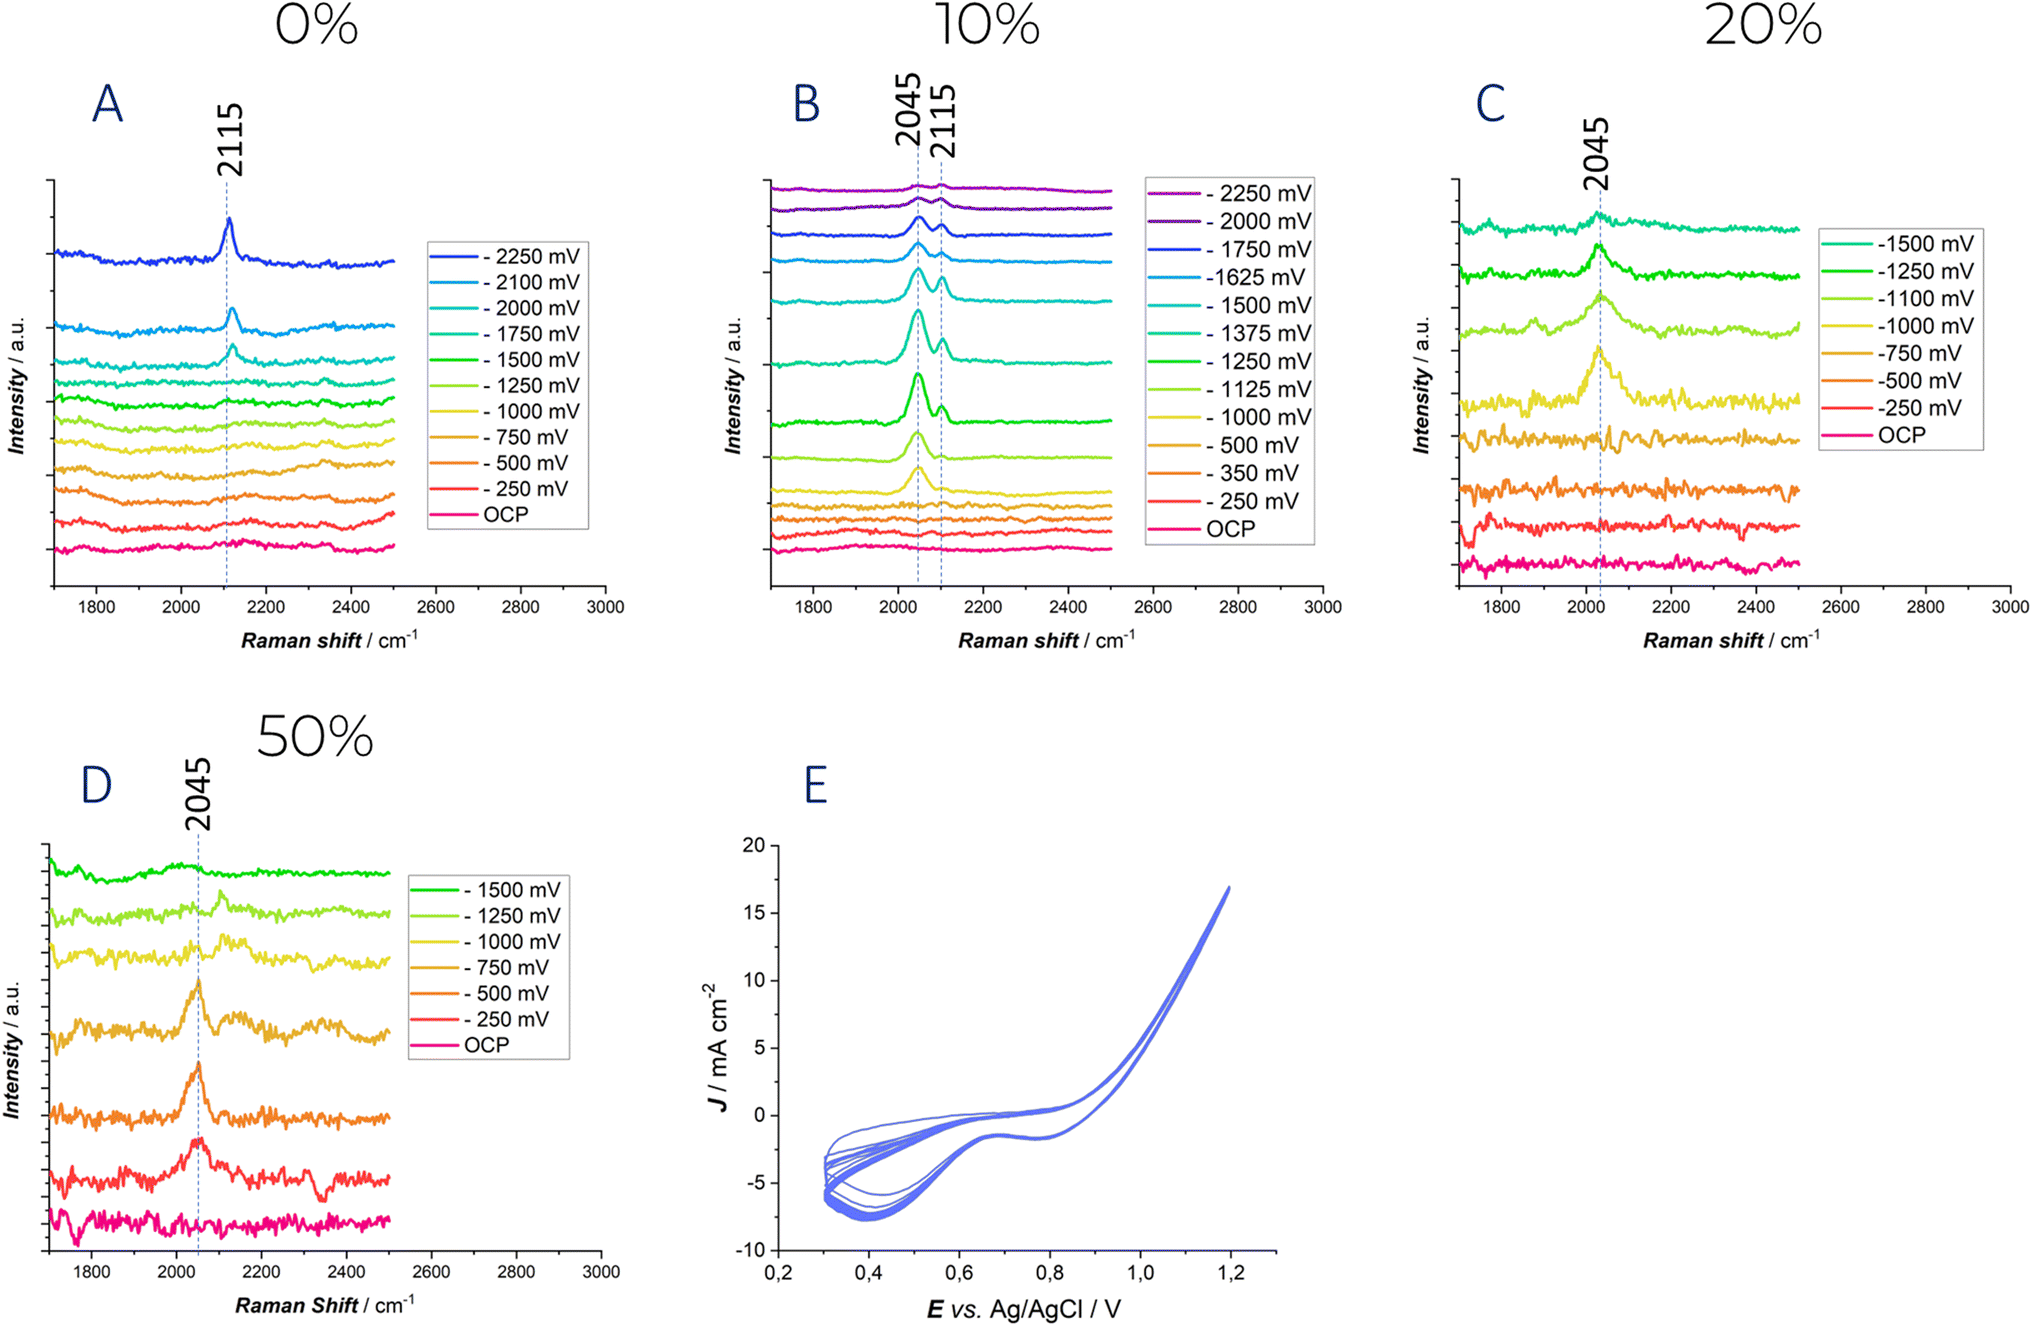 | ||
| Fig. 6 Potential-dependent in situ SERS spectra measured at an ORC-treated polycrystalline Au electrode in contact with the Ethaline DES with the indicated water contents. Panels (A–D) report the spectra recorded in the CN− stretching range for different hydration levels. (E) A typical ORC cycle adopted for the achievement of the SERS effect. | ||
At 0% water content and under polarization in the high cathodic range (−2000 mV) (Fig. 6A), a new peak at 2115 cm−1 is observed, which is characteristic of the ν(C![[triple bond, length as m-dash]](https://www.rsc.org/images/entities/char_e002.gif) N) stretching of adsorbed CN−.27 The potential at which this peak appears correlates well with the electrochemical stability window discussed above. Notably, −2 V is the potential at which the current begins to rise. The presence of the CN− anion was already demonstrated in our previous study27 and has also been reported in literature on ionic liquids.55 This can be attributed to the degradation of the choline cation in deep eutectic solvents. Hoffman's elimination or the direct reduction of choline cations is likely to occur a high cathodic potential, leading to the formation of trimethylamine, which can subsequently be deprotonated by either OH− or H˙, resulting in the formation of the CN− group.
N) stretching of adsorbed CN−.27 The potential at which this peak appears correlates well with the electrochemical stability window discussed above. Notably, −2 V is the potential at which the current begins to rise. The presence of the CN− anion was already demonstrated in our previous study27 and has also been reported in literature on ionic liquids.55 This can be attributed to the degradation of the choline cation in deep eutectic solvents. Hoffman's elimination or the direct reduction of choline cations is likely to occur a high cathodic potential, leading to the formation of trimethylamine, which can subsequently be deprotonated by either OH− or H˙, resulting in the formation of the CN− group.
When the water content is increased to 10%, a distinct peak at 2045 cm−1 is observed at −1 V. This band can be attributed to the Au–H stretching, based on both the polarization conditions and related literature for platinum electrodes.56 Moreover, in the SERS study by57 on a gold electrode, a broad band centered between 2039 and 2094 cm−1 was similarly assigned to Au–H stretching. As the applied potential is further shifted in the negative direction, the intensity of this peak increases, reflecting a stronger interaction between water and the electrode surface. Additionally, at −1125 mV, the appearance of a peak at 2115 cm−1, again corresponding to the adsorbed ν(CN) stretching, is observed.
When the water content is increased further, the only peak detected during polarization corresponds to the Au–H stretch, appearing at −1 V for 20% water content and at −250 mV for 50% water content. The disappearance of the adsorbed ν(CN) stretching band might be due to the signal reduction due to intense scattering by H2 bubbles and/or to the fact the high surface coverage with H˙ radicals scavenge surface cyanide.58 Also in these cases, the results are consistent with the cyclic voltammetry discussed above. The extent of the electrochemical stability window clearly anticorrelates with the water content: this trend that can be tracked from the development of peaks in the 2000–2150 cm−1 range. Water reduction accelerates the decomposition reactions of the choline cation, explaining why the peak related to CN− stretching appears at lower overvoltage.
The stability assessment of Zn anodes in deep eutectic solvent electrolytes with varying water contents was conducted through extensive galvanostatic cycling. Fig. 7 presents the results obtained from galvanostatic charge–discharge (GCD) experiments with a symmetric Zn|Zn cell employing DESEG electrolyte with different water concentrations.
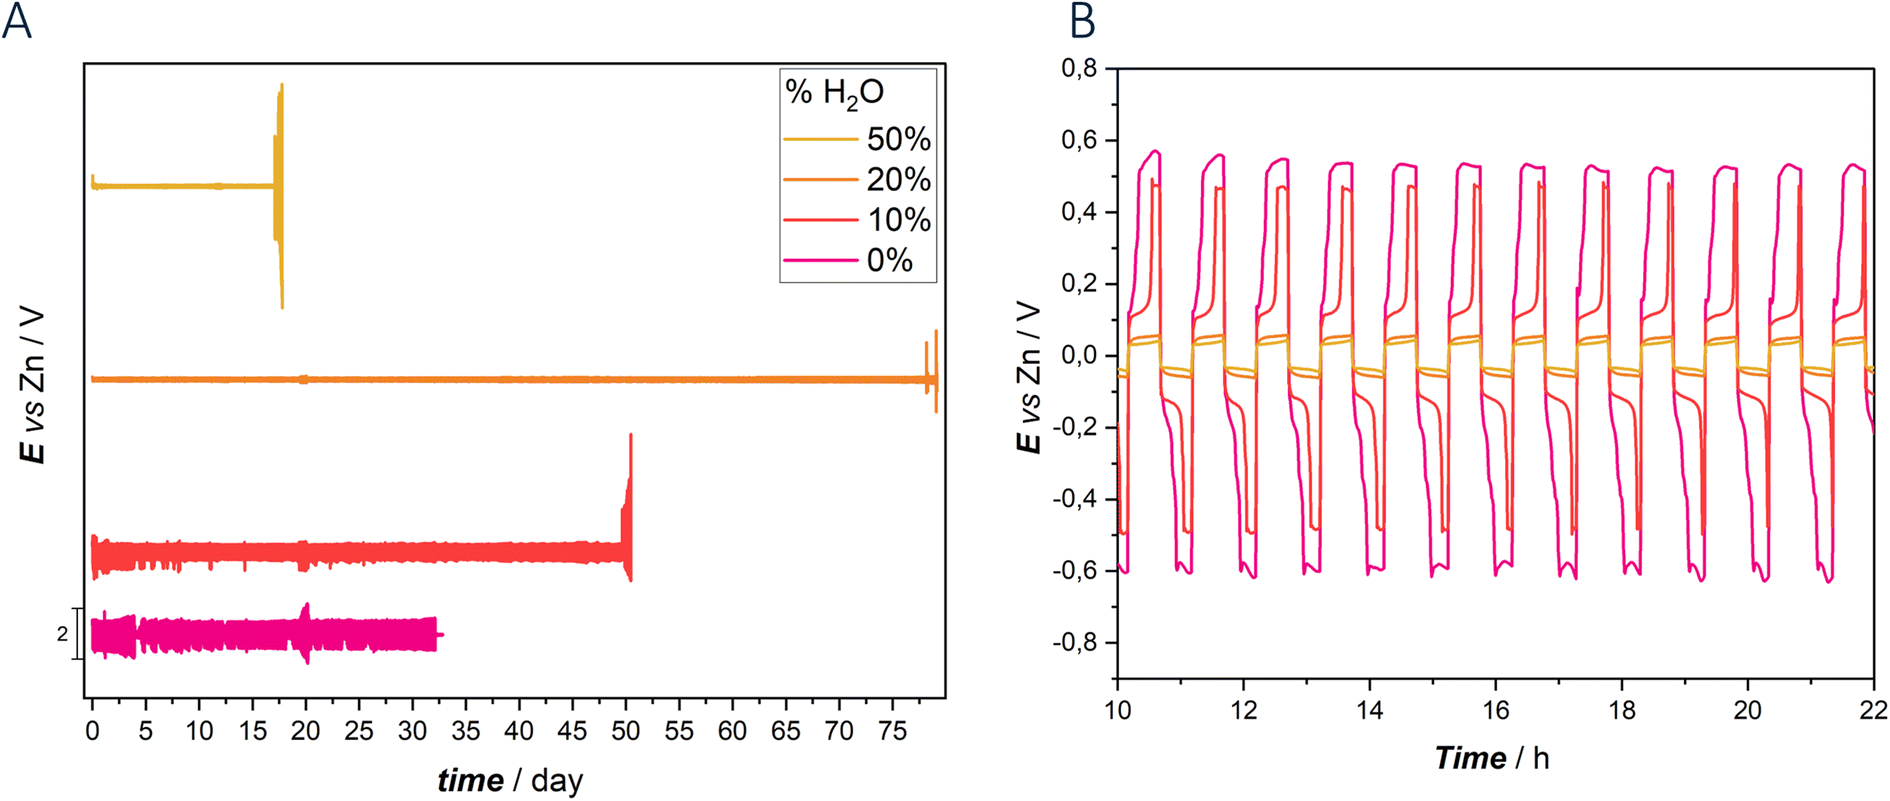 | ||
| Fig. 7 (A) Galvanostatic charge–discharge cycling experiments carried out with Zn symmetric CR2032 coin cells with the indicated DES hydration levels. (B) Chronopotentiometric transient shapes, extracted from the data of panel (A). | ||
According to our previous study, the absence of water as co-solvent in the electrolyte resulted in high viscosity, low conductivity and reduced diffusivity, leading to lower performance compared to hydrated counterparts.
Notably, the symmetrical cell with 0% water DES electrolyte exhibited poor cycling stability, characterized by elevated overvoltage and irregular chronopotentiometric transient shapes. Cycling lasted approximately 32 days and were terminated by a short circuit, with a voltage excursion of ca. ±600 mV. The introduction of water into the electrolyte, starting with 10%, significantly improved cyclability. The cell demonstrated an extended cycling life of approximately 50 days, although with only a marginal reduction in overvoltage compared to the anhydrous electrolyte. Chronopotentiometric transients continued to show irregularities, especially in the cathodic phase, with a significant decrease in overvoltage observed after 100 hours. Additionally, the transients exhibited non-symmetrical behavior between the cathodic and anodic phases. In this case the cell failure was due to passivation, as discussed in detail in ref. 59 and 60.
Further increasing the water content to 20%, notably enhanced cell performance was obtained. With this composition, the cycling duration increased impressively to 82 days, accompanied by remarkably low overpotential (±60 mV voltage excursion) and sustained transient shape stability. The chronopotentiometric transients remained stable from the beginning to the end of the test, highlighting a high reversibility of the plating/stripping process. However, exceeding the 20% water threshold disrupted the DES network, transforming the eutectic into an aqueous solution. This transition was evident in the performance of the 50% water DES, where cycling stability was maintained with minimal overpotential until passivation occurred after 20 days of cycling. GCD cycling of cells replicates are reported in Fig. S7.†
To our knowledge, these results represent the 3rd best performance reported to date, as summarized in Table 1. These findings underscore the role of water content in DES electrolytes, with optimal hydration levels significantly enhancing battery performance and stability, while excessive water content leads to a transition to aqueous electrolytes and eventual passivation. Additionally, DES systems exhibit consistent and stable potential transient shapes, with notable symmetry observed in the charge and discharge transients, particularly evident in the 20% and 50% DES configurations.
| Reference | 20 | 21 | 22 | 23 | 25 | This work |
| LIFETime | Over 2000 h | Over 9600 h | Over 800 h and over 400 h | Over 4500 h | Over 1500 h | Over 1970 h |
| Current density | 0.05, 1, 2 mA cm−2 | 1 mA cm−2 | 0.05 mA cm−2 and 0.2 mA cm−2 | 0.5 mA cm−2 and 1 mA cm−2 | 0.1 mA cm−2 | 0.5 mA cm−2 |
| Current capacity | 0.25, 0.25, 0.5 mA h cm−2 | 1 mA h cm−2 | 0.5 mA h cm−2 and 2 mA h cm−2 | 0.5 mA h cm−2 and 1 mA h cm−2 | 0.05 mA h cm−2 | 0.25 mA h cm−2 |
| Zn used | Zn foils (80 μm thick, ∼84 mg) | Zn foils with a thickness of 100 μm | Not given | Zn foil (99.9%) | Zn foil | Zn foil 99.9% 250 μm |
| Battery | CR 2016 coin-type cells | CR2025-type coin cell | CR 2032 coin-type cells | CR2025 coin-type cell | CR 2032 coin-type cells | CR 2032-coin type cells |
| Amount of electrolyte | 60 μL | Not given | 150 μL | Not given | Not given | 100 μL |
The controlled addition of water in DES tunes the conductivity of the electrolyte, as evidenced by the difference in ohmic resistance observed in the cell operating with anhydrous DES.
The overvoltages recorded during cycling are consistent with those observed in the cathodic branch of the cyclic voltammograms and with the potential-time transient of CA experiments.
4. Conclusions
In this study, the electrochemical behavior of zinc in ethaline DES with varying degrees of hydration was systematically investigated with electrochemical and vibrational spectroscopy methods. The findings reveal that the addition of water significantly influences the electrochemical properties and modifies the Zn deposition process. At low hydration levels, the DES maintains its structure, characterized by high viscosities and slow kinetics. As the water content is increased, viscosity decreases, enhancing ion mobility. Notably, the coordination environment of zinc shifts from [ZnCl4]2− in anhydrous DES to [ZnCl3(H2O)]− and eventually to more hydrated species at higher water contents. These changes lead to improved zinc plating/stripping efficiency and cycling stability.Raman spectroscopy, employed combining SR, SERS, SRS and ISRS techniques, confirmed the formation of different zinc–ligand complexes and the critical role of water in modifying the DES structure. The optimized hydration level was found to be around 20 wt%, balancing the advantages of reduced viscosity and enhanced conductivity without compromising the DES stability and keeping the concentration of free active water low. Although at 20 wt% the coordination of Zn was found to be [ZnCl4]2−, that has a higher dissociation energy compare to [ZnCl3(H2O)]−, the impact on the formation of the Z intermediate species that undergo reduction results in a completely different CV behavior related to the anhydrous case. In particular, the cathodic deposition peak was already present in the forward scan.
This work underscores the potential of hydrated DES as highly prospective electrolytes for ZIBs, offering a flexible tool for controlling zinc electrochemistry and enhancing their efficiency and durability. It is important to note that the behavior of water in DES is strongly influenced by the specific components and their hydrogen bond network. Therefore, our findings, that highlight the optimal performance at 20 wt% water in this system, cannot be directly transferred to any DES formulation.
Additionally, this study represents the first attempt to analyze the anomalous cyclic voltammetry behavior of zinc plating in hydrated DES, providing new insights into the electrochemical processes involved. The nuanced understanding of the interplay between solvent composition, Zn solvation, and electrodeposition mechanisms paves the way for the development of more efficient and sustainable ZIB technologies.
Data availability
The data that support the findings of this study are available from the corresponding author upon reasonable request.Author contribution
Elisa Emanuele: conceptualization, methodology, validation, formal analysis, investigation, data curation, writing – original draft, visualization. Giovanni Batignani: validation, investigation, writing – review and editing, methodology, funding acquisition. Neethish madathiparambil mohanan: validation, investigation, writing – review and editing Gabriele Leita: conceptualization, validation, investigation, writing – review and editing. Emanuele Mai: validation, investigation, writing – review and editing. Claudio Mele: conceptualization, validation, investigation, writing – review and editing Miles Martinati: validation, investigation, writing – review and editing, data curation, visualization, methodology, formal analysis. Tullio Scopigno: validation, investigation, writing – review and editing, methodology, funding acquisition. Benedetto Bozzini: conceptualization, methodology, validation, formal analysis, investigation, resources, writing – original draft, visualization, supervision, project administration, funding acquisition.Conflicts of interest
There are no conflicts to declare.Acknowledgements
(1) Co-funding was received from ZnOrgBat project (no. 23034) under the EIT RawMaterials, part of the Horizon Europe funding scheme. (2) This study was carried out within the MOST – Sustainable Mobility Center activities funded from the European Union Next-GenerationEU (PIANO NAZIONALE DI RIPRESA E RESILIENZA (PNRR) – MISSIONE 4 COMPONENTE 2, INVESTIMENTO 1.4 – D.D. 1033 17/06/2022, CN00000023). This manuscript reflects only the authors' views and opinions, neither the European Union nor the European Commission can be considered responsible for them. (3) T. S. acknowledges the support of EU HORIZON funding programme through grant GA-101120832. (4) G. B. acknowledges funding from the PRIN-PNRR-2022 Project (Notbab) (grant number P2022E2PBB).References
- B. Diouf and R. Pode, Renew. Energy, 2015, 76, 375–380 Search PubMed.
- A. Manthiram, ACS Cent. Sci., 2017, 3(10), 1063–1069 CrossRef CAS.
- S. Lei, Z. Liu, C. Liu, J. Li, B. Lu, S. Liang and J. Zhou, Energy Environ. Sci., 2022, 15(12), 4911–4927 RSC.
- C. Guo, S. Yi, R. Si, B. Xi, X. An, J. Liu, J. Li and S. Xiong, Adv. Energy Mater., 2022, 12(40), e1194 Search PubMed.
- Q. Cao, Y. Gao, J. Pu, A. M. Elshahawy and C. Guan, SmartMat, 2023, 5(1), e1194 CrossRef.
- Y. Zou, X. Yang, L. Shen, Y. Su, Z. Chen, X. Gao, J. Zhou and J. Sun, Energy Environ. Sci., 2022, 15(12), 5017–5038 RSC.
- Y. Zhang, X. Zheng, N. Wang, W.-H. Lai, Y. Liu, S. -L Chou, H.-K. Liu, S.-X. Dou and Y.-X. Wang, Chem. Sci., 2022, 13(48), 14246–14263 RSC.
- D. W. Barnum, Inorg. Chem., 1983, 22(16), 2297–2305 CrossRef.
- A. R. Mainar, E. Iruin, L. C. Colmenares, A. Kvasha, I. de Meatza, M. Bengoechea, O. Leonet, I. Boyano, Z. Zhang and J. A. Blazquez, J. Energy Storage, 2018, 15, 304–328 CrossRef.
- J. Wu, Q. Liang, X. Yu, Q. Lü, L. Ma, X. Qin, G. Chen and B. Li, Adv. Funct. Mater., 2021, 31(22), 2011102 CrossRef.
- A. P. Abbott, G. Capper, D. L. Davies and R. K. Rasheed, Chem.–Eur. J., 2004, 10(15), 3769–3774 CrossRef PubMed.
- A. Paiva, R. Craveiro, I. Aroso, M. Martins, R. L. Reis and A. R. C. Duarte, ACS Sustain. Chem. Eng., 2014, 2(5), 1063–1071 CrossRef.
- A. Abo-Hamad, M. Hayyan, M. A. AlSaadi and M. A. Hashim, Chem. Eng. J., 2015, 273, 551–567 CrossRef.
- A. Boisset, J. Jacquemin and M. Anouti, Electrochim. Acta, 2013, 102, 120–126 Search PubMed.
- S. Grecchi, S. Arnaboldi, S. Rizzo and P. R. Mussini, Curr. Opin. Electrochem., 2021, 30, 100810 CrossRef.
- A. P. Abbott, J. C. Barron, G. Frisch, K. S. Ryder and A. F. Silva, Electrochim. Acta, 2011, 56(14), 5272–5279 CrossRef.
- S. Ibrahim, A. Bakkar, E. Ahmed and A. Selim, Electrochim. Acta, 2016, 191, 724–732 CrossRef.
- N. M. Pereira, P. M. V. Fernandes, C. M. Pereira and A. Fernando Silva, J. Electrochem. Soc., 2012, 159(9), D501–D506 CrossRef.
- O. S. Hammond, D. T. Bowron and K. J. Edler, Angew. Chem., 2017, 129(33), 9914–9917 Search PubMed.
- M. Han, J. Huang, X. Xie, T. C. Li, J. Huang, S. Liang, J. Zhou and H. J. Fan, Adv. Funct. Mater., 2022, 32(25), 2110957 Search PubMed.
- M. Li, X. Wang, J. Hu, J. Zhu, C. Niu, H. Zhang, C. Li, B. Wu, C. Han and L. Mai, Angew. Chem., Int. Ed., 2023, 62(8), e202215552 Search PubMed.
- W. Yang, X. Du, J. Zhao, Z. Chen, J. Li, J. Xie, Y. Zhang, Z. Cui, Q. Kong, Z. Zhao, C. Wang, Q. Zhang and G. Cui, Joule, 2020, 4(7), 1557–1574 Search PubMed.
- R. Chen, C. Zhang, J. Li, Z. Du, F. Guo, W. Zhang, Y. Dai, W. Zong, X. Gao, J. Zhu, Y. Zhao, X. Wang and G. He, Energy Environ. Sci., 2023, 16(6), 2540–2549 RSC.
- M. E. Di Pietro, O. Hammond, A. van den Bruinhorst, A. Mannu, A. Padua, A. Mele and M. Costa Gomes, Phys. Chem. Chem. Phys., 2021, 23(1), 107–111 RSC.
- J. Shi, T. Sun, J. Bao, S. Zheng, H. Du, L. Li, X. Yuan, T. Ma and Z. Tao, Adv. Funct. Mater., 2021, 31(23), 2102035 CrossRef.
- A. P. Abbott, J. C. Barron, G. Frisch, S. Gurman, S. S. Ryder and A. Fernando Silva, Phys. Chem. Chem. Phys., 2011, 13(21), 10224 RSC.
- E. Emanuele, A. Li Bassi, A. Macrelli, C. Mele, J. Strada and B. Bozzini, Molecules, 2023, 28(3), 957 CrossRef PubMed.
- G. Batignani, C. Ferrante, G. Fumero, M. Martinati and T. Scopigno, Nat. Rev. Methods Primers, 2024, 4(1), 34 CrossRef CAS.
- C. Manzoni and G. Cerullo, J. Opt., 2016, 18(10), 103501 CrossRef.
- E. Pontecorvo, S. M. Kapetanaki, M. Badioli, D. Brida, M. Marangoni, G. Cerullo and T. Scopigno, Opt. Express, 2011, 19(2), 1107 CrossRef CAS PubMed.
- E. Pontecorvo, C. Ferrante, C. G. Elles and T. Scopigno, Opt. Express, 2013, 21(6), 6866 Search PubMed.
- G. Batignani, E. Pontecorvo, G. Giovannetti, C. Ferrante, G. Fumero and T. Scopigno, Sci. Rep., 2016, 6(1), 18445 CrossRef CAS PubMed.
- C. Ferrante, G. Batignani, E. Pontecorvo, L. C. Montemiglio, M. H. Vos and T. Scopigno, J. Am. Chem. Soc., 2020, 142(5), 2285–2292 CrossRef CAS PubMed.
- S. Ruhman, A. G. Joly and K. A. Nelson, J. Chem. Phys., 1987, 86(11), 6563–6565 CrossRef CAS.
- H. Kuramochi and T. Tahara, J. Am. Chem. Soc., 2021, 143(26), 9699–9717 CrossRef CAS PubMed.
- M. Liebel, C. Schnedermann, T. Wende and P. Kukura, J. Phys. Chem. A, 2015, 119(36), 9506–9517 CrossRef.
- G. Batignani, E. Mai, G. Fumero, S. Mukamel and T. Scopigno, Nat. Commun., 2022, 13(1), 7770 CrossRef PubMed.
- M. Liebel, C. Schnedermann and P. Kukura, Opt. Lett., 2014, 39(14), 4112 Search PubMed.
- M. Zavelani-Rossi, G. Cerullo, S. De Silvestri, L. Gallmann, N. Matuschek, G. Steinmeyer, U. Keller, G. Angelow, V. Scheuer and T. Tschudi, Opt. Lett., 2001, 26(15), 1155 CrossRef PubMed.
- O. S. Hammond, D. T. Bowron and K. J. Edler, Green Chem., 2016, 18(9), 2736–2744 RSC.
- C. Ma, A. Laaksonen, C. Liu, X. Lu and X. Ji, Chem. Soc. Rev., 2018, 47(23), 8685–8720 RSC.
- P. Aravena, E. Cea-Klapp, N. F. Gajardo-Parra, C. Held, J. M. Garrido and R. I. Canales, J. Mol. Liq., 2023, 389, 122856 CrossRef.
- L. Vieira, R. Schennach and B. Gollas, Electrochim. Acta, 2016, 197, 344–352 CrossRef.
- L. Vieira, A. H. Whitehead and B. Gollas, J. Electrochem. Soc., 2013, 161(1), D7–D13 CrossRef.
- N. M. Pereira, C. M Pereira, J. P. Araújo and A. Fernando Silva, J. Electroanal. Chem., 2017, 801, 545–551 CrossRef.
- O. G. Parchment, M. A. Vincent and I. H. Hillier, J. Phys. Chem., 1996, 100(23), 9689–9693 CrossRef.
- C. Zhang, J. Holoubek, X. Wu, A. Daniyar, L. Zhu, C. Chen, D. P. Leonard, I. A. Rodríguez-Pérez, J. X. Jiang, C. Fang and X. Ji, Chem. Commun., 2018, 54(100), 14097–14099 RSC.
- T. Yamaguchi, S. Hayashi and H. Ohtaki, J. Phys. Chem., 1989, 93(6), 2620–2625 CrossRef.
- D. F. C. Morris, E. L. Short and D. N Waters, J. Inorg. Nucl. Chem., 1963, 25(8), 975–983 CrossRef CAS.
- M. Maeda, T. Ito, M. Hori and G. Johansson, Z. Naturforsch. A, 1996, 51(1–2), 63–70 CrossRef CAS.
- G. Batignani, E. Mai, M. Martinati, M. M. Neethish, S. Mukamel and T. Scopigno, Phys. Rev. Lett., 2024, 133(20), 206902 CrossRef CAS.
- W. W. Rudolph, M. H. Brooker and P. Tremaine, Z. Phys. Chem., 1999, 209(2), 181–207 CrossRef CAS.
- C. Choe, J. Lademann and M. E. Darvin, Analyst, 2016, 141(22), 6329–6337 RSC.
- Y. Wang, F. Li, W. Fang, C. Sun and Z. Men, Spectrochim. Acta, Part A, 2021, 260, 119916 CrossRef CAS PubMed.
- N. Zhang, X. R. Wang, Y. X. Yuan, H. F. Wang, M. M. Xu, Z. G. Ren, J. L. Yao and R. A. Gu, J. Electroanal. Chem., 2015, 751, 137–143 CrossRef CAS.
- J. F. Li, Y. F. Huang, S. Duan, R. Pang, D. Y. Wu, B. Ren, X. Xu and Z. Q. Tian, Phys. Chem. Chem. Phys., 2010, 12(10), 2493 RSC.
- B. Bozzini, A. Fanigliulo and C. Mele, Trans. IMF, 2003, 81(2), 59–67 CrossRef CAS.
- B. Bozzini, L. D'Urzo, C. Mele and V. Romanello, J. Phys. Chem. C, 2008, 112(16), 6352–6358 CrossRef CAS.
- B. Bozzini, E. Emanuele, J. Strada and I. Sgura, Appl. Eng. Sci., 2023, 13, 100125 Search PubMed.
- B. Bozzini, M. Boniardi, T. Caielli, A. Casaroli, E. Emanuele, L. Mancini, N. Sodini and J. Strada, ChemElectroChem, 2023, 10, e202201130 CrossRef CAS.
Footnote |
| † Electronic supplementary information (ESI) available. See DOI: https://doi.org/10.1039/d5ta00395d |
| This journal is © The Royal Society of Chemistry 2025 |