Uncovering metabolic signatures in cancer-derived exosomes: LC-MS/MS and NMR profiling†
Nandini
Bajaj
ab and
Deepika
Sharma
 *ab
*ab
aInstitute of Nano Science and Technology, Knowledge City, Sector 81, Mohali, Punjab 140306, India. E-mail: deepika@inst.ac.in
bAcademy of Scientific and Innovative Research (AcSIR), Ghaziabad 201002, India
First published on 20th November 2024
Abstract
Understanding the intricate interplay between cancer metabolism and intercellular communication within the tumour microenvironment (TME) is crucial for advancing cancer diagnostics and therapeutics. In this study, we investigate the metabolites present in exosomes derived from three distinct cancer cell lines: pancreatic cancer (MiaPaCa-2), lung cancer (A549), and glioma (C6). Exosomes were isolated using ultrafiltration and characterized using a combination of techniques including nanoparticle tracking analysis (NTA), electron microscopy (EM), western blotting (WB) and Fourier-transform infrared (FTIR) spectroscopy. Leveraging state-of-the-art metabolomics techniques, including untargeted LC-MS/MS and NMR analyses, we elucidated the metabolic signatures encapsulated within cancer-derived exosomes. Notably, our investigation represents the first exploration of exosomal metabolites from pancreatic and glioma cells, addressing a significant gap in current knowledge. Furthermore, our study investigates the correlation between metabolites derived from different cancer cells, shedding light on potential metabolic interactions within the TME. Through comprehensive analyses, this study provides insights into dysregulated metabolic pathways driving cancer progression and offers novel perspectives on the diagnostic and therapeutic utility of exosomal metabolites. Importantly, common metabolites identified among cancer types suggest potential markers detectable by multiple techniques, enhancing their clinical applicability.
1. Introduction
Cancer, characterized by intratumoral heterogeneity and its aggressive nature, remains a leading cause of mortality worldwide. The tumour microenvironment (TME) further exacerbates this complexity, serving as a dynamic arena for cellular interactions that actively contribute to cancer initiation and progression.1 In this intricate landscape, cell-to-cell communication emerges as a pivotal mechanism for cancer cell survival and propagation. Traditional modes of communication like direct cell-to-cell contacts or soluble factors interact with the diverse array of players within the TME, shaping cancer cell behaviour and fostering tumour progression.2 Beyond these conventional methods, emerging evidence underscores the role of extracellular vesicles (EVs), particularly exosomes, as critical mediators in intercellular communication.3Exosomes, nanosized vesicles originating from late endosomes, have a phospholipid bilayer and are loaded with a cargo reflective of their parent cell's composition.4 This cargo, comprising proteins, RNAs, and metabolites, mirrors the metabolic and signalling state of the originating cells, offering unique insights into cellular interactions within the TME. The transfer of exosomal cargo between cells facilitates diverse cellular processes, influencing tumour development, progression, and metastasis.5 Exosomes carry not only proteins and RNAs, but also metabolites, influencing cellular metabolism and signalling pathways. These metabolites, transferred via exosomes, impact tumour progression and the tumour microenvironment by various means such as induction of M2 polarization of macrophages and activation of STAT3 (Signal Transducer and Activator of Transcription 3) with IL-6 (Interleukin 6),6 delivery of miRNA-23a7 transfer of TGF-β (Transforming Growth Factor-beta) to induce cancer associated fibroblasts (CAFs),8 VEGF/VEGFR (Vascular Endothelial Growth Factor/Vascular Endothelial Growth Factor Receptor) delivery9 and many more.
Metabolomics delves into the cellular molecular makeup, offering insights into dysregulated metabolic pathways driving cancer pathogenesis by uncovering alterations in cancer-associated metabolite profiles. This technology holds promise for biomarker discovery,10 disease prediction, therapeutic targeting,11 and pathway analysis12 in cancer. Despite these advancements, the exploration of cancer-specific exosomal metabolites remains largely unexplored. Previous studies have primarily focused on metabolite profiling in biological samples from cancer patients,13–15 potentially overlooking biomarkers or metabolites that could arise from underlying conditions or comorbidities, which may not be cancer-specific. Additionally, metabolites related to lifestyle or clinical conditions may interfere with detection when using human biological fluids. Therefore, research has shown that exosomes can serve as more reliable biomarkers compared to human biological fluids, as they contain stable cargos that are less prone to degradation.16 Therefore, leveraging exosomes as diagnostic markers offers greater utility in cancer detection and characterization.17
In this study, we investigated the exosomal metabolites derived from three distinct cancer cell lines: pancreatic, lung, and glioma. Initially, exosomes were isolated using the ultrafiltration technique,18,19 followed by characterization to confirm their presence in our samples. Subsequently, metabolites were extracted from one sample using various methods, and the most optimized method was selected for use in extracting metabolites from all other samples.
Notably, no prior research has explored exosomal metabolites from pancreatic and glioma cells, marking a significant gap in the current understanding, while existing studies have touched upon lipidomic analysis under certain conditions in lung cancer cell lines.12 However, none have investigated the correlation between metabolites derived from different cancer cells. Our study offers a novel perspective by elucidating the metabolic profiles of cancer cell-derived exosomes and their potential interplay. Furthermore, by employing both untargeted LC-MS/MS and NMR analyses, we aim to assess the reliability and complementary nature of these techniques in identifying exosomal metabolites.
2. Experimental
2.1. Materials and chemicals
Dulbecco's modified Eagle's medium (DMEM) was procured from MP Biosciences, Fetal Bovine Serum (FBS) was obtained from Gibco, and the antibiotic solution, glutaraldehyde and Phosphate-Buffered Saline (PBS) were sourced from HiMedia. Ethanol (Molecular grade) and uranyl acetate were purchased from Sigma, and the lipophilic dye Dil (dioctadecyl-3,3,3′,3′-tetramethylindocarbocyanine perchlorate) was acquired from Invitrogen, all utilized for cell culture, exosome isolation, and detection.For western blot analysis and protein detection, Sodium Dodecyl Sulphate (SDS), polyacrylamide gel (30%), SDS loading buffer, the Polyvinylidene Fluoride (PVDF) membrane, Tris-base, and glycine were supplied by Real Gene. High-purity HPLC-grade methanol, chloroform, acetonitrile, and formic acid were purchased from Qualigens for LCMS, while D2O (Deuterium Oxide) solvent for NMR was obtained from TCI chemicals.
2.2. Cell culture conditions
The pancreatic cancer cell line MiaPaCa-2, the lung cancer cell line A549 and the glioma cell line C6 were purchased from the National Centre for Cell Science (NCCS), Pune, and cultured in Dulbecco's modified Eagle's medium (DMEM). These cells were maintained with 10% FBS and 1% penicillin/streptomycin antibiotic solution at 37° C in an incubator with 5% CO2. After reaching 70% confluency, the cells were washed twice with PBS and kept in exosome depleted media for 72 hours. The cell culture medium was then collected and used for exosome isolation.20 The exosome depleted FBS was obtained by using Amicon ultra 15 centrifugal tubes of 100 kDa size. The cell culture grade Gibco made FBS was centrifuged at 3000g for 55 minutes and exosome depleted FBS was collected and used as such.212.3. Isolation and characterization of exosomes
![[thin space (1/6-em)]](https://www.rsc.org/images/entities/char_2009.gif) 000g for 30 minutes at 4 °C. Exosomes were ultimately isolated through an ultrafiltration process using Amicon ultra 15 filter centrifugal tubes (4000g for 30 minutes). Subsequently, the exosomes were resuspended in PBS and stored at either −20 °C or −80 °C for future use. Post-use, the membranes were washed with 70% ethanol or isopropanol and thoroughly rinsed with PBS three times in preparation for subsequent use.
000g for 30 minutes at 4 °C. Exosomes were ultimately isolated through an ultrafiltration process using Amicon ultra 15 filter centrifugal tubes (4000g for 30 minutes). Subsequently, the exosomes were resuspended in PBS and stored at either −20 °C or −80 °C for future use. Post-use, the membranes were washed with 70% ethanol or isopropanol and thoroughly rinsed with PBS three times in preparation for subsequent use.
For our samples, the size distribution of exosomes was determined using a NanoSight instrument (sCMOS, green laser, NTA 3.2 Dev Build 3.2.16 at IITR, Lucknow facility). To minimize particle overlap, samples were diluted 1![[thin space (1/6-em)]](https://www.rsc.org/images/entities/char_2009.gif) :
:![[thin space (1/6-em)]](https://www.rsc.org/images/entities/char_2009.gif) 10 in PBS before and approximately 500 μl of the diluted samples were injected into the sample chamber. The NanoSight instrument captured size distribution data, providing information about the size range and concentration of exosomes present in the sample.23
10 in PBS before and approximately 500 μl of the diluted samples were injected into the sample chamber. The NanoSight instrument captured size distribution data, providing information about the size range and concentration of exosomes present in the sample.23
Initially, exosomes were dropcast onto a coverslip and allowed to incubate for 24 hours at 37 °C in a controlled incubator environment. Subsequently, the coverslip underwent two washes with PBS to remove any unbound exosomes. Following this, the Dil dye was applied to the coverslip and allowed to incubate for one hour in darkness to ensure optimal staining. After the staining period, the coverslip underwent another round of washing with PBS to eliminate the excess dye.
To prepare for examination using a confocal microscope, the coverslip was air-dried. To mitigate potential quenching effects, the coverslip was mounted using a suitable mounting medium. Data acquisition was carried out using a confocal microscope equipped with excitation at a wavelength of 549 nm, with emission recorded at 565 nm. This meticulous process ensured accurate visualization and analysis of exosomes labelled with lipophilic dyes.
2.3.4.1. Scanning electron microscopy (SEM). The samples were first treated in 3.7% glutaraldehyde for 15 minutes before being placed onto a glass substrate for scanning electron microscopy. Following at least two rounds of washing with PBS, the fixed samples were dehydrated using ethanol concentrations of 40%, 60%, 80% and 98%. Subsequently, the samples were air dried and examined using SEM following gold–palladium coating at 39 kV.24
2.3.4.2. Transmission electron microscopy (TEM). For TEM analysis, fresh 300 mesh carbon formvar copper grids were employed. Initially, a drop of the exosome sample was carefully dispensed onto a parafilm surface, onto which the grid was inverted and allowed to adhere for 1–2 minutes. After removing excess liquid, the grid underwent a brief wash by inversion onto a water droplet for 10 seconds. Subsequently, the grid was exposed to a 1% uranyl acetate solution for 10–20 seconds to enhance contrast. Afterward, another brief wash was performed with a water droplet to remove the excess staining solution. Finally, the grid was air-dried to examine using a JOEL TEM-2100 plus electron microscope operated at 120 kV, ensuring optimal visualization and analysis of the exosome sample.25
3. Identification and quality check of exosomes
3.1. Protein expression via western blotting
Tetraspanin proteins serve as important surface markers for identifying exosomes, and western blot analysis is a reliable method to confirm their presence. In this study, we utilized an anti-CD63 antibody for immunoblotting. Exosome samples obtained from three distinct cell line cultured media, each comprising 10 μl, were mixed with SDS containing loading buffer.26 Following this, the mixtures were then subjected to heating at 95 °C for 5 minutes and promptly cooled on ice to denature the proteins. Afterward, the samples underwent centrifugation at 1400 rpm for 2 minutes before being loaded onto a 12% polyacrylamide gel. To facilitate protein size determination, a pre-stained protein ladder was included in one of the wells as a molecular weight reference.Electrophoresis was conducted initially at 60 V for 40 minutes, followed by 120 V for 1 hour and 30 minutes to ensure optimal protein separation. Following gel electrophoresis, the proteins were transferred onto a PVDF membrane using the wet transfer method, with the transfer process lasting 1.5 hours at 40 V. The membrane was subsequently incubated with a primary antibody anti-CD63 (Affinity Biosciences), a tetraspanin surface marker commonly found in exosomes. After thorough washing, the membrane was treated with a secondary antibody, HRP-conjugated IgG (Affinity Biosciences), to enable visualization of the target protein bands.26
This meticulous western blot protocol enabled the detection and characterization of CD63 tetraspanin surface markers in exosomes derived from different cell lines, providing valuable insights into their protein composition and potential functional roles.
3.2. Attenuated total reflectance Fourier transform infrared (ATR-FTIR) spectroscopy for quality control
ATR-FTIR spectroscopy offers valuable insights into the molecular composition of exosomes by detecting the absorption of infrared radiation by chemical bonds within the sample. In this study, a fresh aliquot of exosomes, approximately 5–10 μl in volume, was air dried for 5–10 minutes on a crystal surface to prepare it for analysis. Spectra were recorded with a spectral range of 4000–650 cm−1 wavenumbers, with each spectrum comprising 64 scans at a resolution of 4 cm−1, in both transmission and absorbance modes. To ensure accuracy, a background spectrum of air and PBS was initially recorded. To maintain consistency and cleanliness between readings, the crystal surface was cleaned with isopropyl alcohol (IPA) until the baseline readings returned to their initial state.274. Detection of metabolites from exosomes
Metabolites serve as the end products of diverse cellular processes, offering a snapshot of the complex biochemical activities within biological systems. In this study, untargeted metabolomics was performed to comprehensively profile the metabolites present in three different cancer cell lines. This approach allowed us to identify and quantify a wide range of small molecules, providing insights into the biochemical activities occurring within the cells.4.1. Metabolite extraction using LC-MS/MS
Metabolites were extracted from exosomes of each sample using a previously reported protocol and untargeted metabolomics using UPLC-mass spectrometry was performed (LC-MS/MS).28 Briefly, using an ice-cold methanol![[thin space (1/6-em)]](https://www.rsc.org/images/entities/char_2009.gif) :
:![[thin space (1/6-em)]](https://www.rsc.org/images/entities/char_2009.gif) acetonitrile
acetonitrile![[thin space (1/6-em)]](https://www.rsc.org/images/entities/char_2009.gif) :
:![[thin space (1/6-em)]](https://www.rsc.org/images/entities/char_2009.gif) chloroform
chloroform![[thin space (1/6-em)]](https://www.rsc.org/images/entities/char_2009.gif) :
:![[thin space (1/6-em)]](https://www.rsc.org/images/entities/char_2009.gif) water mixture with a ratio of (2
water mixture with a ratio of (2![[thin space (1/6-em)]](https://www.rsc.org/images/entities/char_2009.gif) :
:![[thin space (1/6-em)]](https://www.rsc.org/images/entities/char_2009.gif) 2
2![[thin space (1/6-em)]](https://www.rsc.org/images/entities/char_2009.gif) :
:![[thin space (1/6-em)]](https://www.rsc.org/images/entities/char_2009.gif) 2
2![[thin space (1/6-em)]](https://www.rsc.org/images/entities/char_2009.gif) :
:![[thin space (1/6-em)]](https://www.rsc.org/images/entities/char_2009.gif) 1 v/v), exosomes were incubated at −20 °C for an hour. After centrifugation, the supernatants were collected and analyzed using UPLC-MS/MS (LC-MS/MS) on a Waters SYNAPT XS HDMS instrument.
1 v/v), exosomes were incubated at −20 °C for an hour. After centrifugation, the supernatants were collected and analyzed using UPLC-MS/MS (LC-MS/MS) on a Waters SYNAPT XS HDMS instrument.
In the UPLC workflow, 6 μl of metabolite extract was injected onto the column at a flow rate of 0.3 ml min−1. The mobile phase consisted of 0.1% formic acid in water (solvent A) and 0.1% formic acid in acetonitrile (solvent B). The gradient elution profile was as follows: 90% A for 0–10 min, 75% A for 10–20 min, 60% A for 20–25 min, 50% A for 25–35 min, 10% A for 35–37 min and 90% A at 37 min. A scan range of 80–1000 m/z was employed. The capillary voltage was set at 3.22 keV, the source temperature was set at 120 °C, and the desolvation temperature was set at 550 °C. Collision energy was maintained at 4 eV with a cone voltage of 50 V. Nitrogen served as a sheath gas at a pressure of 6–7 bar (90–100 psi), while argon acted as the buffer gas during the run.
4.2. Data processing and pathway analysis
The raw data obtained from UPLC Acquity H was converted to mzXML using MS convert software (pwizard.setup). The mzXML files were then processed using XCMS (https://xcmsonline.scripps.edu/) for feature detection, retention time correction, and alignment (Δ m/z = 30 ppm, minimum peak width = 10s and maximum peak width = 120 s and m/z wid = 0.25, min frac = 0.5, and bw = 10) for chromatogram alignment. Isotopic peaks and adducts were detected.4.3. NMR spectroscopy
200 μl of exosomes were lyophilized at a vacuum pressure of 0.001 torr at −50 °C for 12–24 hours. Following lyophilization, the freeze-dried sample was reconstituted in the necessary solvent and centrifuged at 18![[thin space (1/6-em)]](https://www.rsc.org/images/entities/char_2009.gif) 000g for 15 minutes to eliminate any remaining salts. The resulting supernatant was then collected for further use.29
000g for 15 minutes to eliminate any remaining salts. The resulting supernatant was then collected for further use.29
For metabolomics analysis using NMR, three distinct methods were initially employed, and subsequently, the method yielding the most favourable results was selected for subsequent samples.
In the first method, the exosomal pellet was dissolved in 600 μl of cold methanol–water solution (MeOH![[thin space (1/6-em)]](https://www.rsc.org/images/entities/char_2009.gif) :
:![[thin space (1/6-em)]](https://www.rsc.org/images/entities/char_2009.gif) H2O, 1
H2O, 1![[thin space (1/6-em)]](https://www.rsc.org/images/entities/char_2009.gif) :
:![[thin space (1/6-em)]](https://www.rsc.org/images/entities/char_2009.gif) 1), followed by vortexing and sonication for 30 minutes at 4 °C. After centrifugation, the supernatant was collected and freeze-dried.
1), followed by vortexing and sonication for 30 minutes at 4 °C. After centrifugation, the supernatant was collected and freeze-dried.
The second protocol involved dissolving the exosomal pellet in 200 μl of deionized water, subjected to rapid freeze–thaw cycles (−20 °C for 30 seconds followed by 37 °C for 90 seconds), and sonication at 4 °C for 30 seconds. 200 μl of cold methanol and 200 μl of chloroform were then added, and the samples were centrifuged at 16![[thin space (1/6-em)]](https://www.rsc.org/images/entities/char_2009.gif) 200g for 10 minutes at 4 °C. The resulting supernatant was transferred, mixed with 200 μl of acetonitrile, incubated at 4 °C for 30 minutes, and then centrifuged. The samples were either stored at −20 °C for subsequent analysis or freeze-dried.
200g for 10 minutes at 4 °C. The resulting supernatant was transferred, mixed with 200 μl of acetonitrile, incubated at 4 °C for 30 minutes, and then centrifuged. The samples were either stored at −20 °C for subsequent analysis or freeze-dried.
In the third method, exosomal samples were directly dissolved in the NMR solvent, followed by centrifugation to remove residual salts before analysis.30
Following freeze-drying, all samples were dissolved in D2O, the NMR solvent, and subsequently analysed using a Bruker Avance NEO 400 MHz instrument.
4.4. Quantification of exosomal metabolites
![[thin space (1/6-em)]](https://www.rsc.org/images/entities/char_2009.gif) 2 transformation, normalization, and autoscaling to ensure comparability. Principal Component analysis (PCA) was then conducted using SIMCA18 to find out the differences between each group.
2 transformation, normalization, and autoscaling to ensure comparability. Principal Component analysis (PCA) was then conducted using SIMCA18 to find out the differences between each group.
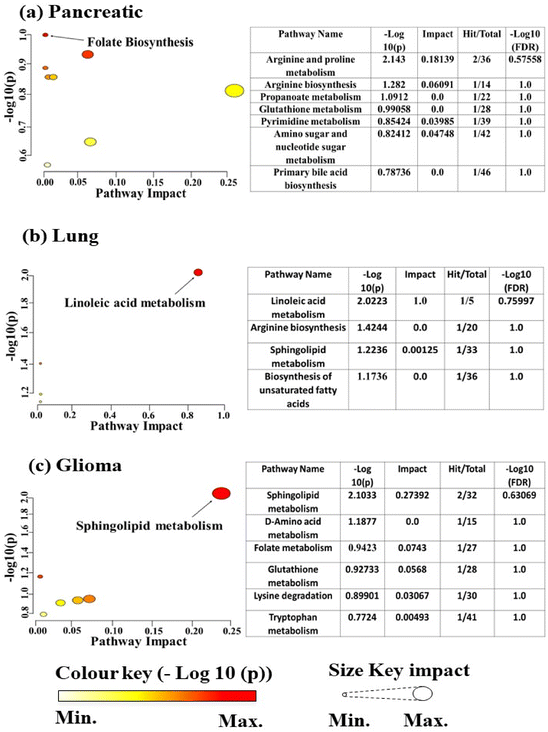
MetaboAnalyst 6.0 was used to do pathway analysis by matching the Kyoto Encyclopedia of Genes and Genomes (KEGG) id of each compound. The colour key represents the significance of a particular pathway according to its minimum and maximum values linked with a pathway impact.
5. Results and discussion
5.1. Characterization of isolated exosomes
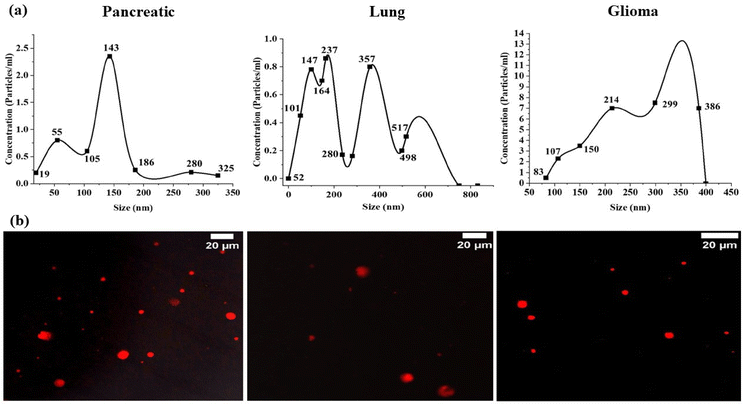
| Sample | Mean (nm) | SD (nm) | D10 (nm) | D50 (nm) | D90 (nm) | Particles/mL ± SD | Particles/frame |
|---|---|---|---|---|---|---|---|
| Pancreatic | 141.2 | 66.7 | 57.1 | 137 | 262.2 | 1.10 × 10⁸ ± 5.42 × 10⁶ | 14.5 ± 4.1 |
| Lung | 166.3 | 90.5 | 69.6 | 154.7 | 264.1 | 7.20 × 10⁷ ± 1.8 × 10⁷ | 10.2 ± 1.7 |
| Glioma | 316.3 | 113.5 | 172.2 | 309.3 | 188.0 | 2.05 × 10⁸ ± 6.46 × 10⁶ | 45.4 ± 1.1 |
The stained exosomes were examined with precision using a confocal microscope equipped with a high-resolution 63x objective lens (as depicted in Fig. 1b). To ensure optimal imaging, manual focusing of the lens was performed. For excitation of the Dil dye, we utilized a laser line with 549 nm excitation and 565 nm emission.
Dil dye, a lipophilic dye commonly used to stain lipid bilayers in various samples, contains long-chain dialkylcarbocyanines and is often employed for tracing living or fixed tissues. With an excitation wavelength of 549 nm and emission at 565 nm, the Dil dye exhibits stable fluorescence and is compatible with PBS containing exosomes. In our study, red fluorescent particles were observed, presumed to be exosomes of variable sizes, indicating their heterogeneous nature.
While previous studies have reported dye aggregates in confocal images,33 potentially affecting our data, we mitigated this by thorough washing steps. Subsequently, each sample underwent imaging, generating a dataset of fluorescence images for subsequent analysis. For morphological analysis, the images were taken in the TIFF format and were used to assess the shape and structural integrity of exosomes.
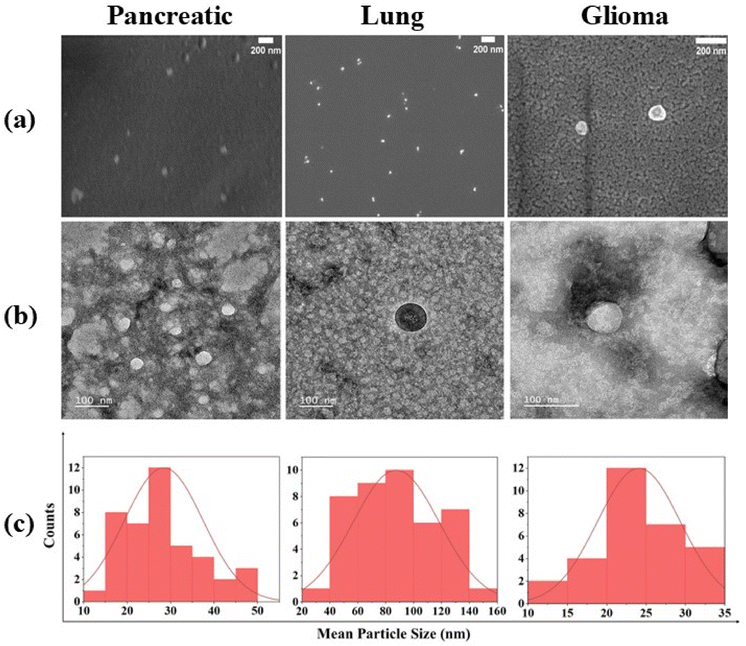
While Field Emission Scanning Electron Microscopy (FESEM) offered a comprehensive three-dimensional perspective, it occasionally encountered challenges in distinguishing between nanoparticles and substrate. To overcome this limitation, detailed structural analysis via TEM was also employed.
Our examination unveiled exosomes characterized by intact and uniform size, exhibiting a distinctive spherical structure, as illustrated in the FESEM images (Fig. 2a). The observation of intact and uniform-sized exosomes with a clearly defined spherical structure in the FESEM images underscores the structural integrity and homogeneity of the exosome population under investigation.
Moreover, the confirmation of the intact structure of exosomes was revealed through TEM with the size ranging from 20 to 65 nm, 93 to 168 nm and 14 to 32 nm in pancreatic, lung and glioma cancer derived exosomes, respectively (Fig. 2a and b), validating their structural integrity throughout the isolation process.34
Our results resonate strongly with the established findings documented in previous research.35,36 Specifically, our investigation mirrors the observations made in an earlier study that focused on isolating exosomes from two different cancer samples, identified exosomes within the size range of 20–200 nm.37,38 This consistency in size suggests a commonality across different cancer types and underscores the robustness of our findings.
However, it is noteworthy to acknowledge the discrepancies between EM and NanoSight analysis due to variations in sample preparation and analysis methods. This discrepancy arises because of the difference between the sample preparation and analysis. EM involves the fixation, dehydration and subsequent observation of exosomes under vacuum conditions, whereas NanoSight analysis counts particles in vitro.39 Despite these differences, both techniques contribute valuable insights into exosome characterization, highlighting the importance of employing multiple approaches to achieve a comprehensive understanding of exosomal morphology.
5.2. Assessment and validation of exosomes
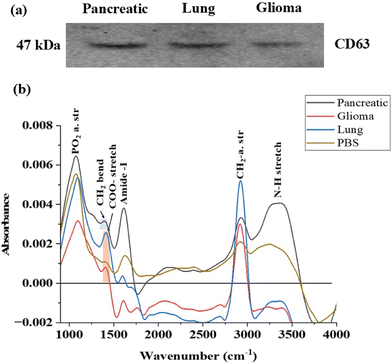
The western blot analysis results, as depicted in Fig. 3a, are consistent with findings from previous studies.43,44 These results serve as a confirmation that a pure population of exosomes, displaying a band of CD63 between 75 kDa and 37 kDa, has been successfully isolated from the cells. The detection of the CD63 protein validates the integrity and purity of the isolated exosomes, ensuring their stability for further investigation in metabolomics studies. This assessment step underscores the reliability and validity of the exosome samples utilized for subsequent analyses.
FTIR emerges as a valuable tool for this purpose46 By analysing the characteristic peaks of exosomes, we can confirm their presence in the sample. Additionally, any unidentified peaks in the FTIR spectrum may indicate the presence of contaminants such as proteins, lipids, apoptotic bodies or large microvesicles. This comprehensive approach provides insight into the purity of the sample ensuring the reliability for subsequent analyses. The spectral analysis revealed distinct peaks indicating various molecular components within the exosomes. In FTIR, the mid-IR spectrum, spanning from 900 to 4000 cm−1, is divided into four main regions.47
In Fig. 3b, the spectral contributions from proteins, specifically the Amide I and Amide III bands, were analysed in exosomal spectra. The Amide I band, observed at 1612 cm−1 and 1598 cm−1 in pancreatic and lung cancer-derived exosomes, corresponds to 70–85% of the stretching vibrations of C![[double bond, length as m-dash]](https://www.rsc.org/images/entities/char_e001.gif) O bonds and 10–20% of C–N bonds. The band between 1404 cm−1 and 1411 cm−1 is attributed to the COO– symmetric stretch, representing fatty acids and amino acids in lung and glioma-derived exosomes, respectively. Additionally, the band at 1394 cm−1 suggests CH2 stretching, indicating the presence of lipids and proteins.
O bonds and 10–20% of C–N bonds. The band between 1404 cm−1 and 1411 cm−1 is attributed to the COO– symmetric stretch, representing fatty acids and amino acids in lung and glioma-derived exosomes, respectively. Additionally, the band at 1394 cm−1 suggests CH2 stretching, indicating the presence of lipids and proteins.
A distinct band above 3000 cm−1 was identified exclusively in pancreatic cancer-derived exosomes, indicating the presence of an N–H stretch associated with proteins. The bands between 2800 cm−1 and 3000 cm−1 provide insights into CH2 and CH3 asymmetric and antisymmetric stretching, which are characteristic of lipids and proteins. Furthermore, the bands between 1076 cm−1 and 1097 cm−1 correspond to PO2− symmetric stretching, signifying the presence of phospholipids and nucleic acids (Fig. 3b).
Although there is some overlap between exosomal signals and PBS, the use of first derivative spectra (Fig. S2†) enabled us to resolve the spectral bands at slightly different wavenumbers, thereby minimizing interference from solvent peaks.48,49
6. Untargeted metabolomics using extensible computational mass spectrometry (XCMS)
In order to evaluate the potential correlation of exosomal metabolites with the previous metabolomic studies of cancer cells and the difference between cancer types, we conducted untargeted metabolomics assessments utilizing LC-MS/MS techniques. The raw data files were initially converted to the mzXML format and subsequently analysed using XCMS software.28 Our analysis revealed the identification of 121 metabolites associated with pancreatic cancer, 34 metabolites linked to lung cancer, and 302 metabolites associated with glioma cancer, with all findings exhibiting a significant P-value of less than or equal to 0.05.6.1. The role of different metabolites in cancer progression
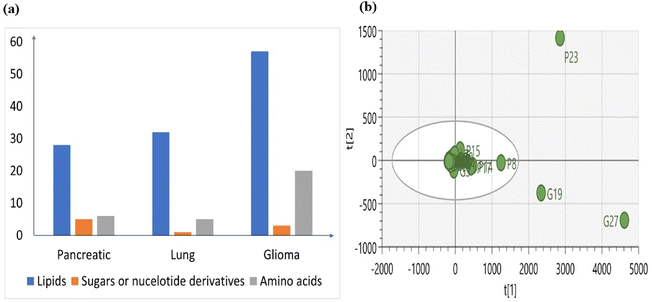
Metabolomic signatures were investigated in three different cancers by isolating exosomes derived from cancer cells and extracting metabolites from them. Initially, LCMS analysis was performed to identify the metabolomic profiles, revealing variations in the numbers of lipids, sugars, nucleotides, and amino acids among the different cancer types (Fig. 4a). These variations indicate a distinct metabolic profile associated with each cancer type.We also conducted Principal Component Analysis (PCA) to find out any outliers and we have observed that most features of exosomes from lung cancer are similar to those of the other two (Fig. 4b). However, specific features stand out as outliers in pancreatic and glioma cancer. In pancreatic cancer, feature P23 corresponding to upregulated Acyl-CoA is identified as an outlier. Conversely, in glioma cancer, features G19 and G27 corresponding to upregulated Phosphatidyl Serine (PS) and bile acid derivatives, respectively, are identified as outliers.
The outliers may present unique characteristics or aberrations within the dataset and suggest that the levels of outliers in exosomes derived from cancer cells differ significantly from the average levels observed across all samples, indicating a distinct metabolic profile.51
This section discusses the specific metabolites present in each cancer type and their associated roles. Additionally, pathway enrichment analysis was conducted to identify correlations between the detected metabolites and various metabolic pathways.
Furthermore, alterations in lipid metabolism, particularly increased de novo synthesis of fatty acids and cholesterol with the help of mitochondrial citrate, the intermediate of tricarboxylic acid (TCA) cycle, have been observed previously. This metabolic shift supports rapid membrane formation and posttranslational modifications of proteins, facilitating cancer cell growth. Consistent with these data, fatty acids such as DL-3-hydrox + AB34:AB40y caproic acid, sphingosine, palmitoyl-EA, phosphatidyl glycerol (PG), monoacylglycerol (MG), prostaglandin E2 p-acetamidophenyl ester, PA (21![[thin space (1/6-em)]](https://www.rsc.org/images/entities/char_2009.gif) :
:![[thin space (1/6-em)]](https://www.rsc.org/images/entities/char_2009.gif) 0/0
0/0![[thin space (1/6-em)]](https://www.rsc.org/images/entities/char_2009.gif) :
:![[thin space (1/6-em)]](https://www.rsc.org/images/entities/char_2009.gif) 0), DL-3-hydrox + AB34:AB40y caproic acid, sphingosine, 2,3-dinor-6-keto prostaglandin F1α-d9, and 25-hydroxy-16,17,23,24-tetradehydrovitamin (cholecalciferol) have been found to be upregulated in exosomes indicating the role of lipid metabolism in cancer progression.53
0), DL-3-hydrox + AB34:AB40y caproic acid, sphingosine, 2,3-dinor-6-keto prostaglandin F1α-d9, and 25-hydroxy-16,17,23,24-tetradehydrovitamin (cholecalciferol) have been found to be upregulated in exosomes indicating the role of lipid metabolism in cancer progression.53
In addition to glycerophospholipids, upregulation of glycosides, amino acids, aldehydes and certain nucleotides was also noted (Table S1†). Increased glycosylation, a hallmark of cancer, was evident, paralleling findings in prostate cancer where altered sialylation or fucosylation of O-β-N-acetylglucosamine promotes cancer cell migration and immune evasion.54 So, these upregulated glycosylation markers could be used for early diagnosis as reported previously that carbohydrate glycans can be used for diagnostic and prognostic studies.55
Furthermore, the expression of 7-chloro-L-tryptophan and certain nucleotides such as Guanosine Mono Phosphate (GMP) and adenosine 5′-phosphate disodium salt has been upregulated. The upregulation of 7-chloro-L-tryptophan highlights the role of tryptophan degrading enzymes which is linked to the increased metabolism of tryptophan in tumours.50 Tryptophan has gained attention because of its use in proinflammatory action to suppress the immune system in cancer. By ensuring increased proliferation and survival, tryptophan is considered as an essential nutrient for the tumour and tumour microenvironment,56 whereas the upregulation of nucleotides also shows their role in the aggressive behaviour of cancer cells, proliferation, immune evasion and metastasis.57
PCA analysis conducted on pancreatic cancer metabolites (Fig. 4b), along with those from other sources, has revealed distinct clusters of various features. Interestingly, one feature specific to pancreatic cancer-derived exosomes, labelled as ‘P’, was identified as an outlier. This suggests that these features differ significantly from the average levels of other features or clusters.
In order to classify the characteristics of these metabolites, pathway enrichment analysis was conducted using MetaboAnalyst 6.0. The significant metabolites (p < 0.05) were analysed and as a result, a total of 8 pathways were identified as shown in Fig. 5(a). Among them, the folate biosynthesis pathway had a significant impact in terms of −log![[thin space (1/6-em)]](https://www.rsc.org/images/entities/char_2009.gif) 10(p).
10(p).
Overall, our findings underscore the complex metabolic alterations in terms of phospholipids, glycerophospholipids, amino acids and nucleotides in pancreatic cancer, suggesting potential biomarkers and therapeutic targets for further investigation. The top 29 metabolites responsible for the aggressive behaviour of pancreatic cancer cells are listed in Table S1.†
The identification of sphingolipids like dehydrophytosphingosine, 6-hydroxysphingosine along with fatty acids such as 9-hydroxy-12Z-octadecenoic acid, 3-keto stearic acid, and palmitic amide highlights significant alterations in lipid and fatty acid (FA) metabolism. Sphingosine, a key intermediate in sphingolipid metabolism, plays a crucial role in ceramide synthesis through the de novo synthesis pathway (Fig. 6). Variations in Sphingosine levels can impact ceramide production, contributing to the anti-apoptotic microenvironment in cancer cells and facilitating tumour progression and metastasis,58 whereas the presence of fatty acids in exosomes suggests their involvement in lung cancer cells, where cancer cells acquire fatty acids from either endogenous synthesis or exogenous sources like glucose, altering fatty acid transport and lipogenesis metabolism.59
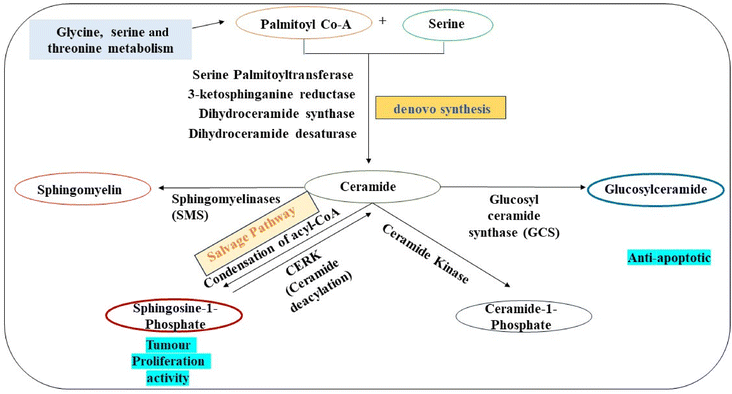 | ||
| Fig. 6 De novo pathway of sphingolipid metabolism related to observed upregulated intermediates in exosomes from glioma cancer cells. | ||
Prior research has noted alterations in six amino acids like histidine, glutamine, glycine, threonine, alanine and valine within lung cancer cells. However, our analysis of exosomes from lung cancer cells revealed the presence of cysteine, arginine and threonine intermediates. While threonine's presence aligns with previous findings,60 the identification of cysteine, a non-essential amino acid, holds significance in cancer biology.
Studies indicate that non-essential amino acids can become essential during tumorigenesis. Specifically, cysteine plays a crucial role facilitated by excitatory amino acid transporter 3 (EAAT3), which is highly expressed in various tissues including the lungs. EAAT3 facilitates cysteine transport from the extracellular environment into tumour cells, thereby contributing to cellular homeostasis and tumour cell proliferation.61 When considering arginine, a semi-essential amino acid, it is important to note its role in the DNA repair system and nucleotide pool. Studies indicate that an adequate supply of arginine is necessary for these processes. However, it has been observed that over 70% of tumours lack arginosuccinate synthetase 1 (ASS1) transcription, which is essential for arginine function. This deficiency in ASS1 leaves tumour cells reliant on external sources of arginine, thereby impacting DNA repair mechanisms.62
The PCA analysis conducted on lung cancer metabolites (Fig. 4b), along with those from other sources, has revealed distinct clusters of various features. Interestingly, none of the features specific to lung cancer-derived exosomes, labelled as ‘L’, were identified as outliers. This suggests a similarity or resemblance between these features and those from other sources, indicating potential commonalities in their metabolic profiles.
In order to classify the characteristics of these metabolites, pathway enrichment analysis was conducted using MetaboAnalyst 6.0. The significant metabolites (p < 0.05) were analysed and as a result, a total of 4 pathways were identified as shown in Fig. 5(b). Among them, the linoleic acid metabolism pathway had a significant impact on −log![[thin space (1/6-em)]](https://www.rsc.org/images/entities/char_2009.gif) 10(p).
10(p).
Specific lipid species, such as Phosphatidyl Glycerol, may mark an increased risk of chemoresistance, potentially explaining the role of lipids in cancer progression.63 Additionally, upregulation of Diacylglycerols (DG) such as DG (17![[thin space (1/6-em)]](https://www.rsc.org/images/entities/char_2009.gif) :
:![[thin space (1/6-em)]](https://www.rsc.org/images/entities/char_2009.gif) 2, 22
2, 22![[thin space (1/6-em)]](https://www.rsc.org/images/entities/char_2009.gif) :
:![[thin space (1/6-em)]](https://www.rsc.org/images/entities/char_2009.gif) 6) and DG (15
6) and DG (15![[thin space (1/6-em)]](https://www.rsc.org/images/entities/char_2009.gif) :
:![[thin space (1/6-em)]](https://www.rsc.org/images/entities/char_2009.gif) 1 and 17
1 and 17![[thin space (1/6-em)]](https://www.rsc.org/images/entities/char_2009.gif) :
:![[thin space (1/6-em)]](https://www.rsc.org/images/entities/char_2009.gif) 0) was noted in our study, although these particular DG species were not categorized as anticarcinogenic lipids previously.64
0) was noted in our study, although these particular DG species were not categorized as anticarcinogenic lipids previously.64
The Phosphatidic Acid (PA) observed in our data has a specific role in autophagy signalling, promoting cancer cell proliferation and survival.65 Furthermore, the ceramides and Sphingosine-1-Phosphate (S1P) detected play major roles associated with increased tumour cell proliferation whereas S1P is associated with treatment resistance and induction of cellular growth respectively.66 The different lipid intermediates of sphingolipid metabolism which are related to ceramides are given in Fig. 6. This explains the whole pathway of sphingolipid metabolism in which the denovo pathway involving serine palmitoyl transferase, 3-ketosphinganine reductase, dihydroceramide synthase and dihydroceramide desaturase results in ceramide formation. Ceramides can also be generated by the hydrolysis of sphingomyelin with the action of enzymes called sphingomyelinases (SMSs). Additionally, sphingosine-1-phosphate can also function as a precursor for the production of ceramides through the well-known salvage pathway involving CERS1–6 (ceramide synthases). A few enzyme mutations and the up- or down-regulation of metabolites that are responsible for cancer cell survival, angiogenesis and metastasis have been linked directly to sphingolipid metabolism and cancer.
Interestingly, our study highlighted Nucleotide sugars in exosomes derived from Glioma cancer cells, indicating their role in the complex synthesis of glycolipids, glycoproteins and polysaccharides (Table S3†). Higher levels of Vit. D3 are observed, which is an anticarcinogenic metabolite, possibly reflecting an adaptive response of glioma cells to their TME or intercellular signalling.67
In addition to lipids, amino acids and amino acid derivatives like glutamine, isoglutamine, serine, and glycine were detected, reflecting rewired amino acid metabolism in glioma cells helping with increased stress tolerance, signal transduction and epigenetic modifications.65 Glutamine addiction was evident in the presence of glutamine, isoglutamine and glutamine derivatives directing cellular carbon pool consumption towards the tricarboxylic acid (TCA) cycle for energy production,68,69 whereas serine plays a role in purine and pyrimidine synthesis. Studies have reported the reliance of glioma cells on serine under glutamine-deprived conditions. Also, increased glycine and serine levels indicated their role in nucleoside synthesis, thus suggesting a rewired metabolism promoting proliferation and survival in glioma cells.
The PCA analysis conducted on Glioma cancer metabolites (Fig. 4b), along with those from other sources, has revealed distinct clusters of various features. Interestingly, two features specific to Glioma cancer-derived exosomes, labelled as ‘G’, were identified as outliers. This suggests that these features differ significantly from the average levels of other features or clusters.
In order to classify the characteristics of these metabolites, pathway enrichment analysis was conducted using MetaboAnalyst 6.0. The significant metabolites (p < 0.05) were analysed and as a result, a total of 6 pathways were identified as shown in Fig. 5(c). Among them, the Sphingolipid metabolism pathway had a significant impact in terms of −log![[thin space (1/6-em)]](https://www.rsc.org/images/entities/char_2009.gif) 10(p).
10(p).
Our LCMS study revealed significant variations in metabolite signatures among the three different cancer cell types, with a predominant focus on lipids or fatty acids followed by other small metabolites. To validate these signatures and explore potential similarities or differences between analytical techniques for biomarker studies, we conducted NMR analysis. The details of the NMR technique, samples, and identified metabolites are discussed in section 7.
7. Identification of exosome derived metabolites using NMR
Exosomes isolated from different cancer types were analysed using 1H NMR spectroscopy, with direct analysis yielding superior results compared to methanol-based and chloroform-based extraction methods. The Biological Magnetic Resonance Data Bank (BMRB) database70 was utilized for peak characterization and assignment, resulting in 241 total hits for pancreatic cancer, 266 for lung cancer, and 270 for glioma cancer. Human metabolites were manually assigned to each peak, and further pathway analysis was conducted to assess their potential roles in cancer progression or suppression. Unique and common peaks were identified in exosomes derived from all three cancer types, as discussed in detail in section 7.1.7.1. Identification of metabolites in exosomes derived from three cancer cell lines
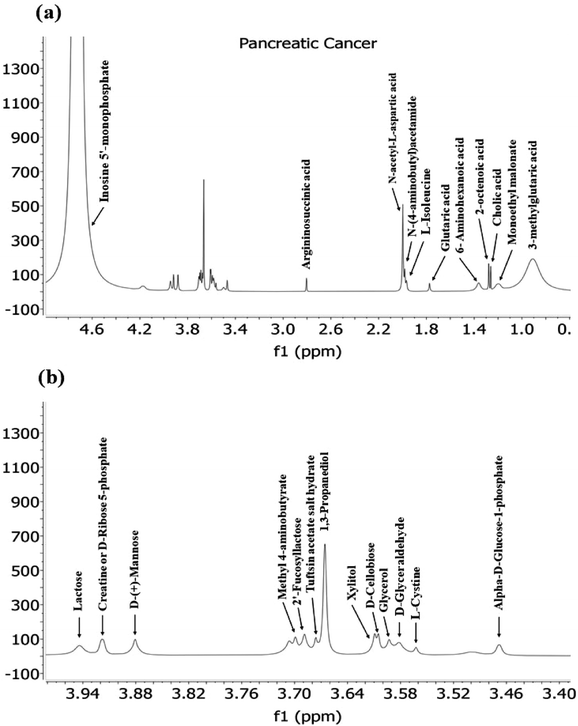
The extensive list of metabolites predicted through the Biological Magnetic Resonance Data bank (BMRB) using (δH) NMR studies of pancreatic, lung and glioma cancer cell-derived exosomes provides valuable insights into the metabolic landscape associated with this aggressive cancer type.In pancreatic cancer, various metabolites were detected revealing potential mechanisms and pathways involved in disease progression (Fig. 7.). Notably, amino acids like L-isoleucine, L-cysteine, and derivatives such as argininosuccinic acid (derivative of Arginine), N-acetyl-L-aspartic acid, N(4-aminobutyl) acetamide (derivative of ornithine), 6-aminohexanoic acid and creatine (derivative of glycine, arginine and methionine) were identified. These amino acids, particularly arginine and glycine, have been reported to become essential for tumour survival, growth and proliferation, highlighting their role in metabolic reprogramming during cancer progression.47 For instance, glycine, alongside its intermediate products, is involved in the serine–glycine metabolic pathway, which has been implicated in enhancing tumour cell survival, as described in previous studies.71
The detection of sugars like lactose, D-(+)-mannose, and others indicated their significant roles in carbohydrate metabolism in cancer. Additionally, the presence of fucosylated sugars suggests their correlation with tumour progression, supported by earlier studies showing the association of specific fucosylated structures, such as Lacto-N-fucopentoses (LNF) III, with cancer.72
The study also identified metabolites like Glutaric acid, 2-octenoic acid, cholic acid and others. For instance, octanoic acid, a medium-chain fatty acid, is naturally found in mammalian milk and plant oils.73 Research has linked medium and long-chain fatty acids to altered gene expression related to breast cancer,74 with elevated serum levels of octanoic acid being considered a potential cancer biomarker.75 Additionally, Glutaric acid, as an intermediate in tryptophan and lysine catabolism, plays a significant role in amino acid metabolic reprogramming, crucial for cancer cell metabolism. Alterations in Glutaric acid regulation could be pivotal for understanding metabolic changes in pancreatic cancer.76
Moreover, bile salts, including Cholic acid, are well-studied in various cancer types, including pancreatic ductal adenocarcinoma (PDAC). In PDAC, bile acids are associated with decreased apoptosis, increased cancer cell proliferation, and the expression of tumour-suppressive factors, highlighting their complex role in cancer progression.77 Other metabolites, such as Malonate, have been implicated in chemoresistance in cancer,78 while glycerol and D-glyceraldehyde, associated with glycolysis or carbohydrate metabolism, promote tumour cell proliferation, growth, and metastasis.79 This comprehensive analysis of metabolites provides a broader perspective on their roles in cancer and their potential as biomarkers or therapeutic targets.
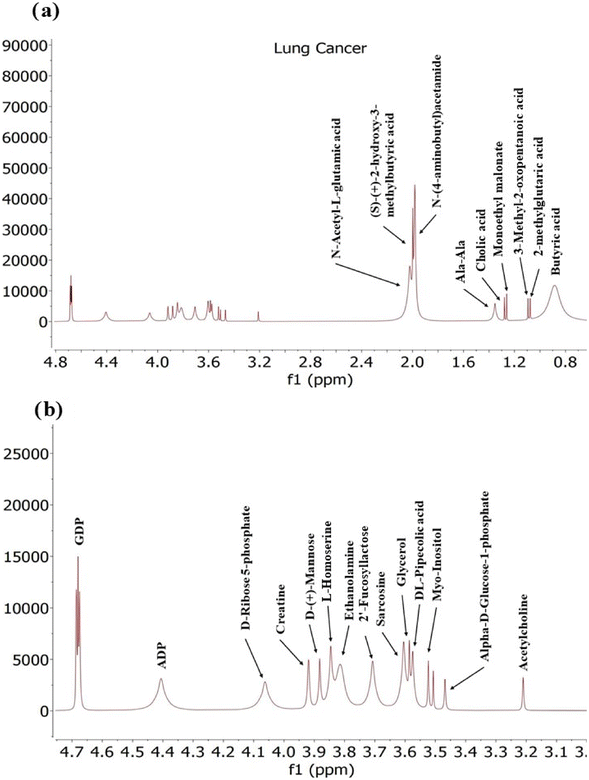
Exosomes derived from lung cancer cells contain a diverse range of metabolites including amino acids, sugars, Fatty acids and nucleotides (Fig. 8) This suggests a significant metabolic reprogramming in cancer cells potentially fuelled by altered signalling pathways.
In lung cancer, various metabolites play crucial roles in altering metabolic pathways and influencing tumour progression. ADP and GDP are essential for cellular energy metabolism, and their levels can reflect changes in cancer cell energy demands.
These two nucleotides, GDP and adenosine-3′-diphosphate (ADP), were found in exosomes. Lung cancer cells have been reported to increase the uptake of various nutrients, including nucleotides, to support their high energy demands. Adenosine monophosphate (AMP) serves as a precursor for adenosine triphosphate (ATP), the primary energy source for cells, while guanosine diphosphate (GDP) is involved in the synthesis of guanosine triphosphate (GTP). The presence of AMP and GDP in exosomes reflects the metabolic activity of lung cancer cells and may influence cellular energy levels, supporting the proliferation of cancer cells.80N-Acetyl-glutamic acid and 2-hydroxy-3-methylbutyric acid are involved in amino acid and branched-chain amino acid metabolism, respectively, indicating potential disruptions in metabolic processes that support tumour growth. Putrescine, a polyamine, is associated with rapid cell proliferation and cancer progression. Ala-Ala and Cholic Acid affect protein metabolism81 and lipid metabolism,77 respectively, which can impact cancer cell behaviour and the tumour microenvironment. Monoethyl Malonate and 2-Methylglutaric Acid reflect alterations in metabolic pathways related to malonate and branched-chain amino acids, revealing changes in metabolic fluxes in cancer.79 3-Methyl-2-Oxopentanoic Acid indicates disturbances in leucine catabolism, while Butyric Acid has potential anticancer properties by influencing cell proliferation and apoptosis. D-Ribose-5-phosphate and creatine are involved in nucleic acid synthesis and energy storage, respectively, crucial for cancer cell metabolism. D-(+)-Mannose, L-Homoserine, Ethanolamine, and Myo-Inositol are important for glycosylation, amino acid metabolism, and cell signalling, all of which can be altered in cancer. Finally, 2-Fucosyllactose, DL-Pipecolic Acid, and Sarcosine reflect changes in glycan structures, amino acid metabolism, and methylation processes that may influence tumour biology.72
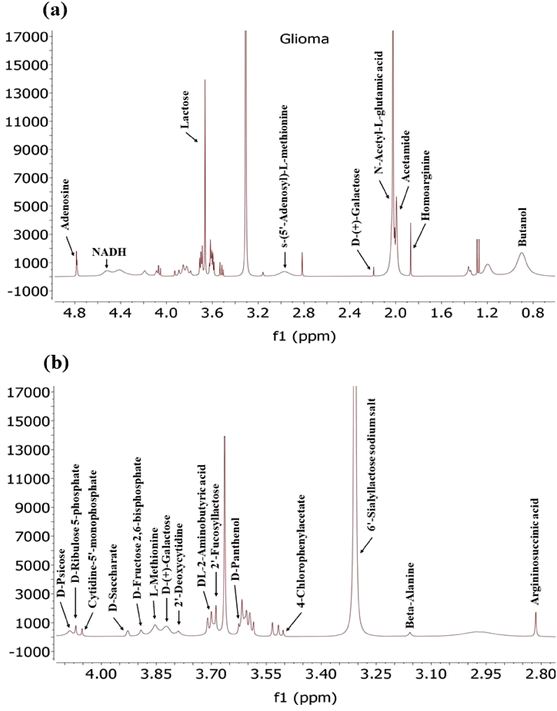
Exosomes derived from glioma cancer cells (Fig. 9) contain a diverse array of various metabolites including amino acids, sugars, and nucleotides, as detected by NMR. These metabolites reflect the metabolic status of the cancer cells and may have implications for tumour growth and immune response modulation. Among the amino acids detected in exosomes are L-Methionine, Beta-Alanine, DL-2-Aminobutyric acid, Homoarginine and Arginosuccinic acid.
While previous studies have shown downregulation of certain amino acids like glutamine, arginine, glycine and histidine in glioma cells,67 another study has highlighted that glioma cells exhibit the capability to uptake essential amino fatty acids and other nutrients from the extracellular surroundings, subsequently utilizing them for energy production. This suggests that there might be an abundance of these amino acids within the glioma cells, which is reflected in the composition of exosomes. However, the presence of these amino acids in exosomes may also indicate their involvement in immune response modulation and tumour growth, as suggested by previous research findings.80
In addition to the unique metabolites identified in Pancreatic, Lung and Glioma (Fig. 10) cancer exosomes, there were several common metabolites shared among them. For instance, Glutaric acid, D-(+)-Mannose, Monoethyl-Malonate, Creatine, and D-Ribose-5-Phosphate were found in exosomes derived from both pancreatic and lung cancer. Similarly, exosomes from Pancreatic and glioma shared a common metabolite such as Argininosuccinic acid. Additionally, three metabolites named 2-fucosyllactose, cholic acid, acetamide and its derivatives were common among exosomes from all three cancer types.
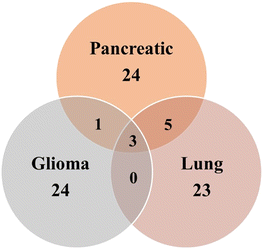 | ||
| Fig. 10 Venn diagram of the overlapped number of metabolites in exosomes among three different cancer types. | ||
These detected metabolites in exosomes are crucial nutrients for tumour cell survival. Furthermore, the presence of bile acids like cholic acid suggests their potential role in cancer progression. Bile acids have been known to activate various signalling receptors including G-Protein coupled receptors (GPCRs), sphingolipid metabolism specific receptors, nuclear receptors, Vit D receptors and liver receptors, potentially promoting cancer cell proliferation and migration via the JAK2/STAT3 (Janus Kinase 2/Signal Transducer and Activator of Transcription 3) pathway.77,81
Moreover, through metabolomic analysis via MetaboAnalyst 6.0, involvement in seven, nine and eight metabolic pathways has been identified in pancreatic, lung and glioma cancers, respectively (Fig. S3, S4 and S5†). This has been potentially offering targets for therapeutic intervention in these three different cancers. The comprehensive analysis of metabolites sheds light on the intricate metabolic alterations driving cancer progression.
8. Conclusion
In conclusion, our study demonstrates the effectiveness of utilizing both LC-MS/MS and NMR techniques for profiling metabolites in cancer-derived exosomes. The combination of these two complementary techniques provided comprehensive insights into the metabolic signatures of cancer cells. Importantly, we observed consistent results across both techniques, with several metabolites and pathways shared among the same cancer types. This consistency reaffirms the reliability of these identified metabolites as potential markers for cancer identification. Furthermore, the detection of common metabolites and pathways using different techniques strengthens our confidence in their roles in cancer progression and highlights their potential as diagnostic or therapeutic targets. Importantly, our observations regarding the preferential detection of lipids by LC-MS/MS and amino acids/sugars by NMR offer valuable insights into tailoring detection strategies based on the specific class of metabolites of interest.Our analysis of metabolites in pancreatic cancer-derived exosomes revealed the presence of common metabolites such as amino acids (alanine, lysine, tryptophan), sugars (glucose, mannose), nucleotides (inosine monophosphate), fatty acids (propionic acid, valeric acid), and neurotransmitters (serotonin).
Whereas, common metabolites like cysteine, arginine, threonine, and fatty acids were detected in exosomes derived from lung cancer cells and in glioma cancer derived exosomes, metabolites such as phosphatidyl glycerol, diacylglycerols, phosphatidic acid, ceramides, and sphingosine-1-phosphate emerged as key players in glioma progression, warranting further investigation. These metabolites play critical roles in various aspects of cancer progression.
Overall, our findings underscore the intricate metabolic rewiring occurring in pancreatic, lung, and glioma cancers, offering potential biomarkers and therapeutic targets for further investigation. The identification of specific metabolites associated with each cancer type provides valuable insights into the underlying metabolic pathways driving cancer progression and highlights the heterogeneity of metabolic alterations across different cancer types. Further research into the precise roles of these metabolites in cancer biology is warranted to develop targeted therapeutic interventions and improve patient outcomes.
Author contributions
The first author conceived and designed the study, conducted all experiments, performed data analysis and drafted the manuscript.The corresponding author provided supervision during the experimental phase, offered scientific insights, and contributed to the revision and correction of the manuscript.
Data availability
The data supporting this article have been included as part of the ESI.†Conflicts of interest
The authors declare that they have no conflicts of interest regarding the publication of this manuscript.Acknowledgements
The authors gratefully acknowledge the Institute of Science and Technology (INST) for providing the necessary laboratory space to conduct the experiments. Additionally, we extend our gratitude to the University Grants Commission (UGC) for the fellowship support provided to the first author. We would like to thank Punjab University for assistance in conducting LC-MS/MS analysis and the Indian Institute of Toxicology Research (IITR), Lucknow, for assistance in conducting nanoparticle tracking analysis (NTA) of our samples.References
- S. Sarkar, G. Horn, K. Moulton, A. Oza, S. Byler, S. Kokolus and M. Longcare, Int. J. Mol. Sci., 2013, 14(10), 21087–21113 CrossRef.
- I. Li and B. Y. Nabet, Mol. Cancer, 2019, 18(1), 32 CrossRef PubMed.
- J. Maia, S. Caja, M. C. S. Moraes, N. Cuoto and B. C. Silva, Front. Cell Dev. Biol., 2018, 6, 18 CrossRef.
- L. Milane, A. Singh, G. Mattheolabakis, M. Suresh and M. M. Amiji, J. Controlled Release, 2015, 219, 287–294 CrossRef.
- Y. Risha, Z. Minic, S. M. Ghobadloo and M. V. Berezovski, Sci. Rep., 2020, 10(1), 13572 CrossRef CAS PubMed.
- J. Xu, J. Zhang, Z. Zhang, Z. Gao, Y. Qi, W. Qiu, Z. Pan, Q. Guo, B. Li, S. Zhao, X. Guo, M. Qian, Z. Chen, S. Wang, X. Gao, S. Zhang, H. Wang, X. Guo, P. Zhang, R. Zhao, H. Xue and G. Li, Nat. – Cell Death Dis., 2021, 12, 373 CrossRef CAS PubMed.
- L. Ge, F. Zhou, J. Nie, Z. Wang and Q. Zhao, SEBM Exp. Biol. Med., 2021, 246, 17 Search PubMed.
- B. C. Jena, S. Sarkar, L. Rout and M. Mandal, Cancer Lett., 2021, 520, 222–232 CrossRef PubMed.
- E. Yang, X. Wang, Z. Gong, M. Yu, H. Wu and D. Zhang, Signal Transduction Targeted Ther., 2020, 5, 242 CrossRef.
- W. Wang, Z. Rong, G. Wang, Y. Hou, F. Yang and M. Qiu, Biomarker Res., 2023, 11, 66 CrossRef.
- S. Qiu, Y. Cai, H. Yao, C. Lin, Y. Xie, S. Tang and A. Zhang, Signal Transduction Targeted Ther., 2023, 8, 132 CrossRef PubMed.
- Y. J. Choi, K. Lee, M. Joeng, Y. C. Shin and S. G. Ko, Metabolites, 2022, 12(11), 1037 CrossRef.
- A. E. Kaoutari, N. A. Fraunhoffer, O. Hoare, C. Teyssedoue, P. Soubeyran, O. Gayet, J. Roques, G. Lomberk, R. Urrutia, N. Dusetti and J. Lovanna, EBioMedicine, 2021, 66, 103332 CrossRef CAS PubMed.
- L.-B. Wang, A. Karpova, M. A. Gritsenko, J. E. Kyle, S. Cao, Y. Li, D. Rykunov, A. Colaprico, J. H. Rothstein, R. Hong, V. Stathias, M. Cornwell, F. Petralia, Y. Wu, B. Reva, K. Krug, P. Pugliese, E. Kawaler, L. K. Olsen, W. W. Liang, X. Song, Y. Dou, M. C. Wendl, W. Caravan, W. Liu, D. C. Zhou, J. Ji, C. F. Tsai, V. A. Petyuk, J. Moon, W. Ma, R. K. Chu, K. K. Weitz, R. J. Moore, M. E. Monroe, R. Zhao, X. Yang, S. Yoo, A. Krek, A. Demopoulos, H. Zhu, M. A. Wyczalkowski, J. F. McMichael, B. L. Henderson, C. M. Lindgren, H. Boekweg, S. Lu, J. Baral, L. Yao, K. G. Stratton, L. M. Bramer, E. Zink, S. P. Couvillion, K. J. Bloodsworth, S. Satpathy, W. Sieh, S. M. Boca, S. Schurer, F. Chen, M. Wiznerowicz, K. A. Ketchum, E. S. Boja, C. R. Kinsinger, A. I. Robles, T. Hiltke, M. Thiagarajan, A. L. Neivizhskii, B. Zhang, D. R. Mani, M. Ceccarelli, X. S. Chen, S. L. Cottingham, Q. K. Li, A. H. Kim, D. Fenyo, K. V. Ruggles, H. Rodriguez, M. Mesri, S. H. Payne, A. C. Resnick, P. Wang, R. D. Smith, A. Lavarone, M. G. Chedda, J. S. B. Sloan, K. D. Rodland, T. Liu and L. Ding, Cancer Cell, 2021, 39(4), 509–528.e20 CrossRef CAS PubMed.
- S. a. Qi, Q. Wu, Z. Chen, W. Zhang, Y. Zhou, K. Mao, J. Li, Y. Li, J. Chen, Y. Huang and Y. Huang, Sci. Rep., 2021, 11, 11805 CrossRef CAS PubMed.
- A. Makler and W. Asghar, Expert Rev. Mol. Diagn., 2020, 20, 387–400 CrossRef CAS PubMed.
- Y. Zhou, Y. Zhang, H. Gong, S. Luo and Y. Cui, Int. J. Mol. Sci., 2021, 22(22), 12204 CrossRef CAS PubMed.
- G. K. Patel, M. A. Khan, H. Zubair, S. K. Srivastava, M. Khushman, S. Singh and A. P. Singh, Sci. Rep., 2019, 9, 5335 CrossRef PubMed.
- X. Wang, J. Xia, L. Yang, J. Dai and L. He, Cancer Gene Ther., 2023, 30, 1051–1065 CAS.
- T. Smyth, K. Petrova, N. M. Payton, I. Persaud, J. S. Redzic, M. W. Graner, P. S. Jones and T. J. Anchordoquy, Bioconjugate Chem., 2014, 25(10), 1777–1784 Search PubMed.
- R. Kornilov, M. Puhka, B. Mannerstrom, H. Hiidenmaa, H. Peltoneimi, P. Siljander, R. S. Kaijansinklo and S. Kaur, J. Extracell. Vesicles, 2018, 7(1), 1422674 Search PubMed.
- S. L. Shu, C. L. Allen, S. B. Davalos, M. Koroleva, D. MacFarland, H. Minderman and M. S. Ernstoff, Melanoma, 2021, 2265, 289–304 CAS.
- C. Bellotti, K. Lang, N. Kuplennik, A. Sosnik and R. Steinfield, Sci. Rep., 2021, 11, 10550 CrossRef CAS PubMed.
- V. Sokolova, A. K. Ludwig, S. Hornung, O. Rotan, P. A. Horn, M. Epple and B. Giebel, Colloids Surf., B, 2011, 87(1), 146–150 CrossRef CAS PubMed.
- E. N. Prendergast, M. A. d. S. Fonseca, F. S. Dezem, J. Lester, B. Y. Karlan, H. Noushmehr, Z. Lin and K. Lawreson, PLoS One, 2019, 13(5), e0196913 CrossRef.
- E. Zeringer, M. Li, T. Barta, J. Schageman, K. W. Pedersen, A. Neurauter, S. Magdaleno, R. Setterquist and A. V. Vlassove, World J. Methodol., 2013, 3(1), 11–18 CrossRef.
- V. R. Garcia, I. T. Domenech, A. M. Gimenez, M. Gormaz, A. P. Llorca, A. P. Shephard, P. Sepulveda, D. P. Guaita, M. Vento, B. Lendl, G. Quintos and J. Kuligowski, Chemom. Intell. Lab., 2021, 217, 104401 Search PubMed.
- F. A. Alzahrani, M. R. S. Mohammed, S. Alkarim, E. I. Azhar, M. A. Ei-Magd, Y. Hawsawi, W. H. Abdulaal, A. Yusuf, A. Alhatmi, R. Albiheyri, B. Fakhurji, B. Kurdi, T. A. Madani, H. Alguridi, R. S. Alosaimi and M. I. Khan, Int. J. Mol. Sci., 2021, 22(19), 10467 CrossRef CAS.
- R. M. Qazi, Z. Sajid, C. Zhao, I. Hussain, F. Iftikkhar, M. Jameel, F. U. Rehman and A. A. Mian, Int. J. Mol. Sci., 2023, 24(13), 10477 CrossRef CAS PubMed.
- M. Agudiez, P. J. Martinez, M. M. Lorenzo, A. Heredero, A. S. Hernandez, D. Molero, J. M. G. Segura, G. A. Echevarria and G. A. Llamas, BMC Biol., 2020, 18, 192 CrossRef CAS.
- N. Comfort, K. Cai, T. R. Bloomquist, M. D. Strait, A. W. F. Jr and A. A. Baccarelli, J. Visualized Exp., 2021, 169 Search PubMed.
- G. Midekessa, K. Godakumara, K. Dissanayake, M. M. Hasan, Q. U. A. Reshi, T. Rinken and A. Fazeli, Membranes, 2021, 11(10), 779 CrossRef CAS PubMed.
- T. Shimomura, R. Seino, K. Umezaki, A. Shimoda, T. Ezoe, M. Ishiyama and K. Akiyashi, Bioconjugate Chem., 2021, 32(4), 680–684 Search PubMed.
- T. K. Kurian, S. Banik, D. Gopal, S. Chakrabarti and N. Mazumder, Mol. Biotechnol., 2021, 63, 249–266 CrossRef CAS PubMed.
- M. S. Albero, M. d. M. E. Berzosa, M. B. Visiedo, L. F. Messina, V. Sebastian, F. S. Madrid, M. Arruebo, J. Santanmaria and P. M. Duque, Nanoscale, 2019, 11, 18825–18836 Search PubMed.
- Y. Wu, W. Deng and D. J. Klinke II, Analyst, 2015, 140, 6631–6642 RSC.
- E. H. Behesthi, W. Choi, L. B. Weiswald, G. Kharmate, M. Ghaffari, M. R. Moniri, M. D. Hassona, L. Chan, M. Y. Chin, I. T. Tai, P. S. Rennie, L. Fazil and E. S. T. Guns, Oncotarget, 2016, 7(12), 14639–14658 CrossRef PubMed.
- S. Zhand, K. Xiazo, S. R. Bazaz, Y. Zhu, P. Bordhan, D. Jin and M. E. Warkiani, Appl. Mater. Today, 2021, 23, 100994 CrossRef.
- D. Taller, K. Richards, Z. Slouka, S. Senapati, R. Hill, D. B. Go and H. C. Chang, Lab Chip, 2015, 15, 1656–1666 RSC.
- E. J. K. Kowal, D. T. Ovanesyan, A. Regev and G. M. Church, Methods Mol. Biol., 2017, 1660, 143–152 CrossRef CAS PubMed.
- D. Panwar, D. Shrivastava, A. Kumar, L. K. Gupta, N. S. S. Kumar and A. D. Chintagunta, AMB Express, 2023, 13, 90 Search PubMed.
- M. Khushman, G. K. Patel, J. A. Laurini, A. Bhardwaj, K. Roveda, R. Donnell, K. Sherling, B. Case, A. E. Frankel, S. Pai, W. Taylor, M. C. B. Tan, M. Mizrahi, C. Nelson, M. Wyatt, M. Patton, S. M. Clellan, S. Singh, B. Wang and A. P. Singh, J. Gastrointest. Oncol., 2019, 10(4), 695–702 CrossRef.
- M. Mathieu, N. Nevo, M. Jouve, J. I. Valenzuela, M. Maurin, F. J. Verweji, R. Palmulli, D. Lankar, F. Dingli, D. Loew, E. Rubinstein, G. Boncompain, F. Perez and C. Thery, Nat. Commun., 2021, 12, 4389 CrossRef CAS.
- A. Yurtsever, T. Yoshida, A. B. Behjat, Y. Araki, R. Hanayama and T. Fukuma, Nanoscale, 2020, 13, 6661–6677 RSC.
- J. V. Deun, P. Mestdagh, R. Sormunen, V. Cocquytm, K. Vermaelen, J. Vandesompele, M. Bracke, O. D. Wever and A. Hendrix, J. Extracell. Vesicles, 2014, 3, 24858 CrossRef.
- S. Romano, F. D. Giacinto, A. Primiano, J. Gervasoni, A. Mazzini, M. Papi, A. Urbani, A. Serafino, M. D. Spirito, E. K. Krasnowska and G. Ciasca, Anal. Chim. Acta, 2022, 1192, 339359 CrossRef CAS PubMed.
- A. B. D. Nandiyanto, R. Oktiani and R. Ragadhita, Indones. J. Sci. Technol., 2019, 4, 1 Search PubMed.
- R. D. Santo, B. Niccolini, S. Romano, M. Vaccaro, F. D. Giancinto, M. D. Spirito and G. Ciasca, Spectrochim. Acta, Part A, 2024, 305, 123346 CrossRef PubMed.
- V. R. Garcia, I. T. Domenech, A. M. Gimenez, M. Gormaz, A. P. Llorca, A. P. Shephard, P. Sepulveda, D. P. Guaita, M. Vento, B. Lendl, G. Quintas and J. Kuligowski, Chemom. Intell. Lab. Syst., 2021, 217, 104401 CrossRef.
- R. Xu, J. Yang, B. Ren, H. Wang, G. Yang, Y. Chen, L. You and Y. Zhao, Front. Oncol., 2020, 10, 572722 CrossRef.
- G. Nyamundanda, L. Brennan and I. C. Gormley, BMC Bioinf., 2010, 11, 571 Search PubMed.
- T. J. Desai, J. E. Toombs, J. D. Minna, R. A. Brekken and D. G. Udugamasooriya, Oncotarget, 2016, 7, 30678–30690 Search PubMed.
- C. Qin, G. Yang, J. Yang, B. Ren, H. Wang, G. Chen, F. Zhao, L. You, W. Wang and Y. Zhao, Mol. Cancer, 2020, 19, 50 CrossRef.
- J. Munkley, I. G. Mills and D. J. Elliott, Nat. Rev. Cancer, 2016, 13, 324–333 CAS.
- J. Munkley, Oncol. Lett., 2019, 17(3), 2569–2575 CAS.
- A. A. B. Badawy, Biosci. Rep., 2022, 42(11), BSR20221682 CrossRef CAS PubMed.
- N. J. Mullen and P. K. Singh, Nat. Rev. Cancer, 2023, 23, 275–294 CrossRef CAS PubMed.
- R. Z. Li, X. R. Wang, J. Wang, C. Xie, X. X. Wang, H. D. Pan, W. Y. Meng, T. L. Liang, J. X. Li, P. Y. Yan, Q. B. Wu, L. Liu, X. J. Yao and E. L. H. Leung, Front. Oncol., 2022, 12, 941643 CAS.
- N. Koundouros and G. Poulogiannis, Cancer Metab., 2019, 122, 4–22 Search PubMed.
- A. Singh, V. Prakash, N. Gupta, A. Kumar, R. Kant and D. Kumar, ACS Omega, 2022, 7(6), 5510–5520 CrossRef CAS.
- J. A. Combs and G. M. DeNicola, Cancers, 2019, 11(5), 678 CrossRef CAS.
- C. L. Chen, S. C. Hsu, D. K. Ann, Y. Ken and H. J. Kung, Cancers, 2021, 13(14), 3541 CrossRef CAS PubMed.
- K. A. Rashid, K. Ibrahim, J. H. D. Wong and N. M. Ramli, Metabolites, 2022, 12(12), 1280 CrossRef PubMed.
- M. T. Ferreira, R. N. Gomes, A. T. Panagopoulos, F. G. d. Almeida, J. C. E. Veiga and A. Colquhoun, Prostaglandins Other Lipid Mediators, 2018, 134, 66–76 CrossRef CAS PubMed.
- R. C. Bruntz, H. E. Taylor, C. W. Lindsley and H. A. Brown, J. Biol. Chem., 2014, 289(2), 600–616 CrossRef CAS.
- G. V. E. Deckert, Pharmacol. Ther., 2023, 244, 108381 CrossRef.
- K. A. Rashid, K. Ibrahim, J. H. D. Wong and N. M. Ramli, Metabolites, 2022, 12(12), 128 Search PubMed.
- S. Chen, J. Jiang, A. Shen, Y. Miao, Y. Cao, Y. Zhang, P. Cong and P. Gao, Metabolites, 2022, 12(10), 918 CrossRef CAS PubMed.
- R. J. DeBerardinis, A. Mancuso, E. Daikhin, I. Nissim, M. Yudkoff, S. Wehrli and C. B. Thimpson, Proc. Natl. Acad. Sci. U. S. A., 2007, 104(49), 19345–19350 CAS.
- E. L. Ulrich, H. Akutsu, J. F. Doreleijers, Y. Harano, Y. E. Ioannidis, J. Lin, M. Linvy, S. Mading, D. Maziuk, Z. Miller, E. Nakatani, C. F. Schulte, D. E. Tolmie, R. K. Wenger, H. Yao and J. L. Markley, Nucleic Acids Res., 2007, 36, D402–D408 Search PubMed.
- S. Fu, S. Xu and S. Zhang, Biochim. Biophys. Acta, Rev. Cancer, 2023, 31(1), 92–104.e5 Search PubMed.
- J. Munkley, I. G. Mills and D. J. Elliott, Nat. Rev. Urol., 2016, 13, 324–333 CAS.
- P. G. Roopashree, S. S. Shetty and N. S. Kumari, J. Funct. Foods, 2021, 87, 104724 CAS.
- S. Yadav, R. Virk, C. H. Chung, M. B. Eduardo, D. V. Derway, D. Chen, K. Burdett, H. Gao, Z. Zeng, M. Ranjan, G. Cottone, X. Xuei, S. Chandrasekaran, V. Backman, R. Chatterton, S. A. Khan and S. E. Clare, Nature, 2022, 8, 59 CAS.
- T. Lemoto, S. Nishiumi, T. Kobayashi, S. Fujigaki, T. Hamaguchi, K. Kato, H. Shoji, Y. Matsumura, K. Honda and M. Yoshida, Oncol. Lett., 2018, 17(1), 831–842 Search PubMed.
- X. Liu, B. Ren, J. Ren, M. Gu, L. You and Y. Zhao, Cell Commun. Signaling, 2024, 22, 380 Search PubMed.
- T. Rezen, D. Rozman, T. Kovacs, P. Kovacs, A. Sipos, P. Bai and E. Miko, Cell. Mol. Life Sci., 2022, 79, 243 CAS.
- J. Bi, S. Chowdhry, S. Wu, W. Zhang, K. Masui and P. S. Mischel, Nat. Rev. Cancer, 2020, 20, 57–70 CAS.
- D. Zhou, Z. Duan, Z. Li, F. Ge, R. Wei and L. Kong, Front. Pharmacol., 2022, 13, 1091779 CAS.
- Z. Wei, X. Liu, C. Cheng, W. Yu and P. Yi, Front. Cell Dev. Biol., 2021, 8, 603837 Search PubMed.
- A. M. Karim, J. E. Kwon, T. Ali, J. Jang, I. Ullah, Y. G. Lee, D. W. Park, J. Park, J. W. Jeang and S. C. Kang, Biochem. Pharmacol., 2023, 212, 115545 CAS.
Footnote |
| † Electronic supplementary information (ESI) available. See DOI: https://doi.org/10.1039/d4nr03454f |
| This journal is © The Royal Society of Chemistry 2025 |

