DOI:
10.1039/B406205A
(Paper)
Lab Chip, 2005,
5, 23-29
A microfluidic electroporation device for cell lysis
Received
26th April 2004
, Accepted 30th July 2004
First published on 5th November 2004
Abstract
We demonstrate a micro-electroporation device for cell lysis prior to subcellular analysis. Simple circuit models show that electrical lysis method is advantageous because it is selective towards plasma membrane while leaving organelle membrane undamaged. In addition, miniaturization of this concept leads to negligible heat generation and bubble formation. The designed microdevices were fabricated using a combination of photolithography, metal-film deposition, and electroplating. We demonstrate the electro-lysis of human carcinoma cells in these devices to release the subcellular materials.
1. Introduction
Analysis of proteins or organelles in biochemical and biomedical studies typically requires cell lysis (i.e., breaking open the cell membrane) in order to obtain subcellular materials. For many experiments, a total lysate is sufficient for the analysis (for example, intracellular proteins and RNA's); in other instances, subcellular fractionation is necessary and complete homogenization of cellular components is then undesirable. For example, cytochrome c translocates from mitochondria to the cytosol in some apoptotic processes.1–3 A device that could rapidly separate the mitochondrial fraction from the cytosolic fraction would facilitate studies of the mitochondrial signal transduction pathways. Requirements for a device to perform cell lysis include speed (to prevent further biochemical changes), selectivity (breaking down cell membranes while protecting organellar membranes), and integration with other microfluidic devices. Examples of such integration could be upstream cell handling and manipulation (such as growth, stimulus, and cell sorting), downstream organelle purification and lysis, and protein separation and identification.
Conventionally cells can be lysed by either chemical or mechanical means.4 Because the cell membrane consists of a lipid double-layer, lysis buffers containing surfactants can solubilize the lipid membranes. The aim of such lysis is to release all intracellular and membrane proteins for gel-based separation processes (e.g. Western blots, and SDS-PAGE),5 which allow identification of specific proteins. Consequently in many of these processes, the organelle membranes are also dissolved. Therefore, chemical methods are generally not suitable for cell lysis when organelle integrity is critical. Additionally, removal of surfactant remaining in the sample after lysis could require additional separation steps. A second common method of cell lysis relies on mechanical breakdown of the cell membrane by shear and wear. For example, the Dounce Homogenizer uses a mortar–pestle setup where cell suspension is sheared between the two parts of the device. In a recent study, a miniaturized mechanical lysis system demonstrates complete homogenization of cells in order to release subcellular proteins.6 While the efficiency of lysis is high, mechanical lysis does not provide the discrimination needed for organelle analysis. Other types of mechanical breakage such as ultrasonic homogenization also yield homogenized lysate in which organelles are broken. Lastly, thermal energy can also be used to lyse cells such as bacteria, yeasts, and spores. Heating disrupts the cell membrane and the intracellular materials are released. However, this method is only compatible with nucleic acids analysis because protein molecules denature in the course of heating. In order to enable subcellular fractionation in microfluidic systems without the complications of chemical and mechanical lysis, we have chosen to implement electroporation. This method has the potential for achieving rapid and selective cell lysis and is compatible with other downstream processes such as organelle separation by free flow electrophoretic techniques.7
Electroporation is a common method for creating transient holes in cell membranes to deliver genetic material or small-molecule therapeutics.8,9 External electric field induces changes in plasma membrane and disrupts the transmembrane potential. The microfluidic electroporation devices in this work uses extreme conditions where the stability of the cell membranes is permanently disrupted, holes on the cell membranes sustained, and intracellular materials released. The externally applied field is chosen to exploit differences in transcellular-membrane potential (∼60 mV) and transorganelle-membrane potential (∼160 mV for mitochondria for example) so that the cell membrane is compromised with minimal impact on organelles, such as the mitochondria.
Prior work in micro-scale electroporation includes devices for the release of DNA and proteins,10,11 for gene delivery,12–14 and for monitoring cell viability.15 Many of these devices use pulsed electric fields and operate in non-continuous mode. We present a continuous device that provides a periodic spatial change in electric field strength, which through the fluid motion translates to a pulsating field experienced by the cells. Advantages of this approach include continuous operation and tunable operating conditions for speed and selectivity of the lysis, as well as the potential for integration with upstream and downstream microfluidic components.
2. Experimental
2.1. Modeling cell lysis and designing devices
Cells consist of a lipid double-layer membrane with intracellular organelles and cytosolic material. To a first approximation, cells interacting with an external electric field can be modeled using an equivalent RC circuit.8,9,16
Completing a circuit analysis gives the following equations for the transmembrane potential for the cells (eqn. (1)) and for organelles (eqn. (2)),9,16 where E is the external field strength, R the radii of particles, C the capacitance of the memebranes per unit area, r resistivity, and ω the frequency of the applied electric field. The subscript int denotes intracellular, org denotes organelle, a for the extracellular electrolyte, i for intracellular electrolyte (cytoplasm), and s for intra-organelle electrolyte. The parameters for the model are extracted from the literature.8,16–20
| |  | (1) |
| |  | (2) |
| |  | (3) |
2.2. Microfabrication of electroporation devices
The farication process is shown schematically in Fig. 1. First, Pyrex 7740 wafers (Bullen Ultrasonic Inc., Eaton, OH) were cleaned in a bubbling piranha solution (1 : 3 hydrogen peroxide in sulfuric acid) for 10 min. Caution: the mixing process is strongly exothermic and releases hot vapor, and the mixture is highly reactive. Personal protective wares including face shield, apron, and gloves should be used. The cleaned wafers were rinsed in deionized water and dried in a wafer spin dryer. Once treated with hexamethyldisilazane (HMDS) vapor, the wafers were coated with image reversal resist AZ5214E (Clariant Corp.). Standard photolithography techniques (brief exposure through a mask followed by post-exposure bake and a flood exposure) was used to pattern the resist layer. A thin film of gold (200 nm) with titanium (10 nm) as adhesion layer was deposited in an electron-beam evaporator. The metal seed-layer pattern was formed in a lift-off process whereby metal film on the photoresist was removed along with the resist in solvent.
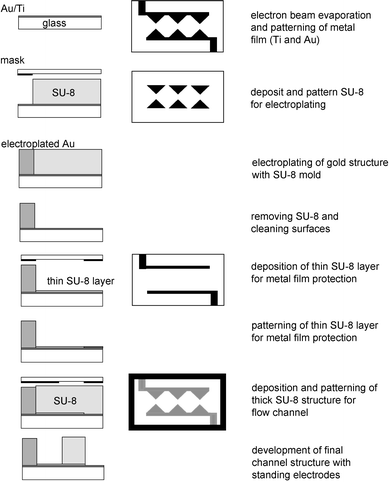 |
| | Fig. 1 Fabrication process for 3-D electrodes in microfluidic channels for cell lysis by electroporation. | |
Subsequently, a layer of a photo-patternable epoxy SU-8-50 (MicroChem Corp.) was spun and patterned using photolithography to create the trenches in which the gold electrodes were to be formed. The current supplied to the substrates was used to control the gold deposition rate; generally, to plate 50 µm-thick electrode required 4–5 hr at 60 °C using a non-cyanide-based plating solution (Technic Inc.). At the completion of electroplating, the SU-8 mold was removed in a Nanostrip solution. The wafers were rinsed and dried before a further cleaning step in oxygen plasma for at least 30 min. Another layer of SU-8-50 was coated and patterned to form the flow channels of the devices. Before being diced into individual devices using a Disco dice saw, the wafers were coated with a layer of thick resist AZ4620 (Clariant Corporation) to protect the features. Fluidic access holes on the glass substrate were drilled using a 0.75-mm diamond drill bit. Solvents (acetone, ethanol, followed by isopropanol) were used to remove the thick photoresist. The device was capped by a piece of microscope cover-slip, glued by epoxy on the edges. Conductive epoxy (SPI Supplies) was used to bond wires to the thin-film gold contact pads on the glass substrate.
2.3. Cell culture and microscopy
HT-29 cells (human colon carcinoma, ATCC) were cultured in McCoy's 5A medium supplemented with 10% fetal serum, 100 units ml−1 penicillin, 100 μg ml−1 streptomycin and 2 mM glutamine (Life Technologies) at 37 °C and 5% CO2. The medium was changed every 2–3 days with cell-split ratio of 1 : 5 or 1 : 8. The cells were harvested with 0.25% trypsin (Life Technologies). The final cell suspension was 105–106 cells ml−1 in concentration in the experiments. The fluorescence microscopy was performed with a Zeiss Axiovert-200 fluorescence microscope and images taken with an ORCA-100 cooled digital camera (Hamamatsu). A vital dye (final concentration of 5 μg ml−1 acridine orange and 5 μg ml−1 propidium iodide in water, Molecular Probes, Inc.) was added to harvested cells at room temperature and was readily taken up by the cells in 5 min (verified by fluorescence microscopy).
The devices were first sterilized with 2 ml of ethanol solution (70%), and then rinsed with 2 ml of DI water followed by 1 ml of PBS buffer. Lastly, 1 ml of filtered bovine serum albumin in water (2 wt.%) was flown through the device and incubated at room temperature for at least 20 min prior to the experiment to reduce adsorption of biological materials to the device.
Immediately after harvesting and staining the cells, 1 ml BD syringes were used to dispense the cells into two identical devices at a rate of 0.25–1 μl min−1 by a syringe pump (PHD2000, Harvard Apparatus). Voltage was controlled by a BK Precision 10 MHz Sweep Function Generator (Model 4017). The experiments were performed under a variety of frequency and voltage conditions along with control experiments where cells were passed through the micro device with no voltage supply.
3. Results and discussion
3.1. Modeling
The most obvious choice for selective electroporation is to use a direct current (DC) electric field since the cell membrane would experience the largest applied transmembrane potential and the subcellular organelles none. However, the large electric field required to achieve lysis would result in a voltage exceeding the water electrolysis threshold (∼1 V), even in micro-scale devices. Thus, a DC field would inevitably create bubbles (hydrogen and oxygen gases), as well as extreme pH conditions near the electrodes.
To avoid such adverse conditions in microfluidic electroporation devices, an alternating current (AC) electric field is employed. Water electrolysis is minimized under a rapidly alternating field. Using representative values of material electrical properties, the modeling results shown in Fig. 2 demonstrate general trends of the transmembrane potentials. At very large frequencies, the potentials for both cells and subcellular particles drop off to a negligible magnitude, making the cells and organelles effectively transparent to the electric field. At intermediate frequency ranges, the trans-cell-membrane potential increases whereas the trans-organelle-membrane potential drops as the frequency increases. Thus, there is an optimal range of operating frequency and voltage such that the trans-membrane potential is sufficient to break the cell membrane but not able to affect organelle membranes. The simple circuit model employed here is useful to guide the selection of experimental conditions, but it is not sufficient to predict the actual lysis performance.
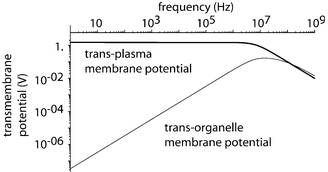 |
| | Fig. 2 Modeling results for external applied trans-membrane potentials for cells and sub-cellular organelles. | |
3.2. Designing an electroporation microdevice
Electroporation in microfluidic channels has several advantages. The voltages required to achieve cell lysis are much lower compared to macroscopic systems. By shrinking the inter-electrode distance to a few tens of microns, it is possible to reduce the voltage requirement to a few volts (three orders of magnitude smaller than typical voltages required in a macroscopic apparatus). Consequently, the power consumption becomes six orders of magnitude smaller and heat generation is minimal.
3.2.1. Design considerations.
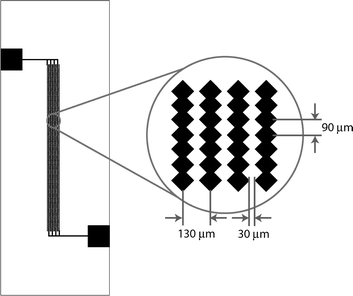
Conventional electroporation devices use batch processes in which electrical pulses are provided to cell suspensions in the electroporation chamber17,20–22 The batch format is difficult to integrate with other microfluidic devices and long residence time increases the possibilty of biological entities adhering to chamber surfaces. Therefore, we have chosen to design a continuous flow device in which periodic variation in electric field strength is due to the undulating geometry of the electrodes (Fig. 3). Moreover, the duration of electrical stimulation is controlled by the flow rate of the fluid carrying the suspended cells. The choice of inter-electrode distance was governed by practical considerations. The average size of mammalian cells (e.g. HT-29, a human colon carcinoma cell line used in this work) is on the order of 10 µm in suspension. To avoid cells obstructing the flow path, the inter-electrode distance was set to be at least three cell diameters. The overal channel is 1100 µm wide and contains four sets of microelectrode arrays (180 saw-teeth each).
3.2.2. Electric field strength calculation and heat effects.
A field calculation solving Maxwell's equations in FEMLAB (Comsol, Inc.) using the peak-to-peak voltage (Fig. 4) reveals, as expected, that the electric field is non-uniform and highest near the tip of the electrodes. Moreover, the magnitude of electric field is in the range of kV cm−1 while the AC voltage required is smaller than 10 V.
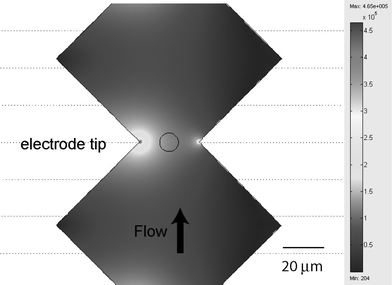 |
| | Fig. 4 Peak to peak voltage (in V m−1) calculation in the micro-electroporation device. | |
Heat generation is a concern when performing electroporation in the conventional systems, but the six orders of magnitude reduction in power levels and large surface area to volume ratios associated with microfluidic devices eliminate the effect. For example, an analysis of Joule heating for the device leads to a maximum temperature rise of less than 1 K (Fig. 5). In this simulation, the Fourier equation of heat conduction is solved with the following boundary and volume condition: all four edges of the device are in contact with room temperature (300 K) air, and the fluid conduit has a uniform volumetric heat generation rate of 0.1 W (assuming complete conversion of 10 V and 10 mA electrical energy to heat). The heat transfer in the fluid conduit is simplified to include only heat conduction; in reality, heat transfer also includes the heat carried away by the flowing fluids. Therefore the simulation is a conservative estimate of the temperature in the device.
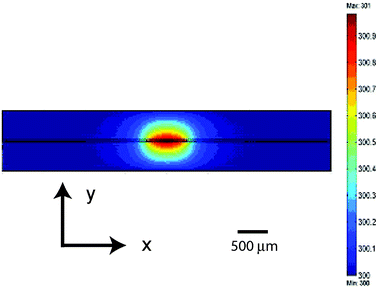 |
| | Fig. 5 FEMLAB simulations of heat generation and transfer in the micro-electroporation device for an applied voltage of 10 V and a current of 10 mA. A cross section of the device is shown where the flow direction is out of the page. | |
3.2.4. Design layout and fabrication.
Fig. 6 shows a schematic of the designed device. The electrodes were electrodeposited from the bottom metal seed layer to channel thickness (∼50 µm). The advantages of having vertical electrodes instead of planar electrodes include uniform electric field distribution and thicker electrodes that last longer in corroding environment.23 Photographs of the patterned metal layer with SU-8 mold for electroplating and the plated electrodes are shown in Fig. 7.
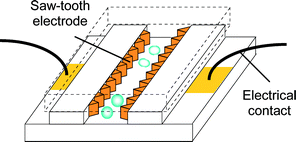 |
| | Fig. 6 Schematics of a micro electroporation device for cell lysis. Only one set of electrodes is shown for simplicity. | |
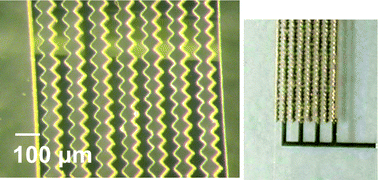 |
| | Fig. 7 Pictures of devices in fabrication processes: (left) after metallization and electrode-mold formation; (right) after electroplating. | |
To demonstrate cell lysis in the micro-electroporation devices, we chose two lysis conditions, both within the intermediate frequency range (1 kHz–100 kHz). Suspensions of cultured HT-29 cells were characterized using microscopy techniques (both with phase contrast and with fluorescence staining). The cells from the electroporation experimental population appeared qualitatively different in physical characteristics from the control population that only experienced shear stresses by flowing through the devices. In transmission microscopy immediately after electroporation, treated cells had different morphology: they were more wrinkled, less rounded, and with much less defined membranes (Fig. 8). Cell fragments were also observed. Many of the ghost cells generally appeared smaller than normal healthy cells, indicating that subcellular materials had been released to the extracellular medium.
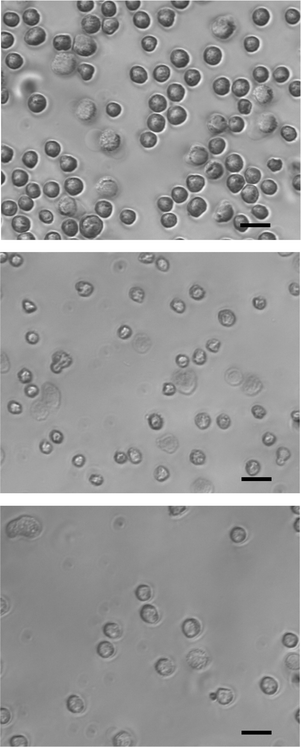 |
| | Fig. 8 Phase-contrast microscopy of cells that were treated by electroporating conditions in comparison to the control population: (top) control population; (middle) cells treated at 5 kHz and 6 V; (bottom) cells treated at 10 kHz and 8.5 V. Scale bars are 15 µm. | |
A vital stain with acridine orange and propidium iodide was used further to examine the effect of the electroporation on cell populations. Acridine orange (visible in green fluorescence channel) readily stains any cell. In contrast, healthy cells with intact membranes exclude propidium iodide (visible in the red-orange fluorescence channel) from entering intracellular spaces, while cells with compromised membrane cannot discriminate against this stain. In the acridine orange stain (Fig. 9), the control population is much brighter than both experimental groups, suggesting that electroporation induces leakage through membranes and release of subcellular materials (therefore lower concentrations of acridine orange intracellularly after electroporation). In the propidium iodide stain (Fig. 10), the control population has a small fractions of cells that appear permeable to propidium iodide, due to a combination of normal and mechanically induced cell death. Electroporated cells are generally brighter, indicating that cell membranes are compromised and intracellular concentrations of propidium iodide are higher.
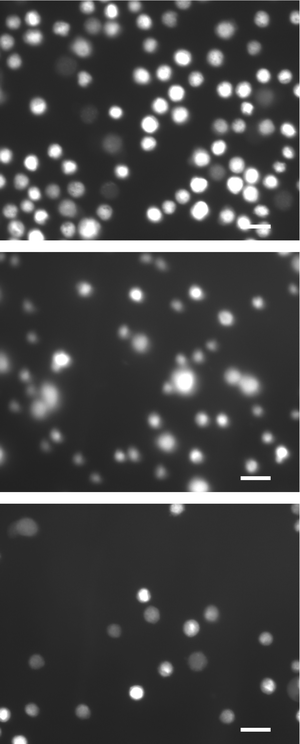 |
| | Fig. 9 Fluorescence microscopy results (green channel: excitation maximum = 485 nm, emission maximum = 530 nm) of electroporated cells and control cells: (top) control population; (middle) cells treated at 5 kHz and 6 V; (bottom) cells treated at 10 kHz and 8.5 V. Scale bars are 15 µm. | |
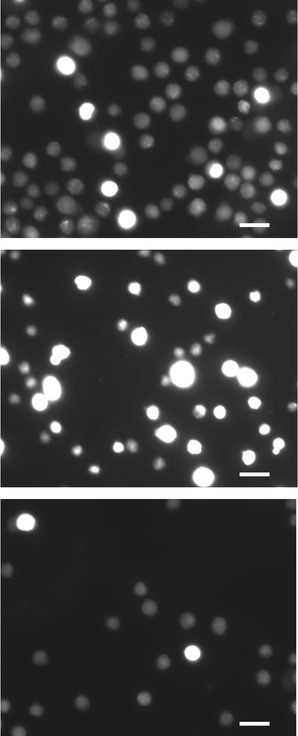 |
| | Fig. 10 Fluorescence microscopy results (red channel: excitation maximum = 535 nm, emission maximum = 590 nm) of electroporated cells and control cells: (top) control population; (middle) cells treated at 5 kHz and 6 V; (bottom) cells treated with 10 kHz and 8.5 V. Scale bars are 15 µm. | |
The modeling results earlier suggests that larger transmembrane potentials are achieved at lower frequency or higher applied peak-to-peak voltage. In general, cells that are treated with lower frequency have more permeable membranes, while cells treated with higher applied voltage are more likely to have undergone complete lysis. Cell lysis efficiency was quantified with samples collected at the end of the experiments. Table 1 lists the percentages of lysed cells and cells with compromised membranes at the end of the experiments for typical electroporation conditions. All samples started with the same cell density. The total cell count in each experiment was compared to that of the control population to calculate percentages of cells completely lysed in the electroporation device. The fraction of ghost cells after electroporation was quantified. These cells lost some organelles and cytosolic material during electroporation, but their cell membranes did not disintegrate completely and instead closed to form a particle. These particles were generally smaller and their membranes had higher contrast to the fluids than normal cells. The fractions of lysed cells and ghost cells were high, and combined numbers indicate that the majority of cells did not survive the electroporation process. The lower frequency treatment had a high percentage of ghost cells and lower lysed fraction, suggesting that this condition was gentler and perhaps more suitable for selective lysis of plasma membrane. Generally, optimal lysis of different cell types can be achieved by fine-tuning the operating frequency, voltage, the flow rate of the cell suspension (hence the residence time and the effective electrical pulse width), and the buffer conditions, particularly when intact or metabolically active organelles are desired.
Table 1 Comparison between cells treated under different electroporation conditions
| |
Cells treated at 5 kHz, 6 V |
Cells treated at 10 kHz, ∼8.5 V |
| Fraction lysed calculated from total cell count |
28% |
74% |
| |
| Fraction of ghost cells |
81% |
71% |
Higher magnification of microscopy revealed a variety of cell membrane behavior, including swelling (Fig. 11a), lysis (Fig. 11b), morphological changes (membrane extrusion in particular, Fig. 11c), and rare electrofusion of two cells (Fig. 11d). These phenomena have been observed and modeled in macro scale electroporation procedures.8,19,20 One could imagine using the same micro-devices for electrofusion and molecular delivery. The electroporation conditions (e.g. field strength, duration of high voltage application, and the ionic strength and osmolarity of the buffer solution) could be altered to meet specific requirement for effective poration or lysis.
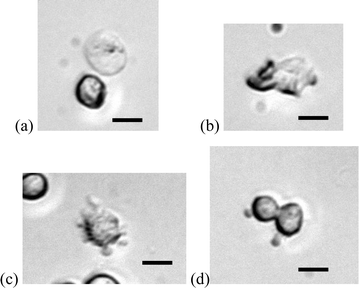 |
| | Fig. 11 Membrane behaviour in electric field–cell interactions observed in the micro electroporation devices. Scale bars are 10 µm. | |
Dielectrophoresis (DEP) was observed as a consequence of the saw-tooth shapes of the micro electrodes and the resulting non-uniform electric field. Cell samples were focused in the flow stream at the positions corresponding to extrema of the electric field (Fig. 12). The particles in the images appear elongated because the camera is not sufficiently fast to resolve the shape of particles at the experimental flow velocity. A potential application of this DEP effect could be an immediate downstream identification of cytosolic proteins. The advantage is that the DEP effect keeps the samples from being diluted by the carrying fluid.24,25 For low-abundance subcellular protein, this sample handling technique could prove important in detecting the released proteins.
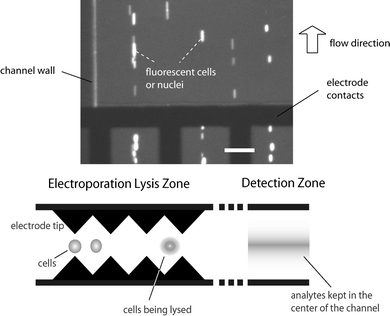 |
| | Fig. 12 (top) Dielectrophoresis effect observed in the flow channels. The image has been contrast-enhanced. (bottom) Schematics of the saw-tooth microelectrodes acting as a DEP device for focusing intracellular materials after electroporation. The scale bar in the top graph is 80 µm. | |
4. Conclusion
We have designed a micro electroporation device aided by a quantitative understanding of the interactions between cells and an external electric field. The micro device is effective in lysing cells while operating at more advantageous conditions than conventionmal systems: small voltages and power consumptions, continuous flow, small sample volume, and negligible heating. This device has the potential for integration with other microfluidic components as part of a lab-on-chip system for subcellular analysis, which would greatly facilitate large scale biochemical experimentation.
References
- E. Finkel, Science, 2001, 292(5517), 624–626 CrossRef CAS.
- C. Brenner and G. Kroemer, Science, 2000, 289(5482), 1150–1151 CrossRef CAS.
- H. Li, S. K. Kolluri, J. Gu, M. I. Dawson, X. H. Cao, P. D. Hobbs, B. Z. Lin, G. Q. Chen, L. S. Lu, F. Lin, Z. H. Xie, J. A. Fontana, J. C. Reed and X. K. Zhang, Science, 2000, 289(5482), 1159–1164 CrossRef CAS.
-
J. M. Graham and D. Rickwood, Subcellular Fractionation: a Practical Approach, ed. D. Rickwood and B. D. Hames, Oxford University Press, New York, 1997, vol. 173 Search PubMed.
-
T. E. Creighton, Protein Function: a Practical Approach, Oxford University Press, New York, 1997, vol. 175 Search PubMed.
- D. Di Carlo, K. H. Jeong and L. P. Lee, Lab Chip, 2003, 3(4), 287–291 RSC.
- H. Lu, S. Gaudet, M. A. Schmidt and K. F. Jensen, Anal. Chem., 2004, 76, 5705–5712 CrossRef CAS.
-
E. Neumann, A. E. Sowers and C. A. Jordan, Electroporation and Electrofusion in Cell Biology, Plenum Press, New York, 1989 Search PubMed.
- J. C. Weaver, IEEE Trans. Plasma Sci., 2000, 28(1), 24–33 CrossRef CAS.
- Y. Huang, K. L. Ewalt, M. Tirado, T. R. Haigis, A. Forster, D. Ackley, M. J. Heller, J. P. O'Connell and M. Krihak, Anal. Chem., 2001, 73(7), 1549–1559 CrossRef CAS.
- Y. Huang and B. Rubinsky, Sens. Actuators, A, 2001, 89(3), 242–249 CrossRef.
- Y. C. Lin, C. M. Jen, M. Y. Huang, C. Y. Wu and X. Z. Lin, Sens. Actuators, B, 2001, 79(2–3), 137–143 CrossRef.
- Y. C. Lin and M. Y. Huang, J. Micromech. Microeng., 2001, 11(5), 542–547 CrossRef CAS.
- Y. Huang and B. Rubinsky, Sens. Actuators, A, 2003, 104(3), 205–212 CrossRef.
- Y. Huang, N. S. Sekhon, J. Borninski, N. Chen and B. Rubinsky, Sens. Actuators, A, 2003, 105(1), 31–39.
- C. Grosse and H. P. Schwan, Biophys. J., 1992, 63(6), 1632–1642 CrossRef CAS.
- R. P. Joshi and K. H. Schoenbach, Phys. Rev. E, 2000, 62(1), 1025–1033 CrossRef CAS.
- S. Archer, T. T. Li, A. T. Evans, S. T. Britland and H. Morgan, Biochem. Biophys. Res. Commun., 1999, 257(3), 687–698 CrossRef CAS.
-
D. C. Chang, B. M. Chassy, J. A. Saunders and A. E. Sowers, Guide to Electroporation and Electrofusion, Academic Press, Inc., San Diego, CA, 1992 Search PubMed.
-
P. T. Lynch and M. R. Davey, Electrical Manipulation of Cells, Chapman & Hall, New York, 1996 Search PubMed.
- T. R. Gowrishankar and J. C. Weaver, Proc. Natl. Acad. Sci. USA, 2003, 100(6), 3203–3208 CrossRef CAS.
- R. P. Joshi and K. H. Schoenbach, Phys. Rev. E, 2002, 66(5), 52901 CrossRef CAS.
- R. P. Frankenthal and D. J. Siconolfi, J. Electrochem. Soc., 1982, 129(6), 1192–1196 CAS.
- S. Fiedler, S. G. Shirley, T. Schnelle and G. Fuhr, Anal. Chem., 1998, 70(9), 1909–1915 CrossRef CAS.
- H. Morgan, D. Holmes and N. G. Green, IEEE Proc. – Nanobiotechnol., 2003, 150(2), 76–81 Search PubMed.
|
| This journal is © The Royal Society of Chemistry 2005 |
Click here to see how this site uses Cookies. View our privacy policy here. 


