A single cell electroporation chip
Michelle
Khine†
,
Adrian
Lau†
,
Cristian
Ionescu-Zanetti
,
Jeonggi
Seo
and
Luke P.
Lee
*
Berkeley Sensor & Actuator Center, Department of Bioengineering, University of California, Berkeley, CA 94720, USA. E-mail: lplee@socrates.berkeley.edu
First published on 22nd September 2004
Abstract
Increasing the cell membrane's permeability can be accomplished via single cell electroporation. Polar substances that cannot otherwise permeate the plasma membrane (such as dyes, drugs, DNA, proteins, peptides, and amino acids) can thus be introduced into the cell. We developed a polymeric chip that can selectively immobilize and locally electroporate single cells. This easy-to-use chip focuses the electric field, eliminating the need to manipulate electrodes or glass pipettes. Moreover, this device allows parallel single cell electroporation. We demonstrate the effectiveness of our device design by electroporating HeLa cells using low applied voltages (< 1 V). We found the average transmembrane potential required for electroporation of HeLa cells to be 0.51 ± 0.13 V. Membrane permeation is assessed electrically by measuring characteristic ‘jumps’ in current that correspond to drops in cell resistance, and microscopically by recording either the escape of cytoplasmic dye Calcein AM or the entrance of Trypan blue stain.
Introduction
Few high-resolution methods exist to control and manipulate the biochemical nature of a single cell's interior.1,2 Yet roughly 90% of the cell's biologically active structures, such as intracellular proteins, are located within the confines of the cell membrane. Although only about 6 nanometers thick, the cell membrane serves as an effective barrier between the cytoplasm and the outside world and, as such, is relatively impermeable to most ionic and polar substances.One way to traverse the cell membrane and access the cell's interior is by temporarily increasing the cell membrane's permeability. This can be accomplished via electroporation, a technique which uses high electric fields to induce structural rearrangements of the cell membrane. Pores are formed when the transmembrane potential exceeds the dielectric breakdown voltage of the membrane (0.2–1.5 V).3,4 Polar substances otherwise impermeant to the plasma membrane (such as dyes, drugs, DNA, proteins, peptides, and amino acids) could thus be introduced into the cell.
In the early 1980s, Eberhard Neumann et al. demonstrated the feasibility of electroporation for delivering DNA to a population of mammalian cells.5 Since then, this method of bulk electroporation has become a standard technique routinely used to simultaneously transfect millions of cells in culture. However, bulk electroporation requires very high voltages (> 103 V) and has little control over the permeabilization of individual cells, resulting in suboptimal parameters. Reversible electroporation, in which the pores can reseal, is therefore difficult.6
Single cell electroporation obviates many of these challenges but is less common. Lundqvist et al. first demonstrated single cell electroporation using carbon fiber microelectrodes in 1998.1 To induce electroporation, they placed the microelectrodes 2–5 microns away from adherent progenitor cells. Other single cell electroporation techniques developed since include: electrolyte-filled capillaries,7 micropipettes,8 and microfabricated chips.9 For successful single cell electroporation, the cell must either be isolated or the electric field well focused to target a particular cell.10
Microfabricated devices can be ideally suited to both isolate single cells and focus the electric field. In 2001, Huang et al. introduced the first microfabricated single cell electroporation chip.9 Microfabrication technology also enables the incorporation of other functionalities onto the device. A comprehensive screening device that cannot only permeate single cells — but introduce materials into the cell and monitor its response — can therefore be developed by leveraging the tools and design freedom of microfabrication.
Our electroporation set-up differs from these other devices in several ways. We developed a polydimethylsiloxane (PDMS) chip that can selectively immobilize and locally electroporate single cells. This easy-to-use disposable chip focuses the electric field, eliminating the need to manipulate electrodes or glass pipettes. The electrodes can be placed at a distance from the cell, eliminating the need to incorporate electrodes on chip and the potential of adverse products from electrode reactions. Moreover, this device allows parallel single cell electroporation. Using this device, we also demonstrated reversible electroporation, in which the pores reseal. Previous studies have demonstrated that resealing of pores can occur at time scales from seconds to hours.11–14
The transparent PDMS, unlike opaque silicon, enables fluorescent detection and monitoring. We also use Ag/AgCl electrodes and a patch clamp amplifier, allowing accurate current traces not commonly reported. In traditional electroporation set-ups (large parallel electrode setups), the bulk of the current is carried by the extracellular electrolyte solution, making it impossible to record the current through a single cell.2 Existing studies on single cells either do not record current through the high voltage electrodes1,11or do not focus on detailed measurements of current changes during poration.9 In contrast, we concentrate on the analysis of changes in cell resistance due to electroporation by looking at current jumps due to membrane poration.
Materials and methods
1. Principle of operation
We demonstrate the effectiveness of our device design by electroporating HeLa cells using low applied voltages (< 1 V). Most notably, we achieve localized electroporation because we sequester individual cells in PDMS channels before electroporation (Fig. 1a). Therefore the electric field is focused such that the greatest potential drop occurs across the first membrane of the cell (Fig. 1b), as quantified through a 2D Femlab simulation (Fig. 2). In this way, localized electroporation can be achieved at relatively low applied voltages. Because resistance is inversely proportional to surface area, the small portion of the cell inside the immobilizing channel has a much higher resistance (∼80×) than the portion outside the channel. The greatest potential drop therefore occurs across the portion of the cell membrane inside the channel. Low applied voltages are sufficient to achieve electroporation with a high electric field across that first membrane (∼750 kV cm−1). This is within the range (300–1000 kV cm−1) that Tsong reported for the dielectric strength of a bilipid membrane.2 The design makes use of a trapping channel whose height (3.1 µm) is approximately a third of the cell's diameter. A cell is hydrodynamically trapped by applying negative pressure (∼−2 psi) to the trapping channel via an attached syringe as a cell passes by. A schematic of the cross section of a trapping channel is shown in Fig. 1b. The cross-sectional dimensions of the trapping channels are 4 µm × 3.1 µm; an image of a HeLa cell being trapped is shown in Fig. 1c.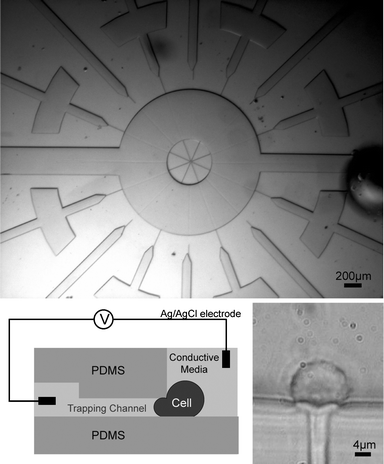 | ||
| Fig. 1 The layout of the chip and cell. (a) The two wide inlet channels on the left and right are used for cell input and output. An electrode is connected to one of these main channels. The other electrode is connected to the small channel where the cell is trapped. (b) A schematic of the cross-section of the chip. When trapped, a cell is pulled laterally into the small trapping channel by applying a negative pressure. The trapped cell acts as a high resistance component in the circuit. (c) An image showing the cell trapped in the channel. The cell extends into the channel leaving a tail-like structure in the channel. Because of its viscoelastic nature, the cell retains its shape after the negative pressure is removed. | ||
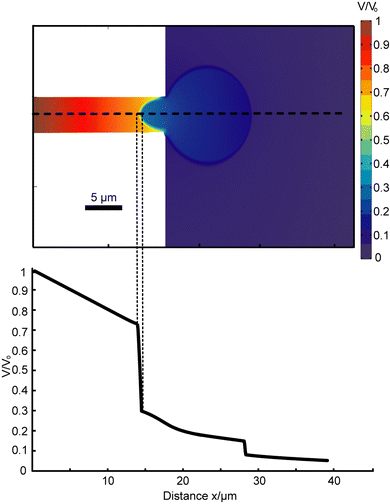 | ||
| Fig. 2 2D Femlab simulation. (a) Simulation result quantifies the greatest potential drop occurring across the first membrane, inside the channel. The area outside the channel can be approximated as electrical ground. By approximation from trapped cell images, the membrane surface area outside of the channel is about 80 times that of the membrane within the channel. Hence, in 3D actuality, the effect of localized electroporation is significantly stronger than is portrayed by this 2D simplified model. (b) Potential drop along midline (dotted line in a). | ||
The circuit model of this set-up (of cell plus device) is illustrated in Fig. 3. The cell itself can be modeled as a parallel combination of a variable resistor and a capacitor (whose effect is transient). In parallel to the cell is the leak resistance, Rleak. The potential drop across the cell is significantly greater than any other potential drop. Therefore, other cells in close proximity to the trapped cell would not be electroporated by the electric field. Moreover, since the phospholipid membrane of the cell has much higher resistance than both the cytosol and the extracellular medium, only the potential drop across the membrane is significant. The resistance of the cell can thus be further broken down in series into the resistance of the membrane inside the channel (Rmem-channel) and the resistance of the membrane outside the channel (Rmem-outside). By approximation from trapped cell images, the membrane surface area outside of the channel is about 80 times that of the membrane within the channel. This implies that Rmem-channel is about 80 times larger than Rmem-outside. Hence the resistance of the cell can be approximated as solely the resistance of the membrane within the channel. This resistance distribution gives rise to localized electroporation of the cell membrane within the channel.
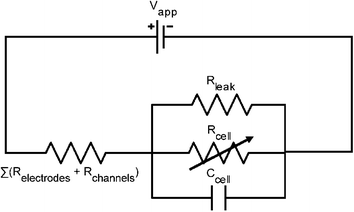 | ||
| Fig. 3 Circuit model of the cell and chip. The cell itself is modeled as a parallel combination of a resistive Rcell and a capacitive Ccell element (whose effect is transient). The Rleak is the resistance of the pathway where the current by-passes the cell, thus it is in parallel to Rcell. Rleak is determined from the initial current at low voltages, when Rcell is so high that all the current can be assumed to go through Rleak. It is assumed that Rleak remains constant before and after electroporation. After electroporation the only element that changes in the model is the Rcell, which drops because of the formation of electropores. | ||
In addition to recording electrical measurements, we conduct two different fluorescent assay experiments and record either the escape of Calcein AM or the entrance of Trypan blue. Calcein AM is membrane permeant; in live cells, the non-fluorescent Calcein AM is converted to green-fluorescent Calcein by intracellular esterases. The resulting fluorescent Calcein is highly charged and therefore cannot be excised from the cytoplasm once it has infiltrated the cell unless non-selective pores are introduced. The high sensitivity Calcein AM fluorescence is useful in quantifying the diffusion of dye out of the cell once the cell is electro-permeated. Conversely, the color of the membrane impermeant dye Trypan blue is normally undetectable at low concentrations; once the membrane is permeabilized the dye can accumulate within the cell, a dark blue color becomes apparent. Therefore, by using the Trypan blue assay, the electro-permeated area can be readily visualized.
2. Methods
Two different assay experiments are carried out using two sets of dyes: Calcein AM (Molecular Probes) and Trypan blue (Sigma Aldrich). In the Calcein AM assays, the dye is loaded into cells according to a modified protocol supplied by the manufacturer. The dye is added to the cell suspension to make up to a concentration of 2 µl/ml of cells, and then incubated in a 37 °C water bath for 15 minutes. For the Trypan blue assays, the cell suspension is mixed with Trypan blue in a 1 ∶ 1 ratio (to obtain 0.2% solution concentration), and then incubated in a 37 °C water bath for 10 minutes.
To start the electroporation experiments, all channels in the chip are filled with filtered PBS solution and extra care is taken to expel any air bubbles in the tubing. The linear resistance of the open channel is first measured via the amplifier. The cell/dye suspension is then introduced into the device after incubation with a syringe; the injection is controlled manually to allow cell trapping by applying negative pressure on the trapping channel. Once a cell is trapped, a ‘current–voltage trace’ program written in Labview is run to input a sequence of pulses with increasing amplitude (at 0.1 V intervals from 0.1 V to 1.0 V) while recording the current at a sampling rate of 10 kHz (Fig. 4a, inset). A second sequence of pulses is also applied 60 s after the first sequence to allow time for resealing. The whole process is video captured at a sampling rate of 30 fps and then down-sampled to 5 fps for intensity analysis.
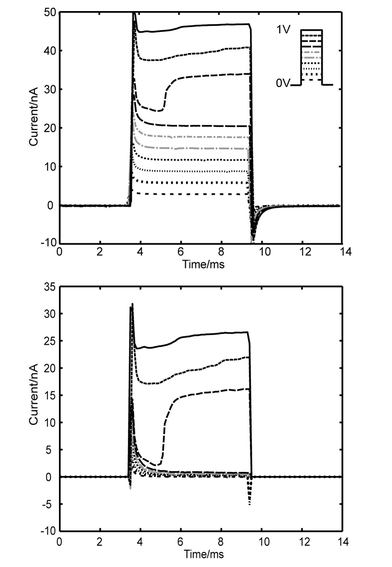 | ||
| Fig. 4 Electrical measurements. (a) Short (∼6.5 ms) square wave voltages from 0.1 V to 1 V (inset) are applied to the circuit and the resulting current is measured (currents taken sequentially and overlayed). Period between pulses is 40 ms. A significant jump in current is evident at 0.8 V in this typical current–time trace. The characteristic ‘jump’ in current is observed in 15 of the 17 cells. (b) The leak current Rleak is linear (initial traces in a) and subtracted from the measured current to isolate the current across the cell, Rcell. | ||
Results and discussion
We set the pulse duration to ∼6.5 ms and record from 17 HeLa cells sequentially. The characteristic ‘jump’ in current is observed in 15 of the 17 cells. The voltage is varied from 0 to 1 V in 0.1 V intervals. A typical resulting current trace from one of the cells is shown in Fig. 4a. Leak current, i.e. the current that goes around the cell because the seal resistance is not infinite, is subtracted (based on the circuit diagram depicted in Fig. 3) to isolate the current across the cell (Fig. 4b). The leak resistance, Rleak, is measured for each cell from initial current traces at low voltages and assumed to be constant (∼35 MΩ). A significant jump in current is evident at 0.8 V. The average applied voltage of electroporation for the 15 cells that show jumps is 0.76 ± 0.095 V. As discussed before in our resistance distribution model, the major potential drop is across the membrane trapped in the channel. Hence, for this cell, the transmembrane voltage across the electroporated membrane is ∼0.6 V, which is within the voltage range (0.2–1.5 V) of dielectric breakdown suggested by most published data.3,4 The average transmembrane potential for the population of cells is 0.51 ± 0.13 V.The data also provide evidence for the occurrence of cell resealing. We see resealing within 60 s (time between runs); this is within the range reported for phospholipid bilayers to reseal.12 After the first sequence of pulses is applied, the membrane is permeated as the current jumps to a relatively high level (Fig. 5a). However, when the second sequence of pulses is applied after 60 seconds, small applied voltages (< 0.6 V) again result in very low currents, similar to those of the first sequence of pulses (Fig. 5a). The most likely explanation for this is that the pores shrink after release from the electric field. In the subsequent run, the ‘current jump’ occurs sooner than in the ‘first run’ because the pores still exist; therefore, it is easier to reopen them with the electric field than to create new ones. The ‘final run’ in the sequence is presented to compare the resealing capabilities with the more linear response of a cell that has lost its ability to reseal (Fig. 5b).
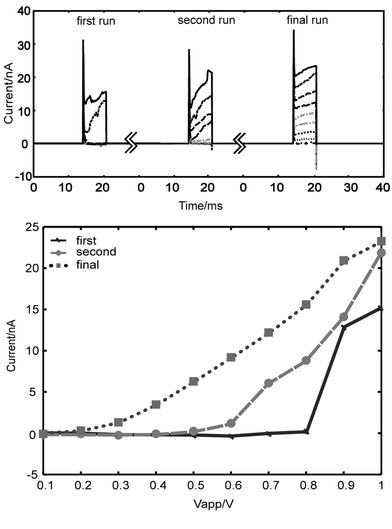 | ||
| Fig. 5 The hypothesis of reversible electroporation is supported. (a) The current in the ‘second run’, (the subsequent application of the 0.1 V–1 V sequence with the resting period of ∼60 s) shows similar characteristics of low current at low applied voltages as the ‘first run’. This implies the cell has returned to higher resistance. The ‘final run’ shows a cell after multiple pulse ‘runs’, in which a much more linear response is achieved. We assert that this illustrates the cell finally loses its ability to reseal. (b) Shown to compare the electrical characteristics of a cell resealing and one that can no longer. | ||
In addition to electrical measurements, time-lapsed images showing electroporation based on Calcein dye movement are shown in Fig. 6a. It can be seen from the fluorescent movement that the trapped cell is being porated when the pulse sequence as that shown in the inset of Fig. 4a is applied. It is clear that the dye is escaping through the cell membrane within the channel indicating maximum pore formation over that region. The fluorescent dye begins to escape within 1 second after the pulse. Analysis of the changes in fluorescent intensities of one of the cells is presented in Fig. 6b. The initial non-zero intensity outside the membrane indicates some background fluorescence in the system. Rapid (within 3 s) initial convergence of the intensities within the trapped region (Intinside) and outside the trapped region (Intoutside) indicates that the pulse application creates pathways for dye diffusion across the membrane. The delay between the initiation of the drop (Intinside) and the initiation of the rise (Intoutside) is believed to be due to the time delay required for the dye to escape the membrane. It should be noted that the fluorescent intensities Intoutside and Intinside do not completely converge even after repeated voltage application. This is likely due to Calcein dye binding to cytoplasmic structures. The fluorescent signal does not provide information about membrane resealing because dye concentrations within and outside of the cell reach equilibrium after the first pulse sequence is applied. The majority of dye transfer occurs after the short voltage pulse, indicating that diffusion is the predominant transfer mechanism. This is in agreement with previous observations.16
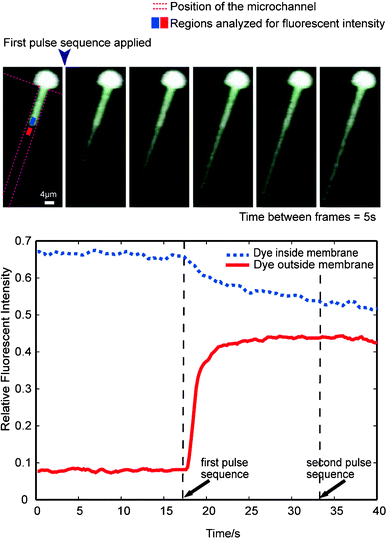 | ||
| Fig. 6 Time-lapsed fluorescent analysis. (a) A Calcein AM treated HeLa cell is trapped on a channel, and a pulse sequence as one shown in the inset of Fig. 4a is applied. Within 1 second after the pulse sequence the fluorescent dye begins to move out from the cell region within the channel. The dye continues to move out of the cell after the pulse. The interval between frames is 5 s, and the pulse sequence is applied after the first frame. (b) The intensities of two regions indicated in (a) is plotted. After the application of the first pulse sequence, a rapid (within 3 s) convergence of the intensities of the two regions is observed, indicating the pulse application creates pathways for dye diffusion across the membrane. The fluorescent intensity curves do not completely converge even after repeated ‘runs’, suggesting calcein dye binding to cytoplasmic component. The fluorescent result does not provide information about membrane resealing because the dye diffusion reaches equilibrium after the first pulse sequence. The ‘second run’ thus has no effect on the dye gradient. | ||
Time-lapsed images of the Trypan blue assay are shown in Fig. 7. The cell turns distinctly blue after the pulse sequence is applied, and since the cell remains free of Trypan blue unless the cell is porated, it indicated that the dye diffuses through the pores into the cell. It can be observed that the blue dye first appears in the cell at the region within the channel, and gradually migrates throughout the cell. From the figure it is clear that permeation is localized at the tail of the cell that is trapped inside the channel. This supports the hypothesis that the electric field concentration at the cell membrane within the channel is significantly greater than elsewhere. Interchanging the polarity of the applied voltage shows similar results, dismissing the possibility that electroporation occurred at that location because of electrode polarity (data not shown).
 | ||
| Fig. 7 Time lapsed video of Trypan blue entering the cell. The cell is trapped in a channel when the pulse sequence is applied. After the pulse sequence application, the cell turns distinctly blue as the dye diffuses through the electropores and concentrates inside the cell. It can be observed that the blue dye first appears in the cell at the region within the channel, and gradually migrates throughout the cell. | ||
The effects of cell deformation on electroporation need to be addressed. Membrane tension contributes to the critical energy density necessary for dielectric breakdown.17 However, Akinlaja and Sachs showed that, while for short pulses (50 µs) breakdown was dependent on tension, at longer pulses (50–100 ms) the voltage required for breakdown was tension independent. They suggest that the mechanism for low field/long pulses is different from that of high field/short pulses.18 Our pulses are in the millisecond range and therefore we expect that that the breakdown is not greatly affected by tension. Nevertheless, further investigation must be pursued to resolve the mechanism responsible for breakdown at longer pulses.
We are currently assessing the effects of tension on electroporation using this set-up. With respect to the device, we are developing automated multiple single-cell trapping as well as multiplexed signal measurement capabilities.
Conclusions
We demonstrate the effectiveness of using a PDMS microfluidic device with individual lateral cell trapping sites to selectively and locally electroporate single cells in parallel. This easy-to-use chip focuses the electric field and therefore achieves dielectric breakdown of the cell membrane using low applied voltages (∼0.76 ± 0.095 V). This design also enables the electrodes to be placed a distance from the cell, eliminating the need to incorporate electrodes on chip and the potential of adverse products from electrode reactions. We assess membrane permeation by measuring characteristic ‘jumps’ in current that correspond to drops in cell resistance. In addition, we record either the escape of the cytoplasmic dyes Calcein or the entrance of Trypan blue. Our data demonstrate that resealing is achievable with this set-up.This provides an efficient means of introducing otherwise impermeant material, such as drugs, DNA, and protein, into individual cells. We demonstrate here the feasibility of introducing materials into the trapped, permeabilized cells by adding Trypan blue to our cell suspension. Uptake of Trypan blue through the trapping channels (Fig. 7) indicates that this is the area of permeabilization. Therefore, delivery can be accomplished more efficiently by simply pre-loading the channels with various materials of interest. We are working on subsequent device designs to optimize material delivery.
References
- J. A. Lundqvist, F. Sahlin, M. A. Aberg, A. Strimberg, P. S. Eriksson and O. Orwar, Proc. Natl. Acad. Sci., 1998, 95, 10356–10360 CrossRef CAS.
- T. Y. Tsong, Biophys. J., 1991, 60, 297–306 CrossRef CAS.
- J. C. Weaver, J. Cell Biochem., 2002, 51, 426–435.
- J. L. Rae and R. A. Levis, Eur. J. Physiol., 2002, 443, 664–670 Search PubMed.
- E. Neumann, M. Schaefer-Ridder, Y. Wang and P. H. Hofschneider, EMBO J., 1982, 1, 841–845 CAS.
- D. C. Chang, B. M. Chassy, J. A. Saunders and A. E. Sowers, Guide to Electroporation and Electrofusion, Academic Press, Inc., San Diego, 1992 Search PubMed.
- K. Nolkrantz, C. Farre, A. Brederlau, I. D. Karlsson, C. Brennan, P. S. Eriksson, S. G. Weber, M. Sandberg and O. Orwar, Anal. Chem., 2001, 73(18), 4469–4477 CrossRef CAS.
- K. Haas, W. C. Sin, A. Javaherian, Z. Li and H. T. Cline, Neuron, 2001, 29, 583–591 CrossRef CAS.
- Y. Huang and B. Rubinsky, Sens. Actuators, A, 2001, 89, 242–249 CrossRef.
- K. Nolkrantz, C. Farre, K. J. Hurtig, P. Rylander and O. Orwar, Anal. Chem., 2002, 74, 4300–4305 CrossRef CAS.
- F. Ryttsén, C. Farre, C. Brennan, S. G. Weber, K. Nolkrantz, K. Jardemark, D. T. Chiu and O. Orwar, Biophys. J., 2000, 79(4), 1993–2001 CrossRef CAS.
- R. W. Glaser, S. L. Leikin, L. V. Chernomordik, V. F. Pastushenko and A. I. Sokiro, Reversible electrical breakdown of lipid bilayers: formation and evolution of pores, Biochim. Biophys. Acta, 1988, 940, 275–287 CAS.
- K. Kinosita, Jr. and T. Y. Tsong, Formation and resealing of pores of controlled sizes in human erythrocyte membrane, Nature, 1977, 268, 438–441 CAS.
- L. V. Chernomordik, S. I. Sukharev, S. V. Popov, V. F. Pastushenko, A. V. Sokirko, I. G. Abidor and Y. A. Chizmadzhev, The electrical breakdown of cell and lipid membranes: the similarity of phenomenologies, Biochim. Biophys. Acta, 1987, 902, 360–373.
- J. Seo, C. Ionescu-Zanetti, J. Diamond, R. La and L. P. Lee, Appl. Phys. Lett., 2004, 84(11), 1973–1975 CrossRef CAS.
- E. Neumann, K. Toensing, S. Kakorin, P. Budde and J. Frey, Biophys. J., 1998, 74, 98–108 CrossRef CAS.
- D. Needham and R. M. Hochmuth, Biophys. J., 1989, 55, 1001–1009 CrossRef CAS.
- J. Akinlaja and F. Sachs, Biophys. J., 1998, 75, 247–254 CrossRef CAS.
Footnote |
| † Both primary authors contributed equally to this paper and are listed here alphabetically. |
| This journal is © The Royal Society of Chemistry 2005 |
