Optical sectioning for microfluidics: secondary flow and mixing in a meandering microchannel†
Yeh-Chan
Ahn
,
Woonggyu
Jung
and
Zhongping
Chen
*
Beckman Laser Institute and Department of Biomedical Engineering, University of California, Irvine, Irvine, CA, USA. E-mail: ahny@uci.edu; z2chen@uci.edu; Fax: +1-949-824-8413; Tel: +1-949-824-1247
First published on 22nd October 2007
Abstract
Secondary flow plays a critical function in a microchannel, such as a micromixer, because it can enhance heat and mass transfer. However, there is no experimental method to visualize the secondary flow and the associated mixing pattern in a microchannel because of difficulties in high-resolution, non-invasive, cross-sectional imaging. Here, we simultaneously imaged and quantified the secondary flow and pattern of two-liquid mixing inside a meandering square microchannel with spectral-domain Doppler optical coherence tomography. We observed an increase in the efficiency of two-liquid mixing when air was injected to produce a bubble-train flow and identified the three-dimensional enhancement mechanism behind the complex mixing phenomena. An alternating pair of counter-rotating and toroidal vortices cooperated to enhance two-liquid mixing.
Introduction
A Reynolds number of the primary flow in a microchannel is usually less than 100 and one cannot expect turbulent mixing. In order to enhance mixing efficiency, time-periodic or geometrical-periodic perturbations have been suggested.1 All of them result in an increased complexity in the secondary flow. However, there is no experimental method to visualize the secondary flow and the associated mixing pattern in a microchannel because of difficulties in high-resolution, non-invasive, cross-sectional imaging.In this article, we report the observation of secondary flow and convective two-liquid mixing in a meandering microchannel using spectral-domain Doppler optical coherence tomography (SDDOCT).2–4 We observed an increased efficiency of mixing in liquid slugs when air was injected to produce a bubble-train flow. SDDOCT is an emerging imaging modality that has high-speed, high-resolution, non-invasive, cross-sectional imaging capability. Since SDDOCT allows simultaneous real-time visualization of sample structure and flow, it is often compared to clinical ultrasound. However, the spatial resolution of clinical ultrasound is limited to approximately 100 µm due to the relatively long wavelength of acoustic waves. SDDOCT takes advantage of the short coherence length of broadband light sources in order to achieve cross-sectional images with micrometer (2–10 µm) scale resolution. SDDOCT is also superior to ultrasound in that SDDOCT is operated in non-contact-mode. Because of the aforementioned merits, SDDOCT has received a great deal of attention in the fields of biology and medicine. However, SDDOCT has seldom been applied to microscale flow and mixing visualizations.
When SDDOCT is compared to other techniques for microscale visualization, the uniqueness of SDDOCT can be summarized in Table 1. Fluorescence microscopy (FM) and confocal laser scanning microscopy (CLSM) provide better spatial resolution but cannot measure flow and mixing simultaneously, need transparent liquids and conduits, and give an en face image rather than a cross-sectional image. In contrast to FM, CLSM is able to image different depths but its accessible depth is limited to 0.5 mm.5 Micro particle imaging velocimetry (µPIV) has been a useful tool for microfluidics, but it is difficult to measure out-of-plane velocity which is parallel to line-of-sight6 and is not capable of real-time imaging. A multi-beam SDDOCT can quantify a velocity vector with three components without complex post-processing.7 In order to enhance spatial resolution of clinical ultrasound, ultrasound biomicroscopy (UBM) with a high-frequency (100–200 MHz) transducer was demonstrated and achieved 15 µm spatial resolution.8 However, UBM is expensive, has to sacrifice imaging depth in order to enhance spatial resolution, and still needs contact-mode. X-Ray is another alternative for microscale visualization.9,10 It works with opaque conduits and provides high spatial resolution. Imaging speed, however, is slow, and it needs synchrotron radiation.
| Modalities | Available techniques | Spatial dimension | Spatial resolution/µm | Imaging depth/mm | Frame rate for 2D slice | Simultaneous measurement of flow and mixing | Number of velocity components | Cost | Features |
|---|---|---|---|---|---|---|---|---|---|
| a µPIV: micro particle imaging velocimetry. b FR: fluorescence; PR: phosphorescence. c With 7.8 MHz frequency. d With 200 MHz frequency. e With synchrotron X-ray source. | |||||||||
| Fluorescence microscopy | µPIV a | 2D | 5 | N/A | Slow | No | 2 or 3 | Low | Non-invasive |
| FR- or PR-basedb | 1 | Real time | |||||||
| Confocal laser scanning microscopy | µPIV | 2D or 3D | 5 | 0.5 | Slow | No | 2 | High | Non-invasive |
| FR- or PR-based | 1 | Real time | |||||||
| OCT | Doppler OCT | 2D or 3D | 2–10 | 2–3 | Real time | Yes | 1 or 3 | Low | Non-invasive, turbid liquids |
| Ultrasound | Echo PIVc | 2D | 400 | 16 | Slow | No | 2 | High | Contact, opaque conduits |
| Ultrasound biomicroscopyd | 2D or 3D | 15 | 0.6 | Real time | Yes | 1 | |||
| X-Ray | µPIV e | 2D | 13 | N/A | Slow | No | 2 | Very high | Non-invasive, opaque conduits |
| Industrial CT | 2D or 3D | 50–100 | Unlimited | ||||||
| X-Ray tomography microscopye | 2D or 3D | 2–3 | 10 |
Since its first demonstration,11 the secondary flow inside a curved channel12–18 has received much attention because it is found in many areas from heat exchangers to human arterial systems.19,20 All previous experimental works were done with large pipes and utilized laser Doppler anemometry21,22 or tracers,11,19,20,23,24 like dye, hydrogen bubble, or powder, to explore the secondary flow. Recently, mixing by chaotic advection was demonstrated in droplets moving through a meandering microchannel.25 The droplets with two aqueous reagents were separated by oil. It was hypothesized that the reagents in the droplets experienced the baker's transformation: the reagents were folded and stretched by the recirculating flow in the straight portion of the microchannel and reoriented as the reagents moved around a turn. However, it was difficult to clearly visualize mixing patterns that corresponded to the baker's transformation because the microscope-based imaging system provided an en face image integrated along line-of-sight and could not image three-dimensional mixing patterns. This was the reason that the authors gave only a two-dimensional description in the en face plane. Here, we emphasize SDDOCT's capability of three-dimensional tomographic imaging and measurement of out-of-plane velocity component to show a full mechanism behind complex mixing phenomena.
In the Theory section, we will show the mathematical details about the interaction between light and moving particles based on a Michelson interferometer. We will present experimental conditions and procedures including how to make a volume image in the Methods section. In the Results and discussion section, we will show velocity images for the secondary flow and mixing pattern images with/without air injection which enhances two-liquid mixing. We will discuss three-dimensional enhancement mechanism before we conclude.
Theory
While the theoretical background of optical coherence tomography in the spectral-domain has been reported,26–28 the Doppler effect has not been rigorously derived yet. In this section, we will summarize how the Doppler effect can be formulated for SDDOCT (see ESI† for its detailed derivation).SDDOCT is a fusion of laser Doppler velocimetry and optical coherence tomography based on a Michelson interferometer shown in Fig. 1. Four arms around a 50 : 50 beam splitter in the Michelson interferometer are assigned by a low-coherence light source at the source arm, a spectrometer with a line array of detectors and a diffraction grating at the detector arm, an immobilized mirror at the reference arm, and a two-axis scanner and a sample with moving scatterers at the sample arm. Reflected lights from the immobilized mirror and each scattering particle in the sample make a signal in the spectral-domain which is detected by the spectrometer.
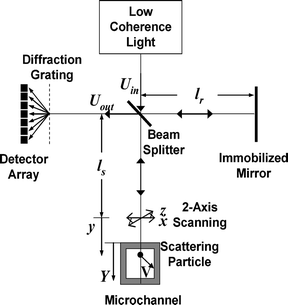 | ||
| Fig. 1 Michelson interferometer for spectral-domain Doppler optical coherence tomography. | ||
In order to describe the principle of SDDOCT, let us consider a steady-state velocity field of the moving scatterers, V(X) = (vX, vY, vZ) as a function of the position vector X = (X, Y, Z). The coordinates X, Y, and Z are attached on the microchannel shown in Fig. 1 and the XZ-plane is the top surface and the Y-coordinate is the depthwise direction of the microchannel. Let us define another set of coordinates, x, y, z, attached on the sample arm. Then, the description of the velocity field is V(x) = (vx, vy, vz) as a function of position vector x = (x, y, z). Let us have the y-coordinate coincide with the incident light to the microchannel. In order to measure vY with SDDOCT, we keep the incident light aligned to the Y-direction during two-axis scanning of the light in the x- and z-directions. Once a line field of vy(y) at a fixed position of (x, z) is measured, the scanner moves the light to another position of (x, z) to get a three-dimensional velocity field of vy(x, y, z). We, hereafter, describe how the line field is measured.
The instantaneous positions of moving scatterers in the y-coordinate are described as y = y0 + vy(y0)t for a sufficiently short time t where y0 denotes initial positions. Now let us consider an input analytic signal Uin(ω,t) to the interferometer:
| Uin(ω,t) = s(ω)exp[–i(ωt – ϕ)], | (1) |
 | (2) |
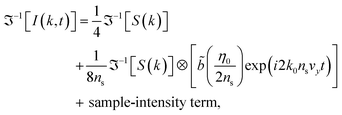
Now we adjust the physical length of the reference arm lr to satisfy nrlr = nsls. Once the spectrometer records the intensity I of the output analytic signal as a function of time t and wavenumber k (= ω/c) in free space, we take the inverse Fourier transform of the intensity from the k- to the 2nsy0-domain (i.e. the optical double path length domain which will be denoted as η0-domain) to get a final result:
 | (3) |
 | (4) |
 | (5) |
![[b with combining tilde]](https://www.rsc.org/images/entities/i_char_0062_0303.gif) (η0/2ns) is an even function defined as
(η0/2ns) is an even function defined as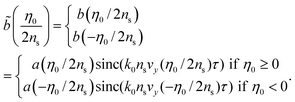 | (6) |
The first term in eqn (3) can be pre-calibrated, and the third is negligible for a highly scattering sample.26 The second term is our target signal and is referred to as the cross-interference term. The magnitude of the second term gives a structural image and the phase, a velocity image. Suppose that the light source has a Gaussian power spectral density with a center wavenumber k0 and a full-width-half-maximum (FWHM) spectral width Δk in wavenumbers. The inverse Fourier transform of S(k) with a broad bandwidth gives a narrow Gaussian distribution where the FWHM is 8ln2/Δk in the η0-domain. If we have a stationary mirror as a sample, the structural image is the convolution of a delta function and ℑ–1[S(k)] with a FWHM depth resolution of 4ln2/nsΔk in the y0-domain. If the mirror is moving with vy, a motion artifact comes in because of the finite integration time τ and degrades the spatial resolution. In fact, the degradation can be explained by the convolution of the stationary image with a rect function, that is the inverse Fourier transform of the sinc function.28 In order to get the line field of vy(y0), we need two consecutive exposures of the spectrometer at time t and t + T at a fixed position of (x, z). This gives two complex signals of ℑ–1[I(k,t)] and ℑ–1[I(k,t![[hair space]](https://www.rsc.org/images/entities/char_200a.gif) +
+![[hair space]](https://www.rsc.org/images/entities/char_200a.gif) T)]. The ensemble average of phase difference between the complex signals can be related to the line field of velocity:
T)]. The ensemble average of phase difference between the complex signals can be related to the line field of velocity:
 | (7) |
Since the ensemble average of the phase difference ranges from –π to π, the detectable velocity range of vy is from –λ0/4nsT to λ0/4nsT where λ0 is the center wavelength. Any velocity outside this range will cause an aliasing effect. A phase unwrapping technique29 using flow continuity can further increase this limitation by a factor of 4. Therefore, the time interval T should fall in the range of τ < T < λ0/nsvymax where vymax is the maximum velocity.
Typical values of the parameters used in this study is as follows: τ = 24.4 µs, T = 129.6 µs, λ0 = 1310 nm, Δk = 0.33 µm–1, 4ln2/nsΔk (depth resolution) = 6.3 µm, and the ensemble number N for the averaging of the phase difference = 4. This technique to measure the line velocity field can be applied to a transient flow if NT is reasonably smaller than the characteristic time scale of the transient flow. By adjusting the orientation of the incident light relative to the sample, we can basically measure any component of velocity vector for a steady-state flow. We, however, are focusing on the out-of-plane velocity vY in this study, not only to emphasize the SDDOCT's capability but also to address the secondary flow.
Methods
Experimental details
A meandering square microchannel (SMS0104; thinXXS Microtechnology AG, Mainz, Germany) made of cyclo-olefin copolymer is shown in Fig. 2(b). It has a Y branch at the beginning, and the dimension of cross-section between confluence and outlet is 600 µm × 600 µm. The radius of curvature R has a minimum of 1.7 mm. Four groups of experiments were conducted as summarized in Table 2. First, there was a single-phase liquid flow experiment where a 2.5% aqueous suspension of polystyrene beads (0.2 µm in diameter and 1.05 g cm–3 in density) was injected into inlets 1 and 2 of the Y branch. The secondary flow was visualized with different flow rates (0.2, 0.4, and 0.6 ml min–1 per inlet). Second, there was a two-liquid mixing experiment where deionized water and a 2.5% aqueous suspension of polystyrene beads were injected into inlets 1 and 2, respectively. The mixing pattern was observed with different flow rates (0.2 and 0.6 ml min–1 per inlet). Third, there was a gas–liquid mixing experiment where a 2.5% aqueous suspension of polystyrene beads and air were injected into inlet 1 with a flow rate of 0.25 ml min–1 and inlet 2 with a flow rate of 0.08 ml min–1. The enhancement of the secondary flow was imaged. Four, a two-liquid mixing enhanced by gas injection was visualized. A 2.5% aqueous suspension of polystyrene beads and the deionized water were injected into inlets 1-1 and 1-2, respectively, with a flow rate of 0.125 ml min–1 for each and the air into inlet 2 with a flow rate of 0.08 ml min–1. Since the density of polystyrene beads is almost the same as that of water, the beads follow the mean liquid movement faithfully. The average distance between beads is sufficiently smaller than the current imaging resolution with a particle concentration of 2.5%. Hence, the resolution is not limited by the particle number density. The ensemble average of the phase difference addressed in the previous section reduces the effect of Brownian motion which is not negligible with a small bead diameter. All fluids were injected by dual-syringe pumps (11 Plus; Harvard Apparatus, Holliston, MA) with ±0.5% flow rate accuracy.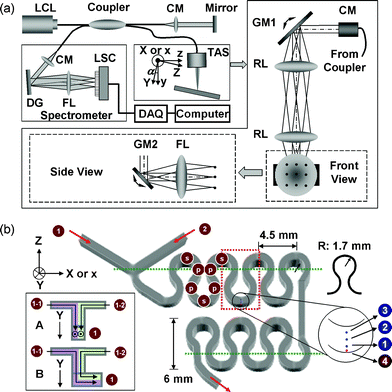 | ||
Fig. 2 Experimental setup. (a) Schematic diagram for spectral-domain Doppler optical coherence tomography, and (b) a meandering square microchannel: ( ) area of interest; ( ) area of interest; ( ) line of interest; ( ) line of interest; ( or or  ) point of interest; LCL: low-coherence light; CM: collimator; DG: diffraction grating; FL: focusing lens; LSC: line scan camera; GM: galvo mirror; RL: relay lens, TAS: two-axis scanner. ) point of interest; LCL: low-coherence light; CM: collimator; DG: diffraction grating; FL: focusing lens; LSC: line scan camera; GM: galvo mirror; RL: relay lens, TAS: two-axis scanner. | ||
| Expt 1 | Expt 2 | Expt 3 | Expt 4 | ||||||
|---|---|---|---|---|---|---|---|---|---|
| a With the configuration A as shown in Fig. 2(b). b W/P: water with particle (2.5% aqueous suspension of polystyrene beads); W: water; and A: air. | |||||||||
| Inlet port | 1 | 2 | 1 | 2 | 1 | 2 | 1-1a | 1-2a | 2 |
| Fluidb | W/P | W/P | W | W/P | W/P | A | W/P | W | A |
| Flow rate/ml min–1 | 0.2 | 0.2 | 0.2 | 0.2 | 0.25 | 0.08 | 0.125 | 0.125 | 0.08 |
| 0.4 | 0.4 | 0.6 | 0.6 | ||||||
| 0.6 | 0.6 | ||||||||
Producing method of images
SDDOCT measures the y-component of the velocity field vy(x, y, z) which is the particle velocity projected on the incident light. When the incident light is normal at the top or bottom surface of the meandering microchannel, the detected velocity does not include the primary flow. However, high backscatterings from the top and bottom surfaces give rise to saturation of the detector in the spectrometer so that the microchannel is slightly tilted with respect to the X-axis by α = –1.5° from the normal illumination [see Fig. 2(a)]. If the normal illumination has a relationship between two frames: x = X, y = Y, and z = Z, the new relationship due to the tilting is x = X, y = Ycosα – Zsinα, and z = Ysinα + Zcosα. Because of the –1.5° tilting, the effect of the primary flow is included except when the primary flow at certain positions [for example, the positions marked by in Fig. 2(b)] is parallel to the X-axis (note that the incident light or y-axis is normal to the primary flow parallel to the X-axis).
Four camera exposures were averaged to make an A-scan (a scan along the y-axis) and 4000 exposures for the B-scan (a scan along the x-axis) constituted a cross-sectional image. Cross-sectional images were taken every 5 µm during the C-scan (a scan along the z-axis) and a total of 1200 images was rendered to construct a tilted volume image. The physical size of a voxel was 5 µm (x) × 6.3 µm (y) × 5 µm (z). Once we obtained the tilted volume image in the xyz frame, we transformed the xyz frame to the XYZ frame and sectioned the volume image with the XY-, YZ-, and XZ-planes to generate the images in Fig. 3 and Fig. 4.
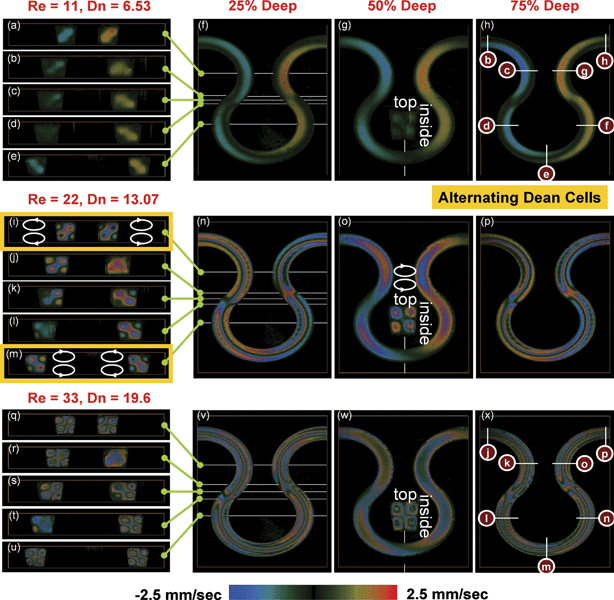 | ||
| Fig. 3 The liquid velocity vy(X, Y, Z) projected on the incident light in the area of interest. The velocity field shows a pair of counter-rotating vortices indicated above the inset in (o). Since the curvature is alternating, the rotational direction of the vortices is also alternating as shown by comparing (i) to (m). (a–e, i–m, q–u) The y-component velocity field vy(X, Y, Z) sectioned by the XY-planes. (f–h, n–p, v–x) The y-component velocity field vy(X, Y, Z) sectioned by the XZ-planes. (Insets in g, o, w) The y-component velocity field vy(X, Y, Z) sectioned by the YZ-planes. | ||
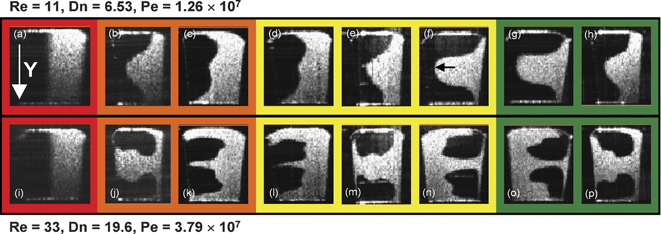 | ||
| Fig. 4 Cross-sectional mixing pattern of water and polystyrene suspension is evolving and oscillating along the meandering channel. The oscillating is caused by the secondary flow. When one sees the mixing from the top over the channel, it looks as if two liquids were completely mixed. Alternately curving a channel, however, is not enough to make a complete mixing. Each horizontal row has a different flow rate. | ||
Results and discussion
This study is composed of four experiments with a meandering square microchannel. The first experiment was intended to measure the liquid velocity within the area of interest in Fig. 2(b). The area was scanned by the two-axis scanner shown in Fig. 2(a). The y-component of the velocity field vy(X, Y, Z) is shown in Fig. 3.Each horizontal row in Fig. 3 has a different flow rate shown in Table 2. The Reynolds number Re is defined by Re = VW/ν for each row was 11, 22, and 33, respectively, where V is the cross-sectional average of the primary velocity, W is the channel width, and ν is the kinematic viscosity. Top views (the XZ-plane) from the second to the fourth column in Fig. 3 were reconstructed from volume images. The second column [Fig. 3(f), (n), (v)] shows a plane at 25% of the channel depth apart from the top, and the third [Fig. 3(g), (o), (w)], 50% (symmetric plane), and the fourth [Fig. 3(h), (p), (x)], 75%. The locations for five cross-sectional images (the XY-plane) in the first column [Fig. 3(a–e), (i–m), (q–u)] were indicated by the lines in the second column. Each inset in the third column is a side view (the YZ-plane) of the location indicated by the line right below where the effect of the primary flow caused by –1.5° tilting with respect to the X-axis vanishes (see the Methods section). The curvature ratio W/R varied periodically with large amplitude (from –35 to 35%) along the streamwise direction where R is the radius of curvature. The maximum Dean number for each row is 6.53, 13.07, and 19.6, respectively. The Dean number is defined by Dn = Re√(W/R).
As shown in the insets in Fig. 3(g), (o), and (w), the measured velocity field presented a pair of counter-rotating vortices (Dean cells), one in the upper half and the other in the lower half, as indicated above the inset in Fig. 3(o). The inset in Fig. 3(o) is divided into four areas which are separated by the black color, i.e. vy = 0. Each area has circular color patterns. The outermost color in an area indicates the direction of vy across the area. For example, the outermost color in the upper left area is blue which means that the direction of vy is upward (negative vy). The red color at the center of the upper left area does not mean positive vy but more negative vy because there is an abrupt color change from blue to red. A strong negative velocity caused an aliasing effect or a phase wrapping. Finally, we did the same analysis with changing the relative orientation between the incident light and the microchannel to verify the structure of the Dean cells. The centrifugal force exerted at each fluid element generated the vortices. Hence, the secondary flow moved from the inside to the outside side wall along the horizontal symmetric line. Since the curvature was alternating, the rotational direction of the vortices was also alternating, as shown by comparing Fig. 3(i) to (m). The first order of Dean's solution12,13 for secondary flow velocity in a circular tube states that the maximum velocity component normal to the interface of the Dean cells is (0.0096Dn2/Re)V when Dn < 24. The measured values in the present study showed good agreement with it. It is shown in Fig. 3(b–d), (j–l), and (r–t) that the secondary flow was developing because of alternating curvature. The length required for full development increased with increasing flow rate, as indicated by the three lines in the middle of Fig. 3(f), (n), and (v). As mentioned before, Fig. 3(g), (o), and (w) depict the y-component of the velocity field in the symmetric plane. In this symmetric plane, the effect of the primary flow dominates because the secondary flow is almost normal to the incident light [at the positions, for instance, marked by  in Fig. 2(b), the secondary flow is exactly normal to the incident light] and its magnitude is much smaller than the primary flow. The primary velocity profile deviated from the Poiseuille flow and the location, where maximum velocity is, moved from the center toward the outside side wall.
The second experiment was conducted to visualize the mixing pattern, as shown in Fig. 4. The same image-producing method as the first experiment was used. The Reynolds number for each row in Figs. (a–h) and (i–p) is 11 and 33, the Dean number is 6.53 and 19.6, and the Péclet number Pe = VW/D is 1.26 × 10⁷ and 3.79 × 10⁷, respectively, where D is the molecular diffusivity. The Péclet number is the ratio of convection to molecular diffusion. Convection dominates mixing phenomena in this condition. The mixing patterns in each row were imaged at the location labeled by the marks in Fig. 3(h) and (x). The mixing patterns were aligned to have the same direction of the primary flow [the label locations in Fig. 3(h) and (x) correspond to the left side of the mixing patterns in Fig. 4]. The different colors of the figure frames denote different curvature.
It is clearly shown that vertical interfaces [Fig. 4(a) and (i)] at the confluence were distorted and evolved by the counter-rotating vortices with alternating rotation. For instance, the interface intersecting with the symmetric plane moved back and forth. When comparing Fig. 4(d) with (f), the interface located at the center of the channel proceeded to the outer channel wall [indicated by the arrow in Fig. 4(f)] by 25% of the channel width. The proceeded distance calculated with the first order of Dean's solution is 20.8%. A movie clip for the volume-rendered mixing pattern is shown in Video 1 in the ESI† (Re = 11). Even though the secondary flow is exactly reversed when the curvature is reversed, the interface intersecting with the symmetric plane does not oscillate around the channel center. It is supposed that the biased oscillation is caused by the initial condition imposed before the first turn. When one sees the mixing from the top over the channel, it looks as if the two liquids are completely mixed. Alternately curving a channel, however, was not enough to make a complete mixing even at the end of the channel.
The third and fourth experiments were designed to enhance two-liquid mixing and to visualize the enhancement mechanism. The hypothesis was that injecting air into two liquids enhances mixing. By injecting air, a bubble-train flow30–32 was sustained in a quasi-steady-state. Through the third experiment, the velocity field, which governs a mixing phenomenon, was imaged. The velocity field of bubble-train flow in the meandering microchannel is characterized by the Dean number Dnj based on the overall superficial velocity j [= (Ql + Qg)/A] and the capillary number Ca. Those are defined as Dnj = jW/ν√(W/R) and Ca = µUb/σ, respectively, where Ql and Qg are the liquid and gas flow rates, respectively, A is the cross-sectional area, µ is liquid viscosity, σ is interfacial tension, and Ub is bubble velocity. The bubble velocity Ub and, therefore, Ca can be estimated from the overall superficial velocity.31 The Dean number and the capillary number were about 5.4 and 2.7 × 10⁻⁴, respectively, under the present experimental conditions. Since the flow has rapid, transient phenomena and the camera frame rate (1/T) is limited, it was impossible to acquire an instantaneous volume image. Therefore, the probe beam of SDDOCT was fixed at the locations indicated by the blue and red dots in Fig. 2(b) without B- and C-scans. Continuous camera exposure constitutes depth versus time images like in Fig. 5. The three blue dots, which are indicated by the numbers 1–3 in Fig. 2(b), evenly divide the channel width into quarters. Fig. 5(b–d) were taken at the lower, center, and upper blue dots, respectively. The red dot indicated by the number 4 is located 20 µm away from the outside side wall where Fig. 5(e) was taken.
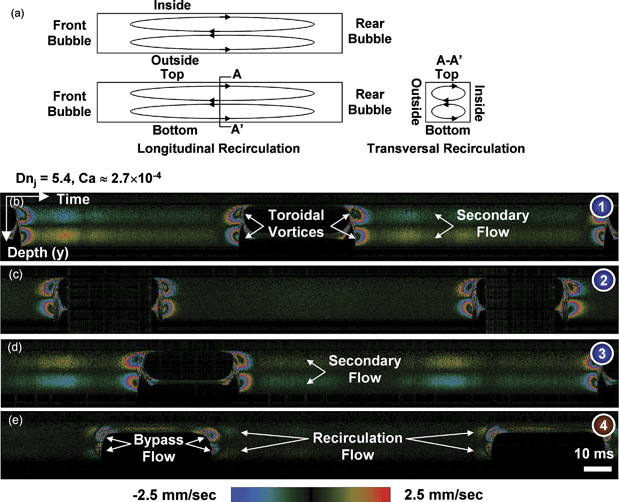 | ||
| Fig. 5 Depth versus time images showing liquid velocities projected on the incident light vy(y,t). (a) Schematic diagram illustrating the three-dimensional flow field which gives rise to mixing enhancement. (b–d) Liquid slug in bubble-train that flows through a meandering microchannel has not only a transversal recirculation by the secondary flow but also a longitudinal recirculation associated with the toroidal vortices to enhance mixing performance. (e) A bypass flow with the longitudinal recirculation imaged. Each image was taken at a different point of interest shown in Fig. 2(b). | ||
In the liquid region far from the bubbles in Fig. 5(b–d), the secondary flow caused by the curvature was also observed. The maximum primary liquid velocity around the center of the cross-section far from the bubbles is about 1.8 times higher31,32 than the bubble velocity with a capillary number of 2.7 × 10⁻⁴. Therefore, a toroidal vortex per liquid slug was generated before and after the bubbles and made a longitudinal recirculation flow when this flow was seen in a coordinate system moving with the bubbles. The longitudinal recirculation adds a complexity to the transversal recirculation by the secondary flow to be the key mechanism for mixing enhancement. Fig. 5(a) is a schematic diagram for the three-dimensional flow field which gives rise to the mixing enhancement. Strong vertical (along the y-axis) liquid motions resulting from the toroidal vortices were detected as shown in Fig. 5(b–d). On the other hand, there is a bypass liquid flow at the corners of the square channel from the front liquid slug to the back because the cross-sectional average of primary liquid velocity is about 0.8 of bubble velocity.31,32 The bypass flow is imaged in Fig. 5(e) with the longitudinal recirculation flow and can be observed only at the corners in this capillary number regime.
In order to visualize the enhanced mixing, the unmixed and vertically arranged two liquids were pumped into inlet 1 using the configuration A shown in Fig. 2(b). At the same blue dots, depth versus time images were recorded with the same gas and liquid flow rates and are shown in Fig. 6. The Péclet number Pej based on the overall superficial velocity was 1.04 × 10⁷ in this condition. At a liquid slug far from the bubbles, the primary velocity profile made fluid elements disperse parabolically and this axial dispersion was perturbed by the alternating secondary dispersion shown in Fig. 4. In addition, longitudinal recirculation enhanced radial mixing near the bubbles. This transient mixing was also imaged at the 16 cross-sections along the lines of interest in Fig. 2(b). The transient mixing patterns at the 5th, 6th, 11th, 12th, 15th, and 16th cross-sections are presented in Fig. 7 and Videos 2–4 in the ESI† to compare with Fig. 4. Mixing performance was greatly enhanced. It was supposed that a complete mixing was done by the 15th cross-section with the current resolution limit (6.3 µm). As a matter of fact, the thickness of liquid layers (approx. initial thickness × 0.5logPe, where log![[thin space (1/6-em)]](https://www.rsc.org/images/entities/char_2009.gif) Pe is the number of folding for a complete mixing) can be as small as a micron right before a complete mixing occurs when the Péclet number is high. If we have a ultra broadband light source with a shorter center wavelength, a submicron imaging is possible with SDDOCT. It is nevertheless difficult to measure concentration variation over a cross-section in order to determine a mixing uniformity.
Pe is the number of folding for a complete mixing) can be as small as a micron right before a complete mixing occurs when the Péclet number is high. If we have a ultra broadband light source with a shorter center wavelength, a submicron imaging is possible with SDDOCT. It is nevertheless difficult to measure concentration variation over a cross-section in order to determine a mixing uniformity.
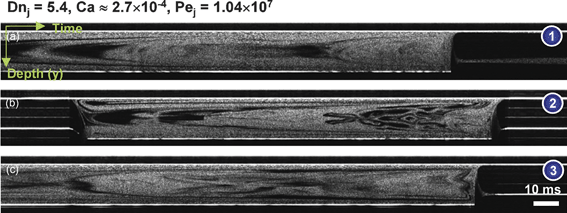 | ||
| Fig. 6 Depth versus time images showing an enhanced mixing pattern of water and polystyrene suspension within a liquid slug of bubble-train flow. Each image was taken at a different point of interest shown in Fig. 2(b). | ||
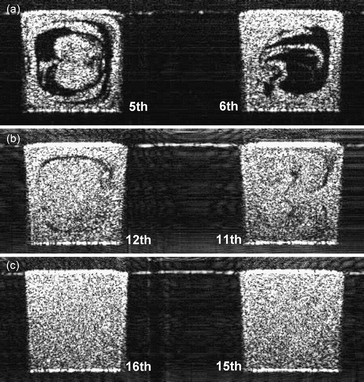 | ||
| Fig. 7 Transient mixing patterns enhanced by the bubble-train flow were imaged at the 5th, 6th, 11th, 12th, 15th, and 16th cross-sections (see Videos 2–4 in the ESI†). It was supposed that a complete mixing was done by the 15th cross-section with the current resolution limit of 6.3 µm. Dnj = 5.4, Ca ≈ 2.7 × 10⁻⁴, Pej = 1.04 × 10⁷. | ||
The characteristic time for the longitudinal recirculation is defined as the time for the liquid to move from one end of the liquid slug to the other end. With the current capillary number, the longitudinal recirculation time is 3lls/Ub where lls is the length of the liquid slug.32 The characteristic time for the alternating secondary flow is defined as the time for the liquid slug to go through one period of the meandering microchannel, lp/Ub where lp is length of one period of the microchannel. Therefore, 3lls/lp means how many perturbations one can expect during the time for the liquid to move from one end of the liquid slug to the other end. In other words, lp/3lls means how many foldings by longitudinal recirculation one can expect during the time for the liquid slug to turn a period of the meandering microchannel. In the case of Fig. 6(b), the number lp/3lls was 1.18 and the total number of folding for the entire channel was about 8 which is almost equal to the number of folding for a complete mixing, log![[thin space (1/6-em)]](https://www.rsc.org/images/entities/char_2009.gif) Pej.
Pej.
The performance of two-liquid mixing is sensitive to arrangements of two liquids at the inlet. If the interface between the two liquids is oriented horizontally at inlet 1 using the configuration B shown in Fig. 2(b), the mixing will not be efficient because the perturbation caused by the alternating Dean cells will be of no use.
Conclusions
We applied SDDOCT to the visualization of secondary flow and two-liquid mixing inside a meandering microchannel in order to emphasize SDDOCT's uniqueness: out-of-plane velocity measurement and real-time, high-resolution cross-sectional imaging. We derived mathematical details about how the structural and velocity images were recorded simultaneously. Particularly, the Doppler effect was rigorously formulated in the context of SDDOCT for the first time. The Dean cells were quantified and compared to the analytical result. We imaged alternating Dean cells which served as periodic perturbation. A bubble injection method to enhance the two-liquid mixing was proposed. The full enhancement mechanism was identified in three-dimensional space: alternating Dean cells and toroidal vortices.As applications of lab-on-a-chip become more diverse, the geometry of the chip becomes more complex and the flow field inside the chip has been changed from a simple Poiseuille flow to three-dimensional fields. The complex nature of the chip requires a novel probe that acts like the scanning electron microscope in the semiconductor industry and assures quality control by diagnosing structure and flow in real-time and non-invasively. SDDOCT will be a strong candidate for the novel probe.
Acknowledgements
The authors acknowledge the support of the National Institutes of Health (EB-00293, NCI-91717, RR-01192), and the Air Force Office of Scientific Research (FA9550-04-1-0101). Institutional support from the Beckman Laser Institute Endowment is also gratefully acknowledged.References
- J. M. Ottino, Annu. Rev. Fluid Mech., 1990, 22, 207 Search PubMed.
- R. A. Leitgeb, L. Schmetterer, W. Drexler, A. F. Fercher, R. J. Zawadzki and T. Bajraszewski, Opt. Express, 2003, 11, 3116 Search PubMed.
- L. Wang, Y. Wang, S. Guo, J. Zhang, M. Bachman, G. P. Li and Z. Chen, Opt. Commun., 2004, 242, 345 CrossRef CAS.
- Y.-C. Ahn, W. Jung and Z. Chen, Appl. Phys. Lett., 2006, 89, 064109 CrossRef.
- A. D. Stroock, S. K. W. Dertinger, A. Ajdari, I. Mezic, H. A. Stone and G. M. Whitesides, Science, 2002, 295, 647 CrossRef CAS.
- F. Pereira and M. Gharib, Meas. Sci. Technol., 2002, 13, 683 CrossRef CAS.
- Y.-C. Ahn, W. Jung and Z. Chen, Opt. Lett., 2007, 32, 1587 CrossRef.
- D. A. Knapik, B. Starkoski, C. J. Pavlin and F. S. Foster, IEEE Trans. Ultrason. Ferroelectr. Freq. Control, 2000, 47, 1540 CrossRef.
- G. B. Kim and S. J. Lee, Exp. Fluids, 2006, 41, 195 CrossRef.
- J. H. Kinney and M. C. Nichols, Annu. Rev. Mater. Sci., 1992, 22, 121 CrossRef CAS.
- J. Eustice, Proc. R. Soc. London, Ser. A, 1910, 84, 107 CrossRef.
- W. R. Dean, Philos. Mag., 1927, 4, 208.
- W. R. Dean, Philos. Mag., 1928, 5, 673.
- S. A. Berger, L. Talbot and L.-S. Yao, Annu. Rev. Fluid Mech., 1983, 15, 461 Search PubMed.
- K. C. Cheng, R.-C. Lin and J.-W. Ou, J. Fluids Eng., 1976, 98, 41.
- K. N. Ghia and J. S. Sokhey, J. Fluids Eng., 1976, 99, 640.
- F. Schönfeld and S. Hardt, AIChE J., 2004, 50, 771 CrossRef.
- F. Jiang, K. S. Drese, S. Hardt, M. Küpper and F. Schönfeld, AIChE J., 2004, 50, 2297 CrossRef CAS.
- L. H. Back, Y. I. Cho, D. W. Crawford and D. H. Blankenhorn, J. Biomech. Eng., 1987, 109, 90 CrossRef CAS.
- L. H. Back, E. Y. Kwack and D. W. Crawford, J. Biomech. Eng., 1988, 110, 310 CrossRef CAS.
- Y. Agrawal, L. Talbot and K. Gong, J. Fluid Mech., 1978, 85, 497 CrossRef.
- L. Talbot and K. O. Gong, J. Fluid Mech., 1983, 127, 1 CrossRef.
- J. Eustice, Proc. R. Soc. London, Ser. A, 1911, 85, 119 CrossRef CAS.
- M. Akiyama, Y. Hanaoka, K. C. Cheng, I. Urai and M. Suzuki, in Flow visualization III, ed. W. J. Yang, Hemisphere Pub. Corp., Washington, 1985, pp. 526–530 Search PubMed.
- H. Song, M. R. Bringer, J. D. Tice, C. J. Gerdts and R. F. Ismagilov, Appl. Phys. Lett., 2003, 83, 4664 CrossRef CAS.
- G. Hausler and M. W. Lindner, J. Biomed. Opt., 1998, 3, 21 CrossRef.
- P. H. Tomlins and R. K. Wang, J. Phys. D: Appl. Phys., 2005, 38, 2519 CrossRef CAS.
- S. H. Yun, G. J. Tearney, J. F. de Boer and B. E. Bouma, Opt. Express, 2004, 12, 2977 CrossRef.
- Y. Zhao, K. M. Brecke, H. Ren, Z. Ding, J. S. Nelson and Z. Chen, IEEE J. Sel. Top. Quantum Electron., 2001, 7, 931 CrossRef CAS.
- A. Gunther, S. A. Khan, M. Thalmann, F. Trachsel and K. F. Jensen, Lab Chip, 2004, 4, 278 RSC.
- T. C. Thulasidas, M. A. Abraham and R. L. Cerro, Chem. Eng. Sci., 1995, 50, 183 CrossRef CAS.
- T. C. Thulasidas, M. A. Abraham and R. L. Cerro, Chem. Eng. Sci., 1997, 52, 2947 CrossRef CAS.
Footnote |
| † Electronic supplementary information (ESI) available: Theory of SDDOCT, supplementary video 1 (volume-rendered mixing pattern), 2 (enhanced mixing pattern 1 in bubble-train flow), 3 (enhanced mixing pattern 2 in bubble-train flow), and 4 (enhanced mixing pattern 3 in bubble-train flow). See DOI: 10.1039/b713626a |
| This journal is © The Royal Society of Chemistry 2008 |
