Experimental and theoretical investigations on magnetic behavior of (Al,Co) co-doped ZnO nanoparticles
O. D.
Jayakumar
a,
S. N.
Achary
a,
C.
Sudakar
b,
R.
Naik
b,
H. G.
Salunke
c,
Rekha
Rao
d,
X.
Peng
e,
R.
Ahuja
e and
A. K.
Tyagi
*a
aChemistry Division, Bhabha Atomic Research Centre, Trombay, Mumbai, 400085, INDIA. E-mail: aktyagi@barc.gov.in
bDepartment of Physics and Astronomy, Wayne State University Detroit, MI 48201, USA
cTechnical Physics and Prototype Engineering Division, Bhabha Atomic Research Centre, Trombay, Mumbai, 400085, INDIA
dSolid State Physics Division, Bhabha Atomic Research Centre, Trombay, Mumbai, 400085, INDIA
eDepartment of Physics, Condensed Matter Theory Group, Uppsala University, SWEDEN
First published on 3rd July 2010
Abstract
We present the structural and magnetic properties of Zn0.95−xCo0.05AlxO (x = 0.0 to 0.1) nanoparticles, synthesized by a novel sol–gel route followed by pyrolysis. Powder X-ray diffraction data confirms the formation of a single phase wurtzite type ZnO structure for all the compositions. The Zn0.95Co0.05O nanoparticles show diamagnetic behavior at room temperature. However, when Al is co-doped with Co with x = 0.0 to 0.10 in Zn0.95−xCo0.05AlxO, a systematic increase in ferromagnetic moment is observed up to x = 0.07 at 300 K. Above x = 0.07 (e.g. for x = 0.10) a drastic decrease in ferromagnetic nature is observed which is concomitant with the segregation of poorly crystalline Al rich ZnO phase as evidenced from TEM studies. Theoretical studies using density functional calculations on Zn0.95−xCo0.05AlxO suggest that the partial occupancy of S2 states leads to an increased double exchange interaction favoring the ferromagnetic ground states. Such ferromagnetic interactions are favorable beyond a threshold limit. At a high level doping of Al, the exchange splitting is reduced, which suppresses the ferromagnetic ordering.
Introduction
Controlling and tuning the magnetic properties in diluted magnetic semiconductor (DMS) oxides are of current interest because of their potential applications in spintronics and magneto-optoelectronic devices. The charge and spin degrees of the freedom of electrons can be exploited simultaneously for novel memory and optical device applications.1,2 Most of the DMS materials in thin film and nanostructured forms show ferromagnetism. However, in bulk materials such an observation is uncommon. In particular, Co-doped ZnO has attracted considerable interest.3 There are a number of reports on room-temperature ferromagnetism (RTFM) in thin films of Zn1–xCoxO fabricated by different techniques.4–7 Schwartz et al.8 observed ferromagnetism above room temperature in aggregated particles of Co-doped ZnO, by heat treating their colloidal quantum dots (below 200 °C). In contrast, recent works on well-characterized polycrystalline Zn1–xCoxO samples indicate that they are not ferromagnetic (FM) at room temperature,9–14 except for the samples in an isolated report by Deka et al.15 In general, studies on polycrystalline samples have converged on the conclusion that robust RTFM is not realizable in Co-doped ZnO without additional carrier doping and/or defects. Sato and Katayama-Yoshida16 predicted that Co-doped ZnO would become FM in the presence of n-type carriers. This was experimentally demonstrated by Schwartz and Gamelin17 by switching a paramagnetic (PM) state to a ferromagnetic (FM) state in Co-doped ZnO spin-coated films, produced from colloidal nanocrystals, by introducing and removing interstitial Zn (Zni), a native n-type defect of ZnO. Marcel et al.18 predicted and demonstrated experimentally that (Co, Li) co-doped ZnO exhibited ferromagnetic behavior at 300 K. They have shown that the non magnetic Co doped ZnO becomes ferromagnetic when co-doped with Li (which introduces the hole carriers) and the RTFM increases as the Li concentration increases. Recently, similar results were also reported by Liu et al.19 and Zhang et al.20 by co-doping with Al, where electrons are the carriers. He et al.21 reported similar results in Ga co-doped Co:ZnO sol gel derived nanoparticles. Al co-doping in Zn1–xCoxO nanowires, synthesized by water assisted reactive vapor deposition, showed enhanced RTFM compared to Zn1–xCoxO.22 It may be noted that most of the studies were performed in a low Al doping concentration region (≤3 at.% of Al) with no indication of the role of Al3+ ion concentration, except a report by Khresse et al.23 where they reported no effect on ferromagnetic behavior even after introduction of a large number of carriers in Co doped ZnO. It is worth mentioning here that the solubility limit of Al3+ in ZnO observed by other authors19–21 is around 3 at.%, much less than what is observed (<7 at.%) in the present study. This increased solubility of Al3+ may be due to the difference in synthesis conditions. In this manuscript, we present the effect of Al3+ co-doping on the magnetic properties of Co-doped ZnO nanoparticles both in a low as well as a high concentration regime. Nanoparticles of Zn0.95−xCo0.05AlxO (x = 0 to 0.10) were synthesized by a novel sol–gel route followed by pyrolysis. Zn0.95Co0.05O particles show diamagnetic behavior both at 300 K and 5 K. However, when Al is co-doped with Co, as in Zn0.95−xCo0.05AlxO, magnetization increases systematically from negligibly small values for x = 0–2 at.% to 1.84 emu g−1 (0.52 μB/Co) for x = 7 at.%. Above 7 at.% of Al doping, a drastic decrease in the magnetization is observed. Theoretical studies using density functional calculations in Zn(Al,Co)O indicate the partial occupancy of S2 states leading to an increased double exchange interaction and hence stabilizing the ferromagnetic ground states. The exchange splitting is reduced and hence suppresses the ferromagnetic ordering as the concentration of Al increases beyond 7 at.%.Results and discussion
Fig. 1 depicts the XRD patterns of Zn0.95−xCo0.05AlxO (x = 0.0 to 0.10) nanoparticles. All the samples show diffraction peaks corresponding to only the wurtzite structure of ZnO (space group: P63mc). In the Al and Co doped samples no evidence for impurity phases was discerned within the detection limit of X-ray diffraction. The unit cell parameters of all the prepared samples (Fig. 1 inset) indicate slightly lower values of a and c parameters compared to those of pure ZnO. The variation of unit cell parameters with Al substitution in cobalt doped ZnO is reflected only in a feeble decreasing trend in the a-axis compared to the c-axis. In order to deliberately see the effect of high temperature treatment, Zn0.88Co0.05Al0.07O composition was heated at 800 °C for 2 h in air. The XRD pattern of this sample showed additional weak peaks at 2θ = 31.33° and 36.85°, indicating segregation of the impurity phase. Comparing these peak positions to those reported for the CoAl2O4 and ZnAl2O4, these two peaks can be assigned to a spinel type Zn1−xCoxAl2O4 phase. This may be due to the disintegration of Zn0.95−xCo0.05AlxO into very fine Al2O3 particles and a cobalt rich spinel (Zn1−xCoxAl2O4) type (marked by * symbol in Fig. 1) impurity phase. Further conclusions of phase analyses were derived from the TEM studies. From TEM studies (discussed in the following paragraph) we find that for around 7 at.% of Al doping, excess aluminium oxide is separated out from the Zn0.88Co0.05Al0.07O particles (Fig. 2 and 3). Thus, it is concluded that the miscibility limit of Al in 5 at.% Co doped ZnO is < 7 at.%.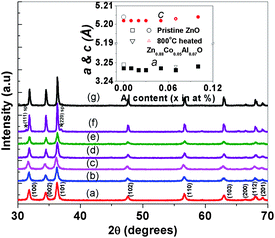 | ||
| Fig. 1 XRD patterns of (a) Zn0.94Co0.05Al0.01O, (b) Zn0.93Co0.05Al0.02O, (c) Zn0.92Co0.05Al0.03O, (d) Zn0.90Co0.05Al0.05O, (e) Zn0.88Co0.05Al0.07O, (f) Zn0.88Co0.05Al0.07O heated at 800 °C in air for 2 h and (g) Zn0.85Co0.05Al0.10O. All the samples are heat treated at 600 °C for 2 h except for (f) for which the sample is heated at 800 °C for 2 h in air after heating at 600 °C for 2 h. (* (sp-spinel phase) indicate segregated secondary Zn1−xCoxAl2O4 phase). Inset shows the variation of lattice parameter values on doping ZnO with Co 5 at.% and various concentrations of Al. | ||
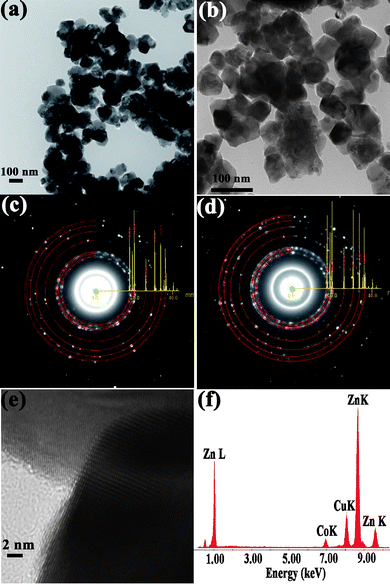 | ||
| Fig. 2 (a) and (b) show the bright field TEM images of ZnO and Zn0.95Co0.05O nanoparticles. (c) and (d) show the SAED patterns of ZnO and Zn0.95Co0.05O. The simulated ring patterns of ZnO with the intensity of peaks shown are overlapped on the experimental ring patterns. (e) shows the HRTEM image of Zn0.95Co0.05O. (f) shows the typical EDS pattern of Zn0.95Co0.05O. | ||
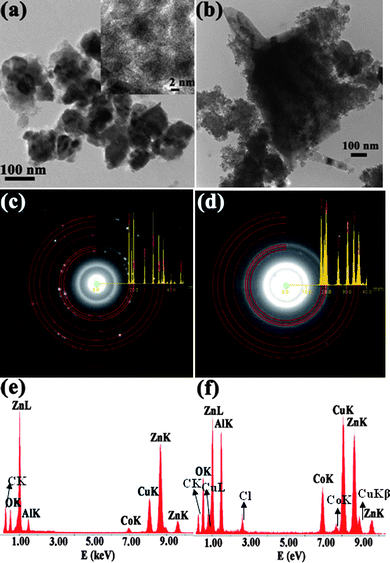 | ||
| Fig. 3 (a) and (b) show the bright field TEM images of 7 at.% and 10 at.% Al doped Zn0.95Co0.05O nanoparticles. (c) and (d) show the SAED patterns of 7 at.% and 10 at.% Al doped Zn0.95Co0.05O. (e) and (f) show EDS pattern of 7 at.% and 10 at.% Al doped Zn0.95Co0.05O. | ||
In order to investigate the Co and Al distribution in ZnO, detailed transmission electron microscopic studies including HRTEM, SAED and EDS analyses were performed on the Zn0.95−xCo0.05AlxO (x = 0 to 0.10) samples. Low magnification bright field images of pure and Co doped ZnO particles are shown in Fig. 2. Wurtzite type ZnO structures with predominant hexagonal facets (Fig. 2a and 2b) and sizes of about 50–100 nm are observed for both the samples. SAED ring patterns from these nanoparticles show polycrystalline nature of wurtzite type composition with no additional segregated secondary phases (Fig. 2c and 2d). The simulated ring patterns of ZnO with the diffraction intensity of peaks overlapped on the experimental ring patterns are shown. Fig. 2(e) shows the HRTEM image obtained from the typical nanometre sized particles shown in Fig. 2(b) for Co (5 at.%) doped ZnO. These lattice images clearly demonstrate single phase ZnO structure with no clusters or structural inclusions found within the lattice or on the surface of these particles. We have carried out HRTEM and EDS analyses using a focused electron probe on several of these particles over different regions. A typical EDS pattern from the particles in Fig. 2(e) is shown in Fig. 2(f). The pattern shows the presence of Zn, O, and Co with nominal concentration of Zn and Co equal to the initial precursor composition. The Cu and C peaks are due to the carbon coated Cu grid used for supporting the nanoparticles for TEM studies. Similar studies were carried out on Al doped Zn0.95Co0.05O samples for different Al concentrations. In general, the samples with Al concentration less than 7 at.% are homogeneous and monophasic and show similar characteristics of particles shown in Fig. 2. For higher concentration of Al (≥ 7 at.%), secondary phases were observed. We present the detailed TEM studies on 7 at.% and 10 at.% of Al doped in Zn0.95Co0.05O samples (Fig. 3). The bright field TEM images of 7 at.% and 10 at.% Al doped Zn0.95Co0.05O nanoparticles are shown in Fig. 3(a,b). For lower values of Al doping a uniform distribution of Al in Zn0.95−xCo0.05AlxO is discerned. The particles with composition of 7 at.% Al doped Zn0.95Co0.05O show similar faceted features with size in the range of 50–100 nm. However, these particles are covered with poorly crystalline nanoparticular phase segregations in the surface regions (Fig. 3(a) and inset). These regions show Al rich composition. The ZnO particles still have a significant fraction of Al doping. The EDS spectrum from one of the large ZnO particles is shown in Fig. 3(e). For 10 at.% Al doped Zn0.95Co0.05O samples, the particle size is significantly larger (>300 nm). In addition to these large sized particles, nanoparticles with sizes ∼ 5 to 10 nm were seen clustered around these particles. SAED and EDS analyses from these two micro-structurally different regions show that there are two types of compositional regions—one region with 5–10 nm sized particles which are Al and Co rich in composition and the other with Zn-rich, Al and Co containing large particles (Fig. 3(d) and (f)). It is worth noting that the bigger particles have much smaller concentrations of Al and Co than the initial nominal composition in the precursor solution. This clearly shows that ≥ 7 at.% of Al doping in Zn0.95Co0.05O, Al rich secondary phase is segregated into a separate phase in the form of 5–10 nm nanosized aggregates. Further, these regions retain higher Co than the concentration of Co found in bigger particles.
In order to characterize and investigate the presence of any other phase or structural distortion in these compounds, Raman spectra of pristine and doped nano ZnO were recorded. Fig. 4 shows the Raman spectra of pristine as well as Co and Al-doped ZnO. Raman spectrum of the ZnO nanoparticles in the present work agrees well with that reported in the literature.24 The sharp E2high mode at 438 cm−1 (FWHM ∼ 8cm−1) in pristine nano ZnO indicates good crystallinity of the compound. The Raman bands at 381 and 579 cm−1 correspond to A1(TO) and A1(LO) vibrational modes, respectively. In addition to these first-order vibrational modes, the peaks at 332 and 1145 cm−1 are attributed to the multiphonon process in ZnO.
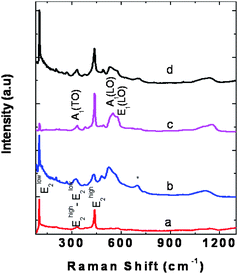 | ||
| Fig. 4 Raman spectra of (a) pristine nano ZnO, (b) Zn0.88Co0.05Al0.07O, (c) Zn0.88Co0.05Al0.07O heated at 800 °C, and (d) Zn0.85Co0.05Al0.10O. * indicates the disorder activated impurity mode around 695 cm−1. | ||
Enhancement of A1(LO) mode intensity is observed in Raman spectra of Al doped Zn0.95Co0.05O (Fig. 4b) which is commonly observed in doped ZnO.25 In addition, the peaks due to multiphonon processes appear with higher intensity in doped ZnO due to disorder. As the Al doping concentration increases, the peak position of the E2high mode shifts to lower frequency accompanied by an increase in width. For the 7 at.% Al doped Zn0.95Co0.05O, the E2high mode appears at 431 cm−1 with a FWHM ∼ 21 cm−1. Such a shift has been earlier attributed to distortion in ZnO lattice.26 The broad mode around 695 cm−1 is the disordered local vibrational mode27 of –Co–O–Zn– in Zn0.95Co0.05O. For the 7 at.% Al doped Zn0.95Co0.05O, heated at 800 °C, the E2high mode at 438 cm−1 resembles that of pristine nano ZnO with a FWHM of 8 cm−1. The disorder activated impurity mode is absent in this case. This could be due to phase separation into Co-rich and poor phases of ZnO. For higher Al composition (10 at.%), E2high mode frequency and FWHM are 436 and 13 cm−1, respectively. This, along with the presence of the mode around 695 cm−1, indicates disorder due to doping.
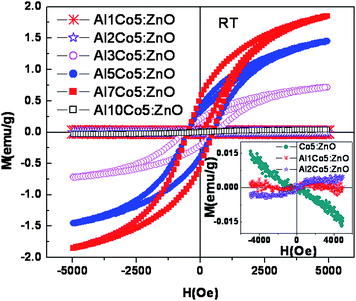
One of the motivations of this investigation is to understand the doping effect of Al on the magnetic properties of Zn0.95Co0.05O both at lower and higher levels of Al concentration. Most of the studies of ferromagnetism in Al and Co co-doped ZnO were in the lower Al concentration range (0.05 to 3%). Fig. 5 shows the M-H loops for Zn0.95−xCo0.05AlxO (x = 0 to 0.10) samples, measured at 300 K. The change in the magnetization value (also μB/Co) with the increase in Al concentration is shown in Fig. 6. The change in the magnetization is insignificant for up to 2 at.% of Al doping, although the M-H loop changes from a diamagnetic trace for Zn0.95Co0.05O to a ferromagnetic S shaped trace for 2 at.% Al doped Zn0.95Co0.05O (Zn0.93Co0.05Al0.02O). The magnetization of the 2 at.% Al doped Zn0.95Co0.05O is around 0.003 emu/g with no significant hysteresis. From 2 to 7 at.% of Al doping in Zn0.95Co0.05O, a systematic increase in the magnetization from 0.003 emu/g for 2 at.% to 1.84 emu/g for 7 at.% of Al doping is seen (Fig. 6). It should be noted that the samples with significantly large magnetization with well defined M-H curve also have coercivity around 500 Oe. This clearly shows that the ferromagnetism is not due to any superparamagnetic clusters or nanoparticles. For Al co-doping above 7 at.% (for e.g. Zn0.85Co0.05Al0.10O), a sudden decrease in the magnetization to almost zero was observed. The observation of magnetization decrease is consistent with the considerable phase segregation inferred from the TEM studies. It has been observed that the 7 at.% doped Zn0.95Co0.05O sample annealed at 600 °C shows a ferromagnetic hysteresis loop, while it disappears if annealed at 800 °C. Thus, the ferromagnetic behavior is not due to segregated spinel type Zn1−xCoxAl2O4 phase as identified from XRD analysis. The solubility limit of Al in Zn0.95Co0.05O is of about 3 at.% and, beyond that, segregation of Al2O3 phase has been reported earlier.19–22 Comparison of magnetic behavior of the presently studied 3, 5 and 7 at.% samples with that reported earlier for the 3 at.% Al doped Zn0.95Co0.5O sample19,22 phase suggests a common origin of ferromagnetism. A systematic increase in saturation magnetization in M-H curves up to 7 at.% Al doped sample thus can not be attributed to the spinel type segregated phase. Hence the magnetic behavior of the sample is assigned to the increasing amount of Al dissolved in the Zn0.95Co0.05O sample. Thus we believe that at low concentration (<2 at.%) of Al doping, the carriers introduced are not sufficient to mediate strong ferromagnetism at 300 K. Above 2 at.% of Al doping, significant increase in the carrier concentration increases the magnetization. However, above 7 at.% of Al doping, the sudden drop in the magnetization indicates that a significant fraction of Al are phase segregated into nanoparticles and do not contribute additional charge carriers leading to a decreasing trend in the magnetization behavior of Zn0.95Co0.05O. In addition, most of the cobalt is retained by this Al rich spinel (Zn1−xCoxAl2O4) secondary phase. This phase separation of Al and Co rich oxide phase is clearly discerned from the TEM studies (Fig. 3). Fig. 7 shows the representative field dependence of magnetization measured at 5 K and 250 K for Zn0.88Co0.05Al0.07O. Fig. 7 inset shows the magnetization as a function of temperature measured at an applied field of 200 Oe, in field cooled (FC) and zero field cooled (ZFC) conditions for the same Zn0.88Co0.05Al0.07O representative sample. From this figure it is clear that the Tc of this sample is well above room temperature. The magnetic moment observed for Zn0.88Co0.05Al0.07O sample is around 0.52 μB/Co, at room temperature.
 | ||
| Fig. 5 The M vs. H curves of Zn0.95−xCo0.05AlxO (x = 0 to 10 at.%) measured at room temperature. | ||
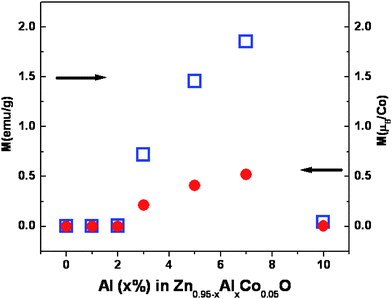 | ||
| Fig. 6 Variation of saturation magnetization values (left scale emu/g and right μB/Co) as a function of Al doping in Zn0.95Co0.05O. | ||
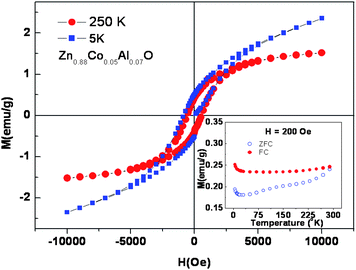 | ||
| Fig. 7 The M vs. H curve of Zn0.88Co0.05Al0.07O measured at 5 K and 250 K. Inset shows the field cooled and zero field cooled M vs. T curves of the same sample measured at an applied field of 200 Oe. | ||
We have also performed first principles calculations to investigate the magnetic properties of cobalt doped and cobalt and aluminium co-doped ZnO nanoparticles. The calculations are carried out with the density functional theory code VASP28 using generalized gradient approximation (GGA) of PW91.29 The projected augmented wave potentials29 are used to describe the electron-ion interaction. The energy cutoff for planewave expansion is 400 eV and the Brillouin zone integration is carried out at the gamma point. A cluster Zn35−x−yCoxAlyO35H62 (Fig. 8) is employed to simulate ZnO nanoparticle, in which a certain number of Zn atoms are replaced by Co or Al atoms according to the experimental conditions. In all the cases, we have studied configurations with larger cobalt–cobalt separations (far configuration) as well as with closely placed cobalt atoms (close configuration). For both far and close configurations, we calculate the energy and the magnetic moment of the systems which are initially ferromagnetically (FM) ordered and antiferromagnetically (AFM) ordered, respectively, and obtain the energy difference ΔE = EFM − EAFM and the final total magnetic moment mF and mAF. It may be noted that the subscripts FM and AFM only denote the initial assumed magnetic order. The final magnetic order obtained after electronic and ionic relaxations represent the actual low energy stable state of the system. For instance, a system initially in AFM order may finally turn out to be ferrimagnetic or ferromagnetic (mAF ≠ 0) after relaxations, which means that the AFM order can not be stabilized.
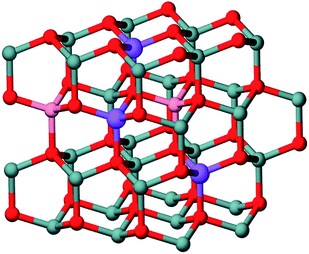 | ||
| Fig. 8 The cluster model of (Zn,Co,Al)O. Gray: Zn, red: O, pink: Co, violet(or blue): Al. | ||
In the experiments, the concentration of cobalt atom in ZnO is fixed at 5 at.%. In the cluster Zn35−x−yCoxAlyO35H62, x is set to 2. This represents the cobalt concentration of 5.7 at.% in ZnO which is close to the experimental condition. The values of y have been taken to be 0, 1, 3, and 4, corresponding to 0, 2.9, 8.6 and 11.4% Al doping, respectively, which reasonably approximate the experimental concentrations 0, 3, 7 and 10%, respectively. Typically, the Co–Co distances in far and close configurations are 6.0 Å and 3.0 Å, respectively. The Al atoms are located between and around the Co atoms with reasonable Co–Al distances from 3.2 Å to 4.6 Å. In all calculations, all the atoms, including the atoms at or near the surfaces are relaxed. Especially, in the far configuration, the Co atoms are quite close to the surface. Therefore, the surface effect has been considered consistently in the calculations. The calculation results are summarized in Table 1.
| Co(%) | Al(%) | Far configuration | Close configuration | ||||
|---|---|---|---|---|---|---|---|
| ΔE/meV | m F(μB) | m AF(μB) | ΔE/meV | m F(μB) | m AF(μB) | ||
| 5.7 (5) | 0 (0) | 0.60 | 3.00 | 0.00 | 27.13 | 3.00 | 0.00 |
| 5.7 (5) | 2.9 (3) | 0.40 | 2.67 | 0.18 | −4.78 | 2.85 | 0.18 |
| 5.7 (5) | 8.6 (7) | −10.37 | 2.50 | 0.25 | 0.00 | 2.50 | 2.50 |
| 5.7 (5) | 11.4 (10) | 2.00 | 1.6 | 0.00 | −587 | 1.95 | 0.40 |
In Table 1, it can be seen that (Zn,Co)O is AFM because in both the far and close configurations the AFM order is more favorable than the FM order. In Co and Al co-doping, the magnetic order is dependent of the concentration of Al (cAl). When cAl takes a low value close to 3 at.%, the high spin state cannot be stabilized, as in the far configuration the low spin state is more favorable and in the close configuration the low and high spin states are energetically close. Therefore doping Al atoms at the level of 3 at.% can induce weak magnetization or ferrimagnetism. This is in agreement with experiments where we observed a magnetization around this Al doping level. As cAl is increased to near 7 at.%, the high spin state is more stable in the far configuration and the low spin state or AFM state cannot be stabilized in the close configuration. This is in accordance with the experimental findings that the magnetization reaches the highest value when the doping level of Al is around 7 at.%. As observed in the experiments, further increase of Al doping, however, will suppress the magnetization. When cAl is around 10 at.%, the AFM state becomes more favorable than the FM state in the far configuration. FM state is more favorable in the close configuration, indicating that when Co atoms are clustered to be close to each other the system can be FM. If the Co atoms are evenly or randomly distributed in the nanoparticles, the FM state can not be achieved.
The densities of states (DOS) projected on the d-states of the two Co ions in the far configurations of FM (Zn,Co,Al)O are shown in Fig. 9, which have sharp peaks within the energy gap of ZnO. It can be seen that doping Co atoms only results in a Fermi level in the small energy gap and there is no partially occupied d-states. According to the band coupling model30 and the double exchange mechanism,16 the system is antiferromagnetic since there is no itinerant carrier in the system. Al atoms, with electronic configuration of 3s2p1, are electron donors when substituting Zn atoms in ZnO. Therefore, after co-doping of Al atoms, the formerly unoccupied d-states become partially occupied. Simultaneously, the exchange splitting becomes smaller with the increase of the doping level of Al atoms (Fig. 9). At low doping level of Al (about 3 at.%), the number of carriers is small and only the low-spin FM state is stabilized. When the concentration of Al atoms is increased to about 7 at.%, the carrier number is large enough to stabilize the high-spin state of the FM state. Further, when the doping level of Al atoms is increased to about 10 at.%, the exchange splitting is significantly reduced (Fig. 9). Based on the band coupling model,30 when the d-states are above the valence band maximum, the decrease of exchange splitting would increase the super exchange interaction and stabilize the AFM state. Therefore the AFM state at high doping level of Al is due to the decrease of the exchange splitting.
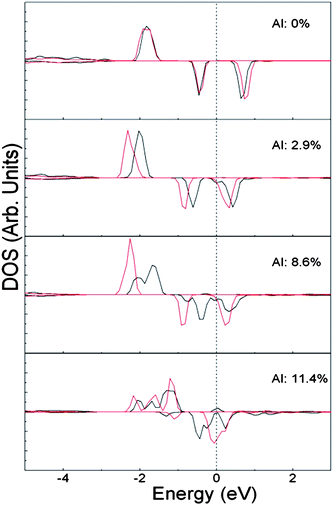 | ||
| Fig. 9 The solid black and red lines denote the densities of states projected on the d-states of the two Co ions in the far configurations of FM (Zn,Co,Al)O. The doping level of Al atom is shown in each panel of the figure. The dashed line indicates the Fermi level. | ||
Experimental section
In order to systematically study the effect of Al in Co doped ZnO, we performed Al doping up to 10 at.% in 5 at.% Co doped ZnO. These nanoparticles were synthesized by the pyrolysis of the gels obtained from acetate derived precursors. Zn(CH3COO)2·2H2O (99.99%, Aldrich), Co(CH3COO)2·4H2O (99.99%, Aldrich) and anhydrous AlCl3 (99.99%, Aldrich) were used as starting materials. In a typical synthesis procedure of ZnO nanoparticles, Zn(CH3COO)2·2H2O was dissolved in a mixture of 2-propoxyethanol and monoethanolamine (MEA) in a 1![[thin space (1/6-em)]](https://www.rsc.org/images/entities/char_2009.gif) :1 molar ratio. The resulting solution was heated at 60 °C while stirring for 1 h, and dried at 150 °C. The dried product was heated at 300 °C for 1 h to remove organic residuals and annealed at 600 °C for 1 h to obtain the desired ZnO nanoparticles. A similar procedure was followed to synthesize Co and (Co, Al) doped ZnO nanoparticles.
:1 molar ratio. The resulting solution was heated at 60 °C while stirring for 1 h, and dried at 150 °C. The dried product was heated at 300 °C for 1 h to remove organic residuals and annealed at 600 °C for 1 h to obtain the desired ZnO nanoparticles. A similar procedure was followed to synthesize Co and (Co, Al) doped ZnO nanoparticles.
Characterization
Phase purity and the structure of the fine powder obtained were analyzed by powder X-ray diffraction using Cu Kα radiation with a Philips Diffractometer (model PW 1710) fitted with graphite crystal monochromator and a high resolution transmission electron microscope (HRTEM) (JEOL 2010 FasTEM, accelerated at 200 kV) equipped with an energy dispersive X-ray (EDS) spectrometer of 0.1 keV resolution. DC magnetization measurements as a function of field and temperature were carried out using an EG&G PAR vibrating sample magnetometer (model 4500) and Quantum Design superconducting quantum interference device magnetometer (model MPMS), respectively. First principles calculations are carried out with the density functional theory code VASP28 using generalized gradient approximation (GGA) of PW91.29 The projected augmented wave potentials28 are used to describe the electron–ion interaction. The energy cutoff for planewave expansion is 400 eV and the Brillouin zone integration is carried out at the gamma point.Conclusion
From the forgoing it can be concluded that nanoparticles of Zn0.95−xCo0.05AlxO (x = 0.0 to 10 at.%) could be synthesized by a novel sol–gel route followed by pyrolysis and the magnetic properties are investigated. The Zn0.95Co0.05O nanoparticles show diamagnetic behavior at room temperature. When Al is co-doped with Co with x = 0 to 0.10 in Zn0.95−xCo0.05AlxO, a systematic increase in ferromagnetic behavior has been observed up to x = 0.07 at 300 K. Above x = 0.07 (e.g. for x = 0.10) a drastic decrease in the ferromagnetism is observed. Theoretical studies using density functional calculations in Zn0.95−xCo0.05AlxO concludes that the partial occupancy of S2 states leads to an increased double exchange interaction favoring the ferromagnetic ground states. At a higher doping level of Al, the exchange splitting is reduced and hence suppresses the ferromagnetic ordering.References
- W. Prellier, A. Fouchet and B. Mercey, J. Phys.: Condens. Matter, 2003, 15, R1583 CrossRef CAS.
- T. Fukumura, H. Toyosaki and Y. Yamada, Semicond. Sci. Technol., 2005, 20, S103 CrossRef CAS.
- S. J. Pearton, C. R. Abernathy, M. E. Overberg, G. T. Thaler, D. P. Norten, N. Theodoropoulou, A. F. Hebard, F. Ren, J. Kim and L. A. Boatner, J. Appl. Phys., 2003, 93, 1 CrossRef CAS.
- K. Ueda, H. Tabata and T. Kawai, Appl. Phys. Lett., 2001, 79, 988 CrossRef CAS.
- H.-J. Lee, S.-Y. Jeong, C. R. Cho and C. H. Park, Appl. Phys. Lett., 2002, 81, 4020 CrossRef CAS.
- M. Venkatesan, C. B. Fitzgerald, J. G. Lunney and J. M. D. Coey, Phys. Rev. Lett., 2004, 93, 177206 CrossRef CAS.
- S. Ramachandran, A. Tiwari and J. Narayan, Appl. Phys. Lett., 2004, 84, 5255 CrossRef CAS.
- D. A. Schwartz, N. S. Norberg, Q. P. Nguyen, J. M. Parker and D. R. Gamelin, J. Am. Chem. Soc., 2003, 125, 13205 CrossRef CAS.
- A. S. Risbud, N. A. Spaldin, Z. Q. Chen, S. Stemmer and R. Seshadri, Phys. Rev. B: Condens. Matter Mater. Phys., 2003, 68, 205202 CrossRef.
- S.-J. Han, B. Y. Lee, J.-S. Ku, Y. B. Kim and Y. H. Jeong, J. Magn. Magn. Mater, 2004, 272, 73.
- S. C. Wi, J. S. Kang, J. H. Kim, S. B. Cho, B. J. Kim, S. Yoon, B. J. Suh, S. W. Han, K. H. Kim, K. J. Kim, B. S. Kim, H. J. Song, H. J. Shin, J. H. Shim and B. I. Min, Appl. Phys. Lett., 2004, 84, 4233 CrossRef CAS.
- M. Bouloudenine, N. Viart, S. Colis and A. Dinia, Chem. Phys. Lett., 2004, 397, 73 CrossRef CAS.
- G. Lawes, A. S. Risbud, A. P. Ramirez and R. Seshadri, Phys. Rev. B: Condens. Matter Mater. Phys., 2005, 71, 045201 CrossRef.
- C. N. R. Rao and F. L. Deepak, J. Mater. Chem., 2005, 15, 573 RSC.
- S. Deka, R. Pasricha and P. A. Joy, Chem. Mater., 2004, 16, 1168 CrossRef CAS.
- K. Sato and H. Katayama-Yoshida, Semicond. Sci. Technol., 2002, 17, 367 CrossRef CAS.
- D. A. Schwartz and D. R. Gamelin, Adv. Mater., 2004, 16, 2115 CrossRef CAS.
- M. H. F. Sluiter, Y. Kawazoe, P. Sharma, A. Inoue, A. R. Raju, C. Rout and U. V. Waghmare, Phys. Rev. Lett., 2005, 94, 187204 CrossRef.
- X. C. Liu, E. W. Shi, Z. Z. Chen, H. W. Zhang, B. Xiao and L. X. Song, Appl. Phys. Lett., 2006, 88, 252503 CrossRef.
- T. Zhang, L.-X. Song, Z.-Z. Chen, E.-W. Shi, L.-X. Chao and H.-W. Zhang, Appl. Phys. Lett., 2006, 89, 172502 CrossRef.
- Y. He, P. Sharma, K. Biswas, E.-Z. Liu, N. Ohtu, A. Inoue, M. Y.InadaNomura, J. S. Tse, S. Yin and J. Z. Jiang, Phys. Rev. B: Condens. Matter Mater. Phys., 2008, 78, 155202 CrossRef.
- L. Liao, H. B. Lu, L. Zhang, M. Shuai, J. C. Li, C. Liu, D. J. Fu and F. Ren, J. Appl. Phys., 2007, 102, 114307 CrossRef.
- G. Kresse and J. Hafner, Phys. Rev. B: Condens. Matter, 1993, 47, 558 CrossRef CAS; G. Kresse and J. Furthmüller, Phys. Rev. B: Condens. Matter, 1996, 54, 11169 CrossRef CAS; G. Kresse and J. Furthmüller, Comput. Mater. Sci., 1996, 6, 15 CrossRef CAS.
- M. Rajalakshmi and A. K. Arora, J. Appl. Phys., 2000, 87, 2445 CrossRef CAS.
- C. L. Du, Z. B. Gu, M. H. Lu, J. Wang, S. T. Zhang, J. Zhao, G. X. Cheng, H. Heng and Y. F. Chen, J. Appl. Phys., 2006, 99, 123515 CrossRef.
- S. Lo, D. Huang, C. Tu, C. Hou and C. Chen, J. Phys. D: Appl. Phys., 2009, 42, 095420 CrossRef.
- C. Sudakar, P. Khare, G. Lawes, R. Suryanarayanan, R. Naik and V. M. Naik, J. Phys.: Condens. Matter, 2007, 19, 026212 CrossRef.
- J. P. Perdew, in Electronic Structure of Solids' 91, ed. P. Ziesche and H. Eschrig, Akademie Verlag, Berlin, 1991, p. 11 Search PubMed.
- G. Kresse and D. Joubert, Phys. Rev. B: Condens. Matter Mater. Phys., 1999, 59, 1758 CrossRef CAS.
- G. M. Dalpian, S.-H. Wei, X. G. Gong, Antonio J. R. da Silva and A. Fazzio, Solid State Commun., 2006, 138, 353 CrossRef CAS.
| This journal is © The Royal Society of Chemistry 2010 |