Magnetic and upconverted luminescent properties of multifunctional lanthanide doped cubic KGdF4 nanocrystals
L. W.
Yang
*ab,
Y. Y.
Zhang
a,
J. J.
Li
a,
Y.
Li
a,
J. X.
Zhong
a and
Paul K.
Chu
*b
aInstitute for Quantum Engineering and Micro-Nano Energy Technology and Faculty of Materials and Optoelectronic Physics, Xiangtan University, Hunan, 411105, China. E-mail: ylwxtu@xtu.edu.cn; paul.chu@cityu.edu.hk
bDepartment of Physics and Materials Science, City University of Hong Kong, Tat Chee Avenue, Kowloon, Hong Kong, China
First published on 28th September 2010
Abstract
Lanthanide (Ln3+) doped KGdF4 (Ln = Yb3+, Er3+, Ho3+, Tm3+) nanocrystals with a mean diameter of approximately 12 nm were synthesized by a hydrothermal method using oleic acid as a stabilizing agent at 180 °C. The nanocrystals crystallize in the cubic phase as α-NaGdF4. When excited by a 980 nm laser, these Ln3+ doped nanocrystals exhibit multicolor up-conversion (UC) emissions in red, yellow, blue and white. The calculated color coordinates demonstrate that white UC emission (CIE-X = 0.352, CIE-Y = 0.347) can be obtained by varying the dopant concentrations in the Yb3+/Ho3+/Tm3+ triply-doped nanocrystals to yield different RGB emission intensities. The measured field dependence of magnetization (M-H curves) of the KGdF4 nanocrystals shows their paramagnetic characteristics that can be ascribed to the non-interacting localized nature of the magnetic moment of Gd3+ ions. Moreover, low temperature thermal treatment can enhance UC properties, magnetization and magnetic mass susceptibility of Ln3+ doped KGdF4 nanocrystals. The multifunctional Ln3+ doped KGdF4 nanocrystals have potential applications in color displays, bioseparation, and optical–magnetic dual modal nanoprobes in biomedical imaging.
1. Introduction
Interests in lanthanide (Ln3+) doped nanocrystals with up-conversion (UC) emission under the excitation of an infrared laser are increasing due to its potential applications in solid-state lasers,1 multi-color three-dimensional displays,2 optical processing sensors3 and solar cells.4 In particular, UC nanocrystals are envisioned to be the most appropriate candidate for biological fluorescent labels and hybrid magnetic–optical bimodal nanoprobes in biomedicine imaging due to advantages such as the deep penetration depth of infrared excitation, excellent photo-stability and absence of autofluorescence in contrast to traditional fluorescent dyes and semiconductor quantum dots.5–7 The UC processes involving Ln3+ have heretofore been observed from different matrices such as oxides,8 phosphates,9 vanadates,10 sulfides11 and fluorides.12–20 Among them, fluorides have been extensively investigated due to the strong visible UC emission. By controlling the nanocrystal size, dopant–host combination, and dopant concentration, multicolor UC emissions spanning infrared to deep ultraviolet including white light have been observed from fluoride nanocrystals.15–22 However, studies on the corresponding dispersible nanocrystals have mostly been restricted to AReF4 (A = sodium, Re = Ln3+) fluoride compounds and there have been few investigations on other important fluorides such as CaF2, nMF–mGdF3 (M = Li, K, and Cs), and xAF2–yGdF3 (A being a group-II element). Very recently, Wang et al. reported that monodispersed CaF2![[thin space (1/6-em)]](https://www.rsc.org/images/entities/char_2009.gif) :
:![[thin space (1/6-em)]](https://www.rsc.org/images/entities/char_2009.gif) Yb3+/Er3+ nanocrystals showed more efficient UC emission than NaYF4 when the size of the nanocrystals was less than 10 nm.23 Hence, there may be other fluoride nanocrystals with even better properties.
Yb3+/Er3+ nanocrystals showed more efficient UC emission than NaYF4 when the size of the nanocrystals was less than 10 nm.23 Hence, there may be other fluoride nanocrystals with even better properties.
The Ln3+ doped nKF–mGdF3 system is interesting due to both its structural and optical properties. Firstly, it constitutes a good host matrix for luminescent Ln3+. Visible quantum-cuttings based on down-conversion under the excitation of vacuum ultraviolet radiation in KGdF4![[thin space (1/6-em)]](https://www.rsc.org/images/entities/char_2009.gif) :
:![[thin space (1/6-em)]](https://www.rsc.org/images/entities/char_2009.gif) Eu3+, K2GdF5
Eu3+, K2GdF5![[thin space (1/6-em)]](https://www.rsc.org/images/entities/char_2009.gif) :
:![[thin space (1/6-em)]](https://www.rsc.org/images/entities/char_2009.gif) Tb3+ and KGd3F10
Tb3+ and KGd3F10![[thin space (1/6-em)]](https://www.rsc.org/images/entities/char_2009.gif) :
:![[thin space (1/6-em)]](https://www.rsc.org/images/entities/char_2009.gif) Eu3+ have been reported.24–26 Secondly, Gd3+ is an ideal paramagnetic relaxation agent used in magnetic resonance imaging because of its large magnetic moment and nanosecond time scale electronic relaxation time.6,7 This makes the nKF–mGdF3 system a very attractive choice to dope with different Ln3+ ions to produce single-phase multi-functional nanocrystals (i.e., paramagnetism and multicolor up- or down-emission). Despite previous research on the Ln3+ doped nKF–mGdF3 system, there have been few studies on the corresponding nanocrystals.27,28 In this paper, we report the realization of Ln3+ co-doped cubic KGdF4 nanocrystals with intrinsic paramagnetism and multicolor UC emissions.
Eu3+ have been reported.24–26 Secondly, Gd3+ is an ideal paramagnetic relaxation agent used in magnetic resonance imaging because of its large magnetic moment and nanosecond time scale electronic relaxation time.6,7 This makes the nKF–mGdF3 system a very attractive choice to dope with different Ln3+ ions to produce single-phase multi-functional nanocrystals (i.e., paramagnetism and multicolor up- or down-emission). Despite previous research on the Ln3+ doped nKF–mGdF3 system, there have been few studies on the corresponding nanocrystals.27,28 In this paper, we report the realization of Ln3+ co-doped cubic KGdF4 nanocrystals with intrinsic paramagnetism and multicolor UC emissions.
2. Experimental details
Colloidal KGdF4 nanocrystals with different Ln3+ concentrations were synthesized by a hydrothermal method at 180 °C for 20 h using oleic acid as a stabilizing agent under basic conditions. The detailed experimental processes can be found elsewhere.18 Succinctly speaking, 0.982 g (17.5 mmol) of KOH, 7.1 g (22.6 mmol) of oleic acid (90 wt%), and 12.67 ml of ethanol were mixed to get a semitransparent solution at room temperature. Then, 6 ml (6 mmol) of a 1M KF solution was added under vigorous stirring until a translucent solution was obtained. Subsequently, 2.24 ml (1.12 mmol) of 0.5M of Gd(NO3)3 with a pre-determined Ln3+ doping content was poured into the above solution under vigorous stirring. Before transferring to a Teflon-lined autoclave with an internal volume of 25 mL, the solution was aged for 20 min at room temperature. The hydrothermal reactions were conducted in an oven at 180 °C for 20 h. After the reactions, the white products were harvested by centrifugation, thorough washing with ethanol and deionized water sequentially three or four times and then drying at 60 °C for 48 h.The crystal structures of the synthesized samples were determined by X-ray diffraction using a copper Kα radiation source. The morphology and microstructure were characterized by transmission electron microscopy (JEOL 2100) equipped with selected area electron diffraction (SAED). Differential scanning calorimetric (DSC) and thermogravimetric analyses were conducted on the thermal analysis systems DSC-7 and TGA Q50. The UC spectra were recorded on a spectrophotometer (R-500) under excitation by a 980 nm laser diode (LD) after the powders were compressed into smooth pellets. To eliminate the influence from adsorbates such as carboxyl, H2O, and OH−, the samples were heated to 400 °C in air for 2 h before optical measurements. The fluorescence spot excited by the parallel laser beam on the sample had a diameter of about 0.4 cm and the measurements were performed at room temperature. Magnetization as a function of applied magnetic field was measured using a Lakeshore vibrating sample magnetometer at room temperature (RM) and 79 K.
3. Results and discussion
Fig. 1 shows the XRD patterns of the as prepared Ln3+ co-doped nanocrystals after annealing at different temperatures. Compared to the standard PDF data, the XRD results are not in accordance with that of orthorhombic KYF4 (JCPDS NO.33-1007) or the diffraction data of cubic KYb3F10 (JCPDS NO.74-2204). Instead, they are similar to those of cubic NaGdF4 (a = 5.52 Å, space group Fm3m, JCPDS NO.27-0697). Indexing the diffraction profile indicates a cubic unit cell with a = 5.73 Å. Based on this value, we simulated the diffraction peaks based on the crystallographic data of cubic NaGdF4 (α-NaGdF4, space group Fm-3m, Na+ replaced by K+, and a = 5.52 Å replaced by a = 5.73 Å) by employing the MDI JADE 5.0 software. The positions of calculated diffraction peaks (red triangle in Fig. 1) are consistent with the experimental results. It can thus be inferred that our nanocrystalline samples crystallize in the fluoride structure known for α-NaGdF4 and the enlarged cell constant results from the larger ionic radius of K+. In addition, according to the XRD results, one can infer that the size of the nanocrystals only increases slowly during thermal treatment at 300 and 400 °C since no obvious decrease in the full-width at half-maximum (FWHM) can be observed from the XRD peaks.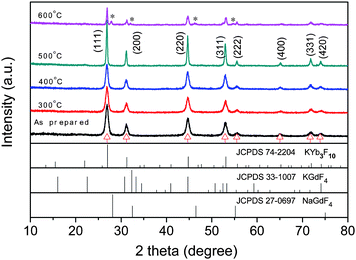 | ||
| Fig. 1 XRD patterns of the Ln3+ co-doped KGdF4 nanocrystals annealing at different temperature. The diffraction peaks labeled by red triangles are those from the calculation via MDI JADE 5.0 software based on the crystallographic data of cubic NaGdF4 (space group Fm-3m, Na+ replaced by K+, a = 5.52 Å replaced by a = 5.73 Å). The impurity peaks at 27.8 °C, 31.9 °C, 46.2 °C and 54.7 °C in the sample annealing at 600 °C can be indexed to (111), (200), (202), (311) lattice planes of tetragonal GdOF (JCPDS NO. 26-0658), respectively. | ||
Fig. 2(a) depicts the typical TEM image of the synthesized Ln3+ doped KGdF4 nanocrystals revealing that the nanocrystals are nearly spherical in shape. The average size of the nanocrystals is determined to be 11.6 nm from the statistical histogram (see the inset) which also shows the narrow size distribution and that the size of the majority of the nanocrystals is 7–15 nm. Fig. 2(c) displays the typical high resolution TEM image of the nanocrystals. The lattice arrangement in the nanocrystals is clearly visible suggesting a highly crystalline nature. The distance between the fringes (d-spacing) is ∼2.73 Å, which corresponds to the distance of the (200) plane of the standard cubic KGdF4 and is consistent with the SAED data [inset in Fig. 2(b)]. Further energy-dispersive X-ray analysis (EDS) confirms that the major constituents are K, Gd, F, and Yb.
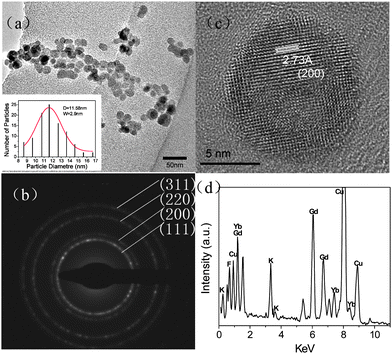 | ||
| Fig. 2 (a) TEM images and (b) the SEAD pattern acquired from as-synthesized Ln3+ co-doped KGdF4 nanocrystals. The inset in (a) shows the statistical histogram of the nanocrystal size distribution. (c) HRTEM image of a single nanocrystal. (d) EDS spectrum of the Ln3+ co-doped KGdF4 nanocrystals. | ||
When excited by a 980 nm LD, the Yb3+/Er3+, Yb3+/Ho3+ and Yb3+/Tm3+ co-doped KGdF4 nanocrystals exhibit eye-visible red, yellowish-green, and blue luminescence, respectively (see the inset fluorescence photographs in Fig. 3). Fig. 3(a), (b), and (c) depict the corresponding UC emission spectra from Yb3+/Er3+ (10![[thin space (1/6-em)]](https://www.rsc.org/images/entities/char_2009.gif) :
:![[thin space (1/6-em)]](https://www.rsc.org/images/entities/char_2009.gif) 0.5 mol%), Yb3+/Ho3+ (10
0.5 mol%), Yb3+/Ho3+ (10![[thin space (1/6-em)]](https://www.rsc.org/images/entities/char_2009.gif) :
:![[thin space (1/6-em)]](https://www.rsc.org/images/entities/char_2009.gif) 0.5 mol%), Yb3+/Tm3+(20
0.5 mol%), Yb3+/Tm3+(20![[thin space (1/6-em)]](https://www.rsc.org/images/entities/char_2009.gif) :
:![[thin space (1/6-em)]](https://www.rsc.org/images/entities/char_2009.gif) 0.5 mol%) co-doped KGdF4 nanocrystals. In panel (a), the strong green emission bands centered at 546 nm and 523 nm and red UC band at 660nm can be attributed to the 2H11/2/4S3/2 → 4I15/2 and 4F9/2 → 4I15/2 transitions of Er3+, respectively, as shown in Fig. 4. In panel (b), the strong green and red UC emission bands centered at 650 nm and 540 nm can be assigned to the 5F5 → 5I8 and 4S2/5F4 → 5I8 transitions of Ho3+, respectively. In panel (c), the blue emission bands at 450 and 475 nm correspond to the 1D2→3F4 and the 1G4→3H6 transitions. The red emission bands at 647 arises from the 1G4→3F4 transition and the intense near-infrared emission at 803 nm stems from the 3H4→3H6 transitions of Tm3+ ions. To clarify the mechanism, the power dependent UC behavior is investigated. Fig. 3(d), (e), and (f) show the double-logarithmic plots of the UC emission intensity (IUP) versus infrared pump-power (IIR) for the Yb3+/Er3+, Yb3+/Ho3+ and Yb3+/Tm3+ co-doped KGdF4 nanocrystals, respectively. The slopes of the linear fits of log(IUP) versus log(IIR) are 2.23, 2.22 and 1.79 for the green and red bands at 523, 546 and 660 nm from the Yb3+/Er3+ co-doped sample, 2.2 and 2.18 for the green and red bands at 540 and 650 nm from the Yb3+/Ho3+ co-doped sample, and 2.51 and 1.74 for the blue and infrared bands at 475 and 803 nm from the Yb3+/Tm3+ codoped sample, respectively. The results reveal that two pump photons from the excited Yb3+ ions via successive energy transfer (ET) are necessary to produce the red and green bands from these co-doped samples, whereas three pump photons are needed to emit the blue bands. They are consistent with previous results obtained from NaYF4, Y2O3 and BaYF5 nanocrystals.29–32
0.5 mol%) co-doped KGdF4 nanocrystals. In panel (a), the strong green emission bands centered at 546 nm and 523 nm and red UC band at 660nm can be attributed to the 2H11/2/4S3/2 → 4I15/2 and 4F9/2 → 4I15/2 transitions of Er3+, respectively, as shown in Fig. 4. In panel (b), the strong green and red UC emission bands centered at 650 nm and 540 nm can be assigned to the 5F5 → 5I8 and 4S2/5F4 → 5I8 transitions of Ho3+, respectively. In panel (c), the blue emission bands at 450 and 475 nm correspond to the 1D2→3F4 and the 1G4→3H6 transitions. The red emission bands at 647 arises from the 1G4→3F4 transition and the intense near-infrared emission at 803 nm stems from the 3H4→3H6 transitions of Tm3+ ions. To clarify the mechanism, the power dependent UC behavior is investigated. Fig. 3(d), (e), and (f) show the double-logarithmic plots of the UC emission intensity (IUP) versus infrared pump-power (IIR) for the Yb3+/Er3+, Yb3+/Ho3+ and Yb3+/Tm3+ co-doped KGdF4 nanocrystals, respectively. The slopes of the linear fits of log(IUP) versus log(IIR) are 2.23, 2.22 and 1.79 for the green and red bands at 523, 546 and 660 nm from the Yb3+/Er3+ co-doped sample, 2.2 and 2.18 for the green and red bands at 540 and 650 nm from the Yb3+/Ho3+ co-doped sample, and 2.51 and 1.74 for the blue and infrared bands at 475 and 803 nm from the Yb3+/Tm3+ codoped sample, respectively. The results reveal that two pump photons from the excited Yb3+ ions via successive energy transfer (ET) are necessary to produce the red and green bands from these co-doped samples, whereas three pump photons are needed to emit the blue bands. They are consistent with previous results obtained from NaYF4, Y2O3 and BaYF5 nanocrystals.29–32
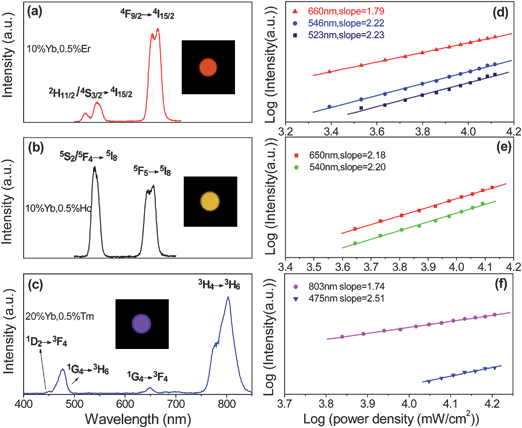 | ||
| Fig. 3 Up-conversion emission spectra and corresponding double-logarithmic plot of the up-conversion emission intensity versus the pump power density of the KGdF4 nanocrystals doped with 10 mol% Yb3+, 0.5 mol% Er3+ (a, d); doped with 10 mol% Yb3+, 0.5 mol% Ho3+ (b, e); and doped with 20 mol% Yb3+, 0.5 mol% Tm3+ (c, f), respectively. The insets are the digital photographs acquired from the corresponding samples at the power density of 18.09 W cm−2. | ||
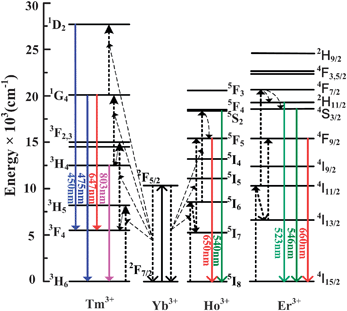 | ||
| Fig. 4 The energy diagram of the Yb3+, Er3+, Ho3+ and Tm3+ dopant ions and the possible UC mechanisms under the excitation of a 980 nm LD. The full, dotted and dashed arrows represent emission, energy transfer and multi-phonon relaxation processes respectively. | ||
The low temperature thermal treatment can notably enhance the UC intensity of the samples. Fig. 5(a) shows the UC spectra from the Yb3+–Tm3+ co-doped KGdF4 nanocrystals annealed at different temperatures demonstrating enhanced UC emissions at both 475 nm and 803 nm of Tm3+. Generally, with miniaturization down to the nanometre scale, some surface and interface states have great influence on the optical properties of Ln3+ doped nanocrystals.33,34 These surface states are closely related to some anionic groups such as OH− and carboxyl groups which originate from the precursors in the synthesis and cannot be removed by simply drying at 60 °C. Here, the nanocrystals are produced by a hydrothermal method using oleic acid as the stabilizing agent. It is reasonable that certain amounts of OH− and carboxyl groups adsorb on the surface of nanocrystals. The OH− and carboxyl groups yield high-energy vibrational modes (2800–3600 cm−1), which may quench the intermediate or excited states of Tm3+ by multi-phonon relaxation to lower UC efficiency. In the Tm3+ ions, the 4H4 states are both the intermediate levels responsible for the emission at 475 nm and the excited state for emission at 803 nm. There is an energy gap of ∼4100 cm−1 between the 4H4 state and its nearest lower 3H5 state. According to the Miyakawa–Dexter theory,35 the high-energy vibrations of the OH− and carboxyl groups render multi-phonon relaxation (4H4 → 3H5) much more probable than that of the intrinsic phonons in KGdF4 nanocrystals, and only two vibration phonons of OH− are required to bridge the gap. Therefore, the presence of OH− and carboxyl groups on the nanocrystal surface reduces the UC intensity if they are coupled to the Tm3+ ions. Obviously, the presence of OH− and carboxyl groups imposes a similar quenching effect on the UC emission from Er3+ and Ho3+. Fig. 5(b) shows the FTIR spectra from the Yb3+-Tm3+ co-doped KGdF4 nanocrystals annealed at different temperatures. Four peaks and one broad band can be observed from as prepared KGdF4 nanocrystals. The broad band at 3446 cm−1 characterizing mode is appreciable for the O–H stretching vibration.36 The peaks at 2916 and 2838 cm−1 are assigned to the asymmetric and symmetric stretching vibration of methylene (CH2) in the long alkyl chain of the oleic acid molecule, respectively. The peaks at 1566 and 1438 cm−1 can also be assigned to the asymmetric and symmetric stretching vibration of the carboxylic group (–COOH), respectively. After the low temperature thermal treatment, four peaks at 2916, 2838, 1566 and 1438 cm−1 completely disappear and the intensity of the broad band at 3446 cm−1 characterizing mode is notably discreased. The inset in Fig. 5 shows the DSC-TGA results of the Yb3+–Tm3+ co-doped KGdF4 nanocrystals. Two endothermic peaks at around 104 °C and 303 °C can be observed. The former weak endothermic peak is due to the desorption of absorbed water and organic solvent, whereas the latter broad one is attributed to the desorption of adsorbates such as carboxyl and hydroxyl groups.37 The FTIR and DSC-TGA results confirm that careful elimination of such adsorbates decreases the rate of non-radiative multi-phonon relaxation consequently improving the UC efficiency.
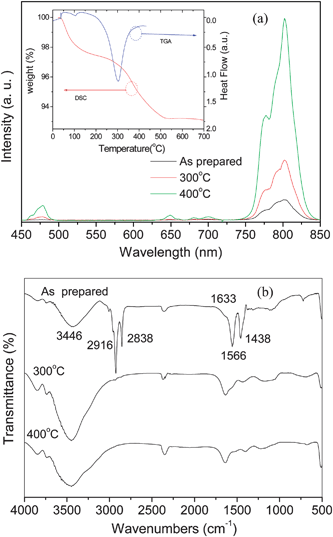 | ||
| Fig. 5 (a) Up-conversion emission spectra obtained from the 10 mol% Yb3+ and 0.5 mol% Tm3+ codoped KGdF4 nanocrystals annealed at different temperature. The inset shows the DSC-TGA curves of the Yb3+/Tm3+ codoped KGdF4 nanocrystals. (b) FTIR spectra from the 10 mol% Yb3+ and 0.5 mol% Tm3+ co-doped KGdF4 nanocrystals annealed at different temperature. | ||
Based on the generation of RGB bands from different co-doped nanocrystals, it is possible to produce white emission by introducing three dopants, namely Yb3+, Tm3+, and Er3+ or Ho3+ into the KGdF4 nanocrystals. Fig. 6(a) shows the UC emission spectra and corresponding digital photographs (see inset) obtained from KGdF4 nanocrystals doped with different molar ratios of Yb3+, Ho3+ and Tm3+ under excitation by a 980 nm LD with a pump power density of 16.2 W cm−2. Referring to Fig. 3(b) and (c), it is easy to assign the origins of the observed emission bands. The intense blue emission at 475 nm and weak one at 450 nm can be assigned to the intra-4f electronic transitions of Tm3+ and the green emission around 540 nm arises from Ho3+. The red emission includes the contribution from both Tm3+ and Ho3+ according to the change of fine spectral shape in the red band. As the ratio of Ho3+ and Tm3+ increases, the intensity of the green and red emissions increase faster than that of the blue emission from Tm3+, resulting in a color shift from blue-white to red-white. Therefore, the contribution to the red emission from Ho3+ is more than that from Tm3+ in the triple-doped nanocrystals. Fig. 6(b) shows the CIE 1931 chromaticity diagram together with the calculated color coordinates of Fig. 6(a). The calculated color coordinates of (0.333, 0.261), (0.312, 0.283), (0.352, 0.347) and (0.358, 0.361) correspond to the different molar ratios of (25![[thin space (1/6-em)]](https://www.rsc.org/images/entities/char_2009.gif) :
:![[thin space (1/6-em)]](https://www.rsc.org/images/entities/char_2009.gif) 0.75
0.75![[thin space (1/6-em)]](https://www.rsc.org/images/entities/char_2009.gif) :
:![[thin space (1/6-em)]](https://www.rsc.org/images/entities/char_2009.gif) 1), (25
1), (25![[thin space (1/6-em)]](https://www.rsc.org/images/entities/char_2009.gif) :
:![[thin space (1/6-em)]](https://www.rsc.org/images/entities/char_2009.gif) 1
1![[thin space (1/6-em)]](https://www.rsc.org/images/entities/char_2009.gif) :
:![[thin space (1/6-em)]](https://www.rsc.org/images/entities/char_2009.gif) 1), (25
1), (25![[thin space (1/6-em)]](https://www.rsc.org/images/entities/char_2009.gif) :
:![[thin space (1/6-em)]](https://www.rsc.org/images/entities/char_2009.gif) 1.25
1.25![[thin space (1/6-em)]](https://www.rsc.org/images/entities/char_2009.gif) :
:![[thin space (1/6-em)]](https://www.rsc.org/images/entities/char_2009.gif) 1), (25
1), (25![[thin space (1/6-em)]](https://www.rsc.org/images/entities/char_2009.gif) :
:![[thin space (1/6-em)]](https://www.rsc.org/images/entities/char_2009.gif) 1.5
1.5![[thin space (1/6-em)]](https://www.rsc.org/images/entities/char_2009.gif) :
:![[thin space (1/6-em)]](https://www.rsc.org/images/entities/char_2009.gif) 1), respectively. The chromaticity coordinate of the Yb3+/Ho3+/Tm3+ (25
1), respectively. The chromaticity coordinate of the Yb3+/Ho3+/Tm3+ (25![[thin space (1/6-em)]](https://www.rsc.org/images/entities/char_2009.gif) :
:![[thin space (1/6-em)]](https://www.rsc.org/images/entities/char_2009.gif) 1.25
1.25![[thin space (1/6-em)]](https://www.rsc.org/images/entities/char_2009.gif) :
:![[thin space (1/6-em)]](https://www.rsc.org/images/entities/char_2009.gif) 1) doped KGdF4 nanocrystals falls within the white region of the CIE 1931 chromaticity diagram and is very close to that of standard white light (X = 0.33, Y = 0.33), suggesting potential use as a white light source.
1) doped KGdF4 nanocrystals falls within the white region of the CIE 1931 chromaticity diagram and is very close to that of standard white light (X = 0.33, Y = 0.33), suggesting potential use as a white light source.
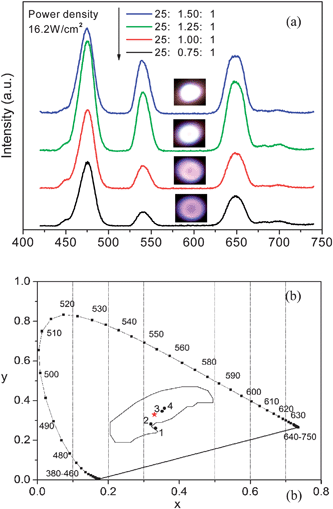 | ||
Fig. 6 (a) Up-conversion emission spectra and digital photographs (inset) of KGdF4 nanocrystals doped with different molar ratios of Yb3+, Ho3+ and Tm3+ under excitation by a 980 nm LD. The photograph and spectra were obtained using a fixed pump power density of 16.2 W cm−2. (b) Corresponding calculated CIE(X,Y) coordinate diagram showing the chromaticity points of the up-conversion luminescence: point 1–25![[thin space (1/6-em)]](https://www.rsc.org/images/entities/char_2009.gif) : :![[thin space (1/6-em)]](https://www.rsc.org/images/entities/char_2009.gif) 0.75 0.75![[thin space (1/6-em)]](https://www.rsc.org/images/entities/char_2009.gif) : :![[thin space (1/6-em)]](https://www.rsc.org/images/entities/char_2009.gif) 1; point 2–25 1; point 2–25![[thin space (1/6-em)]](https://www.rsc.org/images/entities/char_2009.gif) : :![[thin space (1/6-em)]](https://www.rsc.org/images/entities/char_2009.gif) 1 1![[thin space (1/6-em)]](https://www.rsc.org/images/entities/char_2009.gif) : :![[thin space (1/6-em)]](https://www.rsc.org/images/entities/char_2009.gif) 1; point 3–25 1; point 3–25![[thin space (1/6-em)]](https://www.rsc.org/images/entities/char_2009.gif) : :![[thin space (1/6-em)]](https://www.rsc.org/images/entities/char_2009.gif) 1.25 1.25![[thin space (1/6-em)]](https://www.rsc.org/images/entities/char_2009.gif) : :![[thin space (1/6-em)]](https://www.rsc.org/images/entities/char_2009.gif) 1; point 4–25 1; point 4–25![[thin space (1/6-em)]](https://www.rsc.org/images/entities/char_2009.gif) : :![[thin space (1/6-em)]](https://www.rsc.org/images/entities/char_2009.gif) 1.5 1.5![[thin space (1/6-em)]](https://www.rsc.org/images/entities/char_2009.gif) : :![[thin space (1/6-em)]](https://www.rsc.org/images/entities/char_2009.gif) 1. 1. | ||
Fig. 7 shows the magnetization as a function of applied magnetic field of the Yb3+–Er3+ co-doped KGdF4 nanocrystals with and without annealing.The nanocrystals at both RM and 79 K (applied field ranging from −17 to 17 kOe) show paramagnetism, unlike the behavior of Gd atoms which exhibit a ferromagnetic behavior below 289 K. In general, the magnetic properties of Gd3+ arise from seven unpaired inner 4f electrons which are closely bound to the nucleus and effectively shielded by the outer closed shell electrons 5s2 5p6 from the crystal field.38,39 If the separation between the Gd3+ ions in the matrix are too far, it may inhibit sufficient overlap of the orbitals associated with the partially filled 4f electrons shells of the Gd3+ ions necessary for ferromagnetism. Therefore, the paramagnetism which is different from that of the Gd atom even at 79 K in the KGdF4 nanocrystals can be ascribed to the fact that the magnetic moments associated with Gd3+ are all localized and noninteracting.38,39 The magnetic mass susceptibility of the as prepared and annealed KGdF4 nanocrystals at RM are found to be 1.17 × 10⁻⁵ and 1.64 × 10⁻⁵ emu g−1 Oe−1, respectively. According to the aforementioned XRD, FTIR and DSC-TGA results, the ehancement of magnetic mass susceptibility likely originates from the desorption of adsorbates such as carboxyl and hydroxyl. At low temperature of 79 K, the magnetic susceptibility for the as prepared and annealed KGdF4 nanocrystals are 3.89 x10⁻⁵ and 5.27 x10⁻⁵ emu g−1 Oe−1, respectively. The increase in the magnetic susceptibility with decreasing the temperature is due to the reduction in thermal fluctuation, which is a typical behavior in paramagnetic materials described by the Curie's law. Moreover, the RM magnetization of the annealed KGdF4 nanocrystals at 15 kOe is around 0.29 emu g−1 and it is close to the reported value of the GdF3![[thin space (1/6-em)]](https://www.rsc.org/images/entities/char_2009.gif) :
:![[thin space (1/6-em)]](https://www.rsc.org/images/entities/char_2009.gif) Eu3+ and Gd2O3
Eu3+ and Gd2O3![[thin space (1/6-em)]](https://www.rsc.org/images/entities/char_2009.gif) :
:![[thin space (1/6-em)]](https://www.rsc.org/images/entities/char_2009.gif) Eu3+ nanocrystals used in common bio-separation.38–40
Eu3+ nanocrystals used in common bio-separation.38–40
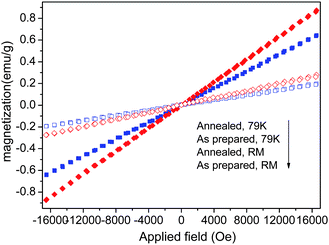 | ||
| Fig. 7 Magnetization vs. magnetic field of the Yb3+–Er3+ codoped KGdF4 nanocrystals with and without annealing measured at room temperature (RM) and 79 K. | ||
4. Conclusion
Multifunctional Ln3+ doped KGdF4 (Ln = Er3+, Ho3+, Tm3+, Yb3+) nanocrystals with paramagnetism and multicolor UC emissions including red, yellow, blue and white under the excitation of a 980 nm diode laser (LD) have been synthesized by a hydrothermal method. TEM and XRD indicate that the average size of the nanocrystals in the cubic structure is approximately 12 nm. The power dependence studies indicate that a two-photon successive ET process from excited Yb3+ is responsible for the red and yellow emissions, whereas a three-photon successive ET process gives rise to the blue emission. The calculated color coordinates demonstrate that white UC emission (CIE-X = 0.352, CIE-Y = 0.347) can be obtained by varying the dopant concentrations in the Yb3+/Ho3+/Tm3+ triply-doped nanocrystals. The nanocrystals at both RM and 79 K exhibit paramagnetic properties which can be ascribed to the non-interacting localized nature of the magnetic moment of Gd3+. Furthermore low temperature thermal treatment can enhance UC properties, magnetization and magnetic mass susceptibility of Ln3+ doped KGdF4 nanocrystals. The Ln3+ doped KGdF4 nanocrystals have potential applications in color displays, bio-separation, and optical–magnetic dual modal nanoprobes in biomedicine imaging.41–43Acknowledgements
This work was supported by the Grants from National Natural Science Foundation of China (No.10802071 and No.10772157) and Technical Innovation Project (708068), Ministry of Education of China as well as City University of Hong Kong Strategic Research Grant (SRG) No. 7008009.References
- F. Auzel, Chem. Rev., 2004, 104, 139–174 CrossRef CAS.
- E. Downing, L. Hesselink, J. Ralston and R. Macfarlane, Science, 1996, 273, 1185 CrossRef CAS.
- C. Jacinto, M. Vermelho, E. Gouveia, M. de Araujo, P. Udo, N. Astrath and M. Baesso, Appl. Phys. Lett., 2007, 91, 071102–071102 CrossRef.
- B. van der Ende, L. Aartsa and A. Meijerink, Phys. Chem. Chem. Phys., 2009, 11, 11081–11095 RSC.
- F. Wang and X. Liu, Chem. Soc. Rev., 2009, 38, 976–989 RSC.
- R. Kumar, M. Nyk, T. Ohulchanskyy, C. Flask and P. Prasad, Adv. Funct. Mater., 2009, 19, 853–859 CrossRef CAS.
- Y. Park, J. Kim, K. Lee, K. Jeon, H. Na, J. Yu, H. Kim, N. Lee, S. Choi, S. Baik, H. Kim, S. ParK, B. Park, Y. Kim, S. Lee, S. Yoon, I. Song, W. Moom, Y. Suh and T. Hyeon, Adv. Mater., 2009, 21, 4467–4471 CrossRef CAS.
- G. Glaspell, J. Anderson, J. Wilkins and M. El-Shall, J. Phys. Chem. C, 2008, 112, 11527–11531 CrossRef CAS.
- K. Koempe, H. Borchert, J. Storz, A. Lobo, S. Adam, T. Moeller and M. Haase, Angew. Chem., Int. Ed., 2003, 42, 5513–5516 CrossRef.
- Y. Sun, H. Liu, X. Wang, X. Kong and H. Zhang, Chem. Mater., 2006, 18, 2726–2732 CrossRef CAS.
- T. Mirkovic, M. Hines, P. Nair and G. Scholes, Chem. Mater., 2005, 17, 3451–3456 CrossRef CAS.
- J. Boyer, L. Cuccia and J. Capobianco, Nano Lett., 2007, 7, 847–852 CrossRef CAS.
- S. Heer, K. Kömpe, H. Güdel and M. Haase, Adv. Mater., 2004, 16, 2102–2105 CrossRef CAS.
- J. Stouwdam and F. van Veggel, Nano Lett., 2002, 2, 733–737 CrossRef CAS.
- F. Wang and X. Liu, J. Am. Chem. Soc., 2008, 130, 5642–5643 CrossRef CAS.
- J. Zeng, J. Su, Z. Li, R. Yan and Y. Li, Adv. Mater., 2005, 17, 2119–2123 CrossRef CAS.
- F. Zhang, Y. Wan, T. Yu, Y. Shi, S. Xie, Y. Li, L. Xu, B. Tu and D. Zhao, Angew. Chem., 2007, 119, 8122–8125 CrossRef.
- L. Yang, H. Han, Y. Zhang and J. Zhong, J. Phys. Chem. C, 2009, 113, 18995 CrossRef CAS.
- V. Mahalingam, F. Vetrone, R. Naccache, A. Speghini and J. Capobianco, Adv. Mater., 2009, 21, 4025 CrossRef CAS.
- F. Wang, Y. Han, C. Lim, Y. Lu, J. Wang, J. Xu, H. Chen, C. Zhang, M. Hong and X. Liu, Nature, 2010, 463, 1061–1065 CrossRef CAS.
- H. Mai, Y. Zhang, L. Sun and C. Yan, J. Phys. Chem. C, 2007, 111, 13721–13729 CrossRef CAS.
- Z. Yan and C. Yan, J. Mater. Chem., 2008, 18, 5046–5059 RSC.
- G. Wang, Q. Peng and Y. Li, J. Am. Chem. Soc., 2009, 131, 14200–14201 CrossRef CAS.
- N. Kodama and Y. Watanabe, Appl. Phys. Lett., 2004, 84, 4141 CrossRef CAS.
- T. Lee, L. Luo, W. Diau, T. Chen, B. Cheng and C. Tung, Appl. Phys. Lett., 2006, 89, 131121 CrossRef.
- R. Wegh, H. Donker, K. Oskam and A. Meijerink, Science, 1999, 283, 663 CrossRef CAS.
- M. Karbowiak, A. Mech, A. Bednarkiewicz and W. Strk, J. Alloys Compd., 2004, 380, 321–326 CrossRef CAS.
- Y. Du, Y. Zhang, L. Sun and C. Yan, Dalton Trans., 2009,(40), 8574–8581 RSC.
- G. Chen, Y. Liu, Y. Zhang, G. Somesfalean, Z. Zhang, Q. Sun and F. Wang, Appl. Phys. Lett., 2007, 91, 133103 CrossRef.
- F. Vetrone, V. Mahalingam and J. Capobianco, Chem. Mater., 2009, 21, 1847–1851 CrossRef CAS.
- J. Yang, C. Zhang, C. Peng, C. Li, L. Wang, R. Chai and J. Lin, Chem.–Eur. J., 2009, 15, 4649–4655 CrossRef CAS.
- A. Yin, Y. Zhang, L. Sun and C. Yan, Nanoscale, 2010, 2, 953 RSC.
- G. De, W. Qin, J. Zhang, J. Zhang, Y. Wang, C. Cao and Y. Cui, Solid State Commun., 2006, 137, 483–487 CrossRef CAS.
- F. Vetrone, J. Boyer, J. Capobianco, A. Speghini and M. Bettinelli, J. Phys. Chem. B, 2002, 106, 5622–5628 CrossRef CAS.
- T. Miyakawa and D. L. Dexter, Phys. Rev. B: Solid State, 1970, 1, 2961 CrossRef.
- L. Wang and Y. Li, Nano Lett., 2006, 6, 1645–1649 CrossRef CAS.
- S. Lu, B. Lee, Z. Wang and W. Samuels, J. Cryst. Growth, 2000, 219, 269–276 CrossRef.
- H. Wong, H. Chan and J. Hao, Opt. Express, 2010, 18, 6123–6130 CrossRef CAS.
- H. Wong, H. Chan and J. Hao, Appl. Phys. Lett., 2009, 95, 022512 CrossRef.
- H. Yang, S. Zhang, X. Chen, Z. Zhuang, J. Xu and X. Wang, Anal. Chem., 2004, 76, 1316 CrossRef CAS.
- L. Xiong, Z. Chen, Q. Tian, T. Cao, C. Xu and F. Li, Anal. Chem., 2009, 81, 8687–8694 CrossRef CAS.
- M. Yu, F. Li, Z. Chen, H. Hu, C. Zhan, H. Yang and C. Huang, Anal. Chem., 2009, 81, 930–935 CrossRef CAS.
- J. Zhou, Y. Sun, X. Du, L. Xiong, H. Hu and F. Li, Biomaterials, 2010, 31, 3287–3295 CrossRef CAS.
| This journal is © The Royal Society of Chemistry 2010 |
