Self-assembly of an amyloid peptide fragment–PEG conjugate: lyotropic phase formation and influence of PEG crystallization
V.
Castelletto
a,
G. E.
Newby
a,
D.
Hermida Merino
a,
I. W.
Hamley
*ab,
D.
Liu
c and
L.
Noirez
d
aDept. of Chemistry, University of Reading, Reading, UK RG6 6AD. E-mail: I.W.Hamley@reading.ac.uk
bDiamond Light Source, Harwell Science and Innovation Campus, Didcot, UK OX11 0DE
cDept. of Physics, University of Surrey, Guildford, Surrey, UK GU2 7XH
dCEA-CNRS Laboratoire Léon Brillouin, F91191, Gif-sur-Yvette, France
First published on 1st February 2010
Abstract
The self-assembly of PEGylated peptides containing a modified sequence from the amyloid β peptide, YYKLVFF, has been studied in aqueous solution. Two PEG molar masses, PEG1k and PEG3k, were used in the conjugates. It is shown that both YYKLVFF–PEG hybrids form fibrils comprising a peptide core and a PEG corona. The fibrils are much longer for YYKLVFF–PEG1k, pointing to an influence of PEG chain length. The β-sheet secondary structure of the peptide is retained in the conjugate. Lyotropic liquid crystal phases, specifically nematic and hexagonal columnar phases, are formed at sufficiently high concentration. Flow alignment of these mesophases was investigated by small-angle neutron scattering with in situ steady shearing in a Couette cell. On drying, PEG crystallization occurs leading to characteristic peaks in the X-ray diffraction pattern, and to lamellar structures imaged by atomic force microscopy. The X-ray diffraction pattern retains features of the cross-β pattern from the β-sheet structure, showing that this is not disrupted by PEG crystallization.
Introduction
Conjugation of synthetic polymers with peptides produces hybrid materials with properties distinctive from either component separately. The peptide unit can be tailored to incorporate designed binding or responsive motifs and can be coupled to a synthetic polymer that provides a vehicle for delivery (e.g. stealth delivery using polyethylene glycol, PEG) or which provides improved stability against pH, temperature or concentration1 or which undergoes conformational changes in response to such variables in the case of responsive polymers.2,3 Several recent reviews focus on polymer–peptide conjugates and discuss different approaches to their synthesis using convergent and divergent methods, based on growth of polymer from tethered peptides, or vice versa or coupling of pre-synthesized units.4–9 Much work has focussed on PEG, because PEGylation is used to improve the bioavailability of a number of proteins for pharmaceutical applications. PEG is readily available, biocompatible, and has well studied physico-chemical properties.In order to exploit peptide–PEG conjugates, the basic process of self-assembly needs to be controlled, and understood. Methods to synthesize peptide–polymer conjugates such as PEG–peptide conjugates are reviewed elsewhere.4–9 Particularly relevant to our work, Lynn and co-workers were the first to investigate conjugates of PEG with amyloid β (Aβ) peptide fragments. Specifically, they studied the self-assembly of Aβ(10-35)-PEG3k.10Conjugation to PEG was found to enhance the solubility of the Aβpeptide, and led to reversible fibrillization, in contrast to the native peptide.
Here we investigate the self-assembly of a model peptide fragment conjugated to PEG with two different molar masses. The peptide fragment YYKLVFF is based on a sequence KLVFF, comprising a core fragment of the amyloid β peptide, Aβ(16-20), that has been under extensive investigation by ourselves and others due to its role in Aβ fibrillization which is a key factor in Alzheimer's disease.11–14 One objective is to develop compounds containing the KLVFF self-recognition element (SRE) but attached to other residues, or to polymers, that can hinder or disrupt aggregation. Our peptide–PEG conjugates were prepared via the convergent route of N-terminal PEGylation of peptides synthesized on PEG-loaded resins. Two aspects of self-assembly are considered—firstly association in aqueous solution and second, the influence of PEG crystallization upon drying. This is of interest since PEG–peptide conjugates are often characterized using methods that lead to drying of the sample, which can cause PEG crystallization, even though, of course, this does not occur in vivo. Compared to FFKLVFF–PEG3k studied by us previously,15,16YYKLVFF–PEG samples are expected to have a different hydrophile–lipophile balance (HLB) since Y is less hydrophobic than F. In addition, incorporation of tyrosine will enable ultimate functionalization and responsiveness (e.g. to pH or through phosphorylation/dephosphorylation) via the tyrosinehydroxyl units. Here, we also compare YYKLVFF–PEG samples with different PEG molar masses, to examine the effect on self-assembly and PEG crystallization. We show that in solution, YYKLVFF–PEG forms core–shell fibrils with a peptide core surrounded by a PEG stabilization layer. Lyotropic liquid crystal formation is observed at sufficiently high concentration in aqueous solution—both nematic and columnar phases are observed for YYKLVFF–PEG3k, similar to FFKLVFF–PEG samples. These structures result from packing constraints on the core–shell fibrils. Liquid crystalline phases are observed for several classes of biopolymers, and such structures may be found in vivo.17 It has recently been shown that so-called filomicelles of block copolymers, i.e. filamentous or worm-like micelles, offer advantages in delivery of solubilized drugs compared to spherical micelles due to enhanced circulation times, reduced phagocytosis and flow alignment.18,19 Our work establishes conditions for the formation of filomicelles of peptide–PEG “block copolymer” conjugates, and we also probe flow alignment in nematic and columnar lyotropic mesophases.
Experimental
Materials
The PEGylated conjugates, YYKLVFF–PEG1k and YYKLVFF–PEG3k, were synthesized by Rapp polymere GmbH using solid phase peptide synthesis methods. PEGylated TentaGel PAP resin was used, which comprises porous PS beads to which PEG is attached via acid cleavable linkages. The peptide was assembled from the C-terminus towards the N-terminus, and was attached to the solid support at the C-terminal by the α-carbonylgroup of the amino acid. The crude peptides were characterized by reverse phase high performance liquid chromatography (RP-HPLC; Grom Saphir 200, C18 5 μm column). A mobile phase with a gradient of water with 0.1% TFA and acetonitrile with 0.75% TFA was used. Sample elution was monitored using a UV/visdetector operating at 220 nm. MALDI-TOF (Ultraflex, Bruker with matrix Universalmatrix, Fluka) was used to confirm Mn = 4110 g mol−1 for YYKLVFF–PEG3k consistent with addition of YYKLVFF (Mn = 979.2 g mol−1, expected) to the precursor PEG (Mn = 3139 g mol−1, MALDI-TOF, 3060 g mol−1GPC). GPC (eluent: THF) of the starting PEG3000 indicates Mw/Mn = 1.05. For YYKLVFF–PEG1k, Mn = 1920 g mol−1 consistent with addition of YYKLVFF to the precursor PEG (1050 g mol−1GPC). GPC indicated the initial PEG1k had Mw/Mn = 1.04.Fourier transform infrared (FTIR) spectroscopy
Spectra were measured on a Nicolet Nexus spectrometer with DTGS detector. Solutions of YYKLVFF–PEG1k and YYKLVFF–PEG3k in D2O (10.5, 8.2, 5, 4 and 1 wt%) were sandwiched between two CaF2 plate windows (spacer 0.006 mm). Spectra were scanned 128 times over the range of 4000–900 cm−1.Circular dichroism (CD)
Spectra were recorded on a Chirascan spectropolarimeter (Applied Photophysics, UK). CD for solutions was performed using YYKLVFF–PEG1k or YYKLVFF–PEG3k dissolved in water (0.013, 0.015 and 1 wt%) and loaded into quartz cover slip cuvettes 0.01 or 0.1 mm thick or into a 1 mm path length quartz bottle. Spectra are presented according to the instrument manufacturer's specification with absorbance A < 2 at any measured point with a 0.5 nm step, 1 nm bandwidth and 1 s collection time per step at 20 °C.Fluorescence spectroscopy
Spectra were recorded on a Cary Eclipse Varian Fluorescence Spectrometer with samples in a 1.0 cm quartz cuvette. Spectra were measured for both YYKLVFF–PEG samples in water (0.005 or 0.007 wt%). The spectra were recorded from 279 to 490 nm using an excitation wavelength λex = 265 nm.Cryogenic-transmission electron microscopy (cryo-TEM)
Experiments were performed at Unilever Research, Colworth, Bedford, UK. Solutions of YYKLVFF–PEG1k or YYKLVFF–PEG3k (1.9 wt%) were blotted and vitrified using a Gatan Cp3 cryoplunge system. Samples were prepared at a controlled temperature of 22 °C and at a relative humidity around 90%. A 3 μl drop of the solution was placed on a 400 mesh copper TEM grid (Agar) covered with a perforated carbon film (plasma treated). The drop was automatically blotted and the sample was plunged into liquid ethane (−183 °C) to form a vitrified specimen,20,21 then transferred to liquid nitrogen (−196 °C) for storage. Specimens were examined in a JEOL JEM-2100 electron microscope at 200 kV, at temperatures below −175 °C. Images were recorded digitally on a Gatan UltraScan 1000 cooled CCD camera using DigitalMicrograph (Gatan) in the low-dose imaging mode to minimize beam exposure and electron-beam radiation damage.Small-angle neutron scattering (SANS)
Small-angle neutron scattering (SANS and rheo-SANS) was performed on 8.2 wt% YYKLVFF–PEG1k and 10.5 wt% YYKLVFF–PEG3k samples, using the 2-D sensitive multidetector PAXY of the Laboratoire Léon Brillouin. Samples were placed in a quartz Couette cell (0.1 mm gap) which was used to apply steady shear.22 Shear rates are defined as![[small gamma, Greek, dot above]](https://www.rsc.org/images/entities/i_char_e0a2.gif) = ΩR/(R0 − R1), where Ω is the angular velocity, R is the average radius and R0 = 19.0 mm and R1 = 19.1 mm are the inner and outer radii. Shear rates applied were
= ΩR/(R0 − R1), where Ω is the angular velocity, R is the average radius and R0 = 19.0 mm and R1 = 19.1 mm are the inner and outer radii. Shear rates applied were ![[small gamma, Greek, dot above]](https://www.rsc.org/images/entities/i_char_e0a2.gif) = 0.1–2.0 s−1. Measurements were performed at room temperature. Data were obtained with neutrons incident along the shear gradient direction (radial configuration). A wavelength of 6 Å was used. The sample–detector was fixed at 2.5 m. The corresponding q range extends from 0.023 to 0.129 Å−1.
= 0.1–2.0 s−1. Measurements were performed at room temperature. Data were obtained with neutrons incident along the shear gradient direction (radial configuration). A wavelength of 6 Å was used. The sample–detector was fixed at 2.5 m. The corresponding q range extends from 0.023 to 0.129 Å−1.
Polarized optical microscopy (POM)
Microscopy experiments were performed by placing the sample (without stain, and with no particular orientation) between crossed polarizers in an Olympus BX41 polarized microscope. Samples YYKLVFF–PEG1k (8.2 wt%) and YYKLVFF–PEG3K (10.5 wt%) were placed between a glass slide and a cover slip before capturing the images with a Canon G2 digital camera.X-Ray diffraction (XRD)
Diffraction patterns were obtained for stalks prepared by drying filaments of the peptide. An aqueous solution of YYKLVFF–PEG3k (5.6 wt%) was suspended between the ends of a wax-coated capillary and dried. The stalk was mounted (vertically) onto the four axis goniometer of a RAXIS IV++ X-ray diffractometer (Rigaku) equipped with a rotating anode generator. The XRD data were collected using a Saturn 992 CCD camera.Atomic force microscopy (AFM)
The AFM samples were prepared by passively absorbing 25 μl aliquots of a 0.5 wt% solution of YYKLVFF–PEG3k in methanol onto freshly cleaved mica sheets. The samples were then left to dry at room temperature for a few minutes.AFM images were acquired in the intermittent mode using a commercial instrument (NTEGRA, NT-MDT, Moscow, Russia). The samples were scanned with a gold-coated silicon cantilever (NT-MDT, Moscow, Russia) with a nominal spring constant of 5.5 N m−1 and a nominal resonance frequency of 150 Hz. The cantilevers had an ultrasharp conical silicon tip with a typical radius of curvature of 10 nm. All the AFM experiments were performed in air at room temperature, and the images were captured using a scan speed of 1.5 Hz.
Results
1. Self-assembly in aqueous solution
An important question is whether the secondary structure of the peptide is retained in the PEG–peptide conjugate. This was investigated by FTIR and CD spectroscopy. The FTIR spectra shown in Fig. 1 cover the amide I and amide II bands. The former gives information mainly on carbonyl stretching deformations and is diagnostic of secondary structure, the latter is controlled by N–H bend and C–N stretch deformations. The spectra in Fig. 1 show clear evidence for β-sheet formation with a peak at 1620 cm−1, present at concentrations as low as 1 wt% and increasing in intensity with PEG–peptide concentration. At higher concentrations, a further small peak at 1681 cm−1 emerges. A peak at this position is usually ascribed to antiparallel β-sheet structure.23–25 The constraint of terminal PEG chains naturally forces β-strands to adopt a parallel configuration, with a radial arrangement so that the usual meaning of antiparallel referring to flat sheets is not valid. A shoulder in the spectra near 1650 cm−1 points to some disordered conformers, this may correspond to the peptide conformation in peptide–PEG monomers not incorporated into fibrils. A population of monomers is to be expected if this is an equilibrium self-assembly process. CD spectra also provide evidence for β-sheet formation, at sufficiently high concentration. Representative spectra are plotted in Fig. 2. The spectra for both 1 wt% solutions show minima at 213 nm, as expected for β-sheets. The spectra also feature pronounced maxima at 230 nm. We have previously ascribed a maximum at 220 nm to strong aromatic stacking interactions of phenylalanine in FFKLVFF–PEG15,16 (and also the FFKLVFFpeptide), the tyrosine residues present in YYKLVFF may shift the position of this maximum. A maximum at 228 nm was observed for peptide YYKLVFFC,26 in support of our interpretation. Other proteins also have positive CD bands in the 225–230 nm region ascribed to tyrosine and/or tryptophan residues.27,28 This maximum may be distinct from the peaks in the near UV spectra (250–300 nm) for aromatic residues,28,29 for instance the broad maximum centred around 260 nm, observed for YYKLVFF–PEG1k. At lower concentrations, the CD spectra are characteristic of less ordered structures, with a substantial contribution from random coils although still with weak positive maxima from aromatic residues, pointing to interactions in dilute solution before β-sheets have developed.15 Due to signal-to-noise issues, it was not possible to measure FTIR spectra at concentrations as low as 0.013–0.015 wt%, furthermore techniques such as SANS may also not be used for such dilute samples.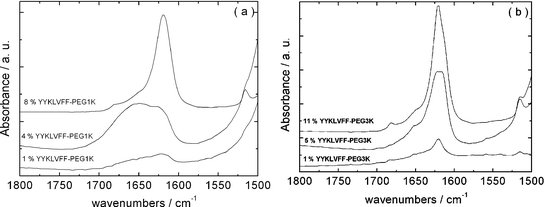 | ||
| Fig. 1 Amide I/II regions of FTIR spectra for samples in D2O at the concentrations indicated: (a) YYKLVFF–PEG1k and (b) YYKLVFF–PEG3k. | ||
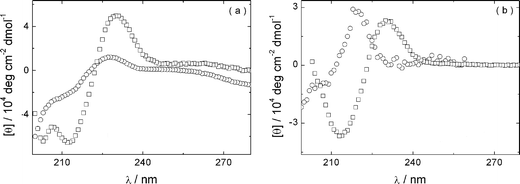 | ||
| Fig. 2 CD spectra for solutions of (a) YYKLVFF–PEG1k and (b) YYKLVFF–PEG3k: (□) 1 wt% and (○) 0.015 wt% solutions. | ||
Fluorescence spectroscopy confirmed the role of aromatic stacking interactions between tyrosine residues in the self-assembly process. Fig. 3 presents a spectrum for dilute aqueous solutions of both YYKLVFF–PEG conjugates. The peaks at 304 nm (YYKLVFF–PEG1k) or 307 nm (YYKLVFF–PEG3k) are associated with π–π stacking interactions as discussed elsewhere.30
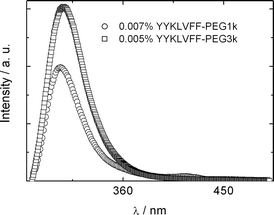 | ||
| Fig. 3 Fluorescence spectra (λex = 265 nm) at concentrations indicated. | ||
Evidence for self-assembly into fibrils at higher concentration was provided by several techniques such as cryo-TEM and SANS. Cryo-TEM was performed instead of conventional negative stain TEM, due to the fact that PEG can crystallize when drying the sample. Cryo-TEM enables the in situ structure to be trapped in vitrified water, circumventing the crystallization of PEG.31Fig. 4 shows images obtained for both polymers in 1.9 wt% solutions. Fig. 4a shows that YYKLVFF–PEG1k forms fibrils with a well-defined diameter d = 5 ± 0.5 nm, but a considerable dispersity in length, extending up to several μm (based on this image, and several others obtained for this sample). YYKLVFF–PEG3k also forms fibrils. The diameter varies somewhat, in fact some fibrils appear to be twisted (Fig. 4, inset) with a diameter ranging between d = 12 nm and d = 23 nm, and a distribution of fibril lengths; however, the fibrils are much shorter than for YYKLVFF–PEG1k. A population of ellipsoidal–spherical aggregates is also observed for this sample. We believe that the increased PEG chain length favours the formation of more highly curved interfaces in this sample, in other words the end cap energy is considerably reduced. There appears to be a transition from elongated fibrils, or filomicelles, to shorter extended aggregates at a PEG molecular weight of about 3k. This is supported by observations for other samples including FFFF–PEG5k32–34 and FFKLVFF–PEG comparing PEG1k, PEG2k and PEG3k.35 Sample FFFF–PEG5k forms very short fibrils32 whereas FFFF conjugated to lower molecular weight PEG forms long fibrils/nanotubes.33,34 In the latter case, conjugates of FFFF with PEG of molar mass 0.35k, 1.2k, and 1.8k led to nanotubes, fibrils and worm-like micelles respectively. For FFKLVFF–PEG, the fibril anisotropy also decreases with increasing PEG molar mass, presumably because the PEG wraps around the aggregates favouring shorter aggregates.
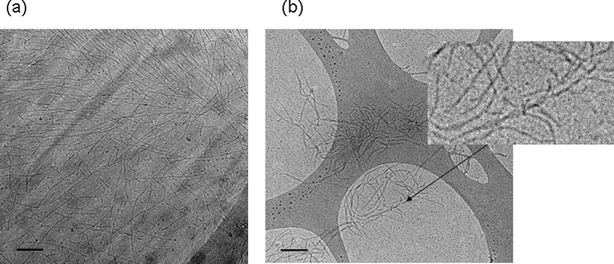 | ||
| Fig. 4 Cryo-TEM images of (a) YYKLVFF–PEG1k and (b) YYKLVFF–PEG3k. The scale bars indicate 100 nm. The inset to part (b) shows an enlarged twisted fibril. | ||
Liquid crystal phase formation was noted at higher concentration, via characteristic birefringence textures observed by polarized optical microscopy. Fig. 5 shows POM images obtained for samples of the two polymers for concentrations around 8–10 wt%. These samples were thick liquids/thin gels. Flow alignment effects were investigated by SANS, which was also used to identify liquid crystal phases in the higher concentration regime. During simultaneous SANS/shear flow experiments, the shear rate ![[small gamma, Greek, dot above]](https://www.rsc.org/images/entities/i_char_e0a2.gif) was progressively increased from 0 to 2 s−1. Fig. 6a shows the SANS profile for 8.2 wt% YYKLVFF–PEG1k as mounted in a Couette cell (radial configuration, i.e. the shear gradient-neutral plane is probed), while Fig. 6b shows the SANS data for the same sample sheared at
was progressively increased from 0 to 2 s−1. Fig. 6a shows the SANS profile for 8.2 wt% YYKLVFF–PEG1k as mounted in a Couette cell (radial configuration, i.e. the shear gradient-neutral plane is probed), while Fig. 6b shows the SANS data for the same sample sheared at ![[small gamma, Greek, dot above]](https://www.rsc.org/images/entities/i_char_e0a2.gif) = 2 s−1. Fig. 6a shows isotropic central scattering arising from the peptidefibrils. The SANS pattern became progressively more anisotropic upon increasing the shear rate, leading to SANS patterns similar to the one shown in Fig. 6b. This shows alignment of fibrils along the direction of the shear flow. It can be concluded from the SANS data in Fig. 6, together with the POM image (Fig. 5a), that YYKLVFF–PEG1k in an 8.2 wt% aqueous solution forms a nematic liquid crystal phase. Furthermore, simultaneous shear flow/SANS experiments show that the SANS pattern becomes isotropic immediately after the shear is stopped (to recover a pattern similar to that in Fig. 6a). Fig. 7a shows the SANS profile obtained for 10.5 wt% YYKLVFF–PEG3k as mounted in the Couette cell, while Fig. 7b shows the SANS profile for the same sample sheared at
= 2 s−1. Fig. 6a shows isotropic central scattering arising from the peptidefibrils. The SANS pattern became progressively more anisotropic upon increasing the shear rate, leading to SANS patterns similar to the one shown in Fig. 6b. This shows alignment of fibrils along the direction of the shear flow. It can be concluded from the SANS data in Fig. 6, together with the POM image (Fig. 5a), that YYKLVFF–PEG1k in an 8.2 wt% aqueous solution forms a nematic liquid crystal phase. Furthermore, simultaneous shear flow/SANS experiments show that the SANS pattern becomes isotropic immediately after the shear is stopped (to recover a pattern similar to that in Fig. 6a). Fig. 7a shows the SANS profile obtained for 10.5 wt% YYKLVFF–PEG3k as mounted in the Couette cell, while Fig. 7b shows the SANS profile for the same sample sheared at ![[small gamma, Greek, dot above]](https://www.rsc.org/images/entities/i_char_e0a2.gif) = 2 s−1. Fig. 7a shows that the initial procedure of mounting the sample in the Couette cell is enough to orient the sample. The SANS profile in Fig. 7a is characterized by a pronounced structure factor peak at q* = 0.0396 Å−1, accompanied by a weak higher order peak at
= 2 s−1. Fig. 7a shows that the initial procedure of mounting the sample in the Couette cell is enough to orient the sample. The SANS profile in Fig. 7a is characterized by a pronounced structure factor peak at q* = 0.0396 Å−1, accompanied by a weak higher order peak at  , which is also visible in the two-dimensional SANS pattern. This suggests formation of a hexagonal columnar phase.15,16 The orientation of the scattering rings in Fig. 7b shows the preferential orientation of the fibrils with respect to the shear flow. The fibrils are aligned at ∼45° with the shear flow direction after mounting the sample in the Couette cell (Fig. 7a), while the fibrils are oriented in the direction of the shear flow for shear rates
 ![[small gamma, Greek, dot above]](https://www.rsc.org/images/entities/i_char_e0a2.gif) = 0.1–2 s−1 (e.g.Fig. 7b). The extent of anisotropy in the SANS pattern in Fig. 7b is lower than in Fig. 6b due to the different nature of the phases and their susceptibility to flow alignment—the nematic phase is a fluid that can readily be aligned by shear, whereas the hexagonal columnar phase is a soft gel that cannot be oriented so easily. Quantitative comparison of orientation with our previous results for FFKLVFF–PEG3k is prohibited by differences in concentration—for that sample a nematic phase was observed at 5 wt% and a hexagonal columnar phase at 10 wt%. The exact phase boundaries for these phases, and those for YYKLVFF–PEG3k, are yet to be mapped out. We suspect YYKLVFF–PEG3k will form a nematic phase at concentrations lower than the 10.5 wt% concentration studied. Full mapping of phase behaviour, and shear alignment, is complicated by the need for significant amounts of sample which are not readily available.
= 0.1–2 s−1 (e.g.Fig. 7b). The extent of anisotropy in the SANS pattern in Fig. 7b is lower than in Fig. 6b due to the different nature of the phases and their susceptibility to flow alignment—the nematic phase is a fluid that can readily be aligned by shear, whereas the hexagonal columnar phase is a soft gel that cannot be oriented so easily. Quantitative comparison of orientation with our previous results for FFKLVFF–PEG3k is prohibited by differences in concentration—for that sample a nematic phase was observed at 5 wt% and a hexagonal columnar phase at 10 wt%. The exact phase boundaries for these phases, and those for YYKLVFF–PEG3k, are yet to be mapped out. We suspect YYKLVFF–PEG3k will form a nematic phase at concentrations lower than the 10.5 wt% concentration studied. Full mapping of phase behaviour, and shear alignment, is complicated by the need for significant amounts of sample which are not readily available.
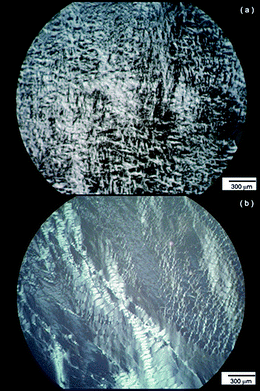 | ||
| Fig. 5 Polarized optical micrographs for (a) 8.2 wt% YYKLVFF–PEG1k and (b) 10.5 wt% YYKLVFF–PEG3k. | ||
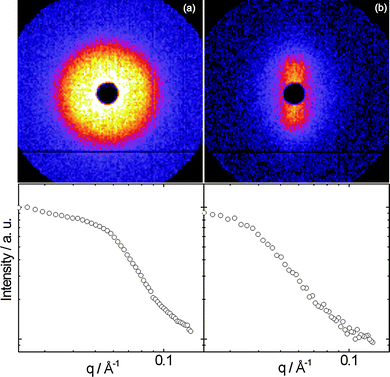 | ||
Fig. 6 Top: SANS patterns for 8.2 wt% YYKLVFF–PEG1k. Bottom: one-dimensional profiles obtained from (a) a circular sector and (b) a vertical rectangular sector integration. The SANS patterns correspond to the (a) as mounted sample or (b) sheared at ![[small gamma, Greek, dot above]](https://www.rsc.org/images/entities/i_char_e0a2.gif) = 2 s−1. = 2 s−1. | ||
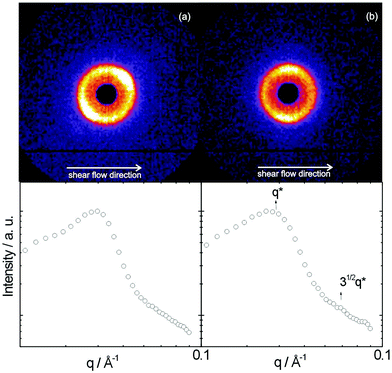 | ||
Fig. 7 Top: SANS patterns for 10.5 wt% YYKLVFF–PEG3k. Bottom: one-dimensional profiles obtained from a circular sector integration for the sample (a) as mounted and (b) sheared at ![[small gamma, Greek, dot above]](https://www.rsc.org/images/entities/i_char_e0a2.gif) = 2 s−1. = 2 s−1. | ||
2. Influence of PEG crystallization
X-Ray diffraction confirmed that PEG crystallizes during the preparation of stalks. Fig. 8 shows an XRD pattern obtained for a stalk of YYKLVFF–PEG3k. A similar XRD pattern was recorded for YYKLVFF–PEG1k. The pattern in Fig. 8 shows several powder-diffraction type rings that can be indexed to d spacings from the unit cell of PEG.31,32 A pattern obtained with a longer sample–detector distance (not shown) reveals further peaks from crystalline PEG. A strong doublet corresponding to d = 4.73 Å and d = 3.89 Å is a particular feature. The broad equatorial reflections evident in Fig. 8 at d = 11.7 Å arise from the cross-β pattern of the peptide.13,36,37 The meridional reflection expected near 4.7–4.8 Å37 from the β-strand separation distance is coincident for this sample with the strong PEG reflection at 4.73 Å.31 There is an enhancement of intensity in the meridional direction of this reflection due to the underlying peak from the β-strand spacing distance in the oriented cross-β pattern. This shows that although PEG crystallization has occurred, it has not completely disrupted the β-sheet secondary structure. We suppose that the β-sheets are confined within layers between the crystalline PEG layers, although this needs further testing by scattering experiments, etc.AFM confirms the formation of well-defined crystal lamellae of PEG, which are aligned diagonally across the image presented in Fig. 9. The line scan indicates a period of approximately 40 nm. These lamellae form part of spherulite structures that are characteristic of crystallizing polymers. These observations point to the need to circumvent drying when investigating self-assembly in solution (e.g. conventional TEM cannot be used) in order to avoid PEG crystallization.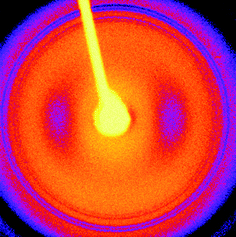 | ||
| Fig. 8 XRD pattern obtained from a dried stalk of YYKLVFF–PEG3k. | ||
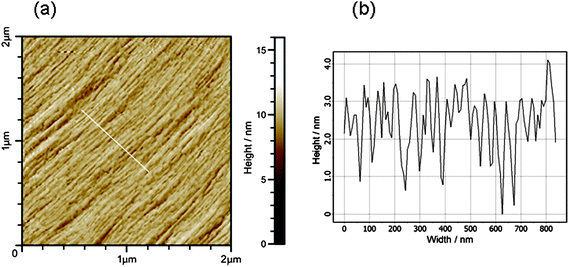 | ||
| Fig. 9 (a) AFM topography of dried film of YYKLVFF–PEG3k and (b) profile across line indicated in (a). | ||
Summary
Cryo-TEM shows that both YYKLVFF–PEG1k and YYKLVFF–PEG3k form fibrils. The diameter is similar for both samples; however, the fibrils for YYKLVFF–PEG1k have a much larger persistence length. Indeed, YYKLVFF–PEG3k self-assembles into mainly short fibrils. It is suggested that this indicates a cross-over in aggregate structure as a function of PEG molar mass. Longer PEG chains are expected to favour self-assembly into spherical micelles due to packing constraints around the short peptide core of the aggregates. The β-sheet structure is retained in the YYKLVFF–PEG aggregates, independent of shape as confirmed by FTIR and CD spectroscopy. The CD spectra suggest that β-sheet aggregates only form above a certain concentration since in very dilute solution only features associated with association of aromatic residues are observed (this is supported by fluorescence emission spectroscopy data). This suggests a possible two-step aggregation process—initial formation of aggregates with aromatic or hydrophobic interactions, followed at higher concentration by assembly into β-sheets. At higher concentration, ordering into a nematic phase was observed for YYKLVFF–PEG1k, and into a hexagonal columnar phase for YYKLVFF–PEG3k. YYKLVFF–PEG1k may also form a columnar phase, but sufficiently high concentrations were not accessible. These results may be compared to our previous observations of nematic and hexagonal columnar mesophase formation of FFKLVFF–PEG3k.15,16Drying of the sample, as required to prepare stalks for X-ray diffraction experiments, led to crystallization of PEG in YYKLVFF–PEG3k. Characteristic peaks from the PEG crystal unit cell co-exist with the cross-β pattern from the peptide. This shows the β-sheet structure is not perturbed by PEG crystallization. The formation of a lamellar structure of PEG crystallites was confirmed by AFM. These results support our previous conclusions for several related peptide–PEG conjugates concerning the influence of PEG crystallization.31,38 We showed that strong fibrillising peptides such as FFKLVFF retain β-sheet secondary structure when PEG crystallizes, although this is disrupted for more weakly fibrillizing peptides such as KLVFF. We conclude that YYKLVFF has a strong fibrillization tendency, consistent with the number of aromatic residues in the sequence.
In conclusion, YYKLVFF–PEG conjugates are model peptide–PEG systems that form core–shell fibrils and, at higher concentration, lyotropic liquid crystal phases. Incorporation of tyrosine units into the β-sheet fibril core enables future functionalization of the peptides, or creation of pH-responsive aggregates. “Filomicelles” of peptide–PEG conjugates may be useful for in vivo delivery. For instance, systems designed to recognize target peptides (e.g. the amyloid β peptide) and then deliver anti-aggregation self-recognition elements (by enzymatic cleavage of the peptide from the PEG chain) may be envisaged. We are currently pursuing this in our laboratory, using a related sample.
Acknowledgements
This work was supported by EPSRC grants EP/F048114/1 and EP/G026203/1 to IWH. We are grateful to Steve Furzeland and Derek Atkins (Unilever, Colworth, UK) for performing the cryo-TEM experiments. We are grateful to Mr Nick Spencer (Biocentre, Univ. of Reading) for assistance with XRD experiments.References
- H.-A. Klok, G. W. M. Vandermeulen, H. Nuhn, A. Rösler, I. W. Hamley, V. Castelletto, H. Xu and S. Sheiko, Faraday Discuss., 2005, 128, 29–41 RSC.
- P. S. Stayton, T. Shimoboji, C. Long, A. Chilkoti, G. H. Chen, J. M. Harris and A. S. Hoffman, Nature, 1995, 378, 472–474 CrossRef CAS.
- J. Couet, J. D. J. S. Samuel, A. Kopyshev, S. Santer and M. Biesalski, Angew. Chem., Int. Ed., 2005, 44, 3297–3301 CrossRef CAS.
- J. Nicolas, G. Mantovani and D. M. Haddleton, Macromol. Rapid Commun., 2007, 28, 1083–1111 CrossRef CAS.
- J. C. M. Van Hest, J. Macromol. Sci., Part C, Polym. Rev., 2007, 47, 63–92 Search PubMed.
- H. M. König and A. F. M. Kilbinger, Angew. Chem., Int. Ed., 2007, 46, 8334–8340 CrossRef.
- M. A. Gauthier and H. A. Klok, Chem. Commun., 2008, 2591–2611 RSC.
- H. R. Marsden and A. Kros, Macromol. Biosci., 2009, 9, 939–951 CrossRef CAS.
- H. A. Klok, Macromolecules, 2009, 42, 7990–8000 CrossRef CAS.
- T. S. Burkoth, T. L. S. Benzinger, D. N. M. Jones, K. Hallenga, S. C. Meredith and D. G. Lynn, J. Am. Chem. Soc., 1998, 120, 7655–7656 CrossRef CAS.
- L. O. Tjernberg, J. Naslund, F. Lindqvist, J. Johansson, A. R. Karlstrom, J. Thyberg, L. Terenius and C. Nordstedt, J. Biol. Chem., 1996, 271, 8545–8548 CrossRef CAS.
- T. L. Lowe, A. Strzelec, L. L. Kiessling and R. M. Murphy, Biochemistry, 2001, 40, 7882–7889 CrossRef CAS.
- I. W. Hamley, Angew. Chem., Int. Ed., 2007, 46, 8128–8147 CrossRef CAS.
- M. J. Krysmann, V. Castelletto, A. Kelarakis, I. W. Hamley, R. A. Hule and D. J. Pochan, Biochemistry, 2008, 47, 4597–4605 CrossRef CAS.
- I. W. Hamley, M. J. Krysmann, V. Castelletto, A. Kelarakis, L. Noirez, R. A. Hule and D. Pochan, Chem.–Eur. J., 2008, 14, 11369–11374 CrossRef CAS.
- I. W. Hamley, M. J. Krysmann, V. Castelletto and L. Noirez, Adv. Mater., 2008, 20, 4394–4397 CrossRef CAS.
- I. W. Hamley, Soft Matter, 2009 Search PubMed , Submitted.
- Y. Geng, P. Dalhaimer, S. S. Cai, R. Tsai, M. Tewari, T. Minko and D. E. Discher, Nat. Nanotechnol., 2007, 2, 249–255 CrossRef CAS.
- E. A. Simone, T. D. Dziubla, D. E. Discher and V. R. Muzykantov, Biomacromolecules, 2009, 10, 1324–1330 CrossRef CAS.
- Y. Talmon, in Modern Characterization Methods of Surfactant Systems, ed. B. P. Binks, Marcel Dekker, New York, 1999, pp. 147–178 Search PubMed.
- H. Cui, T. K. Hodgdon, E. W. Kaler, L. Abezgaous, D. Danino, M. Lubovsky, Y. Talmon and D. J. Pochan, Soft Matter, 2007, 3, 945–955 RSC.
- P. Baroni, C. Pujolle and L. Noirez, Rev. Sci. Instrum., 2001, 72, 2686 CrossRef CAS.
- T. Miyazawa and E. R. Blout, J. Am. Chem. Soc., 1961, 83, 713–719.
- P. Haris and D. Chapman, Biopolymers, 1995, 37, 251–263 CrossRef CAS.
- B. Stuart, Biological Applications of Infrared Spectroscopy, Wiley, Chichester, 1997 Search PubMed.
- I. W. Hamley, V. Castelletto, C. M. Moulton, D. Myatt, G. Siligardi, C. L. P. Oliveira, J. S. Pedersen, I. Gavish and D. Danino, Macromol. Biosci., 2010, 10, 40–48 CrossRef CAS.
- R. W. Woody, Biopolymers, 1978, 17, 1451–1467 CAS.
- R. W. Woody, in Circular Dichroism. Principles and Applications, ed. K. Nakanishi, N. Berova and R. W. Woody, VCH, New York, 1994, pp. 473–496 Search PubMed.
- R. W. Woody, Methods Enzymol., 1995, 246, 34–71 CAS.
- F. W. J. Teale and G. Weber, Biochem. J., 1957, 65, 476–482 CAS.
- I. W. Hamley and M. J. Krysmann, Langmuir, 2008, 24, 8210–8214 CrossRef CAS.
- V. Castelletto and I. W. Hamley, Biophys. Chem., 2009, 141, 169–174 CrossRef CAS.
- N. Tzokova, C. M. Fernyhough, P. D. Topham, N. Sandon, D. J. Adams, M. F. Butler, S. P. Armes and A. J. Ryan, Langmuir, 2009, 25, 2479–2485 CrossRef CAS.
- N. Tzokova, C. M. Fernyhough, M. F. Butler, S. P. Armes, A. J. Ryan, P. D. Topham and D. J. Adams, Langmuir, 2009, 25, 11082–11089 CrossRef CAS.
- V. Castelletto, G. E. Newby, I. W. Hamley and L. Noirez, Langmuir, 2010 Search PubMed , submitted..
- L. C. Serpell, C. C. F. Blake and P. E. Fraser, Biochemistry, 2000, 39, 13269–13275 CrossRef CAS.
- O. S. Makin, E. Atkins, P. Sikorski, J. Johansson and L. C. Serpell, Proc. Natl. Acad. Sci. U. S. A., 2005, 102, 315–320 CrossRef CAS.
- M. J. Krysmann, I. W. Hamley, S. S. Funari and E. Canetta, Macromol. Chem. Phys., 2008, 209, 883–889 CrossRef CAS.
| This journal is © The Royal Society of Chemistry 2010 |
