DOI:
10.1039/C0PY00084A
(Paper)
Polym. Chem., 2010,
1, 1302-1312
A green method for the preparation of highly stable organic-inorganic hybrid anion-exchange membranes in aqueous media for electrochemical processes†
Received
16th March 2010
, Accepted 14th April 2010
First published on 10th June 2010
Abstract
Alkaline membranes also termed as anion exchange membranes (AEMs) have recently become important materials for electrochemical technology, alkaline fuel cells, and electrolyzers. We report a simple synthesis procedure for an anion-exchange silica precursor (AESP) by epoxide ring opening reaction using 3-aminopropyltriethoxysilane (APTEOS) and glycidyltrimethylammonium chloride (GDTMAC). The AESP-poly(vinyl alcohol) (PVA) organic-inorganic hybrid AEM was prepared by the sol–gel method in acidic medium followed by chemical crosslinking of –OH groups via formal reaction. The reported method is a “green” alternative for the production of AEM without the use of any solvent residues or hazardous chemicals. This simplified procedure in aqueous media avoids the use of chloromethyl methyl ether (CME), a carcinogen and harmful to human health. These AEMs (especially AEM-70) were designed to possess all the required properties of a highly anion conductive membrane such as high water uptake (67.3%), ion-exchange capacity (1.36 mequiv g−1), and permselectivity (0.94), along with reasonable conductivity (7.61 mS cm−1) due to quaternary ammonium group functionality. Electroosmotic studies revealed quite low mass drag and equivalent pore radius (2.31–5.28 A°) of the membrane, which are also desirable properties of an efficient AEM. Electrodialytic performance of the AEM-70 membrane revealed its suitability for applications in electro-membrane processes.
Introduction
Rapid growth of chemical technology in diversified areas fuels demands for the need of reliable ion-exchange membrane (IEM) based green technologies for separation, purification and isolation of the molecules1–4 IEM technologies are non-hazardous in nature and being widely used not only for separation and purification but also for energy conversion devices, storage batteries and sensors etc. IEMs were classified into anion-exchange membranes (AEMs) and cation exchange membranes CEMs) depending on the types of ionic groups attached to the membrane matrix.5,6 AEMs were used in various processes such as: electrodialysis, diffusion dialysis, Donnan dialysis, bipolar membrane electrodialysis, membranes, ion separation and substitution, fuel cell and electrical batteries.2,5,6–10 Thus, it is urgent to develop an eco-friendly method for the preparation of AEM.11 Several types of polymers, such as poly(2,6-dimethyl-1,4-phenylene oxide) (PPO), copolymer of chloromethylstyrene and divinylbenzene, PVDF-vinylbenzyl chloride, and poly(vinyl alcohol)-poly(1,3-diethyl-1-1-vinyl imidazolium bromide), were used for the preparation of AEMs.12–21 Various AEMs were prepared via chloromethylation of polysulfone, poly(etherimide), and Cardo poly(ether sulfone) based polymers using chloromethyl ether (CME) followed by amination with a tertiary amine.8,22–25 Preparation of these AEMs required more complicated procedures: chloromethylation and quaternary amination. In particular, in chloromethylation, the CME used is carcinogenic and potentially harmful to human health.26–28 Alternatively, copolymer of chloromethylstyrene and divinylbenzene with different amines, such as trimethylamine (TMA) and organic-inorganic nanocomposite membrane based on 4-vinylpyridine, were reported in the literature.29–31 Chloromethylstyrene is very expensive, which dramatically increases the manufacturing costs of the membrane. Furthermore, the above-mentioned AEM preparation methods involve the use of expensive solvents and hazardous chemicals. Moreover, a membrane (thin film) was obtained by a solution casting method in suitable solvent and further evaporation of solvent during drying.
Stability and durability of an AEM are the most desired properties along with its excellent physico- or electro-chemical properties. Organic-inorganic hybrid materials are currently the objects of intensive research, because they combine in a single solid both the attractive properties of a mechanically and thermally stable inorganic backbone and the specific chemical reactivity and flexibility of the organo-functional group.32–35 Reports are available for the preparation of hybrid IEMs by doping or blending of inorganic fillers (acid or oxide) in organic polymer matrix.36,37 In this heterogeneous type of AEM, inorganic particles are not homogeneously distributed in the polymer matrix, and so on. Furthermore, in solution casting (use of solvent) preparation, leaching out of organo-functional groups from membrane matrix and loss of mechanical stability are serious problems for their practical applications. To avoid these problems, different silanes or metal alkoxide were used as precursors to tailor an interpenetrating network between organic and inorganic phase by sol–gel.38,39 Good compatibility between two components (organic and inorganic) was achieved by covalent bonding. Also, hybrid membrane can be developed in aqueous media rather than organic solvent.
To date, no report is available for the preparation organic-inorganic hybrid AEM in aqueous media, followed by cross-linking to achieve better membrane stabilities. For hybrid AEMs flexibility was achieved by optimization of inorganic content (AESP) and better co-relation between membrane electro-chemical properties and stabilities was established.
Herein, we are reporting a completely green preparation procedure for AESP precursor using glycidyltrimethylammonium chloride (GDTMAC) (active electrophilic reagent)40 and aminopropyltriethoxy silane (APTEOS) via electrophilic ring opening reaction. Developed AESP was used to prepare organic-inorganic hybrid AEM by sol–gel in aqueous media using poly(vinyl alcohol) (PVA) (low cost, water-soluble, good film forming nature and availability of highly reactive hydroxyl groups).41 Reported method avoids the use of any solvent or hazardous chemical, and is green in nature. Developed AEMs were characterized for their physico-chemical and electro-chemical properties. Electrodialytic performance was also assessed for ion-separation.
Experimental
Materials
APTEOS, glycidyltrimethylammonium chloride (GDTMAC), and tetraethoxysilane (TEOS) were obtained from Sigma Aldrich Chemicals. Poly(vinyl alcohol) (PVA, Mw: 125000; degree of polymerization: 1700, degree of hydrolysis: 88%), methanol, formaldehyde, hydrogen peroxide, Na2SO4, NaCl etc. of AR grade were received from S.D. fine chemicals, India, and used without any further purification. Double distilled water was used in all experiments.
Synthesis of AESP and membrane preparation
AESP was synthesized by epoxide ring opening reaction (Scheme 1). In a typical synthetic procedure, 1![[thin space (1/6-em)]](https://www.rsc.org/images/entities/char_2009.gif) :
:![[thin space (1/6-em)]](https://www.rsc.org/images/entities/char_2009.gif) 1 mole ratios of APTEOS and GDTMAC were stirred at 80 °C for 6 h. Thus, obtained transparent solution of AESP was assessed by 1H NMR and FTIR. AESP-PVA hybrid AEM was prepared by the sol–gel method in acidic medium followed by chemical crosslinking of –OH groups via formal reaction (Scheme 2). A 10 wt% of PVA was dissolved in 100 ml of distilled water under stirred conditions and desired quantity of AESP was added to the solution. The resulting mixture was stirred at room temperature for 1 h to get a clear solution. Then, a predetermined amount of TEOS was added and pH was maintained at 2.0 under stirred conditions for 12 h at room temperature (30 °C), to hydrolyze the alkoxy groups of silica precursor. Obtained highly viscous white colored gel was transformed into thin film on a cleaned glass and dried under IR lamps at ambient temperature for 24 h followed by vacuum drying at 60 °C (24 h). Obtained thin film of desired thickness was cross-linked by formal reaction in HCHO + H2SO4 at 60 °C for 2 h. Resultant membrane was washed thoroughly by double distilled water and conditioned by equilibration in 1.0 M HCl and NaOH solutions, successively. Conditioned membrane was converted into Cl− form by equilibrating in 1.0 M NaCl solution for 12 h. The equilibrated membranes were stored in double distilled water for further characterizations. Developed membranes were designated as AEM-X, where X is wt% of AESP (X: 50, 60 and 70 wt% of AESP).
1 mole ratios of APTEOS and GDTMAC were stirred at 80 °C for 6 h. Thus, obtained transparent solution of AESP was assessed by 1H NMR and FTIR. AESP-PVA hybrid AEM was prepared by the sol–gel method in acidic medium followed by chemical crosslinking of –OH groups via formal reaction (Scheme 2). A 10 wt% of PVA was dissolved in 100 ml of distilled water under stirred conditions and desired quantity of AESP was added to the solution. The resulting mixture was stirred at room temperature for 1 h to get a clear solution. Then, a predetermined amount of TEOS was added and pH was maintained at 2.0 under stirred conditions for 12 h at room temperature (30 °C), to hydrolyze the alkoxy groups of silica precursor. Obtained highly viscous white colored gel was transformed into thin film on a cleaned glass and dried under IR lamps at ambient temperature for 24 h followed by vacuum drying at 60 °C (24 h). Obtained thin film of desired thickness was cross-linked by formal reaction in HCHO + H2SO4 at 60 °C for 2 h. Resultant membrane was washed thoroughly by double distilled water and conditioned by equilibration in 1.0 M HCl and NaOH solutions, successively. Conditioned membrane was converted into Cl− form by equilibrating in 1.0 M NaCl solution for 12 h. The equilibrated membranes were stored in double distilled water for further characterizations. Developed membranes were designated as AEM-X, where X is wt% of AESP (X: 50, 60 and 70 wt% of AESP).
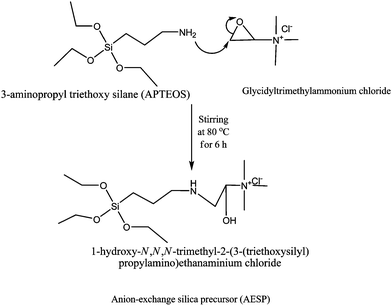 |
| | Scheme 1 The synthetic reaction route for the preparation of anion-exchange silica precursor (AESP). | |
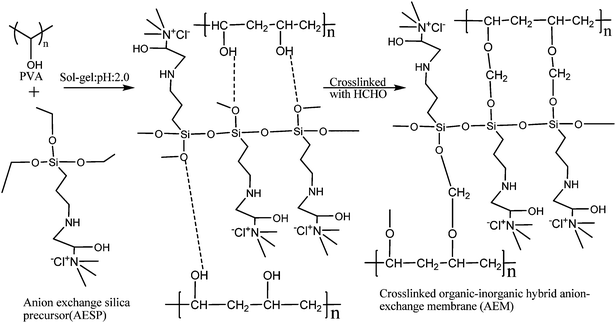 |
| | Scheme 2 A schematic of the route for the preparation of organic-inorganic hybrid anion-exchange membrane (AEM). | |
Instrumental analysis
The 1H NMR and 13C NMR spectrum of synthesized AESP were recorded in D2O by NMR spectrometer (Brüker, 500 MHz). FT-IR spectra of AESP was recorded KBr technique, while for dried membranes by ATR technique with spectrum GX series 49387 spectrometer in the range of 4000–600 cm−1. The elemental analysis (CHNS) was carried out using Perkin-Elmer-2400 CHNS analyzer. Scanning electron microscopy (SEM) images of the dried membranes were recorded using a LEO Instruments (Kowloon, Hong Kong) microscope after the gold sputter coatings on desired membrane samples. Transmission electron microscope (TEM) analysis was performed by JEOL 1200EDX with a tungsten filament electron source operated at an accelerating voltage up to 120 kV. The membranes samples were prepared by cutting them into slices using a microtone after molding them with epoxy.
The thermal degradation processes and stabilities of the membranes were investigated using a thermogravimetric analyzer (TGA, Mettler Toledo TGA/SDTA851 with Starc software) under N2 atmosphere with a 10 °C min−1 heating rate in the temperature range from 50 to 600 °C. Differential scanning calorimetry (DSC) measurements were carried out in a temperature range of 30–400 °C with a heating rate of 5 °C min−1 to assess the glass transition behavior. The freezing (loosely bound and free water) water and non-freezing (bound water) water in the membrane were analyzed by performing DSC using a low temperature measuring head and liquid nitrogen- cooled heating element. The state of water in the membrane was detected by the melting transition in DSC measurements as described elsewhere.35 The dynamic mechanical stabilities of the hybrid membranes were evaluated by using a Mettler Toledo dynamic mechanical analyzer 861c instrument with Starc software under nitrogen with a heating rate of 10 °C min−1 from 30 to 300 °C to observe the effect of the silica content on membrane mechanical stability. Wide angle X-ray diffractograms (WXRDs) of the developed membranes were recorded using a Philips Xpert X-ray diffractometer with Cu-Kα (1.54056) radiation.
Physicochemical characterizations
The detailed procedures for the determination of water uptake and ion-exchange capacity (IEC) are given in section S1 of the ESI.† The water retention ability of the developed membranes was evaluated by measuring water mobility during the dynamic deswelling test.35 Fully swollen membranes were placed in desicator containing silica gel at 40 °C and were weighed after regular time intervals. The weight of fully swollen membranes (Wwet), weight of membrane at time t (Wt), and weight of dry membrane (Wdry) were recorded. The deswelling profile was obtained by (Mt/M0)-time curves using the following equation:| |
 | (1) |
where M0 is the initial amount of water in membrane (M0 = Wwet − Wdry), and Mt is the amount of water remaining in the membrane at any given time (Mt = Wt − Wdry), D is water diffusion coefficient, and l is the membrane thickness.
Dimensional stability was examined by immersing square pieces of the membranes into water at room temperature for 24 h as reported previously.42 Oxidative stability was evaluated by immersing the membrane samples in Fenton's reagent (3% H2O2 aqueous solution containing 3 ppm FeSO4) at 80 °C for 1 h as reported previously. For the hydrolytic stability test, a small piece of membrane (30 μm) was boiled in water for 24 h at 100 °C in a pressurized closed vial. The stability was evaluated by weight loss, IEC, and the physical appearance of the test samples.42
Electrochemical characterizations
The counter ion transport number in the membrane phase was obtained by Hittorf method, and detailed procedure is included in section S2 of the ESI.†43 Membrane conductivity measurements for AEMs equilibrated in NaCl solutions of different concentrations were carried out using a potentiostat/galvanostat frequency response analyzer (Auto Lab, Model PGSTAT 30, EcoChemie, B.V. Utrecht, The Netherlands). The membranes were sandwiched between in-house made stainless steel circular electrodes (4.0 cm2). Direct current (dc) and sinusoidal alternating currents (ac) were supplied to the respective electrodes for recording the frequency at a scanning rate of 1 μA s−1 within a frequency range of 106–1 Hz.3
Electro-osmotic permeability measurements were carried out in two-compartment cell (25 cm3), made of acrylic glass and separated by AEM (24.0 cm2), as reported earlier.45
Ion separation efficiency of developed AEMs were assessed by electrodialysis (ED) using in-house prepared cell.45 Sulfonated poly ether sulfone (PES) based cation-exchange membranes (CEM), reported earlier (method of preparation, physicochemical and electrochemical properties, are included in Table S2 (ESI)† was used in these experiments.2,3 The schematic diagram of the ED cell is presented in Fig. S1 (ESI).† The parallel-cum-series flow arrangement was used to monitor each flow stream in respective compartments. Na2SO4 solution (0.10 M) was recirculated in both electrode wash (EW) compartments, separately. Initially, NaCl solution of known concentration (0.2 M) and volume was fed into dilute compartment (DC), while distilled water was fed into concentrate compartment (CC). Peristaltic pumps were used to feed the solutions (500 cm3) in a recirculation mode into the respective compartments with constant flow rate (0.012 m3 h−1) to maintain the turbulence. A dc power supply (Aplab India, model L1285) was used to apply constant potential across the electrodes and the resulting current variation was recorded as a function of time using a digital multimeter in series. Change in conductivities and pH of DC and CC output were regularly monitored by placing the conductivity and pH electrodes in the respective containers during all the experiments.
Results and discussion
Synthesis of AESP and membrane preparation
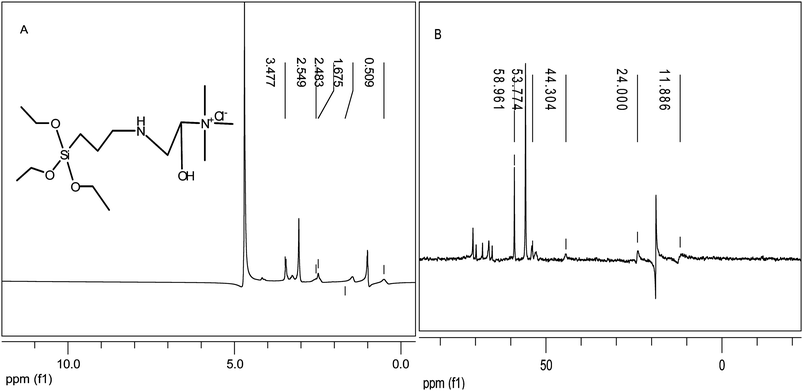
AESP was synthesized via epoxide ring opening with –NH2 group according to Scheme 1. Protons were transferred from amine groups of APTEOS to epoxide rings of GDTMAC, forming a secondary alcohol (AESP) by covalent bonding. 1H and 13C NMR spectra of AESP are presented in Fig. 1 (A and B). 1H NMR spectra of AESP (Fig. 1A) showed shift at 0.509 ppm, which was assigned to the –Si–CH2– proton. Shifts at 1.675 and 3.477 ppm, were attributed to –NH and secondary –OH. Different methylene protons were observed at 2.483 and 2.549 ppm. Moreover, the chemical shift at 3.477 ppm was assigned to protons of –N+(CH3)3 and –OCH3 groups. Epoxide ring opening was confirmed by −CH(OH)–N+– proton (4.8 ppm). In 13C NMR spectra (Fig. 1B), peaks at 11.886 ppm and 24.000 ppm were assigned to –Si–CH2– and –Si–CH2–CH2– carbon, respectively. Also, peaks at 44.304, 53.774 and 58.961 ppm were assigned to the carbon of –N+(CH3)3, –CH2NH and –OCH2 groups attached to silica present in quaternized AESP.
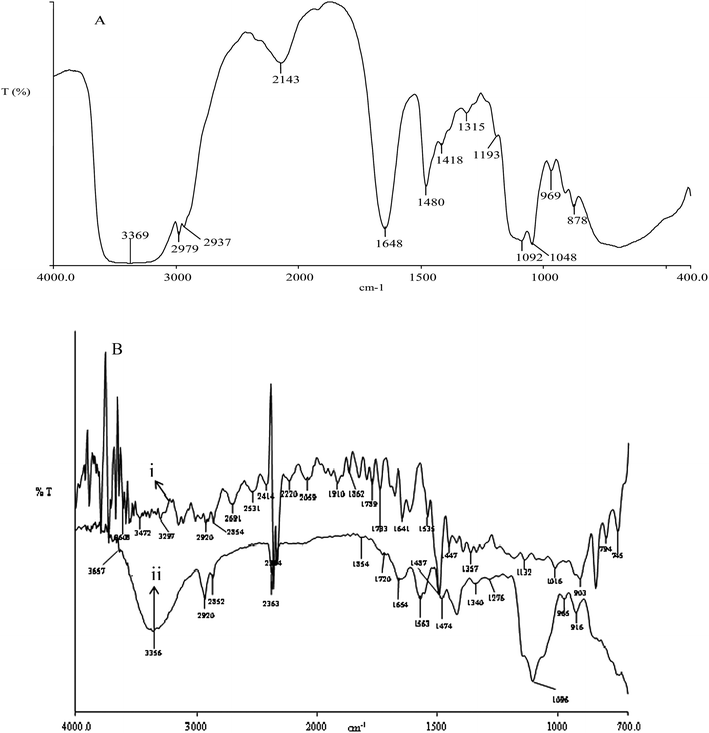
In Fig. 2(A), the stretching vibrations at 2937, 1648, and 1480 cm−1 were assigned to the quaternary ammonium groups presents in the AESP.3 Stretching vibrations at 2979 and 1033 cm−1 were assigned to –CH3 groups (asymmetric vibration and (–O–Si–O– asymmetric stretching vibrations).44 The membrane forming material was prepared by acid catalyzed sol–gel and condensation polymerization of AESP and PVA in aqueous media. The obtained gel was cast into membrane form and dried at room temperature under an IR lamp followed by at 60 °C in vacuum oven. The transparent water soluble thin film was cross-linked by formal reaction (two steps process) for 2 h at 60 °C. The formaldehyde reacts with −OH group of PVA and formed hemiacetal in first step. This hemiacetal undergoes further reaction with another hydroxyl group and resulted to the acetal formation in second step. Due to cross-linking, the membrane lost transparency in wet conditions, while it was retained in dry state. Organic-inorganic hybrid AEMs were prepared by acid catalyzed sol–gel and both segments (organic and inorganic) were joined either by covalent bonding or hydrogen bonding. ATR-FTIR spectra of non cross-linked and cross-linked AEM are presented in Fig. 2(B). Absorption bands at ∼3472–3356 cm−1 was attributed to –OH stretching vibration. Also, absorption bands at 2920 cm−1 arose due to –CH2 stretching vibration and weak absorption band at 1447–1474 cm−1 corresponded to –OCH2 deformation and wagging vibration. Peaks around 1654–1535 cm−1 confirmed the presence of quaternary ammonium group, while at 3356–3297 cm−1 for quaternary ammonium salt.44 The cross-linked structure of membrane was confirmed by cyclodiether (–C–O–C–) at 1016 cm−1.44 The absorption bands at 1132 cm−1 (characteristic Si–O–Si asymmetric stretching and Si–O–C) indicated molecular level hybridization organic and inorganic segments. In acidic condition, PVA reacted with cross-linking agent (formaldehyde) and silanol groups resulting C–O–C (1357 cm−1) and Si–O–C groups. The formation of Si–O–C and C–O–C groups, favor the better compatibility between two segments with homogenously molecular level distribution of silica, responsible for highly thermal and mechanical stable membrane. Prepared membranes were cross-linked using formaldehyde in H2SO4 and schematic structure of organic-inorganic hybrid AEM are presented in Scheme 2, which was also confirmed by elemental analysis (CHN): C: 53.28%, H: 5.27%, N: 3.95%.32
An SEM image of AEM-70, a representative case, is presented in Fig. S2(A) (ESI).† Some aggregation and roughness of the membrane surface were observed because of the accelerated hydrolysis of the silica precursor. There was no evidence found for phase separation, cracks or holes on the membrane surface. The dense nature of developed membrane was also confirmed surface and cross section TEM images (Fig. S2 (B and C), ESI†). Homogeneous distribution of silica particles in membrane matrix was also observed because of their sol–gel preparation.
Membrane stabilities
The membrane’s stability and durability under strong oxidative and thermal conditions are very important to explore for their practical application in electrochemical processes. The formation of ˙OH and ˙OOH radicals took place under strong oxidative conditions, which attacks on the hydrogen containing bonds. Thus oxidative stability for AEMs is also equally critical, like proton exchange membranes. Oxidative stability of the membrane was evaluated by measuring its weight, IEC and conductivity loss after treatment with Fenton reagents (Fe2+–H2O2) for 1 h at 80 °C and results are presented in Table S2 (ESI).† At high temperature, more efficient peroxy radical attack occurs in the proximity of the hydrophilic domains. Results revealed reduction in weight loss with AESP content in the membrane matrix. Silica formed cross-linked network blocking ˙OH containing hydrophilic pores. Very short life time of ˙OH or ˙OOH radicals, restricted them inside penetration in siloxane containing domains.35 Increase in AESP content enhanced cross-linking and compactness of the membranes, thus results lower weight loss. These membranes showed around 9.42% IEC loss (AEM-70) may be due to partial de-functionalization, which was further supported by loss in membrane conductivity (2–3%) under these conditions.
Developed hybrid AEMs were also subjected to accelerated hydrolytic stability testing at 100 °C and 100% RH for 24 h. Membranes maintained their transparency, flexibility and toughness. Hydrolytic stability results explained in terms of weight, IEC and conductivity loss are included in Table S1 (ESI).† Increase in the AESP content in the membrane matrix also gradually enhanced the weight, IEC and conductivity loss values. Thus, optimization of AESP content in the membrane matrix and its oxidative and hydrolytic stabilities is essential because of hydrophilic siloxane domains with functional groups, which were mainly affected.
The TGA curves for AEM-50 and AEM-70 membranes are depicted in Fig. S3 (ESI).† The thermograms showed two steps of weight loss. In the first step, membrane lost water absorbed in its matrix. In the second step, degradation of quaternary ammonium group along with membrane matrix occurred.45 Rate of water loss from the membrane reduced with AESP content because of increase in hydrophilic functional groups. Beyond 290 °C, rapid decomposition of membrane samples completed up to 460 °C. AEM-70 membrane (high AESP content) exhibited comparatively slow decomposition rate due to the formation of silica cluster. AEM-70 left maximum about 8.7% char, while AEM-50 showed comparatively low char (∼5.9%) of initial weight. Thus functionalization at inorganic part (silica) improved thermal stabilities of the membranes, and cross-linking that provides better stabilities of the developed membranes.
Fig. S4 (ESI) shows the DSC thermograms in N2 environment for AEMs with varied AESP content.† The first endothermic peak (Tg) for uncross-linked AEM-50 was 99.2 °C, which was increased to 101.75, 105.77 and 107.12 °C because of cross-linking for AEM-50, AEM-60 and AEM-70, respectively. Thus the incorporation of AESP in the PVA matrix had profound effect on Tg values.32–35 The variations in Tg may be explained by plasticizing effect and cross-linking between AESP. Intermolecular cross-linking of AESP altered the ordered arrangement of PVA in the membrane matrix.
The dynamic mechanical behavior of different AEMs at 10 N applied force and 1 Hz frequency is depicted in Fig. S5 (ESI).† The Young modulus of the developed membranes increased with AESP content, because of the formation of a continuous network structure between AESP and PVA in the membrane matrix. The cross-linking density (ρ) of the developed membranes was calculated from the network theory of rubber elasticity using the following equation:35
| |
 | (2) |
where the young modulus,
E′, was determined from the measurements with a dynamic mechanical analyzer under 10 Hz frequency at 40 °C temperature,
d is the membrane density,
φ is the front factor (where
φ) 1),
R is universal gas constant, and
T is absolute temperature. Variations of
E′ with
ρ for different AEMs are depicted in
Fig. 3. For different AEMs,
E′ values increased while
ρ decreased with the AESP content in the membrane matrix. These variations may be explained by the formation of cohesive domains due to the reaction between PVA and
silica, which was more predominant than cross-linking with
formaldehyde. Thus it is necessary to optimize the AESP content in the membrane matrix and its cross-linking density and storage modulus for achieving better mechanically stable hybrid membranes. The effect of
silica content on the crystallinity of PVA and the structural change induced due to the presence of AESP in the membrane matrix were also investigated by WXRD (Fig. S6, ESI
†) for different AEMs. AEMs with varied AESP content exhibited typical peaks at 18–20° and confirmed semi-crystalline nature of the membranes. Furthermore, the peak intensity decreased with increase in AESP content. These results revealed destruction of crystalline region due to interaction between the silica and PVA. Broad peaks indicated homogeneity and compatibility between two segments of the hybrid membranes.
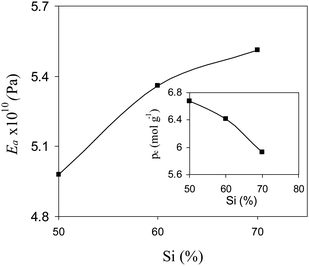 |
| | Fig. 3 Effect of AESP content on young modulus and crosslinking density of organic-inorganic hybrid AEMs. | |
Membrane water uptake, swelling and water retention ability
The water uptake and swelling properties (volume expansion in water) of the developed membranes were presented in Table 1. In general, membrane with same degree of crosslinking and composition absorb the same amount of water, where the density of ionizable groups is the same throughout the membrane matrix.3 Increase in ϕw with AESP content in the membrane matrix was observed due to the availability of more number of water molecules per ionic sites (λW).
Table 1 Water uptake, ϕW, swelling properties (volume expansion in water), φw, number of water molecules per ionic sites, λW, and water diffusion coefficient, D, values for the different hybrid AEMs
| Membrane |
ϕ
w
(%) |
φ
w
|
λ
w
/ionic sites |
D × 10−5/cm2 s−1 |
| AEM-50 |
25.4 |
21.82 |
10.2 |
3.04 |
| AEM-60 |
33.1 |
33.23 |
13.5 |
3.91 |
| AEM-70 |
67.3 |
38.64 |
21.2 |
4.00 |
The water vapor sorption and water diffusion properties of IEMs affect their conductivity and thus are important for electrochemical applications. The water retention capability of developed membranes was illustrated in Fig. 4 (A) ((Mt/Mo)–t (time) curves). The value of k (constant) was derived from (Mt/Mo)-t1/2 curves (Fig. 4 (B)) based on Higuchi's model for water desorption kinetics.35
The obtained straight lines for different AESP content and constant cross-linking time were fitted to Higuchi's model, and suggested a diffusion controlled mechanism for water desorption. The rate of water desorption decreased with AESP content. Thus, AESP acted as a binder for
water in the membrane matrix due to inter- and intra-molecular interaction. The free
water in ionic membrane
matrix (–
+N(CH
3)
3 groups) is less mobile, which indicated more bound
water in the hydrophilic domains of the membrane and less appropriate for its dehydration. The diffusion coefficient of
water in the membrane phase was evaluated from a best-fit normalized mass change (
Table 1) suggested that AESP acted as a water release barrier and improved water retention capacity even at high temperature.
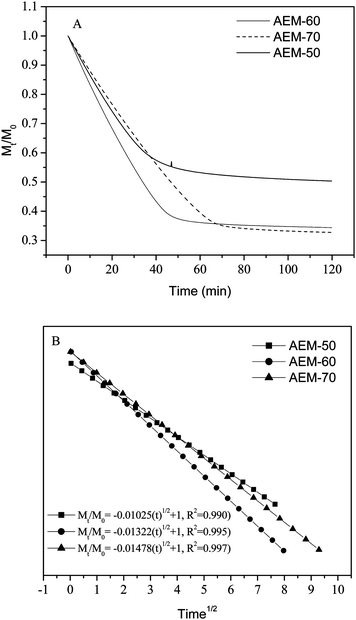 |
| | Fig. 4 Water desorption profiles of hybrid AEMs with different AESP contents: (A) desorption behavior, (B) Higuchi's model fit of the deswelling behavior. | |
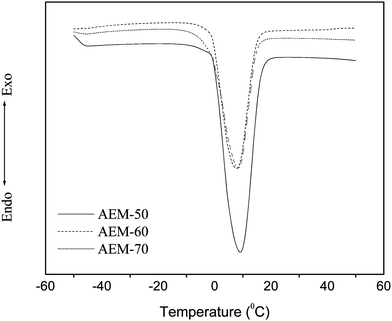 |
| | Fig. 5 DSC heating thermograms of hybrid AEMs in fully hydrated state. | |
Table 2 Enthalpy of melting, ΔHm, melting temperature, Tm, full width at half-maximum of the melting peak, ΔTm, number of free water molecules per ionic site, λf, number of bound water molecules per ionic sites, λb, and degree of bound water, χ
| Membrane |
ΔHm/J g−1 |
T
m
/°C |
ΔTm/°C |
λ
f
|
λ
b
|
χ (%) |
| AEM-50 |
5.30 |
0.18 |
20.1 |
1.77 |
21.2 |
85.5 |
| AEM-60 |
5.90 |
0.31 |
17.8 |
1.96 |
13.5 |
83.5 |
| AEM-70 |
10.5 |
0.32 |
17.3 |
3.50 |
10.2 |
82.6 |
The number of free water molecule per ionic site (λf) in the wet membrane was obtained from the total melting enthalpy by integration of the peak area of the melting curves presented in Fig. 5. The number of bound water molecules per ionic sites (λb) was obtained from subtraction of number of freezing water molecules from total number of water molecules per ionic sites. The degree of bound water (%) (χ = λb/λw) was estimated from the ratio of number of bound water molecules per ionic sites to the number of total water molecules per ionic sites. Estimated values of λf, λb, and χ for different membranes are also included in Table 2. The free water molecules in the membrane increased, while the bound water decreased with the increase in silica content because of more available ionic sites for binding. Developed AEMs showed reduction in bound water degree with AESP precursor because of strong interaction between ionic groups and water molecules.
Membrane IEC and permselectivity
IEC revealed about ionic charge nature of the membrane in terms of equivalent of functional groups present in per unit dry weight and is responsible for the exchange of OH−, in case of AEM. Membranes showed 1.24–1.36 mequiv. g−1 IEC values (Table 3). An increase in IEC with AESP content in the membrane matrix was attributed to the availability of more ionic sites.45 IEC values along with the water uptake can also be used for the estimation of net surface charge concentration (χm) of the membrane in the units of (moles of sites)/(unit volume of wet membrane).3χm values were also increased with AESP content in the membrane matrix (Table 3). This observation further evidenced the increase in exchangeable functional groups with increase in AESP content in membrane matrix.
Table 3 Membrane counter ion transport number, tm−, membrane permselectivity, Ps, ion-exchange capacity, IEC, membrane conductivity, κm, surface charge concentration, χm, and activation energy, Ea values for hybrid AEMs
| Membrane |
t
m
−
|
P
s
|
IEC/mequiv. g−1 |
χm/m mol dm−3 |
κ
m
/mS cm−1 |
Ea/kJ mol−1 |
| AEM-50 |
0.91 |
0.86 |
1.24 |
0.35 |
5.94 |
12.4 |
| AEM-60 |
0.93 |
0.89 |
1.32 |
0.38 |
6.55 |
11.6 |
| AEM-70 |
0.96 |
0.94 |
1.36 |
0.41 |
7.61 |
10.9 |
The permselectivity (Ps) is a measure of the characteristic difference in the membrane permeability for counter ions and co-ions. Counter ion transport number (tm−) across the membranes was estimated by Hittorf method (the detailed method is given in section S2 of the ESI†).43 The tm− and Ps values for different AEMs are also presented in Table 3. The results clearly show that a rapid change in the membrane permselectivity with varying AESP content in the membrane matrix. Low AESP content and thus lower Donnan exclusion due to surface charge concentration may be responsible for the observed low permselectivity (0.86) for AEM-50. While AEM-70 showed 0.94 permselectivity, which adjacent to ideal AEM, known till date.3 The permselectivity arises due to the nature of the membrane for discrimination between counter ions and co-ions. This type of discrimination arises because of the nature and magnitude of the surface charge density in the membrane matrix. At high AESP content (AEM-70), relatively high surface charge concentration in the membrane matrix is responsible for higher membrane permselectivity.
Membrane conductivity
Membrane resistance Rm (Ω) was measured in equilibration with 0.1M NaOH solution and membrane conductivity (κm) was estimated by the following equation:45,46| |
 | (4) |
where, Δx is the thickness of the wet membrane (electrodes spacing), Rm is the membrane resistance, and A is the effective membrane area. The membrane resistance was determined from Nyquist plots (Fig. S7, ESI†) using the fit and simulation method. The effect of AESP content on the membrane conductivity is also presented in Table 3. The increase in κm with AESP content in the membrane matrix may be attributed to: (i) an increase in membrane IEC and water uptake; (ii) enhanced basic domain due to hydrophilic –N+(CH3)3 functional groups for OH− migration. It seems that these factors were mainly responsible for increase in membrane conductivity. Fig. 6(A) shows the variation of κm with enthalpy of melting (ΔHm) in equilibration with 0.1M NaOH solution. ΔHm depends on the free water present in the membrane matrix.17 Thus, high extent of free water in the membrane matrix is essential for easy conduction of counter-ions (OH−) through the membrane. Membrane conductivity observations reveal the necessity for designing an AEM with high extent of free water in the membrane matrix suitable for an electrochemical process.
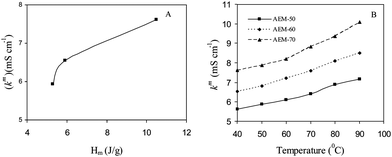 |
| | Fig. 6 The variation of membrane conductivity in equilibration with NaCl solution (0.1 M) with: (A) Hm; (B) temperature, for different hybrid AEMs. | |
Generally, in electrochemical processes, temperature increases due to water splitting because of side electrode reactions. Thus, study of conductivity dependency on membrane operating temperature is equally essential. Fig. 6(B) shows Arrhenius plots for prepared AEMs. All membranes exhibited positive temperature-conductivity dependencies, which suggested a thermally activated conduction process in the experimental temperature range from 30 to 90 °C and follows the Arrhenius behavior for Cl− transport. The apparent activation energy (Ea) for Cl− conduction were determined from the slope of the Arrhenius plot and ranged between 10.9–12.4 kJ mol−1 (Table 3). Relatively low Ea values for AEM-70 may be explained by fast Cl− and water molecule diffusion resulted in a rapid conduction process, due to the more continuous pathway because of interlinking of hydrophilic channels. Furthermore, comparable Ea values of prepared AEMs and Nafion117 membranes (6.14 kJ mol−1)35 indicated their suitability of thermal activated conduction process useful in high temperature electrochemical applications.
The effect of pH in equilibrating solution on membrane properties was also explored by measuring κm and ϕw values in the pH range 1–12 and relevant data are presented in Fig. 7. It was observed that the membrane showed good properties and stability in equilibration with pH range 5–12, which is the case for general electro-membrane processes. Thus developed membranes are suitable for practical application in the higher pH range. Membrane conductivity for hybrid AEM-70 was compared with different AEM reported earlier in the literature and found to be comparatively high under similar experimental conditions.45 Generally, different AEMs recommended for diversified electromembrane processes showed 0.74–4.30 mS cm−1 conductivity,47–49 while prepared AEM-70 exhibited relatively high conductivity (7.61 mS cm−1) under similar experimental conditions. Furthermore, green and simple preparation methodology for these membranes is additional attractive features, which are uncommon for membranologists. Moreover, for the development of a successful IEM, knowledge of ionic transport along with mass (solvent) across it is also essential, which affects the membrane efficiency in the desired electrochemical processes.
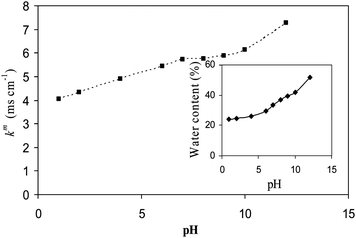 |
| | Fig. 7 The variation of κm and ϕw for AEM-70 with pH of the equilibrating solution (0.1M NaCl). | |
Electro-osmotic permeability
Study on electro-osmotic transport of mass (solvent) through IEMs revealed better understanding of the mass cross-over or electro-osmotic drag. Knowledge of ions and solvents transport rates across the membranes under applied electric gradient is necessary for intelligent designing of a membrane for a desired process.50 Electro-osmotic flux across IEM aroused due to: (i) the availability of ionic sites in the membrane matrix and (ii) the existence of an electrical potential at the membrane–solution interface called zeta potential.51–53 The electro-osmotic flux across prepared AEMs in equilibration with NaCl solutions (0.01 M) was measured and plotted as a function of applied current (Fig. S8, ESI†). Electro-osmotic drag (β) (implies that every coulomb of electricity will exert a drag sufficient to carry β cm3 of water through 1 cm2 of the membrane area) was estimated from the slope of obtained straight lines. Equivalent pore radii (r) of the membranes were estimated from Katchalsky and Curran approach:53| |
 | (5) |
where F is the Faraday constant, η denotes the coefficient of viscosity of the permeate, and f01w is the frictional coefficient between counter-ion and water in free solution, which can be defined as f01w = RT/Di, (where Di is the diffusion coefficient of the single ion (i) in the free solution, R is the gas constant, and T is absolute temperature). The ionic diffusion coefficient (Di) at a given electrolyte concentration was obtained from ionic conductivity data.54 Equivalent pore radii (r) for different AEMs increased with AESP content in the membrane matrix (Fig. 8). r values increased with the increase in AESP content in the membrane matrix. Measured equivalent pore radius (2.31–5.28 A°) of these membranes suggested their quite dense nature. An increase in availability of ionic sites or surface charge concentration in the membrane matrix by incorporating AESP (Table 3) is mainly responsible for increase in equivalent pore radius of the membrane. The increase in pore radius enhanced the mass transfer (solvent) by electro-osmotic drag across the membrane. Furthermore, 1.36 m equiv. g−1 IEC, 7.61 mS cm−1 conductivity and 0.94 permselectivity for AEM-70 facilitate its suitability for diversified electro-membrane processes.
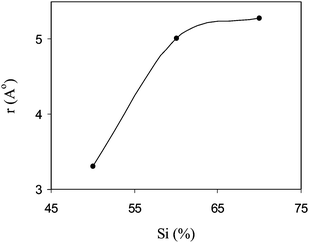 |
| | Fig. 8 The variation of equivalent pore radius (r) with AESP content in the membrane phase in equilibration with 0.02M NaCl solution. | |
Electrodialytic performance of the membranes
The i–v curves for the prepared AEMs were recorded in equilibration with 0.1M NaCl solution (Fig. 9). These curves showed three typical characteristic regions viz. Ohmic, non-Ohmic, and plateau length regions (defined in Fig. S9, ESI†). These regions reveal the informations regarding ionic migration and concentration polarization phenomenon under applied electric conditions across IEMs.55 Characteristics values of ΔV, Δi and Ilim (derived from the i–v curves) were included in Table 4, which showed dependency on AESP content in the membrane matrix. AEM-70 membrane (highly charged) exhibited relatively higher ΔV and Δi values, because of high electro-transport of counter-ions from diffusive boundary layer to membrane matrix, which further led concentration polarization. Counter-ion concentration difference across on the interfacial zones of an IEM created concentration polarization. Since, tmi > tsi (counter-ion transport number in solution), i.e. their flux in the membrane (Jmi) is always larger than in the boundary layer because tmiis proportional to the Jmi(Jmi = tmiI/Fzi).56,57 The limiting current correspond to concentration polarization (Ilim) may be defined as:| |
 | (6) |
where zi is electro-valence of the counter-ion; Di is the diffusion coefficient of counter-ion in solution; Cb is bulk concentration of electrolyte solution, Cm is the counter-ion concentration at the membrane–solution interface, and δ is the thickness of the boundary layer. For membrane with constant charge concentration, Ilim mainly depends on tmi of the membrane under constant turbulence or boundary layer thickness (δ). AEM-70 membrane showed limiting current about 1.28 mA cm−2 (Ilim) and plateau region about 2.2 V demonstrated efficient electrodialytic performance for these membranes.
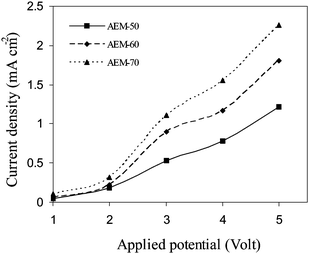 |
| | Fig. 9 Current voltage characteristics of hybrid AEMs in equilibration with NaCl (0.1M) solutions. | |
Table 4 Characteristics values of i–v curves for different hybrid AEMs in equilibration with 0.1M NaCl solutions
| Membrane |
ΔV/volt |
ΔI/mA cm−2 |
I
lim
/mA cm−2 |
| AEM-50 |
2.0 |
0.63 |
0.630 |
| AEM-60 |
2.1 |
1.02 |
0.925 |
| AEM-70 |
2.2 |
1.28 |
1.28 |
ED experiments (a schematic diagram is given in Fig. S1 of the ESI†) were performed to asses the suitability of developed AEMs for the electrodialytic salt (NaCl) separation. Experiments were performed at 4.0 V applied voltage (below the limiting current density (1.28 mA cm−2). Initially, 0.2M NaCl solution was taken as feed of DC, while double distilled water was fed to CC and 0.02M Na2SO4 solution in the both electrode wash compartments, in recirculation mode of operation. Under applied dc potential gradient, NaCl concentration was depleted in DC, while it was increased in CC with time (Fig. S10, ESI†, representative AEM-70). The ED process performance was evaluated in terms of rate of salt (NaCl) removal (J), current efficiency (CE) and energy consumption (W: kWh/kg of NaCl removed), considering negligible mass flow through membranes45 (detailed mathematical formulations are included in section S3 of the ESI†). Rate of salt removal (J) under constant applied voltage across developed AEMs; (Fig. 10) increased initially and attained maxima. Further it was decreased because of progressively lowered NaCl concentration in DC. Different AEMs followed the trend: AEM-70 > AEM-60 > AEM-50 for rate of salt migration, similar to their conductivity, charge concentration or permselectivity.
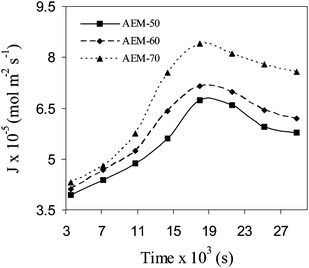 |
| | Fig. 10 The variation of rate of salt splitting (J) with time (s) for the different hybrid AEMs at 4.0 V applied potential during ED (feed of DC: 0.2M NaCl solution). | |
CE can be defined as the fraction of Coulombs utilized for the salt removal in ED process.3 To evaluate the electrodialytic performance of developed AEMs, W (kWh/kg of NaCl removed) and CE (%) data, obtained under similar experimental conditions, are included in Table 5. The energy consumption of the process was decreased, while CE was increased with the increase in AESP content in the membrane matrix. The AESP content in the membrane matrix was responsible for the fixed ion concentration in the membrane matrix and thus for high membrane permselectivity. Process efficiency parameters (J, W and CE) were depended on operating conditions of ED cell as well as nature and electrochemical properties of membranes. Under optimum operating conditions (after the passage of 10.2 × 10³ Coulombs electricity), AEM-70 membrane showed 86.7% and 11.2 kWh kg−1, CE and W, respectively, which indicated suitability of developed AEM for electrodialytic salt separation or any other electro-membrane processes.
Table 5 Electrodialysis (ED) performance for hybrid AEMs at 4.0 V applied potential (feed of DC: 0.2M NaCl solution)
| Membrane |
CE (%) |
W/kWh kg−1 |
| AEM-50 |
73.8 |
13.1 |
| AEM-60 |
83.9 |
12.2 |
| AEM-70 |
86.7 |
11.1 |
Conclusions
Herein, we report a simple and novel “green” alternative route for the producing organic inorganic hybrid AEM without use of any solvent residue or hazardous chemicals. The AESP and AEMs were synthesized by epoxide ring opening reaction using APTEOS and GDTMAC and by the sol–gel process in aqueous media, respectively. AESP and membrane structure were confirmed by different spectroscopic techniques (FTIR and NMR). The prepared AEMs were characterized in terms of different physicochemical and electrochemical techniques to asses their suitability for electrodialytic salt separation. Membrane properties were highly dependent on AESP content in the membrane matrix. Developed AEMs showed good stabilities, flexibility, water uptake, and retention capacities. It was observed that incorporation of AESP in the membrane matrix, improved their thermal stability (up to 250 °C in dry nitrogen atmosphere). These membranes (especially AEM-70) with high water uptake (67.3), IEC (1.36 meqiv. g−1), conductivity (7.61 mS cm−1), and permselectivity (0.94), with no significant electro-osmotic drag of mass, offer a new green methodology for the preparation of AEMs, in which the electrochemical properties could be controlled by the AESP content. Electrodialytic studies suggested dependence of rate of salt splitting and CE on AESP content in the membrane matrix and ED operating conditions.
Incorporation of AESP in the membrane matrix was responsible for observed good membrane electrochemical properties along with low electro-osmotic drag of mass (solvent) across the membrane, which is essential for a successful AEM. These physicochemical and electrochemical properties represent a promising starting point for creating more highly conducting AEMs. In particular, recent advances in the development of AEMs may encourage the preparation of a variety of anion-exchange materials and new composite membranes for different types of electro-membrane applications such as alkaline fuel cell or anion separations.
Acknowledgements
Financial assistance received from Department of Science and Technology, New Delhi (Govt. of India) by sponsoring project no. SR/S1/PC/06/2008 is gratefully acknowledged. Instrumental support received from Analytical Science Division, CSMCRI is also gratefully acknowledged.
References
- R. K. Nagarale, G. S. Gohil and V. K. Shahi, Adv. Colloid Interface Sci., 2006, 119, 97–130 CrossRef CAS
 .
.
- M. Kumar, B. P. Tripathi, A. Saxena and V. K. Shahi, Electrochim. Acta, 2009, 54, 1630–1637 CrossRef CAS
 .
.
- M. Kumar, S. Singh and V. K. Shahi, J. Phys. Chem. B, 2010, 114, 198–206 CrossRef CAS
 .
.
- Y. Ito, M. Inaba, D. J. Chung and Y. Imanishi, Macromolecules, 1992, 25, 7313–7316 CrossRef CAS
 .
.
- H. J. Lee, M. K. Hong, S. D. Han and S. H. Moon, J. Membr. Sci., 2008, 320, 549–555 CrossRef CAS
 .
.
- X. Kong, K. Wadhwa, J. G. Verkade and K. Schmidt-Rohr, Macromolecules, 2009, 42, 1659–1664 CrossRef CAS
 .
.
- A. Saxena, G. S. Gohil and V. K. Shahi, Ind. Eng. Chem. Res., 2007, 46, 1270–1276 CrossRef CAS
 .
.
- M. Unlu, J. Zhou and P. A. Kohl, J. Phys. Chem. C, 2009, 113, 11416–11423 CrossRef CAS
 .
.
- E. Gulzow and M. Schulze, J. Power Sources, 2004, 127, 243–251 CrossRef CAS
 .
.
- J. R. Varcoe, R. C. T. Slade, G. W. Wright and Y. Chen, J. Phys. Chem. B, 2006, 110, 21041–21049 CrossRef CAS
 .
.
- C. O. M’Bareck, M. Metayer, Q. T. Nguyen, S. Alexandre and J. J. Malandain, J. Membr. Sci., 2003, 221, 53–68 CrossRef CAS
 .
.
- Y. Wan, K. A. M. Creber, B. Peppley and V. Tam Bui, J. Membr. Sci., 2006, 284, 331–338 CrossRef CAS
 .
.
- E. N. Komkova, D. F. Stamatialis, H. Strathmann and M. Wessling, J. Membr. Sci., 2004, 244, 25–34 CrossRef CAS
 .
.
- M. R. Hibbs, M. A. Hickner, T. M. Alam, S. K. McIntyre, C. H. Fujimoto and C. J. Cornelius, Chem. Mater., 2008, 20, 2566–2573 CrossRef CAS
 .
.
- J. R. Varcoe, R. C. T. Slade, E. L. H. Yee, S. D. Poynton, D. J. Driscoll and D. C. Apperley, Chem. Mater., 2007, 19, 2686–2693 CrossRef CAS
 .
.
- J. R. Varcoe, R. C. T. Slade and E. L. H. Yee, Chem. Commun., 2006, 1428–1429 RSC
 .
.
- D. Stoica, F. Alloin, S. Marais, D. Langevin, C. Chappey and P. Judeinstein, J. Phys. Chem. B, 2008, 112, 12338–12346 CrossRef CAS
 .
.
- B. Tang, P. Wu and H. W. Siesler, J. Phys. Chem. B, 2008, 112, 2880–2887 CrossRef CAS
 .
.
- Y. Wu, C. Wu, T. Xu and Y. Fu, J. Membr. Sci., 2009, 329, 236–245 CrossRef CAS
 .
.
- Y. Xiong, Q. L. Liu, Q. G. Zhang and A. M. Zhu, J. Power Sources, 2008, 183, 447–453 CrossRef CAS
 .
.
- M. R. Hibbs, C. H. Fujimoto and C. J. Corneli, Macromolecules, 2009, 42, 8316–8321 CrossRef CAS
 .
.
- Y. Wu, C. Wu, F. Yu, T. Xu and Y. Fu, J. Membr. Sci., 2008, 307, 28–36 CrossRef CAS
 .
.
- C. Huang and T. Xu, Environ. Sci. Technol., 2006, 40, 5527–5531 CrossRef CAS
 .
.
- H. J. Rapp and P. H. Pfromm, Ind. Eng. Chem. Res., 1998, 37, 4761–4767 CrossRef CAS
 .
.
- M. S. Kang, Y. J. Choi and S. H. Moon, AIChE J., 2003, 49, 3213–3220 CrossRef CAS
 .
.
- M. Doyle, M. E. Lewittes, M. G. Roelofs and S. A. Perusich, J. Phys. Chem. B, 2001, 105, 9387–9394 CrossRef CAS
 .
.
- V. Shapiro, V. Freger, C. Linder and Y. Oren, J. Phys. Chem. B, 2008, 112, 9389–9399 CrossRef CAS
 .
.
- T. Sata, Y. Tagami and K. Matsusaki, J. Phys. Chem. B, 1998, 102, 8473–8479 CrossRef CAS
 .
.
- R. K. Nagarale, G. S. Gohil, V. K. Shahi and R. Rangarajan, J. Colloid Interface Sci., 2005, 287, 198–206 CrossRef CAS
 .
.
- T. Xu, Z. Liu, C. Huang, Y. Wu, L. Wu and W. Yan, Ind. Eng. Chem. Res., 2008, 47, 6204–6210 CrossRef CAS
 .
.
- T. Sata, S. Nojima and K. Matsusaki, Polymer, 1999, 40, 7243–7249 CrossRef CAS
 .
.
- V. V. Binsu, R. K. Nagarale and V. K. Shahi, J. Mater. Chem., 2005, 15, 4823–4831 RSC
 .
.
- A. Saxena, B. P. Tripathi and V. K. Shahi, J. Phys. Chem. B, 2007, 111, 12454–12461 CrossRef CAS
 .
.
- R. K. Nagarale, G. S. Gohil, V. K. Shahi and R. Rangarajan, Macromolecules, 2004, 37, 10023–10030 CrossRef CAS
 .
.
- B. P. Tripathi and V. K. Shahi, J. Phys. Chem. B, 2008, 112, 15678–15690 CrossRef CAS
 .
.
- K. A. Mauritz, Mater. Sci. Eng., C, 1998, 6, 121–133 CrossRef
 .
.
- G. Kickelbick, Prog. Polym. Sci., 2003, 28, 83–114 CrossRef CAS
 .
.
- D. S. Kim, H. B. Park, Y. M. Lee, Y. H. Park and J. W. Rhim, J. Appl. Polym. Sci., 2004, 93, 209–218 CrossRef CAS
 .
.
- J. S. Liu, T. W. Xu, M. Gong and Y. X. Fu, J. Membr. Sci., 2005, 260, 26–36 CrossRef CAS
 .
.
- H. Touzi, N. Sakly, R. Kalfat, H. Sfihi, N. Jaffrezic-Renault, M. B. Rammah and H. Zarrouk, Sens. Actuators, B, 2003, 96, 399–466 CrossRef
 .
.
- B. P. Tripathi, A. Saxena and V. K. Shahi, J. Membr. Sci., 2008, 318, 288–297 CrossRef CAS
 .
.
- B. P. Tripathi and V. K. Shahi, ACS Appl. Mater. Interfaces, 2009, 1, 1002–1012 Search PubMed
 .
.
- C. C. Yang, S. J. Lin and G. M. Wu, Mater. Chem. Phys., 2005, 92, 251–255 CrossRef CAS
 .
.
-
G. Socrates, Infrared Characteristic Group Frequencies, Wiley, New York, 1980 Search PubMed
 .
.
- T. Yamaguchi, H. Zhou, S. Nakazawa and N. Hara, Adv. Mater., 2007, 19, 592–596 CrossRef CAS
 .
.
- L. Depre, M. Ingram, C. Poinsignon and M. Popall, Electrochim. Acta, 2000, 45, 1377–1383 CrossRef CAS
 .
.
- J. J. Kang, W. Y. Li, Y. Lin, X. P. Li, X. R. Xiao and S. B. Fang, Polym. Adv. Technol., 2004, 15, 61–64 CrossRef CAS
 .
.
- J. R. Varcoe, Phys. Chem. Chem. Phys., 2007, 9, 1479–1486 RSC
 .
.
- Y. Wu, C. Wu, T. Xu, F. Yu and Y. Fu, J. Membr. Sci., 2008, 321, 299–308 CrossRef CAS
 .
.
- T. Schaffer, T. Tschinder, V. Hacker and J. O. Besenhard, J. Power Sources, 2006, 153, 210–216 CrossRef CAS
 .
.
- Y. J. Choi, J. M. Park, K. H. Yeon and S. H. Moon, J. Membr. Sci., 2005, 250, 295–304 CrossRef CAS
 .
.
- A. Lehmani, P. Turq, M. Perie, J. Perie and J. P. Simonin, J. Electroanal. Chem., 1997, 428, 81–89 CrossRef CAS
 .
.
-
A. Katchalsky and P. F. Curran, Nonequilibrium Thermodynamics in Biophysics, Harvard Univ. Press, Cambridge, 1965 Search PubMed
 .
.
-
R. Parsons, Handbook of Electrochemical Constants, Butterworths, London, 1959 Search PubMed
 .
.
- I. Rubinstein, B. Zaltzman and O. Kedem, J. Membr. Sci., 1997, 125, 17–21 CrossRef CAS
 .
.
- V. I. Zabolotsky, V. V. Nikonenko, N. D. Pismenskaya, E. V. Laktionov, M. K. Urtenov, H. Strathmann, M. Wessling and G. H. Koops, Sep. Purif. Technol., 1998, 14, 255–267 CrossRef CAS
 .
.
- M. Kumar, B. P. Tripathi and V. K. Shahi, J. Membr. Sci., 2009, 340, 52–61 CrossRef CAS
 .
.
Footnote |
| † Electronic supplementary information (ESI) available: Fig. S1–S10, Tables S1 and S2, detailed mathematical formulations and procedures for the determination of water uptake, ion-exchange capacity and counter ion transport number in the membrane phase obtained by Hittorf method. See DOI: 10.1039/c0py00084a |
|
| This journal is © The Royal Society of Chemistry 2010 |
Click here to see how this site uses Cookies. View our privacy policy here. ![[thin space (1/6-em)]](https://www.rsc.org/images/entities/char_2009.gif) :
:![[thin space (1/6-em)]](https://www.rsc.org/images/entities/char_2009.gif) 1 mole ratios of APTEOS and GDTMAC were stirred at 80 °C for 6 h. Thus, obtained transparent solution of AESP was assessed by 1H NMR and FTIR. AESP-PVA hybrid AEM was prepared by the sol–gel method in acidic medium followed by chemical crosslinking of –OH groups via formal reaction (Scheme 2). A 10 wt% of PVA was dissolved in 100 ml of distilled water under stirred conditions and desired quantity of AESP was added to the solution. The resulting mixture was stirred at room temperature for 1 h to get a clear solution. Then, a predetermined amount of TEOS was added and pH was maintained at 2.0 under stirred conditions for 12 h at room temperature (30 °C), to hydrolyze the alkoxy groups of silica precursor. Obtained highly viscous white colored gel was transformed into thin film on a cleaned glass and dried under IR lamps at ambient temperature for 24 h followed by vacuum drying at 60 °C (24 h). Obtained thin film of desired thickness was cross-linked by formal reaction in HCHO + H2SO4 at 60 °C for 2 h. Resultant membrane was washed thoroughly by double distilled water and conditioned by equilibration in 1.0 M HCl and NaOH solutions, successively. Conditioned membrane was converted into Cl− form by equilibrating in 1.0 M NaCl solution for 12 h. The equilibrated membranes were stored in double distilled water for further characterizations. Developed membranes were designated as AEM-X, where X is wt% of AESP (X: 50, 60 and 70 wt% of AESP).
1 mole ratios of APTEOS and GDTMAC were stirred at 80 °C for 6 h. Thus, obtained transparent solution of AESP was assessed by 1H NMR and FTIR. AESP-PVA hybrid AEM was prepared by the sol–gel method in acidic medium followed by chemical crosslinking of –OH groups via formal reaction (Scheme 2). A 10 wt% of PVA was dissolved in 100 ml of distilled water under stirred conditions and desired quantity of AESP was added to the solution. The resulting mixture was stirred at room temperature for 1 h to get a clear solution. Then, a predetermined amount of TEOS was added and pH was maintained at 2.0 under stirred conditions for 12 h at room temperature (30 °C), to hydrolyze the alkoxy groups of silica precursor. Obtained highly viscous white colored gel was transformed into thin film on a cleaned glass and dried under IR lamps at ambient temperature for 24 h followed by vacuum drying at 60 °C (24 h). Obtained thin film of desired thickness was cross-linked by formal reaction in HCHO + H2SO4 at 60 °C for 2 h. Resultant membrane was washed thoroughly by double distilled water and conditioned by equilibration in 1.0 M HCl and NaOH solutions, successively. Conditioned membrane was converted into Cl− form by equilibrating in 1.0 M NaCl solution for 12 h. The equilibrated membranes were stored in double distilled water for further characterizations. Developed membranes were designated as AEM-X, where X is wt% of AESP (X: 50, 60 and 70 wt% of AESP).




.
.
.
.
.
.
.
.
.
.
.
.
.
.
.
.
.
.
.
.
.
.
.
.
.
.
.
.
.
.
.
.
.
.
.
.
.
.
.
.
.
.
.
.
.
.
.
.
.
.
.
.
.
.
.
.
.
