Size characterization of metal species in liver and brain from free-living (Mus spretus) and laboratory (Mus Musculus) mice by SEC-ICP-MS: Application to environmental contamination assessment†
M.
Gonzalez-Fernández
a,
M. A.
García-Sevillano
a,
R.
Jara-Biedma
a,
T.
García-Barrera
*a,
A.
Vioque
b,
J.
López-Barea
b,
C.
Pueyo
b and
J. L.
Gómez-Ariza
*a
aDepartment of Chemistry and Material Science, Faculty of Experimental Science, University of Huelva, Campus de El Carmen, 21007, Huelva, Spain. E-mail: ariza@uhu.es; tamara@dqcm.uhu.es
bDepartamento de Bioquímica y Biología Molecular, Edificio Severo Ochoa, Universidad de Córdoba, Campus de Rabanales, 14071, Córdoba, Spain
First published on 25th November 2010
Abstract
The molecular mass distribution of various metals was evaluated in cell lysates obtained from liver and brain of mice using size-exclusion chromatography (Superdex-75) with ICP-MS detection. Free-living mice Mus spretus were collected in polluted and non-polluted sites from Doñana National Park (southwest Spain) and SEC(HPLC)-ICP-MS was used to generate element specific chromatograms for essential metals (Cu and Zn) as well as toxic metals and metalloids (Cd, As, Pb). Different molecular mass fractions containing Cu are remarkably abundant in liver from the specimens captured in the polluted area. The fraction of about 7 kDa is especially important since it matches with a metallothionein I standard. Zn and Cd chromatograms also show peaks with similar molecular mass, but lower intensity. Analogous chromatograms from the non-contaminated site show a considerable depletion of these metal-containing biomolecules possibly due to low contamination. Chromatograms from the liver of laboratory mice Mus musculus (genetically close to Mus spretus) were also obtained for comparison revealing a great similarity with non contaminated samples. On the other hand, metal profiles from brain extracts do not reflect significant differences between polluted and clean areas in comparison with those obtained from liver of Mus spretus. Finally, the daily in vivo subcutaneous administration of Cd aqueous solution to Mus musculus during 10 days resulted in great rise of a Cd-peak of 7 KDa in the extract from the liver extract that matches with the Cd-methallothionein standard. Other Cd-binding molecules with higher molecular mass are also bioinduced by Cd exposure that probably constitutes a protection mechanism against this toxic element. The application for the first time of this metallomic approach to free-living mouse Mus spretus provides promising results for environmental stress assessment.
Introduction
Metal ions present in living systems at trace levels play important roles in metabolic processes. Essential elements such as Cu, Zn, Fe, Mn and Se are integral constituents of numerous proteins where the metals can have either structural or catalytic roles. Deficiency or excess of these elements in mammalian organisms can result in metabolic dyshomeostasis which in turn can eventually lead to oxidative stress and toxicity that can ultimately cause disease and even death.1–3 On the other hand, the presence of toxic metals, such as Cd, Pb, and As in mammalian tissues can adversely affect the intracellular biochemistry even at very low concentrations.4Cadmium is known to be toxic to mammals and can lead to irreversible damage to bones,5,6 lungs and especially to the kidneys.7 The urinary cadmium excretion is marked by the presence of several proteins in urine,8 which produces irreversible tubular damage. Occupational exposure to this element by inhalation of fine dust and fumes can provoke lung diseases increasing the risk of lung cancer.9 Waalkes et al.10 have demonstrated that subcutaneous injection of Wistar rats with cadmium chloride in the dorsal thoracic midline either at a single dose ranging from 0 to 40.0 μmol kg−1 or separate doses of 5 μmol kg−1 can induce prostate cancer. Cadmium treatment had no effect on rat survival and the highest incidence of cancer was observed with the 40.0 μmol kg−1 dose.10 However, more recent data support that only an uptake of cadmium via the respiratory system has carcinogenic potential.11
The environmentally abundant metalloid arsenic has no known nutritional requirement for mammalian organisms.12 Nevertheless, mammals—including humans—metabolize highly toxic inorganic arsenic to methylated metabolites, such as methylarsonic acid and dimethylarsinic acid which are excreted in the urine.13 The biomethylation of inorganic arsenic in mammals may ultimately turn out to be demonstrated to be an important detoxification mechanism since it has been recently demonstrated that the As–S bond in complexes that are formed in vivo between methylated arsenic(III) species and glutathione is stronger than that between arsenite and glutathione. This is important as stable glutathione-complexes are likely to be more efficiently effluxed from the liver to the bloodstream by ATP-driven glutathione-conjugate export pumps.14 Organoarsenic species such as arsenosugars, arsenobetaine, arsenocholine and arsenolipids15 are present in aquatic organisms and marine animals.16,17
Lead at trace levels can adversely affect the brain, the central nervous system, blood cells, and kidneys.18 Several large epidemiological studies of lead workers have found inconclusive evidence of an association between lead exposure and the incidence of cancer.19,20 However, exposure to high lead levels can produce renal tubular damage with glycosuria and aminoaciduria (saturnine gout),21 although, there is no agreement between the correlation of creatinine levels in serum (related to the renal function) and lead levels in blood. Loghman-Adham,21 for instance, has found a linear correlation for lead levels above 40 μg/100 ml whereas Gerhardsson et al.22 have shown no correlation below 60 μg/100 ml of lead.
The use of free-living organisms in environmental pollution assessment is a useful approach because biological responses allow a more accurate appraisal of the qualitative state of an ecosystem than the mere presence of a toxic substance (i.e. in soil). In fact, both methodologies are valuable and complementary. Many pollutants, including transition metals and other prooxidant chemicals, generate reactive oxygen species that promote oxidative stress, damage biomolecules, alter glutathione status of cells and induce antioxidative enzymes, heat-shock proteins and metallothioneins.23,24 However, the use of these biomolecules as biomarkers requires a deep knowledge of toxicity mechanisms and proteomics based approaches have a great potential to unravel complex biological problems, since they allow to reveal changes in protein expression, such as in liver cytosolic extracts from Mus musculus,25 without any previous knowledge of the mechanism of toxicity (Environmental Proteomics26). In addition, the up/downregulation of proteins and biomolecules has been linked to the exposure of organisms to toxic metals (Environmental Metallomics26).
Doñana Natural Park (Fig. 1) is one of the most important European biological reserves, in which millions of migrating birds land each year in their way to or from Africa. This park was declared a UNESCO Biosphere Reserve in 1981. However, Doñana Park is subject to ecological pressures, due to the input from adjacent agriculture, mining and industrial activities.27,28 Several bioindicators have been proposed for environmental studies in Doñana surroundings, such as the bivalves Chamelea gallina,29Crassostrea angulata and Mytilus galloprovincialis,27 the crayfish Procambarus clarkii,28 and especially the mouse Mus spretus.25 The latter is a well characterized aboriginal species that attains high population densities in marshlands areas feeding on plants, seeds and insects around its burrow. M. spretus has proved to be a useful sentinel species in monitoring programs at Doñana National Park, through the use of different biometric, cytogenetic, and biochemical biomarkers,30–33 as well as in proteomics monitoring.25
It has been demonstrated that Mus spretus is genetically related to the sequenced mouse Mus musculus33 (classical inbred laboratory species) and that the absolute transcript expression profiling (mRNA levels) of selected genes in M. spretus is a suitable novel bioassay to assess its exposure to pollutants. For this purpose, specific primers were designed based on gene sequences from Mus musculus that amplified in Mus spretus gave single products exhibiting generally 100% sequence identity with Mus musculus. This homology has allowed the use of proteomics of free-living non-sequenced Mus spretus in monitoring terrestrial ecosystems,25 using the database from Mus musculus. The successful results obtained with the integration of transcriptomic and proteomic approaches in the couple Mus musculus/Mus spretus for environmental studies allows to propose the integration of -omics (transcriptomics, proteomics and more recently metallomics) in environmental studies,34 since bioindicators generally used in environmental assessment are not genetically sequenced and the use of other genetically homologous sequenced species avoids the cumbersome work of de novo sequencing. In connection with this, a metallomics approach based on the analysis of cytosolic extracts from different organs of Mus musculus34 by preparative size exclusion chromatography coupled to ICP-MS was performed to obtain information about metal-linking biomolecules present in this species, for later comparison with those in Mus spretus and the integration with proteomic data.
The present work reports comparative metallomics experiments35–40 which are based on the use of analytical SEC with ICP-MS detection to address the changes of the distribution of key essential (Cu and Zn) and toxic (Cd, As, Pb) elements in liver and brain of Mus spretus from contaminated and non-contaminated areas of Doñana Natural Park and the surrounding area. Preliminary data about the molecular size of Cd-containing molecules in the organs of Mus musculus after Cd-stress will also be presented. To the best of our knowledge, this work is the first exposure study that compares the size distribution of metal containing molecules in a laboratory sequenced mouse and non-sequenced free-living one, both with a high genetic homology.
Experimental
Standard solutions and reagents
All reagents used for sample preparation were of the highest available purity. Phenylmethanesulfonyl fluoride (PMSF), reduced L-Glutatione (GSH) and benzonase nuclease (Ultrapure grade) were obtained from Sigma Aldrich (Steinheim, Germany). Tris buffer was prepared daily with Trizma base (Sigma Aldrich) and adjusted to pH to 8 with hydrochloric acid (25%). Helium, used as collision gas in a LC-ICP-ORC-MS system, was of high-purity grade (>99.999%).Standards used for mass calibration of the SEC columns were: ferritin (440 kDa) (purity 95%), bovine serum albumin (6.7 kDa) (purity 96%), superoxide dismutase (32 kDa) (purity > 70%), metallothionein I containing Cd, Cu and Zn (7 kDa) (purity ≥ 95%) and reduced glutathione (307 Da) (purity 98–100%). All these reagents were purchased from Sigma-Aldrich (Steinheim, Germany). The mobile phase solution used in SEC was 20 mM of ammonium acetate (pH 7.4) (Suprapure grade) purchased from Merck (Darmstadt, Germany). The void volume was determined using ferritin (440 kDa). The mobile phase was prepared daily with ultrapure water (18 MΩcm) from a Milli-Q system (Millipore, Watford, UK) and the pH adjusted to pH 7.4 with ammonia solution, this later prepared by dilution of 20% (w/v) ammonia solution (Suprapur, Merck) with ultrapure water.
Instrumentation
A cryogenic homogenizer SPEX SamplePrep (Freezer/Mills 6770) was used to prepare the homogenates. Tissues were previously disrupted using an UltraTurrax T-25 homogenizer. The extraction was followed by ultracentrifugation with an ultracentrifuge Beckman model L9-90 K (rotor 70 Ti). Polycarbonate bottles of 10 ml with cap assembly (Beckman Coulter) were used for this purpose.Analytes were separated on a 10 × 300 mm (13 μm) SuperdexTM-75 column (GE Healthcare, Uppsala, Sweden) with an exclusion limit of 100 kDa (with an effective separation range from 3 to 70 kDa). Elemental detection was performed using an inductively coupled plasma mass spectrometer Agilent 7500ce (Agilent Technologies, Tokyo, Japan) equipped with an octopole collision cell. Chromatographic separations were performed using a Model 1100 HPLC pump with detector UV (Agilent, Wilmington, DE, USA) as the delivery system. ICP-MS measurement conditions (Table 1) for mode He were optimized by using a HNO3 2% (v/v) aqueous solution of 59Co, 7Li, 89Y and 205Tl (1 μg L−1).
| SEC conditions | |
| Column | SuperdexTM-75 (10 × 300 × 13μm) |
| Resolution range | 3–70 kDa |
| Mobile phase | Ammonium acetate 20 mmol L−1 (pH 7.4) |
| Flow rate | 0.7 ml min−1 |
| Injection volume | 20 μl |
| UV-visible wavelength | 254 nm |
| ICP-MS conditions | |
| Forward power | 1500 W |
| Plasma gas flow rate | 15.0 L min−1 |
| Auxiliary gas flow rate | 1.0 L min−1 |
| Carrier gas flow rate | 0,9 L min−1 |
| Sampling depth | 8 mm |
| Sampling and skimmer cones | Pt |
| He flor | 3.9 mL min−1 |
| Q oct | −18 V |
| Q p | −16 V |
| Dwell time | 0.3 per isotope |
| Isotopes monitored | 55Mn, 60Ni, 63Cu,65Cu, 64Zn, 66Zn, 75As,208Pb, 53Cr, 56Fe, 57Fe,59Co, 82Se, 114Cd |
Sampling area, animals and sample preparation
Free-living mice (Mus spretus) were collected between November 10th and December 11th 2009) in two sampling areas from Doñana National Park (DNP), southwest Spain: a non-contaminated site “Lucio del Palacio” (LDP) (green spot) and the contaminated zone “La Rocina” stream-ROC (red spot) (Fig. 1). The sampling point LDP is situated in the center of Doñana Natural Park and is an area not affected by pesticides and fertilizers from surrounding agricultural activities and metals from mining activities in the north-east of the Park which are transported by the Guadiamar and Guadalquivir rivers. However, “La Rocina” stream is affected by diffused pollution from several sources: (i) petrochemical and chemical activities from the industrial belt of Huelva (one of the most important in Spain); (ii) acid waters and metals from north-west miner-metallurgical activities in the north-west of Huelva province41 (Rio Tinto mines); and (iii) the strawberry crops close to “La Rocina” stream which use high amounts of biocides—as organochlorine pesticides—and nitrogen fertilizers.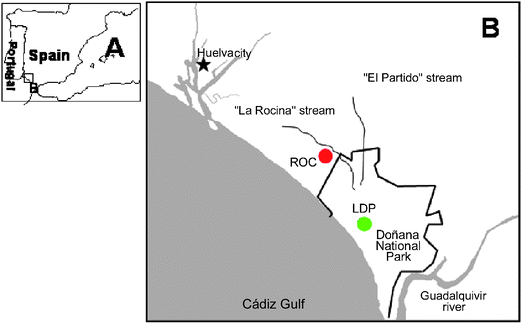 | ||
| Fig. 1 Sampling area in Doñana National Park and surrounding (SW Spain). A. area location; B. Localization of sampling point: “Lucio del Palacio” (LDP, green spot) non-contaminated site; “La Rocina” stream (ROC, red spot) contaminated site. | ||
Table 2 shows the sites studied, including their codes, UTM coordinates, type (reference/problem) and number of mice of each sex sampled. Mus Spretus mice were caught with Sherman® live-traps baited with a mixture of sardines and oil over bread, which were mounted during the evenings and checked the next morning. Adult animals were taken alive to a laboratory at Doñana Biological Reserve, and site/date of capture, sex, weight and external measurements were recorded. Mus musculus (inbred BALB/c strain) mice were obtained from Charles River Laboratory (Spain). Mice of 7 weeks of age were fed ad libitum with feed conventional pellets. This feed contained 11.9% moisture, 16.1% crude protein, 3.1% crude oil, 60% N-free extract (including starch, sugars, crude fiber, etc.) and 5.1% total minerals. Element concentrations in the feed were as follows (the limits recommended for each of these elements are indicated in parentheses): 70 mg kg−1 Mn (40–100 mg kg−1), 17 mg kg−1 Cu (10–35 mg kg−1), 200 μg kg−1 Pb (less than 1500 μg kg−1), 21 μg kg−1 Hg (less than 100 μg kg−1), 70 μg kg−1 As (less than 1,000 μg kg−1), 51 μg kg−1 Cd (less than 250 μg kg−1), 160 μg kg−1 Se (less than 600 μg kg−1).
| Area (code) | UTM coordinates | Type | Mice | ||
|---|---|---|---|---|---|
| X | Y | Males | Females | ||
| Lucio del Palacio (LDP) | 193800 | 4099515 | Negative Control | 18 | 15 |
| Rocina (ROC) | 178653 | 4119937 | Problem | 7 | 4 |
Mus musculus mice were divided in two groups, one of which was used as control and the other group subjected to Cd exposure by subcutaneous injection (100 μL) of an increasing doses of 0.1 to 1 mg Cd (in the form of CdCl2) per kg of body weight per day during a total period of 10 days. Three subgroups of 10 mice (A, B and C) were separated and sacrificed at days 2, 6 and 10 of the experiment, respectively. The control mice were subcutaneously injected with 100 μL of ultrapure water per day for 10 days.
Mus musculus and Mus spretus mice were individually killed by cervical dislocation and dissected. Individual organs were excised, weighed in Eppendorf vials, cleaned with 0.9% NaCl solution, frozen in liquid N2 and stored at −80 °C until they were used for extract preparation. Mice were handled according to the norms stipulated by the European Community. The investigation was performed after approval by the Ethical Committee of the University of Córdoba (Spain).
![[thin space (1/6-em)]](https://www.rsc.org/images/entities/char_2009.gif) 000 rpm for 1 h at 4 °C. Extracts were stored at −80 °C until analysis. The total protein content (Bradford method) in the extracts of livers and brains from Mus musculus was 17.300 ± 0.018 mg ml−1 and 1.690 ± 0.003 mg ml−1, respectively. In liver extract of Mus spretus from LDP and ROC protein content was 12.500 ± 0.013 mg ml−1 and 15.400 ± 0.034 mg ml−1, respectively, and in brain extract 4.040 ± 0.001 mg ml−1 (LDP) and 5.210 ± 0.004 mg ml−1 (ROC).
000 rpm for 1 h at 4 °C. Extracts were stored at −80 °C until analysis. The total protein content (Bradford method) in the extracts of livers and brains from Mus musculus was 17.300 ± 0.018 mg ml−1 and 1.690 ± 0.003 mg ml−1, respectively. In liver extract of Mus spretus from LDP and ROC protein content was 12.500 ± 0.013 mg ml−1 and 15.400 ± 0.034 mg ml−1, respectively, and in brain extract 4.040 ± 0.001 mg ml−1 (LDP) and 5.210 ± 0.004 mg ml−1 (ROC).
| Sampling area | Livers/g | Brains/g |
|---|---|---|
| Lucio del Palacio (LDP) | 0.43 | 0.43 |
| 0.39 | 0.30 | |
| 0.74 | 0.41 | |
| 0.54 | 0.30 | |
| 0.48 | 0.32 | |
| Rocina (ROC) | 0.56 | 0.30 |
| 0.77 | 0.36 | |
| 0.62 | 0.37 | |
| 0.75 | 0.35 | |
| 0.81 | 0.32 |
Analysis of extracts with SEC coupled to ICP-MS
First of all, the extracts were filtered through Iso-Disc poly(vinylidene difluoride) filters (25-mm diameter, 0.2-μm pore size) to avoid column overloading or clogging. The SEC-ICP-MS on-line coupling was performed by connecting the outlet of the chromatographic column to the Micromist nebulizer inlet (Glas Expansion, Switzerland) of the ICP-MS by means of a 50-cm PEEK tubing (0.17 i.d. mm). The instrumental operating conditions are given in Table 1.The quality control of the SEC-ICP-MS system to overcome problems related to contamination, loss and stability of species has been described elsewhere.42 The SEC-ICP-MS chromatograms of the standards used for column calibration have been included in Fig. 2.
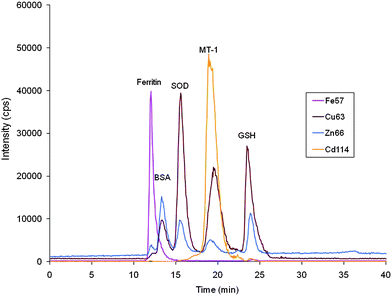 | ||
| Fig. 2 SEC-ICP-MS chromatograms of standards used for column calibration. Ferritin (440 KDa), bovine serum albumin (BSA, 67 KDa), superoxide dismutase (SOD, 32 KDa), metallothionein I (MT-1, 7 KDa), reduced glutathione (GSH, 307 Da). Chromatographic conditions: column, SuperdexTM-75 (10 × 300 × 13μm); mobile phase, ammonium acetate 20 mmol L−1 (pH 7.4); flow rate, 0.7 ml min−1; injection volume, 20 μl. | ||
Results and discussion
A metallomic approach based on the use of size exclusion chromatography (SEC) with ICP-MS detection was applied to liver and brain from both laboratory Mus musculus and the free-living Mus spretus mice which has been previously demonstrated to be useful as a bioindicator for pollution monitoring at Doñana National Park (southwest Spain).25,30,31 This is, to the best of our knowledge, the first attempt to gain information about the influence of contamination on the presence of metal-linking biomolecules in tissues (e.g. liver and brain) from aboriginal free-living mouse. Mus musculus is genetically homologous with Mus spretus33 and has been used as model for comparison. Additionally, an exposure experiment of Mus musculus to Cd provides preliminary information about the action of toxic metals on the metabolism of this mouse species and allows potential correlations with respect to the behaviour of Mus spretus in relation to toxic elements.Size characterization of essential and toxic metal species in liver and brain from Mus musculus using mass calibrated SEC column with ICP-MS detection
The analysis of liver and brain samples from laboratory mice Mus musculus with SEC-ICP-ORC-MS using a SuperdexTM-75 column gave typical chromatograms shown in Fig. 3. A Cu containing peak with remarkable intensity was observed (blue line in Fig. 3A) in the brain extract, with molecular mass close to the standard metallothionein I (7 kDa) and a retention time of ∼18 min. In the liver (Fig. 3C) a Cu-peak of remarkable intensity elutes with a retention time of ∼15 min, which is identical with the superoxide dismutase standard (32 kDa). The Zn-specific chromatogram (red line) is similar to that traced by Cu, although peak intensity (number of counts) are about 18% lower in brain and 37% lower in the liver. The Zn-specific chromatogram is similar to that traced by Cu in brain although the relative intensities of peaks are different. The Zn-specific chromatogram shows a small peak at retention time ∼18 min that can be related with an isoform of Zn-metallothionein I (the Zn-MT1 standard was separately injected to the chromatographic system with retention time at 19.6 min).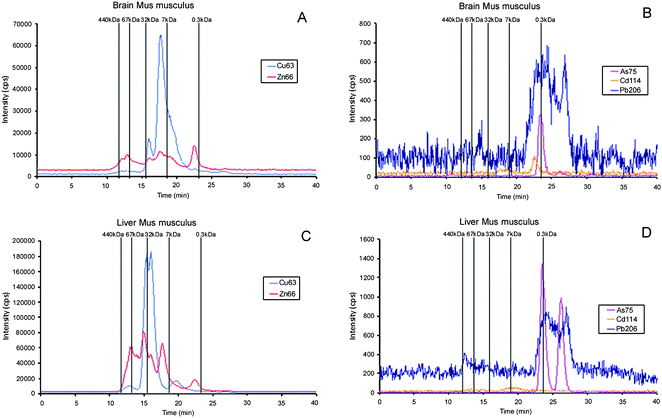 | ||
| Fig. 3 Molecular mass distribution of metal–biomolecule complexes in liver and brain Mus musculus extracts by SEC-ICP-MS. A and C, essential elements (Cu- and Zn-containing biomolecules) in brain and liver, respectively; B and D, toxic elements (Cd-, As-, and Pb-containing biomolecules) in brain and liver, respectively. Chromatographic conditions: column, SuperdexTM-75 (10 × 300 × 1 3μm); mobile phase, ammonium acetate 20 mmol L−1 (pH 7.4); flow rate, 0.7 ml min−1; injection volume, 20 μl. | ||
When these results are compared with previous studies based on the use of a semipreparative column Hiload Superdex 75 Prep (separation range of 3–70 kDa)41 and a different extraction procedure, the results are quite similar. However, it is remarkable the absence of Cu and Zn molecules of low molecular mass (with retention times in the range of 26.4 to 27 min) in the chromatograms depicted in Fig. 3 A and C. This fact can be explained by the modifications in the tissue extraction procedure in the present study with the purpose to avoid the drawbacks associated with conventional extraction procedures.25 Since metalloproteins are often of no particular interest in conventional proteomics studies, commercial extraction mixtures usually contain metal-complexing reagents such as EDTA in the protease inhibitors and DTT to prevent the formation of –S–S– bonds from cysteine residues. In the present extraction treatment, EDTA has been eliminated and reduced glutathione (GSH) was used instead of DTT. This fact explains the absence of low molecular mass Cu and Zn peaks in Fig. 3, which could be attributed to partial metal leaching from metallo-proteins by metal-complexing reagents and the subsequent formation of low molecular mass metal-binding molecules.41
Peaks from toxic metals such as Cd, Pb and As can also be observed in Fig. 3B and 3D, although the intensities are lower and the retention times denotes the presence of predominantly small (<300 Da) molecular weight As, Cd and Pb-containing entities. It is remarkable that the detection of a single Cd peak must be attributed to the bioaccumulation of this element from the mouse food, despite its rather low Cd concentration (51 μg kg−1). Only the As-peaks present a suitable intensity for further identification studies. It is remarkable that two well resolved peaks of this element in the liver extract that can be related with low molecular mass As-metabolites.43,44 Presence of As in the liver extract can also be attributed to the content of this element in the food (70 μg kg−1 As), further studies should perform the arsenic species analysis in the mouse food to know the source of arsenic species for the mouse.
Size characterization of essential and toxic species in liver and brain from Mus spretus collected in different sites of Doñana National Park using mass calibrated SEC column with ICP-MS detection
A non-contaminated site in the “heart” of the Park, “Lucio del Palacio” (LDP) was used as negative reference (LDP) to compare with that of a neighbouring site (“La Rocina” ROC), which is contaminated by agricultural and industrial effluents. The mouse M. spretus, traditionally used as environmental bioindicator in the southwest Spain, collected in both sites was subjected to the metallomics approach proposed in this study.The Fig. 4–5 and 6 show the results for liver and brain, respectively, for LDP and ROC. Chromatograms from Mus musculus have also been included for comparison. The increased intensity of a Cu-peak in the liver (at 19.6 min) from mice collected from the ROC site as compared to the LDP site is evident, this fact can be related to the significant presence of copper in ROC, area affected by the diffuse contamination of metals, mainly copper, coming from pyrite mines waste lixiviation from the north-east of Huelva province. In Mus musculus an analogous peak is observed with low intensity, very similar to that of LDP, which can be related to the peak obtained with the Cu-MT1 standard injected under similar chromatographic conditions. However, the peak of about 32 KDa, related to the superoxide dismutase standard, shows a higher intensity in Mus musculus (Fig. 4A). The Zn-specific chromatogram shows a peak at 19.6 min in liver that also shows a manifest intensity in the specimens from ROC in relation to the control (LDP), Fig. 4B.
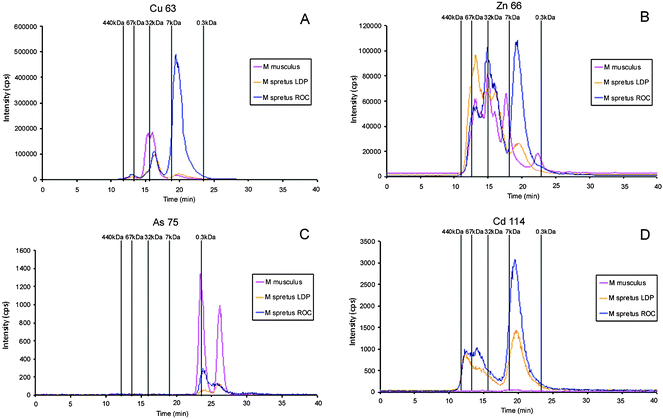 | ||
| Fig. 4 Molecular mass distribution of metal-biomolecules complexes in liver Mus spretus extracts from LDP and ROC by SEC-ICP-MS. A, Cu-containing biomolecules; B, Zn-containing biomolecules; C, As-containing biomolecules; D, Cd-binding biomolecules. In all the cases chromatograms traced for the diverse elements in liver Mus musculus extract are included for comparison. Chromatographic conditions: column, SuperdexTM-75 (10 × 300 × 13μm); mobile phase, ammonium acetate 20 mmol L−1 (pH 7.4); flow rate, 0.7 ml min−1; injection volume, 20 μl. | ||
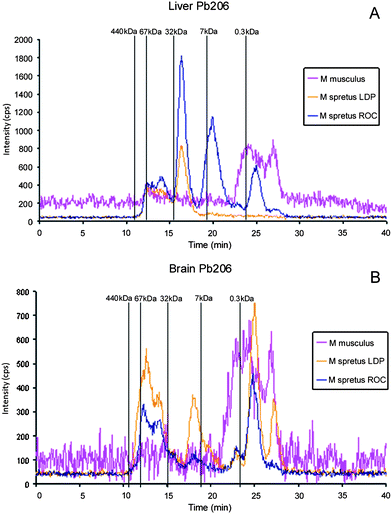 | ||
| Fig. 5 Molecular mass distribution of Pb–biomolecule complexes in liver (A) and brain (B) Mus spretus extracts from LDP and ROC by SEC-ICP-MS. Chromatograms from Mus musculus are included for comparison. Chromatographic conditions: column, SuperdexTM-75 (10 × 300 × 13μm); mobile phase, ammonium acetate 20 mmol L−1 (pH 7.4); flow rate, 0.7 ml min−1; injection volume, 20 μl. | ||
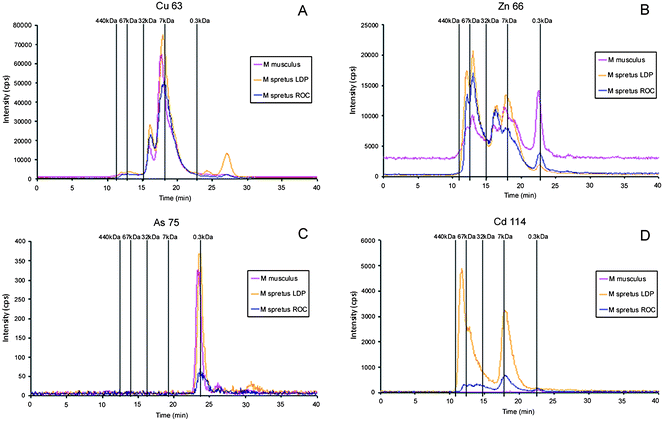 | ||
| Fig. 6 Molecular mass distribution of metal–biomolecules complexes in brain Mus spretus extracts from LDP and ROC by SEC-ICP-MS. A, Cu-containing biomolecules; B, Zn-containing biomolecules; C, As-containing biomolecules; D, Cd-binding biomolecules. In all the cases chromatograms traced for the diverse elements in liver Mus musculus extract are included for comparison. Chromatographic conditions: column, SuperdexTM-75 (10 × 300 × 13μm); mobile phase, ammonium acetate 20 mmol L−1 (pH 7.4); flow rate, 0.7 ml min−1; injection volume, 20 μl. | ||
The As, Cd and Pb-specific chromatograms of the liver extracts demonstrated that the sensitivity of the signals decreases considerably (Fig. 4C and 4D and Fig. 5). A Cd-peak with retention time at 19.6 min (molecular mass about 7 kDa), similar to that traced by Cu and Zn can be observed (Fig. 4D) in samples from ROC, but the intensity of this peak in LDP is lower. In addition, two peaks traced by As are observed in ROC, at the same retention time than those observed for Mus musculus, although the intensity in this case is clearly lower in ROC samples (Fig. 4C). This fact confirms that presence of As in Mus musculus can be related to the small content of this element in the food. Finally, when Pb-linking molecules are considered in liver (Fig. 5A) peaks close to 7 and 32 kDa are observed in the ROC sample, analogously to those traced by Cu, Zn and Cd, although with lower intensity. Samples from the non-contaminated LDP do not show the Pb-peak at about 7 kDa. All these peaks are absent in the liver extract from Mus musculus. In brain the intensity of the peaks decreases drastically possibly due to the blood brain barrier, and the noisy chromatograms obtained make the results few comparable.
In brain the intensity of the peaks traced by the different elements are lower than in liver which can be attributed again to the blood brain barrier, Fig. 6. It can be highlighted that signals (Cu, Zn, As, Cd) from Mus spretus captured in LDP (non-polluted site) are higher than in ROC, which behaviour is opposite to liver. In these extracts the peaks traced by Cu and Zn at about 32 kDa in liver chromatograms are not detected, and Cu-, Zn- and Cd-peak match very well with that of metallothionein I standard. Metal profiles for Mus musculus brain extract are similar in location and intensity to those of Mus spretus from LDP with the exception of the Cd peak which is absent in M. musculus.
Therefore, these results show important differences in the presence of metallo metabolites in the liver and brain of Mus spretus when the bioindicator is subjected to situations with different degrees of environmental stress (ROC contaminated and LDP non-contaminated, respectively). The extracts of liver from ROC show a significant presence of molecules linked to Cu, Zn and in a lower proportion to Cd, with molecular mass similar to metallothioneins. But similar signals of these elements in brain are lower and the response from the reference area in which pollution is absent is somewhat larger than ROC values. These facts indicate a lower response of brain to environmental stress than liver that is more active in the metabolism and more sensible to the presence of contaminants, the activity of the blood brain barrier can also motivate these differences. On the other hand, a slight shift in the retention time of Cu-, Zn- and Cd-peaks from brain to liver extracts in relation to the reference provides by metallotionein-I standard (about 7 kDa, retention time 19.1 min) can be observed. So that, the Cu-, Zn- and Cd-peaks obtained from liver extract (Fig. 4A, 4B and 4D) show a small shift to retention times higher than 19.1 min, corresponding to a molecular mass slightly lower than 7 KDa. However, analogous peaks of these elements in brain extract match perfectly with the standard of molecular mass 7 KDa. This fact suggests small molecular mass differences between Cu-, Zn- and Cd-peaks that can be attributable to the already established evidence that mammalian organisms contain predominantly in brain metallothionein MT-3 with molecular mass about 7 KDa45 whereas in liver MT-2 and MT-1 with lower molecular mass, about 6.1 KDa45 and 6.0 KDa,45 respectively, are the predominant forms. Further, studies are necessary to identify the different forms of metallothioneins present in liver and brain extracts.
Experimental exposure of Mus musculus to Cd
To have complementary information about the metabolic effects of contaminants in mice a preliminary exposition exposure of Mus musculus to Cd (as CdCl2 aqueous solution) was performed. Cadmium solution was daily subcutaneously injected to a population of 30 mice. Three groups (A, B and C) of 10 mice each were sacrificed at 2, 6 and 10 days using as control group mice that were given ultrapure water. The Cd-specific chromatograms that were obtained for the analysis of the liver extracts are shown in Fig. 7. The control group, Fig. 7A, only shows very low intensity peaks at about 11 min and 15 min as well as a third one at about 23 min, which can be related with the retention times of three standards: bovine serum albumin (BSA), superoxide dismutase (SOD) and reduced glutathione (GSH). The Cd-specific chromatogram of liver extracts given the lowest dose show one additional Cd-peak compared to the control group, Fig. 7B. In this latter chromatogram, the peak with a retention time of 15.6 min matched the retention time of the SOD standard. The peak that eluted at 19.1 min had a retention time similar to that of the metallothionein I standard. This last peak increased considerably with the Cd dose that was administrated to mice (Fig. 7C and D). When other elements such as Zn and Cu are used as tracers (results not shown) the chromatograms also confirm the appearance and growing of a peak at 19.1 min, although the intensity is 80% fold lower than that of Cd.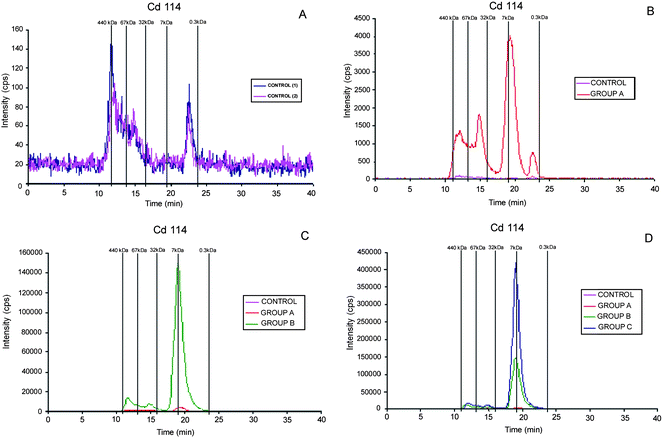 | ||
| Fig. 7 SEC-ICP-MS chromatograms (Cd114) for liver cytosolic extracts of Mus Musculus after daily subcutaneous administration of Cd aqueous solution. Number of days of in vivo administration: A, control group; B, 2 days; C, 6 days; D, 10 days. Chromatographic conditions: column, SuperdexTM-75 (10 × 300 × 13 μm); mobile phase, ammonium acetate 20 mmol L−1 (pH 7.4); flow rate, 0.7 ml min−1; injection volume, 20 μl. | ||
Conclusions
The application of size characterization of metal species to free-living Mus spretus provides a useful demonstration of the bioinduction of Cu- and Zn-binding proteins in liver of this mouse by the influence of contaminants. The detection of intense Cu and Zn peaks in liver extracts from mice collected from the contaminated site can be attributed to the presence of metallothioneins. In contrast, these peaks were almost absent in liver extracts from animals collected from non-contaminated area (LDP). Toxic metals such as Cd and Pb also show similar responses in liver extract although the intensity of the peaks is lower due to the low presence of these elements in the tissue. However, in brain the intensity of peaks traced by copper and zinc is lower and in these samples the signals from ROC are lower than LDP, although the differences are not remarkable. This reduced presence of metal-containing biomolecules in brain extract can be related to the blood brain barrier activity. These facts reveal a differential response of Mus spretus to the presence of contaminants in liver and brain that determines clear variations in the presence of metal-containing species. In addition, the small shift in the retention times of Cu-, Zn and Cd-metallothionein molecules from liver with respect to those in brain suggest the predominant presence of MT-1 and MT-3 in the corresponding extracts, respectively.The stress caused in Mus musculus by the exposure to inorganic Cd has also been demonstrated by the proposed method and the impressive increases of Cd-peak in liver extract show the protection mechanism developed by the organism, since the peak can be related with a standard of metallothionein.
Therefore, the application for the first time of this metallomic approach to the bioindicator Mus spretus has provided promising results in the assessment of environmental stress caused by the presence of contaminants. The method can be more powerful than the evaluation of conventional chemical biomarkers, because more general information about the metallo-metabolites involved in the organism response is achieved, and the simultaneous alteration of different metal species implicated in the metabolism is obtained. However, further research has to be developed to purify SEC peaks with other complementary chromatographic separation and unequivocal identification of metal species by mass spectrometry.
Acknowledgements
This work was supported by the project CTM2009-12858-C02-01 y CTM2009-12858-C02-02 from the Ministerio de Ciencia e Innovación, and the projects P08-CVI-03829 P08-RNM-00523, P08-FQM-03554 and P09-FQM-4659 from Consejería de Innovación Ciencia y Empresa (Junta de Andalucía). M.González-Fernández and M. Angel García Sevillano thank the Ministerio de Ciencia e Innovación for a predoctoral scholarship. R. Jara-Biedma thank the Consejería de Innovación Ciencia y Empresa (Junta de Andalucía) for a predoctoral scholarship.References
- N. Nelson, EMBO J., 1999, 18, 4361–4371 CrossRef CAS.
- D. P. Giedroc and A. I. Arunkumar, Dalton Trans., 2007, 3107–3120 RSC.
- W. Zheng, M. Aschner and J. F. Ghersi-Egea, Toxicol. Appl. Pharmacol., 2003, 192, 1–11 CrossRef CAS.
- W. Maret, Metallomics, 2010, 2 Search PubMed.
- K. Nogawa, E. Kobayashi, Y. Okubo and Y. Suwazono, BioMetals, 2004, 17(5), 581–567 Search PubMed.
- G. Kazantzis, BioMetals, 2004, 17(5), 493–498 Search PubMed.
- O. Barbier, G. Jacquillet, M. Tauc, M. Cougnon and P. Poujeol, Nephron Physiol., 2005, 99, 105–110.
- A. Bernard, BioMetals, 2004, 17, 519–523 Search PubMed.
- J. G. Hengstler, U. Bolm-Audorff, A. Faldum, K. Janssen, M. Reifenrath, W. Gotte, D. Jung, O. Mayer-Popken, J. Fuchs, S. Gebhard, H. G. Bienfait, K. Schlink, C. Dietrich, D. Faust, B. Epe and F. Oesch, Carcinogenesis, 2003, 24, 63–73 CrossRef CAS.
- M. P. Waalkes, S. Rehm, C. W. Riggs, R. M. Bare, D. E. Devor, L. A. Poirier, M. L. Wenk, J. R. Henneman and M. S. Balaschak, Cancer Res., 1988, 48(16), 4656–4663 CAS.
- T. Jin, M. Nordberg, W. Frech, X. Dumont, A. Bernard, T. T. Ye, Q. Kong, Z. Wang, P. Li, N. G. Lundstrom, Y. Li and G. F. Nordberg, BioMetals, 2002, 15(4), 397–410 Search PubMed.
- J. P. Buchet and R. Lauwerys, Arch. Toxicol., 1985, 57, 125–129 CAS.
- H. V. Aposhian, Annu. Rev. Pharmacol. Toxicol., 1997, 37, 397–419 CrossRef CAS.
- A. J. Percy and J. Gailer, Bioinorg. Chem. Appl., 2008 Search PubMed , ID 539082.
- F. C. Knowles and A. A. Benson, Trends Biochem. Sci., 1983, 8, 178–180 CrossRef CAS.
- J. S. Edmonds and K. A. Francesconi, Nature, 1981, 289, 602–604 CrossRef CAS.
- J. S. Edmonds and K. A. Francesconi, Experientia, 1987, 43, 553–557 CAS.
- J. J. Fadrowski, A. Navas-Acien, M. Tellez-Plaza, E. Guallar, V. M. Weaver and S. L. Furth, Arch. Intern. Med., 2010, 170, 75–82 CrossRef CAS.
- A. Antilla, P. Keikkila, E. Pukkala, E. Nykyri, T. Kauppinen, S. Hernberg and K. Hemminki, Scand J Work Environ Health, 1995, 21, 460–469.
- H. Fu and P. Boffetta, Occup. Environ. Med., 1995, 52, 73–81 CrossRef CAS.
- M. Loghman-Adham, Environ. Health Perspect., 1997, 105, 928–938 CrossRef CAS.
- L. Gerhardsson, D. R. Chettle, V. Englyst, G. F. Nordberg, H. Nyhlin, M. C. Scott, A. C. Todd and O. Vesterberg, Br J Ind Med, 1992, 49, 186–192 CAS.
- H. Sies, Angew. Chem., Int. Ed. Engl., 1986, 25, 1058–1071 CrossRef.
- J. López-Barea, Arch. Toxicol., 1995,(Suppl 17), 57–79 CAS.
- R. Montes-Nieto, C. A. Fuentes-Almagro, D. Bonilla-Valverde, M. J. Prieto-Álamo, J. Jurado, M. Carrascal, J. L. Gómez-Ariza, J. López-Barea and C. Pueyo, Proteomics, 2007, 7, 4376–4387 CrossRef CAS.
- J. López-Barea and J. L. Gómez-Ariza, Proteomics, 2006, 6(s1), S51–62 CrossRef.
- V. Funes, J. Alhama, J. I. Navas, J. López-Barea and J. Peinado, Environ. Pollut., 2006, 139, 214–223 CrossRef CAS.
- A. Visoque-Fernándeza, E. Eduardo Alves de Almeida and J. López-Barea, Sci. Total Environ., 2009, 407, 1784–1797 CrossRef.
- M. Rodríguez-Ortega, B. E. Grøsvik, A. Rodríguez-Ariza, A. Goksøyr and J. López-Barea, Proteomics, 2003, 3, 1535–1543 CrossRef CAS.
- J. Ruíz-Laguna, C. García-Alfonso, J. Peinado, S. Moreno, L. A. Ieradi, M. Cristaldi and J. López-Barea, Biomarkers, 2001, 6, 146–160 CrossRef CAS.
- A. C. Nunes, M. L. Mathias and A. M. Crespo, Environ. Pollut., 2001, 113, 87–93 CrossRef CAS.
- D. Bonilla-Valverde, J. Ruiz-Laguna, A. Muñoz, J. Ballesteros, F. Lorenzo, J. L. Gómez-Ariza and J. López-Barea, Toxicology, 2004, 197, 122–138 CrossRef.
- J. Ruiz-Laguna, N. Abril, T. Garcia-Barrera, J. L. Gomez-Ariza, J. Lopez-Barea and C. Pueyo, Environ. Sci. Technol., 2006, 40, 3646–3652 CrossRef CAS.
- M. González-Fernández, T. García-Barrera, J. Jurado, M. J. Prieto-Álamo, C. Pueyo, J. López-Barea and J. L. Gómez-Ariza, Pure Appl. Chem., 2008, 80(12), 2609–2626 CrossRef CAS.
- H. Haraguchi, J. Anal. At. Spectrom., 2004, 19, 5–14 RSC.
- J. Szpunar, Anal. Bioanal. Chem., 2004, 378, 54–56 CAS.
- J. L. Gomez-Ariza, T. Garcia-Barrera, F. Lorenzo, V. Bernal, M. J. Villegas and V. Oliveira, Anal. Chim. Acta, 2004, 524, 15–22 CrossRef CAS.
- A. Sanz-Medel, Anal. Bioanal. Chem., 2005, 381, 1–2 CrossRef CAS.
- D. W. Koppenaal and G. M. Hieftje, J. Anal. At. Spectrom., 2007, 22, 855 RSC.
- S. Mounicou, J. Szpunar and R. Lobinski, Chem. Soc. Rev., 2009, 38, 1119–1138 RSC.
- A. Sainz, J. A. Grande and M. L. de la Torre, Environ. Int., 2002, 30, 557–566.
- M. González-Fernández, T. García-Barrera, A. Arias-Borrego, D. Bonilla-Valverde, J. López-Barea, C. Pueyo and J. L. Gómez-Ariza, Anal. Bioanal. Chem., 2008, 390, 17–28 CrossRef CAS.
- P. A. Gallagher, X. Wei, J. A. Shoemaker, C. A. Brockhoff and J. T. Creed, J. Anal. At. Spectrom., 1999, 14, 1829–1834 RSC.
- S. McSheehy, J. Szpunar, R. Lobinski, V. Haldys, J. Tortajada and J. S. Edmonds, Anal. Chem., 2002, 74, 2370–2378 CrossRef CAS.
- http://www.uniprot.org/ .
Footnote |
| † This article is part of a themed issue highlighting outstanding and emerging work in the area of speciation. |
| This journal is © The Royal Society of Chemistry 2011 |
