Combatting ionic aggregation using dielectric forces—combining modeling/simulation and experimental results to explain end-capping of primary amine functionalized polystyrene
Jamie M.
Messman
*a,
Deanna L.
Pickel
a,
Monojoy
Goswami
a,
David W.
Uhrig
a,
Bobby G.
Sumpter
ab and
Jimmy W.
Mays
ac
aCenter for Nanophase Materials Sciences, Oak Ridge National Laboratory, Oak Ridge, TN 37831, USA. E-mail: messmanjm@ornl.gov
bComputer Science and Mathematics Division, Oak Ridge National Laboratory, Oak Ridge, TN 37831
cDepartment of Chemistry, University of Tennessee, 655 Buehler HallKnoxville, TN 37996
First published on 24th August 2011
Abstract
Chain-end functionalization of living poly(styryl)lithium using 1-(3-bromopropyl)-2,2,5,5-tetramethyl-1-aza-2,5-disilacyclo-pentane (BTDP) to generate primary amine end-functionalized polystyrene was investigated using high vacuum anionic polymerization techniques. 13C NMR spectroscopy and Matrix Assisted Laser Desorption Ionization Time-of-Flight Mass Spectrometry (MALDI-TOF MS) were used to evaluate polymer end-groups and demonstrated that quantitative amine functionalized polymer was attained under appropriate reaction conditions. In general, the polymerization of styrene was conducted in benzene and the end-capping reaction was performed by adding tetrahydrofuran (THF) to the reaction prior to the addition of BTDP in THF at room temperature. Results indicated that approximately 20% THF by volume is required to obtain 100% end-capping free from side reactions. When too little or no THF was present, side reactions such as lithium halogen exchange followed by Wurtz coupling resulted in unfunctionalized head-to-head dimer as well as other byproducts. Modeling and simulation of the solvent effects using hybrid methods (the so-called QM/MM method) suggest that THF effectively dissociated the anionic chain-end aggregation, thereby resulting in the desired primary amine functionalized polymer. Molecular dynamics (MD) simulations were conducted to develop an understanding of the physics of counterions involved in the end-functionalization process.
Introduction
Polymers bearing end-functionalized reactive groups have received attention due to the vast capabilities that end-functionalization provides to tailor polymer/surface/material properties for myriad applications.1–3 For instance, end-functional polythiophene has been used to control the morphology of cadmium selenide nanocrystal-polymer composites used in hybrid solar cells.4 Development of such end-capped materials are important for the application of device electronics5,6 as well as “smart” bio-relevant materials.7 Recently, end-functional polymers have also been used as macroinitiators to synthesize well-defined, complex macromolecular chimeras by combining living anionic and ring opening polymerization high vacuum techniques.8 Moreover, these types of macromolecules have remarkable properties upon self-assembly and confinement.9 The design of these novel materials requires not only a detailed understanding of the basic physics that drives their behavior, but also a deeper comprehension of the chemistry used in the synthesis.Several methods for polymerizing vinyl monomers provide the ability to tailor macromolecular architecture including precise control of end-group functionality. Controlled free-radical polymerization (CFRP) techniques such as reversible addition fragmentation chain transfer (RAFT) and atom transfer radical polymerization (ATRP) have several advantages over other polymerization mechanisms, most notably monomer choice and tolerance to impurities. These strategies have been used in numerous instances; however, CFRP techniques undoubtedly suffer from termination reactions to some extent and rarely proceed with complete monomer consumption. Living anionic polymerization, in most cases, provides a reaction pathway free of undesired termination and allows for 100% monomer conversion, for many monomers, which is essential to the synthesis of block copolymers as well as chain-end functionalized polymers prepared via sequential addition of reactants (i.e., a second monomer or terminating agent). Furthermore, the nature of anionic polymerization offers the ability to produce polymers with predetermined molecular weight, low polydispersity, and precise end-group control depending on the choice of initiator and/or terminating agent. Controlling end-group chemistry is essential to materials science particularly with respect to surface modification, colloid chemistry, and drug delivery applications to name a few.
There have been several reports of the synthesis and characterization of primary amine functionalized polymers.10–15 In most cases, end-group functionality is less than 100%; however, Quirk and Lee demonstrated a method by which to obtain pure amine-functionalized polymers using coupling chemistry followed by silica gel column chromatography.16 This method required the use of lithium chloride to promote a coupling reaction of living poly(styryl)lithium with 3-dimethylaminopropyl chloride, which produced both the desired amine-functionalized product and unwanted head-to-head dimer (∼23%) that was effectively removed viachromatography. Additionally, Quirk and Lynch17 reported the anionic synthesis of aniline end-functionalized polystyrene at room temperature; the functionalization was nearly quantitative (98.5%), likely approaching the limits of detection, and the basicity/nucleophilicity of aniline –NH2 is markedly different than aliphatic –NH2, which has implications on the desired end use of the functionalized polymers. Ueda et al. have previously reported the use of 1-(3-bromopropyl)-2,2,5,5-tetramethyl-1-aza-2,5-disilacyclo-pentane (BTDP) to functionalize polystyrene and polyisoprene.14 In this instance, the authors demonstrated a very high degree of functionalization/amination (quantitative for polyisoprene and up to 98% for polystyrene), but the characterization methods of determining amination (viz. acid–base titration combined with SEC or VPO, and TLC/FID) are not as effective as mass spectrometry techniques currently available. Moreover, the report by Ueda and coworkers is not clear how exactly the polymerization and functionalization were conducted. The manuscript indicates polymerizations were performed at −78 °C followed by addition of BTDP, which was subsequently allowed to warm to 25 °C (room temperature). However, the information associated with Table II14 indicates that the polymerization was carried out in benzene, and reactions were performed in THF-benzene mixtures (ca. 1/5, v/v), which achieved 98% amine functionalization. Regardless, it is apparent that a high degree of functionalization was achieved, but not quantitative, which may have been a limit of the characterization methods. Recently, Ji et al. reported the synthesis of primary amine functionalized polystyrene using BTDP; however, this reaction was plagued by the presence of head-to-head dimer possibly due to adding BTDP in bulk rather than solution.18 Another possible reason these authors were not able to control the end-capping reaction is due to anionic aggregation of living poly(styryl)lithium chains. The insufficient amount of THF used (∼1% by volume) did not effectively disrupt aggregation, subsequently resulting in lithium-halogen exchange followed by Wurtz coupling.
Here we report the detailed synthesis and characterization of ω-amino-functionalized polystyrene (PS-NH2) at room temperature in the presence of a co-solvent system (benzene-THF). 13C NMR spectroscopy and MALDI-TOF MS were used to demonstrate the effectiveness of the reaction by contrasting the products resulting from a variety of reaction conditions.
Experimental
Materials
In general, purification of solvents (benzene, THF, and n-hexane) and monomer (styrene) was achieved by traditional preparative procedures for high vacuum anionic polymerization techniques.19,20sec-Butyllithium was synthesized according to a previously published method.21Benzene was stored over living poly(styryl)lithium, whereas THF was stored over sodium-potassium alloy (Na/K) in separate solvent reservoirs attached to a high vacuum line. 1-(3-Bromopropyl)-2,2,5,5-tetramethyl-1-aza-2,5-disilacyclopentane (BTDP, Aldrich, 97%) was dried overnight over calcium hydride, distilled under dynamic high vacuum, diluted to 0.5 M with dry THF, and finally ampoulized under high vacuum.Synthesis of primary amine-functionalized polystyrene
In a typical experiment, an ampoule of styrene (23.0 mL, 0.200 mol) was dissolved in 70 mL dry benzene. Polymerization was initiated upon addition of 6.0 mL (0.947 M, 5.68 mmol) sec-butyllithium solution. The reaction was allowed to proceed overnight (∼15 h). Prior to the addition of the BTDP, a small volume of THF (∼ 4 mL) was added to increase the polarity of the medium. Next, ∼25 mL BTDP solution (0.5 M in THF, 12.5 mmol) was added by opening the break seal and rigorously mixing the reactants for ∼2 min thereby resulting in instantaneous loss of the deep orange color of the living poly(styryl)lithium adduct. The quenching reaction was allowed to proceed for an additional 30–60 min before the reactor was opened to the atmosphere. The terminated PS solution was poured into a 10-fold excess of methanol, which ultimately cleaves the silyl moiety, thereby generating the free primary amine. Polymer was filtered and dried in a vacuum oven until a constant mass was obtained. The theoretical/target molecular weight based on stoichiometry, Mn,stoichiometry = 3760 g mol−1, is in excellent agreement with the molecular weight determined by MALDI-TOF MS, Mn,MALDI = 3790 g mol−1, PDI = 1.01.Instrumentation
Solution 1H and 13C NMR spectroscopy was performed on a Bruker MSL-400 wide bore multinuclear spectrometer. Samples were placed in 5 mm-o.d. tubes with sample concentrations of 5 and 10% (w/v), respectively. Chloroform-d (CDCl3) was used as the solvent using residual solvent peaks as internal standards. The MW of PS was limited to <4000 g mol−1 for end-group analysis using 13C NMR spectroscopy.Size exclusion chromatography (SEC) was performed using a Waters Alliance 2695 Separations Module equipped with three Polymer Labs PLgel 5 μm mixed-C columns (300 × 7.5 mm) in series, a Waters Model 2414 Refractive Index detector, a Waters Model 2996 Photodiode Array detector, a Wyatt Technology miniDAWN multi-angle light scattering (MALS) detector, and a Wyatt Technology ViscoStar viscometer. Waters Empower™ 2 Software was used to generate a conventional calibration curve based on low PDI polystyrene standards (162–6.04 × 10⁶ g mol−1) and subsequently evaluate molecular weight characteristics. High temperature size exclusion chromatography (HTSEC) was performed on a Waters GPCV2000 equipped with Viscotek ViscoGEL I-Series columns (1 Mixed Bed Low MW and 2 Oligomeric MW in series), a differential refractometer (λ = 880 nm) and a Precision Detectors two-angle light scattering detector (λ = 682 nm) operating at 60 °C. Waters Alliance GPC 2000 software was used to collect data, which was subsequently analyzed using Waters Empower software in which a conventional calibration curve based on low PDI polystyrene standards (162–5.00 × 10⁴ g mol−1) was used to evaluate molecular weight characteristics. DMF containing 0.05 M lithium bromide (LiBr) was used as the eluent at a flow rate of 1.0 mL/min.
MALDI-TOF MS data was collected using a Bruker Daltonics Autoflex II mass spectrometer. The instrument is equipped with a N2 laser (λ = 337 nm) with a frequency of 5 Hz and an accelerating voltage of 20 kV. Dithranol was used as the matrix in the MALDI-TOF MS measurements of PS-NH2 reported herein Additionally, mass spectra were collected using the matrix trans,trans-1,4-diphenyl-1,3-butadiene, which has been discussed in a previous report.22Silver trifluoroacetate (AgTFA) was used as the cationizing reagent (salt). Solutions of matrix (20 mg mL−1), polymer (10 mg mL−1), and cationic reagent (10 mg mL−1) were prepared in THF. A volume of 1 μL of the mixture solution (10![[thin space (1/6-em)]](https://www.rsc.org/images/entities/char_2009.gif) :
:![[thin space (1/6-em)]](https://www.rsc.org/images/entities/char_2009.gif) 2
2![[thin space (1/6-em)]](https://www.rsc.org/images/entities/char_2009.gif) :
:![[thin space (1/6-em)]](https://www.rsc.org/images/entities/char_2009.gif) 1 matrix:analyte:salt) was applied to the sample target, and the solvent was evaporated in air (the dried droplet method). Mass spectra were measured in reflectron mode, and the mass scale was externally calibrated with polystyrene standards. Spectra are a summation of 1000 shots.
1 matrix:analyte:salt) was applied to the sample target, and the solvent was evaporated in air (the dried droplet method). Mass spectra were measured in reflectron mode, and the mass scale was externally calibrated with polystyrene standards. Spectra are a summation of 1000 shots.
Modeling and simulation
In order to investigate the effects of solvent composition on the association of multiple anions, the hybrid modeling approach utilizing the quantum mechanics/molecular mechanics (QM/MM) method was employed. In this approach we used explicit solvent molecules for each system and this was treated with molecular mechanics (MM) using Allinger's MMX force field.23,24 The PM3 approach25,26 was used to define the quantum region that included two styryl anions composed of 2 monomers each. Full geometry optimization was performed for each system as well as some limited (short time) molecular dynamics at room temperature.Briefly, a hybrid QM/MM potential is achieved by introducing the solvent electric field into quantum mechanical calculations of the solute molecule on the fly during a computer simulation such that the molecular wavefunction of the solute will be polarized by the dynamic charge of the surrounding solvent molecules. The QM/MM method was first described by Warshel in 197627 and a detailed prescription for molecular orbital (MO) calculations was presented by Field, Bash and Karplus in 1990.28 The fundamental idea is to divide a condensed phase system into a QM region and a MM region, plus an appropriate boundary condition to mimic bulk effects. This leads to an effective Hamiltonian:
| H eff = HoQM + HMM + HelecQM/MM + HvdWQM/MM |
The van der Waals term, HvdWQM/MM, is necessary to ensure that the QM and MM systems will not get too close due to the lack of an electronic structural description of the solvent MM system. It is important to account for the short-range electron repulsions; however, for convenience as well as for inclusion of important dispersion interactions, a Lennard-Jones term is typically used for HvdW. The parameters must be carefully examined for a given QM (model, basis set, and level of theory) and MM force field combination. While this is somewhat cumbersome, it can provide an opportunity to optimize the performance of the hybrid QM/MM potential. Therefore, even though the standard semiempirical methods such as AM1, PM3, etc., are generally not considered to be very good at describing hydrogen bonding interactions, a hybrid QM/MM model can often yield good results.
In the present study we used the QM/MM method as implemented in the HyperChem 8.0 code. The QM system was defined as two styryl anions composed of two styrene monomers and the MM region was an explicit molecular solvent (either THF, benzene or a mixture; total number of molecules was constant). The solvent system was initially prepared by using full MM+ optimization of a relatively modest (260 molecules) system without periodic boundary conditions. Two styryl anions were randomly oriented within the solvent system by performing MM optimization of the solvent. Following this procedure, the total system was allowed to relax using the QM/MM approach, where the solvent was treated with MM and the styryl anions with PM3.
To augment our understanding of counterion agglomeration and their effect in creating an environment suitable for amine functionalization we performed classical molecular dynamics (MD) simulation of charged polymer with explicit counterions. The MD simulations were carried out for a charged polymer system of chain length 128 with the first monomer having a monovalent charge unit. The initial configurations are randomly generated with a number density of monomers ρσ3 = 0.25 with equal number of counterions distributed in the system. All the monomers of the system have mass mi and diameter σ. Polymer chains are modeled following the Kremer–Grest bead spring polymer model in which bonded beads are connected by finitely extensible non-linear elastic (FENE) springs represented by UFENEij (rij) = −0.5κR02ln[1-(rij/R0)2], where R0 = 1.5σ is the finite extensibility and κ = 37.5ε/σ2 is the spring constant. The energetic interaction between any pair of uncharged monomers beads is modeled by a truncated shifted Lennard-Jones (LJ) potential, ULJij(rij) = 4ε[(σ/rij)12 − (σ/rij)6 + 1], where ε is the LJ energy parameter = 1.0 for repulsive interactions and 2.0 for attractive LJ. For the charged sites, explicit Coulomb interactions have been considered for which Ewald summation techniques are used. The motions of the particles are governed by classical Newton–Langevin equation: midvi/dt = − Ui(r) − γdri/dt + Wi(t), where Ui is the potential, γ is the friction coefficient between the chain monomer and background solvent and Wi(t) represents a Gaussian ‘white noise’ with zero mean acting on each particle. The last two terms couple the system to a heat bath where the friction term acts as a ‘heat sink’ and the noise term acts as a heat source. The advantages of this scheme, is that the natural MD integration time steps are larger, thereby permitting simulation at longer time scales. On this time scale, only the mean effect of the stochastic forces acting on the system needs to be considered, leading to a first-order temperature relaxation which in turn reduces the need of an external thermostat. The charge sites and the counterions interact via Coulomb potential, UCij = qiqj/Dr*, where D is the dielectric constant of the medium. At this point we introduce a second energy scale parameter, which is the ratio of Coulomb and LJ interactions: ξB = q2/Dσε, which is the electrostatic strength parameter. The dimensionless units are defined as follows, t* = t/√(miσ2/ε), ρ* = ρσ3, T* = kBT/ε, U* = U/kBT and r* = r/σ.
Results and discussion
Ueda et al.14 and Ji et al.18 previously demonstrated the ability to generate primary amine terminated polystyrene by end-capping the living polystyryl anion using BTDP. The conditions chosen in these experiments did not produce quantitative chain-end functionality. Characterization methods used by Ueda and coworkers potentially were not sensitive enough to show the side products of the reaction, but these authors were able to achieve very high degrees of amine functionality (98%).14Lithium-halogen exchange, a process by which a living anionic polymer chain end abstracts a halogen atom rather than displace or substitute (i.e., nucleophilic substitution, SN) a halogen, resulted in head-to-head dimer formation and was observed using MALDI-TOF MS by Ji and coworkers.18 In this earlier work, Ji and coworkers used ∼10% excess BTDP; however, the end-capping agent was used in bulk. It is believed that a solution of BTDP in THF sufficiently separates BTDP molecules thereby generating an environment more conducive to nucleophilic substitution rather than lithium-halogen exchange. Moreover, it is believed that addition of a polar additive such as THF effectively separates poly(styryl)lithium chains such that aggregation is minimal or non-existent. In essence, this “pre-solvation” leads to charge separation, delocalization, and stabilization of the ionic bond.The general polymerization and functionalization process is outlined in Scheme 1. Styrene is polymerized in typical anionic fashion using high vacuum techniques (HVT) in benzene followed by the addition of a small amount of THF at room temperature.
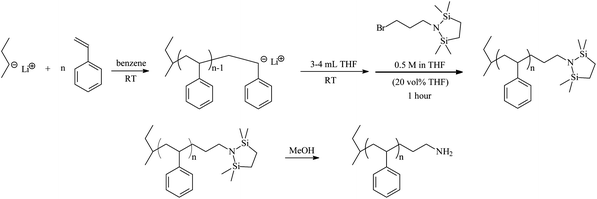 | ||
| Scheme 1 Synthesis of ω-amino functionalized polystyrene (PS-NH2) | ||
For all polymers synthesized in this study, regardless of target molecular weight (monomer: initiator ≤ 35), addition of BTDP with ≥ 20% THF (by volume) resulted in quantitative functionalization of the living polystyryl anion. Evidence for the success using this procedure is clearly demonstrated using 13C NMR spectroscopy and MALDI-TOF MS. Fig. 1 illustrates the difference observed in 13C NMR spectra for PS-NH2 (a) containing head-to-head dimer and (b) in the absence of the carbon-carbon bond from 48–50 ppm, denoted αCH. αCH corresponds to the head-to-head dimer due to lithium halogen exchange followed by Wurtz coupling previously described by Hensley et al.29 and Quirk et al.30 The calculated chemical shift for αCH has been reported earlier as 48.9 ppm29 or 49.2 ppm.31 Furthermore, peaks associated with the ω-terminal methylene carbon atoms were observed at 35.5 ppm (CH2CH2CH2NH2) and 30.2 ppm (CH2CH2CH2NH2); the ultimate methylene carbon (CH2CH2CH2NH2) could not be resolved from the backbone methylene carbons, but the expected chemical shift is ∼42.4 ppm based on calculations using ChemBioDraw Ultra 12.0 software.
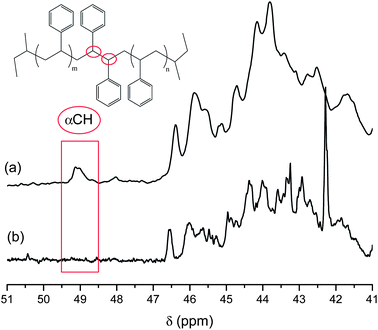 | ||
| Fig. 1 Partial 13C NMR spectra of PS-NH2 showing the (a) presence and (b) absence of head-to-head dimer carbon, αCH. PS-NH2 was prepared at room temperature using HVT with (a) no THF additive and (b) 20% THF final volume, Mn,MALDI = 3790 g/mol. MALDI TOF MS of (a) is shown in Fig. 3 (green chromatogram). | ||
Further compelling evidence for quantitative functionalization is provided by MALDI-TOF MS. Fig. 2 shows the full MALDI-TOF mass spectrum for PS-NH2 with a single distribution in which all chains have [C4H9(C8H8)n(CH2)3NH2·Ag]+ structure (Δ = 104.25 Da) and isotopic resolution. The inset shows the observed mass (3239.87 m/z) for the 29-mer [C4H9(C8H8)29(CH2)3NH2·Ag]+, which is in excellent agreement with the calculated mass (3239.86 Da). There are no observed peaks above 6000 Da providing further evidence that head-to-head coupling did not occur.
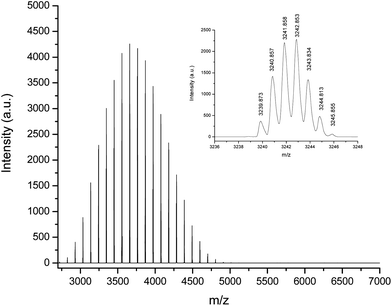 | ||
| Fig. 2 MALDI TOF mass spectrum of PS-NH2 prepared at room temperature using HVT with 20% THF final volume. | ||
SEC was also used to evaluate the molecular weight characteristics of PS-NH2 using THF or DMF as the eluent. Regardless of the solvent choice, the SEC chromatogram displayed a high molecular weight shoulder, which was exactly double the molecular weight of the main peak (i.e., target molecular weight). It is believed that this shoulder is due to aggregation of oligomers and not head-to-head dimer, which was not observed in either the 13C NMR spectrum or by MALDI-TOF MS. Attempts to disrupt the aggregation in THF using hexafluoroisopropanol or triethylamine did not improve the SEC trace, but rather enhanced the high MW peak (see Supporting Information). Furthermore, using 0.05 M LiBr in DMF, which is typically used to disrupt aggregation of polypeptides derived from amino acid-N-carboxyanhydride polymerization, was similarly unable to disrupt aggregation for PS-NH2. As a result, SEC is not a preferred method to analyze the molecular weight characteristics of PS-NH2, in particular. Similar difficulties analyzing PS-NH2 using SEC have been reported.14,32 Additionally, TLC was performed on the raw products (prior to precipitation and isolation) similar to that previously described by Ji and coworkers.18 In this work, PS-NH2 prepared using 20% THF showed only one spot corresponding to the ω-amino functionalized polymer (product remains at origin of spotting); in cases where too little THF was used, a second spot is observed (Rf ∼ 0.75), which has previously been ascribed to unfunctionalized polymer (i.e., without primary amine functionality).18
To demonstrate the necessity of THF as an additive required to promote 100% end-group functionalization, experiments were carried out where living poly(styryl)lithium was divided into three ampoules and subsequently terminated with (a) methanol, (b) BTDP with THF (12% final volume), and (c) BTDP in benzene. In the case where no THF was used, BTDP was dissolved in purified benzene. In all cases, the targeted degree of polymerization (DP) was 15 for this set of experiments.
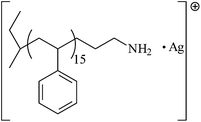
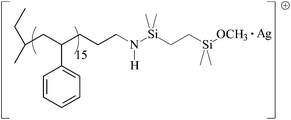
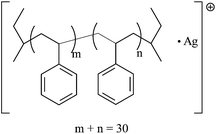
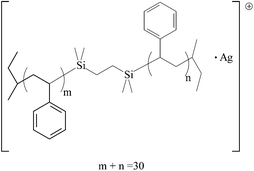
Based on the results, five unique products were identified in these experiments and are outlined in Table 1. Peak I is the desired ω-primary amine terminated product. Peak II is unfunctionalized PS (typically derived by quenching the polymerization with a proton source such as methanol). Peak III is the result of incomplete removal of the protecting group on the terminating agent. Peak IV is identified as the head-to-head dimer and results from lithium-halogen exchange followed by Wurtz coupling. Peak V is the product of two poly(styryl)lithium chains attacking the Si–N bonds in the same BTDP molecule as previously described by Ji et al.18
| Peaks | Structures | Calculated mass (Da) | Observed mass (m/z) |
|---|---|---|---|
| I |
|
1782.98 | 1783.07 |
| II |
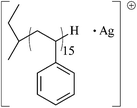
|
1725.92 | 1726.00 |
| III |
|
1957.07 | 1957.24 |
| IV |
|
3342.92 | 3343.04 |
| V |
|
3487.00 | 3488.14 |
The overlaid MALDI-TOF mass spectra for the experiments described previously are shown in Fig. 3. As expected, the product from termination of the polymerization with methanol (black spectrum, Fig. 3) shows a unimodal distribution with only one observed product, Peak II (Table 1). On the other hand, when no additive (THF) is used (i.e., polymerization and termination reactions carried out in benzene), several distributions are observed and the major product is head-to-head dimer (Peak IV) as observed in the green chromatogram (Fig. 3). For the case when an insufficient amount of THF (12% by final volume) is added, there is some selectivity toward PS-NH2 formation (Peak I), but head-to-head dimer (Peak IV) is present, which is observed in the red chromatogram. Peak V is observed only in trace amounts in the latter two experiments. In all cases, the difference in the repeat unit is 104.25 Da for each distribution. In the black and red chromatograms, denoted PS-H and PS-NH2 (12% THF), respectively, the apex of the peaks is centered around 1700 ∼ 1750 Da. The major peak (higher molecular weight) in the green chromatogram has a main distribution around 3500 Da, which is exactly double that of the red and black chromatograms and is identified as the head-to-head dimer structure (Peak IV). Furthermore, there is a low molecular weight distribution observed in the green chromatogram that is centered around 2250 Da; this distribution is shifted to slightly higher molecular weight in comparison to the black and red chromatograms and is due to a difference in end-groups. The lower molecular weight peak in the green chromatogram is attributed to Peak III, which is ∼ 200 Da greater for the 15-mer (Table 1). Therefore, for the each repeat unit (n-mer), the molecular weight is ∼200 Da higher and thus the distribution appears shifted to higher molecular weight.
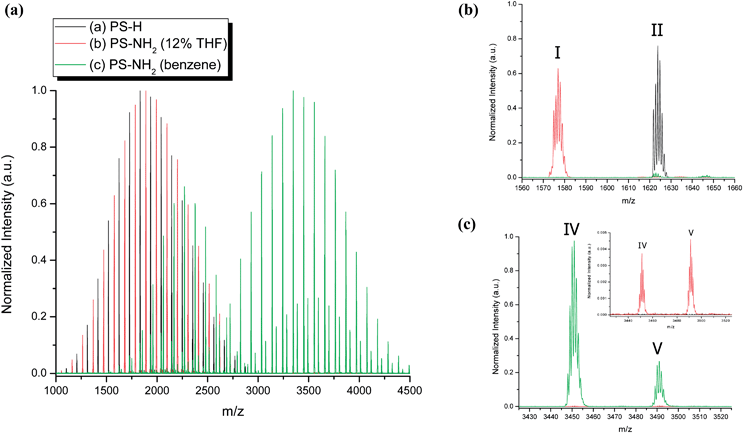 | ||
| Fig. 3 MALDI-TOF MS for living poly(styryl)lithium terminated with (a) methanol (black chromatogram), (b) BTDP with THF additive (12% final volume) (red chromatogram), and (c) BTDP in pure hydrocarbon (benzene) (green chromatogram). | ||
In order to explain the observed results, several calculations were made for a system composed of two styryl anions in the presence of varying amounts of benzene (non-polar) and THF (polar) solvent. A QM/MM simulation was performed with the quantum part representing the styryl anions and the molecular mechanics part representing the solvent. In general, the anion aggregation differs for each system when a single solvent is used. Fig. 4 shows the equilibrated structure for the different solvated systems with styryl anion distance of (A) 15 Å for benzeneversus (B) 20 Å for THF.
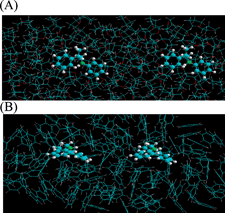 | ||
| Fig. 4 QM/MM simulation representing two styryl anions separated in (A) benzene and (B) THF. | ||
In a mixed solvent system, the negative electrostatic isosurface becomes more delocalized onto both phenyl rings of the styryl anions as the THF content increases, which ultimately causes repulsion. For a THF-rich mixture of 80/20 THF/benzene, the anion association is identical to pure THF (20 Å distance separating two styryl anions). Reducing the amount of THF in the mixture to 42% (by volume) begins to affect the anion-anion separation (separation distance is 18 Å). Simulating the 20% THF (by volume) reaction mixture yields an anion-anion separation of 18.4 Å, a slight increase from the 42/58 THF/benzene system. Further reduction in THF content to 12% (by volume) produces an anion-anion separation of 17.5 Å. While the absolute values of the anion-anion separations are not necessarily quantifiable, the trend that is observed in the simulation is substantial and suggests that polystyryl anions are more effectively separated as THF content increases. Fig. 5 shows the calculated electrostatic isosurface for two phenyl rings, which represents the living anions/chain ends, in close proximity in solvent systems comprised of (A) 80/20 THF/benzene (by volume), (B) 20/80 THF/benzene, and (C) 12/88 THF/benzene. The negative electrostatic isosurface (pink color) is delocalized onto both phenyl rings, which causes repulsion between the two anions. This electrostatic potential is modulated by the content of THF. Reduced delocalization of negative electrostatic potential region allows the 2 styryl anions to move closer together when THF volume is reduced from 80% to 20% (compare Fig. 5 A and B). The negative electrostatic potential that causes repulsion between the two anions is believed to be the main mechanism that effectively separates the anions in a 20/80 THF/benzene solvent system to ultimately achieve 100% chain end functionalization. The 12/88 THF/benzene system starts to look closer to 100% benzene in that the styryl anions move closer together (17.5 Å); however, there is still an effect caused by the THF, which is why there is an observed selectivity toward PS-NH2 formation in the synthetic experiment (see Fig. 3 (b), red chromatogram).
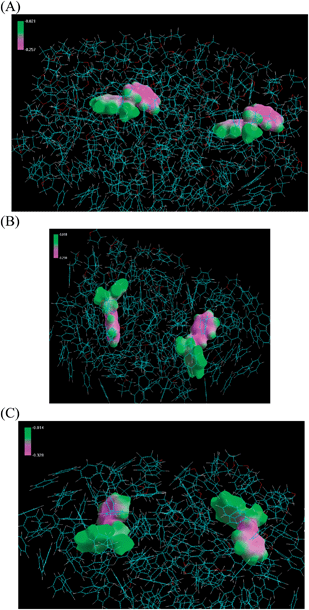 | ||
| Fig. 5 Simulation of delocalization of electrostatic potential for anion separation in mixed solvent systems comprised of (A) 80/20 THF/benzene (by volume), (B) 20/80 THF/benzene, and (C) 12/88 THF/benzene. | ||
To understand the effect of dielectric constant on the dynamics of counterions that hinders/helps the amine end-capping, we performed a classical MD simulation to augment the QM/MM simulation results. Experiments have indicated that approximately 20% THF by volume is required to obtain 100% end-capping free from side reactions. When too little or no THF was present, side reactions such as lithium halogen exchange followed by Wurtz coupling resulted in unfunctionalized head-to-head dimer as well as other byproducts. Adding THF increases the dielectric constant of the medium. Therefore, we expect to observe a similar behavior when dielectric constant of the medium is changed in MD studies. The simulations are carried out for chains of length 128 at a density 0.25 where the chain end is capped with a charged site to represent amine end-capped chains. We vary the dielectric constant of the system for a constant temperature. Fig. 6 shows the snapshots and potential of mean force for three different dielectric constants (ξB is inversely proportional to D). In Fig. 6(a), at high dielectric constant, the end groups are not surrounded by counterions (pink dots), thereby allowing the BTDP to end-cap the anions. As dielectric constant is decreased (high ξB), more and more counterions agglomerate at the living chain-end, which is seen in Fig. 6(b) and (c). The agglomeration of counterions prevents the end-functionalization reaction from occurring. It can be observed from the PMF studies (Fig. 6(d)) that the activation energy for the counterions increases as the dielectric constant of the medium is reduced. The increase in D (decrease in ξB) shows a lower potential barrier. For an intermediate dielectric constant, ξB = 6 (green curve), PMF shows the highest potential barrier for the agglomeration. Using MD simulation, we qualitatively demonstrated that the counterions need to be displaced for an effective end-capping and that can only be done by increasing the dielectric constant of the medium, i.e., by introducing THF in the system.
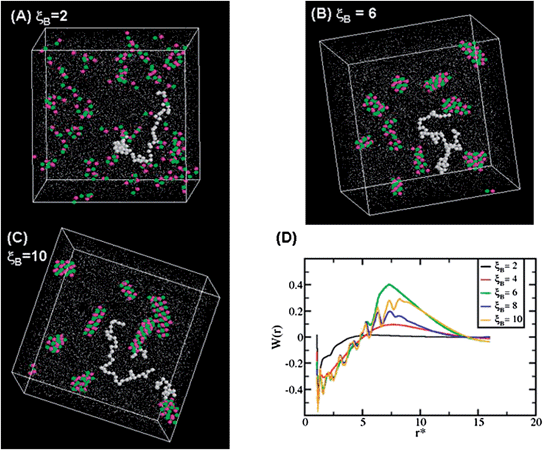 | ||
| Fig. 6 Molecular dynamics simulation snapshots and potential of mean force. (a), (b) and (c) are the central simulation cell snapshots for ξB = 2, 6 and 10 respectively. The white dots are chain monomers, green dots are chain end group (charge sites on the chain) and the pink dots are counterions. Only a single chain of monomers are shown for clarity. The rest of the chain is shown in tiny white dots. ξB is inversely proportional to the dielectric constant. Figure (d) shows the potential of mean force (PMF) for all the ξB. The PMF shows a potential barrier for higher ξB, i.e. lowering D causes the counterions to agglomerate. | ||
Conclusion
We have shown the quantitative chain-end functionalization of living poly(styryl)lithium at room temperature using 1-(3-bromopropyl)-2,2,5,5-tetramethyl-1-aza-2,5-disilacyclo-pentane (BTDP) with THF as an additive. It is believed that addition of THF provides sufficient anion separation to promote nucleophilic replacement and completely hinders lithium-halogen exchange. QM/MM was used to illustrate the trends observed experimentally. The simulation indicated that the negative electrostatic isosurface of the phenyl rings of the styryl anions becomes more delocalized as THF content increases resulting in repulsion of polymer chains. To this end, the solvent-separated anions undergo nucleophilic displacement with BTDP rather than undesired lithium-halogen exchange and subsequent Wurtz coupling reactions.Acknowledgements
This research was conducted at the Center for Nanophase Materials Sciences, which is sponsored at Oak Ridge National Laboratory by the Scientific User Facilities Division, U.S. Department of Energy.References
- L. A. Canalle, D. W. P. M. Lowik and J. C. M. van Hest, Chem. Soc. Rev., 2010, 39, 329–353 RSC
.
- T. Higashihara, M. Hayashi and A. Hirao, Prog. Polym. Sci., 2011, 36, 323–375 CrossRef CAS
.
- F. Wurm and H. Frey, Prog. Polym. Sci., 2011, 36, 1–52 CrossRef CAS
.
- J. Liu, T. Tanaka, K. Sivula, A. P. Alivisatos and J. M. J. Fréchet, J. Am. Chem. Soc., 2004, 126, 6550–6551 CrossRef CAS
.
- G. Moad, M. Chen, M. Häussler, A. Postma, E. Rizzardo and S. H. Thang, Polym. Chem., 2011, 2, 492–519 RSC
.
- M. C. Iovu, E. E. Sheina, R. R. Gil and R. D. McCullough, Macromolecules, 2005, 38, 8649–8656 CrossRef CAS
.
- K. Velonia, Polym. Chem., 2010, 1, 944–952 RSC
.
- A. Karatzas, H. Iatrou and N. Hadjichristidis, Biomacromolecules, 2008, 9, 2072–2080 CrossRef CAS
.
- N. Hadjichristidis, H. Iatrou, M. Pitsikalis and G. Sakellariou, Chem. Rev., 2009, 109, 5528–5578 CrossRef CAS
.
- R. P. Quirk, K. Han and Y. Lee, Polym. Int., 1999, 48, 99–108 CrossRef CAS
.
- I. Fallais, J. Devaux and R. Jerome, J. Polym. Sci., Part A: Polym. Chem., 2000, 38, 1618–1629 CrossRef CAS
.
- R. P. Quirk, H. Kim, M. J. Polce and C. Wesdemiotis, Macromolecules, 2005, 38, 7895–7906 CrossRef CAS
.
- G. J. Summers, M. P. Ndawuni and C. A. Summers, Polym. Int., 2003, 52, 158–163 CrossRef CAS
.
- K. Ueda, A. Hirao and S. Nakahama, Macromolecules, 1990, 23, 939–945 CrossRef CAS
.
- S. Ji, T. R. Hoye and C. W. Macosko, Macromolecules, 2005, 38, 4679–4686 CrossRef CAS
.
- R. P. Quirk and Y. Lee, J. Polym. Sci., Part A: Polym. Chem., 2000, 38, 145–151 CrossRef CAS
.
- R. P. Quirk and T. Lynch, Macromolecules, 1993, 26, 1206–1212 CrossRef CAS
.
- H. Ji, G. Sakellariou and J. W. Mays, Macromolecules, 2007, 40, 3461–3467 CrossRef CAS
.
- M. Morton and L. J. Fetters, Rubber Chem. Technol., 1975, 48, 359–409 CrossRef CAS
.
- N. Hadjichristidis, H. Iatrou, S. Pispas and M. Pitsikalis, J. Polym. Sci., Part A: Polym. Chem., 2000, 38, 3211–3234 CrossRef CAS
.
- D. Uhrig and J. W. Mays, J. Polym. Sci., Part A: Polym. Chem., 2005, 43, 6179–6222 CrossRef CAS
.
- H. Ji, W. K. Nonidex, R. C. Advincula, G. D. Smith, S. M. Kilbey II, M. D. Dadmun and J. W. Mays, Macromolecules, 2005, 38, 9950–9956 CrossRef CAS
.
-
U. Burkert; N. L. Allinger. Molecular MechanicsACS Monograph 177, (ACS, Washington, 1982) Search PubMed
.
-
A. K. Rappé; C. J. Casewit. Molecular Mechanics across Chemistry, (University Science Books, California, 1997) Search PubMed
.
- J. J. P. Stewart, J. Comput. Chem., 1989, 10, 209–220 CrossRef CAS
.
- J. J. P. Stewart, J. Comput. Chem., 1989, 10, 221–264 CrossRef CAS
.
- A. Warshel and A. Bromberg, J. Chem. Phys., 1970, 52, 1262–1269 CrossRef CAS
.
- M. J. Field, P. A. Bash and M. Karplus, J. Comput. Chem., 1990, 11, 700–733 CrossRef CAS
.
- D. R. Hensley, S. D. Goodrich, A. Y. Huckstep, H. J. Harwood and P. L. Rinaldi, Macromolecules, 1995, 28, 1586–1591 CrossRef CAS
.
- R. P. Quirk, J. M. Pickel, M. A. Arnould, K. M. Wollyung and C. Wesdemiotis, Macromolecules, 2006, 39, 1681–1692 CrossRef CAS
.
- J. G. Braks and R. Y. M. Huang, J. Appl. Polym. Sci., 1978, 32, 3111–3120 CrossRef
.
- R. P. Quirk and P. L. Cheng, Macromolecules, 1986, 19, 1291–1294 CrossRef CAS
.
| This journal is © The Royal Society of Chemistry 2011 |
