Lithium–thallium(I) butyrates binary system: an intermediate salt and liquid crystal from non-mesogenic compounds.†
Francisco Javier
Martínez Casado
ab,
Miguel
Ramos Riesco
c,
Iván
da Silva
de,
María Isabel
Redondo Yélamos
c and
José Antonio
Rodríguez Cheda
*c
aBM16-Laboratori de Llum Sincrotó (LLS), Spanish CRG Beamline at the ESRF, 38043 Grenoble, France. E-mail: fmartine@esrf.fr
bLaboratorio de Estudios Cristalográficos, Edificio Inst. López Neyra, Avenida del Conocimiento s/n, P.T. Ciencias de la Salud, E-18100 Armilla, Granada, Spain. E-mail: fmarcas@lec.csic.es; Tel: (+34) 958 181621 Lab. 107
cDepartamento de Química Física I, Facultad de Ciencias Químicas, Universidad Complutense, 28040 Madrid, Spain. E-mail: cheda@quim.ucm.es; Tel: (+34) 9139443061
dSpline Spanish CRG Beamline at the ESRF, 6 Rue Jules Horowitz, BP 220, 38043 Grenoble Cedex 09, France
eInstituto de Ciencia de Materiales de Madrid, ICMM/CSIC, Cantoblanco, 28049, Madrid, Spain
First published on 22nd July 2011
Abstract
The binary system between lithium and thallium(I) butyrates, [xLiC3H7CO2 + (1 − x) TlC3H7CO2], where x = mole fraction, has been carefully analyzed, solving the temperature and enthalpy vs. composition phase diagrams. The formation of an intermediate salt or complex with a composition (2![[thin space (1/6-em)]](https://www.rsc.org/images/entities/char_2009.gif) :
:![[thin space (1/6-em)]](https://www.rsc.org/images/entities/char_2009.gif) 1), an ionic liquid crystal phase and a metastable solid solution has been detected. The complex melts incongruently at Tfus = 494.7 K, with ΔfusHm = 7.70 kJ per mol of mixture. Its low temperature crystal structure (monoclinic, P21/c) has been solved and refined using X-ray synchrotron radiation and has been found to be bilayered, as is typical from pure metal alkanoates and, as it happens, for other two analogous intermediate salts studied recently by our group. The liquid crystal phase detected is formed from two non-mesogenic pure compounds, appearing in the binary system between 394.1 and 436.6 K and for x = 0.10 up to x = 0.29. Binary phase diagrams are shown to be a powerful tool to detect and predict the formation of liquid crystal phases and mixed crystals.
1), an ionic liquid crystal phase and a metastable solid solution has been detected. The complex melts incongruently at Tfus = 494.7 K, with ΔfusHm = 7.70 kJ per mol of mixture. Its low temperature crystal structure (monoclinic, P21/c) has been solved and refined using X-ray synchrotron radiation and has been found to be bilayered, as is typical from pure metal alkanoates and, as it happens, for other two analogous intermediate salts studied recently by our group. The liquid crystal phase detected is formed from two non-mesogenic pure compounds, appearing in the binary system between 394.1 and 436.6 K and for x = 0.10 up to x = 0.29. Binary phase diagrams are shown to be a powerful tool to detect and predict the formation of liquid crystal phases and mixed crystals.
1. Introduction
Organic salts have been widely studied for their properties, due to their characteristic amphiphilic structure: hydrophilic–hydrophobic. In particular, metal alkanoates or metal soaps (M(Cn)x, where M is the metal cation with charge +x and n is the total number of carbons in the alkanoate anion, e.g.LiC4: lithium butyrate) are well-known organic salts which are also very interesting by themselves because they may present polymorphism and/or polymesomorphism, depending on the gradual kind of disorder of the different parts. The processes involved in the transition from the totally ordered crystal phase at low temperature to the isotropic liquid phase constitute the “stepwise melting mechanism”. Thus, different solid (plastic crystal, rotator1,2 or condis3) or fluid mesophases (liquid crystal) may appear in these salts, as well as enantiotropic or monotropic polymorphs in the crystal phase.5 Another interesting aspect of some of these salts is the ease in which they form different glass states (amorphous, LC, plastic crystal, condis or rotator) when cooled down fast from the isotropic liquid.6–8The presence of the liquid crystal phase in metal soaps was described for the first time in ref. 9 and since then, many pure metal alkanoate series have been studied in order to describe this mesophase formation.10–16 The long chain members of the organic salt series have received more attention than the short chain ones because they form liquid crystal phases more easily. In this sense, two factors are responsible for liquid crystal formation: the characteristics of the ionic cation and the chain length. Therefore, longer members (above ∼8 C atoms) of the series usually form this phase. However, the shortest members may not be mesogens but “potentially mesogenic”17 when mixed with other metal alkanoates or any other salt.
According to Mirnaya and coworkers,17 the reason for the appearance of an ionic liquid crystal mesophase is the difference in the cation size, which increases the electrical anisotropy of the carboxylates, favoring the formation of the liquid crystal mesophases. Lithium and thallium(I) alkanoates are good candidates for this reason, but also due to the low polarizability of the latter, which is also the cause of the low melting points of thallium(I) alkanoates. Actually, the systems between lithium and thallium(I) propionates and pentanoates have been recently analyzed in depth by our group.18
Pure lithium and thallium(I) butyrates have been studied separately by different calorimetric techniques, such as adiabatic calorimetry,19,20DSC,21,22 and TG.23,24 However, the crystal structure of alkanoates belonging to the respective series were solved in the last 2 years, for example LiC4,25LiC3 and LiC5,26 anhydrous LiC2 and hydrates,27 or TlC3.18
Many binary phase diagrams have been analyzed28 with the aim of finding new mesogenic phases or enlarging an existing thermotropic LC phase in the binary phase diagram. Some of the phase diagrams between short alkanoates with different-sized metals have shown stable mesogenicity, such as [LiCn + CsCn]29 (where n = 2, 3 and 4), or [LiC4 + RbC4].30 Others have shown a stabilization of the mesophase (increasing the range of temperature and composition at which the liquid crystal phase is stable), like [LiC5 + TlC5].18 However, other systems does not show a liquid crystal phase for non-mesogenic pure compounds ([LiC3 + TlC3]),18 or do not stabilize the existing one, as happens in the [LiC4 + NaC4] system,31 either due to the short chain length or to the too small difference in the size of the cations. One of the objectives of this paper was to observe this effect on lithium and thallium(I) butyrates, once the results of the propionates and pentanoates phase diagrams are known.18
On the other hand, another important and common feature occurring in this kind of binary systems between metal alkanoates is the formation of mixed salts. For instance, a complex with a 2![[thin space (1/6-em)]](https://www.rsc.org/images/entities/char_2009.gif) :
:![[thin space (1/6-em)]](https://www.rsc.org/images/entities/char_2009.gif) 1 stoichiometry appears for both [LiC3 + TlC3] and [LiC5 + TlC5] systems, pointing to the existence of an intermediate salt independent to the alkyl chain length: Li2Tl(Cn)3. An intermediate rotator mesophase was also confirmed to exist in these mixed salts. Eventually, the formation of a mixed salt between lithium and thallium(I) butyrates, Li2Tl(C4)3, as well as the rotator nature of an intermediate solid mesophase is confirmed in this paper. All of these pure and mixed salts present a typical bilayered structure: ionic (metal cations and carboxylate anions) and lipidic (alkyl chains), forming 2D frameworks. However, a recent study of the [LiC4 + Pb(C4)2] system has shown the formation of a mixed metal salt, LiPb(C4)3, with a 3D coordination polymer structure,25 very unusual for anhydrous metal alkanoates. The solution of crystalline Li2Tl(C4)3 has also been an aim of this study, in order to confirm the expected bilayered structure.
1 stoichiometry appears for both [LiC3 + TlC3] and [LiC5 + TlC5] systems, pointing to the existence of an intermediate salt independent to the alkyl chain length: Li2Tl(Cn)3. An intermediate rotator mesophase was also confirmed to exist in these mixed salts. Eventually, the formation of a mixed salt between lithium and thallium(I) butyrates, Li2Tl(C4)3, as well as the rotator nature of an intermediate solid mesophase is confirmed in this paper. All of these pure and mixed salts present a typical bilayered structure: ionic (metal cations and carboxylate anions) and lipidic (alkyl chains), forming 2D frameworks. However, a recent study of the [LiC4 + Pb(C4)2] system has shown the formation of a mixed metal salt, LiPb(C4)3, with a 3D coordination polymer structure,25 very unusual for anhydrous metal alkanoates. The solution of crystalline Li2Tl(C4)3 has also been an aim of this study, in order to confirm the expected bilayered structure.
It is important to note that the study of the crystal structure of regular organic salts (bilayered) becomes fundamental not only to describe the low temperature phases, but also to explain their thermal behavior and the formation of mesophases with parameters of the area per polar head (S) and the cross-section area per alkyl chain (S’),32 that can be calculated from the crystal structure. These magnitudes are decisive in the identification of the rotator and condis mesophases.18
2. Experimental
2. 1. Sample preparation
TlC4 was prepared by chemical reaction between the corresponding acid (butyric acid, Aldrich, ≥99%), and thallium(I) carbonate (Riedel-de Haën, ≥99%), in methanol (Merck, ≥99.8%).19,23,4 The recrystallization was carried out for several times in an 1![[thin space (1/6-em)]](https://www.rsc.org/images/entities/char_2009.gif) :
:![[thin space (1/6-em)]](https://www.rsc.org/images/entities/char_2009.gif) 1 ethanol/ether mixture (Merck, ≥99.8%, and Fluka, >99.8%, respectively), and vacuum dried.18
1 ethanol/ether mixture (Merck, ≥99.8%, and Fluka, >99.8%, respectively), and vacuum dried.18
The purity of the synthesized salts was assessed by differential scanning calorimetry (DSC), with values of 99.97, and 99.71%, for LiC4 and TlC4, respectively.
Once the formation of the mixed salt, Li2Tl(C4)3, was detected when solving the phase diagram, it was prepared as a pure compound. Stoichiometric amounts (2![[thin space (1/6-em)]](https://www.rsc.org/images/entities/char_2009.gif) :
:![[thin space (1/6-em)]](https://www.rsc.org/images/entities/char_2009.gif) 1) of LiC4 and TlC4 were dissolved in hot ethanol. Li2Tl(C4)3 was crystallized by the slow evaporation of the solvent. The salt was washed with acetone (Merck, >99.5%) and vacuum dried. The thermal behavior of the mixed salt obtained is similar to that of the mixture with the same composition. No suitable single crystals of this salt were obtained, so its structure was studied by HRPD.
1) of LiC4 and TlC4 were dissolved in hot ethanol. Li2Tl(C4)3 was crystallized by the slow evaporation of the solvent. The salt was washed with acetone (Merck, >99.5%) and vacuum dried. The thermal behavior of the mixed salt obtained is similar to that of the mixture with the same composition. No suitable single crystals of this salt were obtained, so its structure was studied by HRPD.
2. 2. Differential scanning calorimetry
DSC measurements were performed in a TA–Q10 DSC with a refrigerating cooling system, model TA-RCS-90. Tightly sealed aluminum pans were used, in dry nitrogen, flowing at 50.0 mL min−1. A MT5 Mettler microbalance was used to weigh the samples, ranging between 3–10 mg (with an error of ±0.001 mg). The calorimeter was calibrated in temperature using standard samples of In and Sn (purity > 99.999% and > 99.9%, respectively), supplied by TA, and of benzoic acid (purity > 99.97%), supplied by the former NBS (lot 39i), and in enthalpy with the In and Sn standards already described.All of the measurements were taken at a heating rate of 5 K min−1. All the scans were usually explored from 200 K to the corresponding isotropic liquid temperature (at a maximum of 650 K).
2.3. Powder X-ray diffraction
High Resolution Powder Diffraction (HRPD) measurements were carried out at SpLine beamline (BM25A) of the Spanish CRG at the European Synchrotron Radiation Facility (ESRF, Grenoble) with a fixed wavelength of (0.8257 ± 0.0001) Å, at room temperature. The powdered sample was placed inside a 0.5-mm-diameter glass capillary, which was rotated during exposure. Data collection was done in a 2θ-step scan mode with 0.015° step and 5 s. acquisition time per point.XRD measurements (of LiC4, TlC4, and Li2Tl(C4)3) as a function of the temperature were carried out with a Philips X'Pert PRO MPD X-ray diffractometer with vertical goniometer θ/θ (Cu Kα1 radiation, 1.54056 Å, Ni filter) and a X'Celerator detector, equipped with a high-temperature chamber Anton Paar HTK1200. In situXRD area was scanned from 2θ = 2–70° at several temperatures in the range from room temperature to 600 K during heating and cooling, at a rate of 3 K min−1.
2.4. Infrared spectroscopy (FTIR)
The infrared spectra were recorded at room temperature in a Perkin Elmer Spectrum 100 FTIR Spectrometer using the Universal ATR sampling accessory.3. Results
3.1. Thermal analysis
| Compound | Transition | T/K | ΔH /kJ mol−1 | ΔS J−1 mol−1 K−1 |
|---|---|---|---|---|
| a Values referred to the mixed salt as a pure compound. | ||||
| LiC4 | SI–IL | 591.0 ± 0.5 | 21.1 ± 0.1 | 35.7 ± 0.2 |
| TlC4 | SIII–SII | 286.1 ± 0.3 | 2.65 ± 0.07 | 9.3 ± 0.3 |
| SII–SI | 289.7 ± 0.5 | 1.55 ± 0.05 | 5.3 ± 0.2 | |
| SI–IL | 456.6 ± 0.4 | 7.61 ± 0.08 | 16.7 ± 0.2 | |
| Li2Tl(C4)3a | SIII–SII | 401.6 ± 0.3 | 4.68 ± 0.03 | 11.6 ± 0.1 |
| SII–SI | 476.6 ± 0.3 | 0.91 ± 0.05 | 1.9 ± 0.2 | |
| Incongruent fusion | 494.7 ± 0.5 | 23.1 ± 0.2 | 46.7 ± 0.4 |
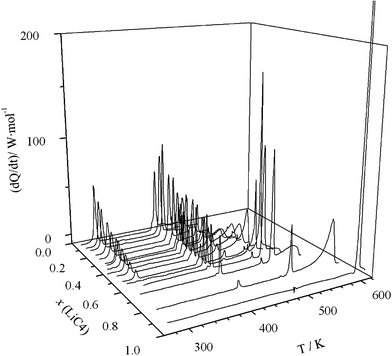 | ||
| Fig. 1 3D plot (heat flow vs. composition vs. temperature) for LiC4 + TlC4 system. | ||
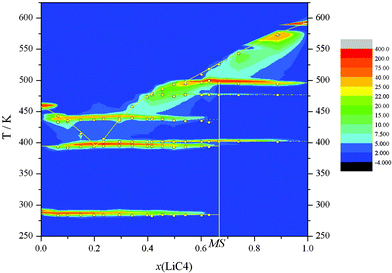 | ||
| Fig. 2 Contour plot (with z corresponding to the heat flow) of the diagram composition vs. temperature. | ||
The ΔH vs x phase diagram (shown in Fig. 3), for all of the reactions and characteristic points, has been developed following the Tammann's method.36 This method is commonly used in the construction of a phase diagram to help find the characteristic points or invariants (isotherms), by plotting the enthalpies (per mole of mixture) versus the composition for each process (e.g., eutectic reaction).18,25,30 Thus, the complete T vs x phase diagram is illustrated in Fig. 4. In all of the defined regions, except in the isotropic liquid (IL) and ionic liquid crystal (ILC) phases, which are one phase regions, two separated phases are observed.
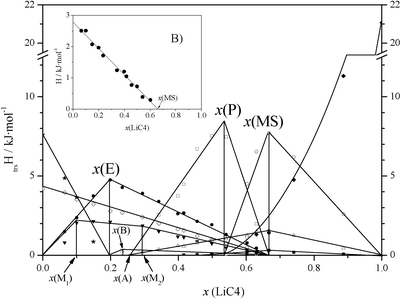 | ||
| Fig. 3 ΔH (per mole of mixture) vs. composition plot for the LiC4 + TlC4 system, for the following main transitions: ★: solubilization of TlC4; ⋄: SIII-to-SII + SII-to-SI transitions for TlC4 (summed); •: eutectic reaction; ▼: clearing of the ILC phase; ×: first solubilization of the mixed salt; □: second and third solubilizations of the mixed salt (summed); ○: peritectic reaction; Δ: SIII-to-SII transition of the mixed salt; ■: SII-to-SI transition of the mixed salt; ♦: solubilization of LiC4. In the inset B: •: represents the metastable transition corresponding to SIII-to-SII and SII-to-SI for TlC4. | ||
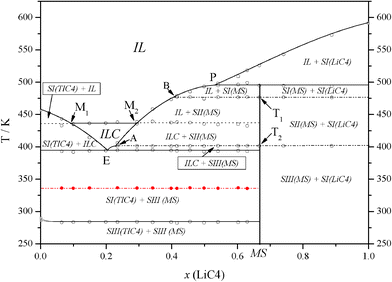 | ||
| Fig. 4 T vs. composition plot for the LiC4 + TlC4 system, showing the eutectic (E), and the peritectic (P) points, and points T1 and T2 (solid-to-solid transitions of the mixed salt), A and B (at the joints of the three solubilizations of the mixed salt), and M1 and M2 (at the joints of the clearing reaction with the solubilization of TlC4 and of Li2Tl(C4)3, respectively). IL: isotropic liquid; ILC: ionic liquid crystal; SN(TlC4), where N = I–III: N solid phase of TlC4; SI(LiC4), solid phase of LiC4; SN(MS), where N = I–III: N solid phase of Li2Tl(C4)3. The metastable transition, corresponding to SIII-to-SII and SII-to-SI for TlC4, is represented in red. | ||
The characteristic reactions, eutectic and peritectic, in this binary system are given in this scheme:
Eutectic reaction:
Peritectic reaction:
Three significant features are detected in this binary system: a) the anomalous behavior found in the first heating for the SIII-to-SII and SII-to-SI transitions of TlC4, b) the formation of a mixed salt, Li2Tl(C4)3 (with a stoichiometry 2![[thin space (1/6-em)]](https://www.rsc.org/images/entities/char_2009.gif) :
:![[thin space (1/6-em)]](https://www.rsc.org/images/entities/char_2009.gif) 1), and c) the appearance of an ionic liquid crystal phase (ILC, in Fig. 4).
1), and c) the appearance of an ionic liquid crystal phase (ILC, in Fig. 4).
1. On the one hand, a strange behavior is observed in one phase transition in the first heating for mixtures with 0 < x(LiC4) < 0.667. Once the molar fractions have been prepared and vacuum dried, the first process observed by DSC in the aforementioned compositions corresponds to a transition at 340.0 K, which appears as an invariant (red line in Fig. 4), and not to the SIII-to-SII and SII-to-SI transitions (summed) of TlC4, which are present in the second and following heatings (∼285 K). Immediately after having passed the transition, the stable behavior is recovered when cooling down, and the transition at 285 K appears again. The enthalpy of this process is plotted in the ΔH vs x phase diagram (inset B, in Fig. 2), with an evolution indicating that it is maximum at x(LiC4) = 0, i.e. pure TlC4, even when the phase transition does not occur for pure TlC4. The extrapolated enthalpy value is 2.8 kJ mol−1, lower than the value of the summed solid-to-solid transitions of TlC4 (4.20 kJ mol−1). Thus, it can be concluded that this anomalous process corresponds to a metastable transition of TlC4, induced by the presence of LiC4.
2. A complex with the composition (2![[thin space (1/6-em)]](https://www.rsc.org/images/entities/char_2009.gif) :
:![[thin space (1/6-em)]](https://www.rsc.org/images/entities/char_2009.gif) 1) appears, Li2Tl(C4)3. This compound was later isolated by crystallization in ethanol and studied by DSC. Li2Tl(C4)3 has two solid-to-solid transition, SIII-to-SII and SII-to-SI (points T2 and T1, respectively, and dash-dot lines in Fig. 4), at 401.6 and 476.6 K, respectively. The enthalpies of these transitions are 4.68 and 0.91 kJ mol−1 per mole of the intermediate salt, respectively (or 1.56 and 0.30 kJ mol−1 per mole of mixture). The intermediate salt is really a pure compound, different from both LiC4 and TlC4, so it is important to note that its molecular mass has to be three times the average molecular mass of the mixture with the composition x(LiC4) = 0.667, that is, 479.47 and 159.82 g mol−1, respectively. The salt melts incongruently at 494.7 K as it is described in the peritectic reaction. The full thermal data for Li2Tl(C4)3 is shown in Table 1.
1) appears, Li2Tl(C4)3. This compound was later isolated by crystallization in ethanol and studied by DSC. Li2Tl(C4)3 has two solid-to-solid transition, SIII-to-SII and SII-to-SI (points T2 and T1, respectively, and dash-dot lines in Fig. 4), at 401.6 and 476.6 K, respectively. The enthalpies of these transitions are 4.68 and 0.91 kJ mol−1 per mole of the intermediate salt, respectively (or 1.56 and 0.30 kJ mol−1 per mole of mixture). The intermediate salt is really a pure compound, different from both LiC4 and TlC4, so it is important to note that its molecular mass has to be three times the average molecular mass of the mixture with the composition x(LiC4) = 0.667, that is, 479.47 and 159.82 g mol−1, respectively. The salt melts incongruently at 494.7 K as it is described in the peritectic reaction. The full thermal data for Li2Tl(C4)3 is shown in Table 1.
3. The third remarkable (and maybe the most significant) fact in this system is the formation of an ILC phase above the eutectic point, homogeneous from this invariant (394.1 K) to the clearing point (436.6 K), an interval of existence of 42.5 K, reaching a maximum range in composition from x(LiC4) = 0.10 to 0.29 (M1 and M2, respectively, in Fig. 4) at the clearing point. The clearing of this ILC phase appears here as an invariant, as it happens in the LiC5 + TlC5 system,18 but different to other apparently similar phase diagrams reported ([LiC4 + CsC4] or [LiC4 + RbC4]).29,30Polarizing light microscopy was used to identify the liquid crystal phase as “smectic A-like” or neat phase. In Fig. 5, the typical focal conic domains of a neat phase are shown.
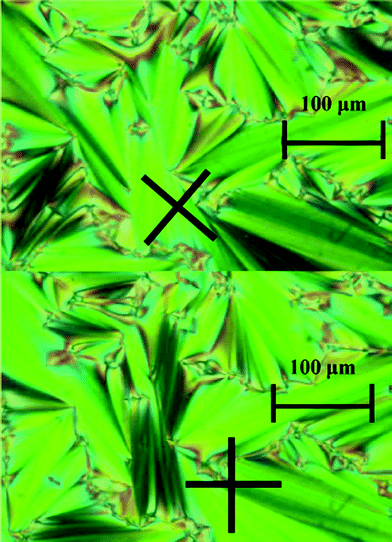 | ||
| Fig. 5 Typical fan shape domains of a “smectic A-like” (or neat) phase. Black crosses shows the orientation of the crossed polars. Pictures taken on a sample of x(LiC4) = 0.199 (eutectic mixture), at 430 K. | ||
3.2. X-ray diffraction
The crystal structure of Li2Tl(C4)3 has been solved and refined by HRPD, since it was not possible to obtain good single crystal of this compound. The structure was solved by Monte-Carlo methods and refined by means of the Rietveld method.37 Reflection positions of the first 20 peaks were determined using the WinPLOTR38 program and peak indexing was carried out with the DicVOL0639 program, founding a monoclinic cell. The space group was found using the Expo200940 program. The statistical algorithm for finding the correct space groups41 found, as the most probable, P21/c extinction group, after an automatic intensity extraction procedure.It was not possible to find the solution for the structure of Li2Tl(C4)3 by Direct Methods, with the Expo2009 program. Thus, a new and successful attempt was carried out, this time using the Monte Carlo technique with the FOX42 program.
The atomic coordinates found by the FOX program were introduced in the FullProf43 program, to perform the Rietveld refinement. The coordinates of 21 non-H atoms were refined, but solid rigid constraints on two parts of the alkyl chains were applied to limit the number of free parameters. Two different isotropic temperature factors were introduced: one for the heavy atom, Tl, and one for the rest of atoms. The positions of H atoms were calculated theoretically. Crystal data for Li2Tl(C4)3 can be found in Table 2, and the result of the Rietveld refinement is shown in Fig. 6.
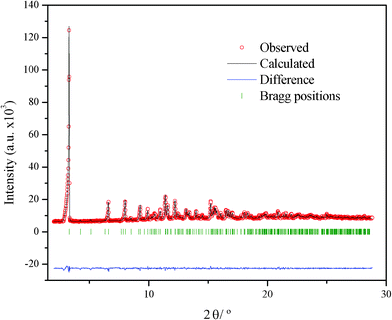 | ||
| Fig. 6 Rietveld refinement Li2Tl(C4)3, comparing the observed and calculated diffraction patterns, their difference and Bragg positions. | ||
| Crystal data | Li2Tl(C4)3 |
|---|---|
| Formula | Li2TlC12H21O6 |
| Mr (g mol−1) | 479.56 |
| Cell setting, space group (No.) | Monoclinic, P21/c (14) |
| T/K | 298(2) |
| a, b, c/Å, β (°) | 4.9253(1), 12.0749(2), 28.6547(5), 91.237(2) |
| Volume/Å3 | 1703.78(6) |
| Z, Dc/g cm−3 | 4, 1.86944 |
| Wavelength (Å) | 0.8257(1) |
| μ/mm−1 | 7.125 |
| Data collection | |
| Diffractometer | SpLine (BM25A) at the ESRF, Grenoble |
| Specimen mounting | Borosilicate glass capillary |
| Data collection mode | Transmission |
| Scan mode | 2θ-step scan |
| 2θ range (°), step size (° 2θ) | 2–29, 0.015 |
| Refinement | |
| Refinement method | Full-matrix least-squares on Inet |
| R p, Rwp, Rexp | 0.0223, 0.0286, 0.0101 |
| R F, RBRAGG | 0.0334, 0.0362 |
| Goodness-of-fit | 2.82 |
| Profile function | Pseudo-Voigt with axial divergence asymmetry |
| No. of contributing reflections | 377 |
| No. of parameters | 79 |
| No. of restraints | 38 |
| CCDC deposition number | 819196 |
Li2Tl(C4)3 presents a typical bilayered structure (ionic and lipidic layers), as do most of metal alkanoates. It is isostructural with Li2Tl(C5)3, and has a similar molecular arrangement as Li2Tl(C3)3 (although this one is orthorhombic).18 It presents two bilayers per unit cell, as it can be seen in Fig. 7A. The coordination of the Li cations is tetrahedral, as in LiC4,25 while, in the case of the Tl atom, four O atoms coordinate it in a pyramidal geometry, with the thallium in apical position (see Fig. 7B). These four O atoms are at distances less than 3.25 Å, which is considered the limiting distance for a Tl-O bond in the literature.44
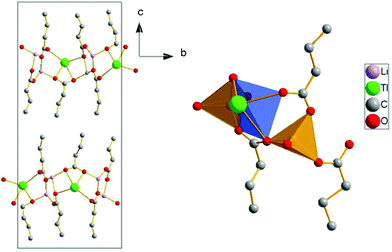 | ||
| Fig. 7 A) Crystal structure for the Li2Tl(C4)3 in the bc projection. B) Coordination of the lithium (tetrahedral) and thallium atoms (pyramidal geometry, with thallium in apical position). | ||
The d-spacing of the bilayered compounds (LiC4, TlC4, and Li2Tl(C4)3) as a function of the temperature was also studied and is shown in Fig. 8, indicating the different ordered phases and reactions. In the case of the Li2Tl(C4)3, a decrease in the d-spacing in the SIII-SII transition and the decomposition in the peritectic reaction is clearly observed.
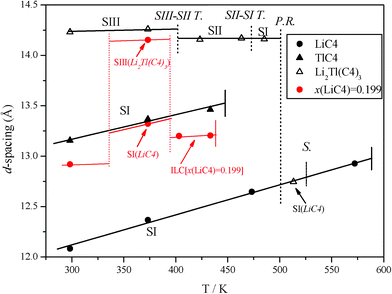 | ||
| Fig. 8 d-spacing vs. temperature indicating the different phases, for •: LiC4, ▾: TlC4, and Δ: Li2Tl(C4)3. In the case of the mixed salt, the reactions are display with dash-dot lines, where S–S T.: solid-to-solid transitions, P.R.: peritectic reaction, and S.: solubilization. The resulting compound after the incongruent melting of the mixed salt (peritectic reactions) is also indicated. In red, the d-spacing of the mixture with composition x(LiC4) = 0.199 in the first heating is shown. | ||
3.3. FTIR spectroscopy
The infrared spectra recorded at room temperature for pure LiC4 and TlC4 are compared to the Li2Tl(C4)3 infrared spectra in Fig. 9. As it can be observed, the spectrum of the intermediate salt Li2Tl(C4)3 is very different from that of the pure salts and does not correspond to the physical mixture of the pure compounds. This fact confirms the consideration of Li2Tl(C4)3 as a pure compound. In the mixed salt three bands corresponding to the asymmetric vibrations of coordinate carboxylate groups (νasCOO) appear at 1582, 1566 and 1544 cm−1 while only two components of the corresponding νsCOO symmetric stretching vibration are measured at 1429 and 1408 cm−1. The difference in wavenumbers between these vibrations is related to the type of carboxylate-to-metal coordination present in the salt. In this compound such difference is between 152 and 136 cm−1 which is consistent with a bidentate bridging or chelating mode of coordination, in agreement with the X-ray diffraction results. Methyl and methylene bending vibrations are also measured between 600 and 1400 cm−1. The short alkyl chain length in these salts does not allow the observation of wagging or rocking progression bands.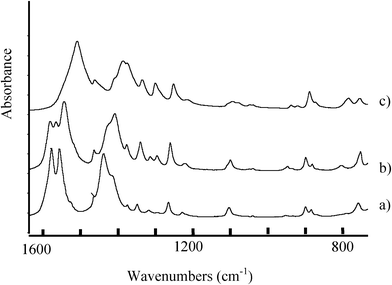 | ||
| Fig. 9 Room temperature infrared spectra of LiC4 (a), TlC4 (c) pure salts compared to that of the mixed salt Li2Tl(C4)3 (spectrum b), in the carboxylate and methyl and methylene chain vibration regions. | ||
4. Discussion
4. 1. A metastable solid solution
As described in section 3.1, a transition of the metastable phase is found for the mixtures with 0 < x(LiC4) < 0.667 in the first heating, instead of the solid-to-solid transitions of pure TlC4. Obviously, this fact has never been observed in pure TlC4, neither in this work nor in the literature,19,21 being detected in these aforementioned mixtures only when the homogenization is carried out by solution in methanol and quick removal of the solvent. However, despite being due to the mixture, the transition appears as an invariant at a fixed temperature (340 K), and the enthalpy decreases linearly from x(LiC4) = 0 to 0.667, so the process is theoretically maximum for pure TlC4. This behavior is not recovered once the transition is passed (in subsequent heatings), and the enthalpy of this “metastable” transition is lower than the one corresponding to the consecutive solid-to-solid transitions of pure TlC4. This is the reason why the phase is considered metastable.XRD experiments were carried out on a sample, with the composition x(LiC4) = 0.199, in order to characterize this rare process. Thus, some diffractograms were recorded at different temperatures in the first heating (Fig. 10). In these bilayered salts, the first peak corresponds to the d-spacing between bilayers—always the most intense. This can give an idea of the presence of one or two species, in a homogeneous or a mixture of two phases, respectively. In the first one, at room temperature, only one peak is observed at small angles. This peak splits into two at 373 K once the transition is passed. At 403 and 433 K, in the ILC phase, only the peak of such phase is detected. Once the mixture is melted and cooled down, a mixture of two phases is observed at room temperature, recovering the thermodynamically stable behaviour.
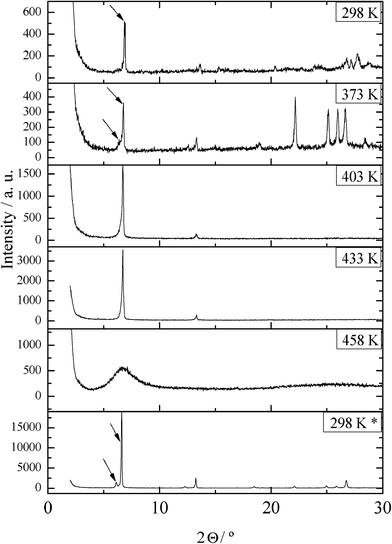 | ||
| Fig. 10 Diffractograms of the mixture with the composition x(LiC4) = 0.199 at the indicated temperatures (first heating), and at room temperature (*) after cooling from the melt. | ||
The d-spacing values found in this experiment are shown in Fig. 8 (in red). Apart from the homogeneous phase at room temperature (without heating), the phases found are expected. Thus, the unique phase seen below the transition at 340 K can be considered a metastable solid solution, as in the case of LiFePO4/FePO4,45 like a “Li-doped” or even a “Li2Tl(C4)3-doped” TlC4, due to the method for obtaining the mixtures.
4. 2. A mixed salt, Li2Tl(C4)3
A salt with the composition (2![[thin space (1/6-em)]](https://www.rsc.org/images/entities/char_2009.gif) :
:![[thin space (1/6-em)]](https://www.rsc.org/images/entities/char_2009.gif) 1) in the LiC4
1) in the LiC4![[thin space (1/6-em)]](https://www.rsc.org/images/entities/char_2009.gif) :
:![[thin space (1/6-em)]](https://www.rsc.org/images/entities/char_2009.gif) TlC4 ratio is formed, Li2Tl(C4)3, as in the [LiC3 + TlC3] and [LiC5 + TlC5] systems, Li2Tl(C3)3 and Li2Tl(C5)3, respectively. The molecular packing is the same in the three cases: a bilayered arrangement of ionic (lithium, thallium and carboxylates ions) and lipidic (alkyl chains) planes, which obviously changes the d-spacing due to the different chain length. These mixed salts, Li2Tl(Cn)3, must appear for other values of n, since the differences in length of the alkyl chain do not affect the ionic packing.
TlC4 ratio is formed, Li2Tl(C4)3, as in the [LiC3 + TlC3] and [LiC5 + TlC5] systems, Li2Tl(C3)3 and Li2Tl(C5)3, respectively. The molecular packing is the same in the three cases: a bilayered arrangement of ionic (lithium, thallium and carboxylates ions) and lipidic (alkyl chains) planes, which obviously changes the d-spacing due to the different chain length. These mixed salts, Li2Tl(Cn)3, must appear for other values of n, since the differences in length of the alkyl chain do not affect the ionic packing.
As in other bilayered compounds, the movements in the alkyl chains are enabled, or not, depending on the packing in the ionic layer. The parameter to quantify it is the cross-section area of the alkyl chains (S’), which is calculated from the area per polar head (S) and the torsion (tilt) of the plane of the chains with respect to the ionic plane (α), with this relation: S’ = S·cos(α).18,26,32 The values of S (and S’, if necessary), both in Å2, are: 19.8 for Li2Tl(C4)3, similar to those for Li2Tl(C3)3 and Li2Tl(C5)3 (19.5 and 19.7, respectively),18 and 21.7 (18.2) for LiC4.25 These values indicate that the chains are very compact (they have a highly hindered rotation) without any possibility to present defects in any of both salts (Li2Tl(C4)3 and LiC4) in the crystal phase at room temperature. It was not possible to solve the structure of the TlC4, nor to index the unit cell, but it is presumably isostructural with TlC3, which has a value of S = 25.6 Å2. This would agree with the ease of thallium(I) alkanoates to form gauche defects at room temperature (condis phase).4
Two solid-to-solid transitions are found for Li2Tl(C4)3, unlike the only one found for Li2Tl(C3)3 and Li2Tl(C5)3. In these salts the alkyl chains are ordered (all-trans) in both solid phases (SII, crystal phase, and SI, rotator phase).18 The enthalpy and the decrease in the d-spacing from SIII to SII in Li2Tl(C4)3 are comparable to the transition observed in those ones, which make us relate the SII phase of Li2Tl(C4)3 with SI in Li2Tl(C3)3 and Li2Tl(C5)3, and consider it a rotator phase, as in lithium and lead(II) alkanoates.8,26,32,46 Regarding the SII-to-SI transition of Li2Tl(C4)3, the enthalpy is quite small (0.91 kJ mol−1), and no drifts are detected in the d-spacings from one phase to another, suggesting that there must not be significant changes from SII to SI phase.
4. 3. Formation of an ionic liquid crystal phase
An ionic liquid crystal (ILC) phase is formed in this binary system, from two non-mesogenic compounds. This is one of the main features found studying this phase diagram, and also one of the initial goals of this work. As it was detailed in section 3.1, the ILC phase is a homogeneous phase from x(LiC4) = 0.10 to 0.29 (at the clearing point), and has a maximum interval of existence of 42.5 K in the eutectic composition, from 394.1 to 436.6 K—both very low temperatures for molten metal soaps. Two main factors are responsible for the ILC phase formation: the nature of the cations and the length of the alkyl chain. Thus, mesogenicity and its thermal stability are favored by mixing organic salts with different-sized metal cations.17 On the other hand, there is a critical length for the alkyl chain to form ILC phases, similar to what happens for pure metal alkanoates series.10 Several binary systems between metal soaps have been analyzed, so it is possible to compare this, [LiC4 + TlC4], with others attending to the variation of these two factors: the nature of the cations and the chain length.The appearance of the liquid crystal phase in pure metal alkanoates starts from n ≥ 4 for NaCn and KCn, from n ≥ 5 for RbCn and TlCn, from n ≥ 6 for CsCn and Pb(Cn)2, and from n ≥ 12 for LiCn,10 (where n is the total number of carbon atoms of the shortest member forming this mesophase, or critical length). Thus, comparing the size of the cations, a series of intermediate-sized cations present an ILC phase with lower values of n, with 0.59, 1.02, 1.38, 1.52, 1.67, and 1.50 Å as the ionic radii for monovalent Li, Na, K, Rb, Cs and Tl, respectively, and 1.19 Å for Pb(II).47 In the case of binary systems, four of them containing LiC4 have been studied so far: [LiC4 + NaC4],31 [LiC4 + RbC4],30 [LiC4 + CsC4],29 and [LiC4 + Pb(C4)2].25 In the case of [LiC4 + RbC4], an ILC phase appears, showing the decrease in the value of n from 5 and 12 (in the RbCn and LiCn series, respectively) to 4. The ILC phase is also formed in the [LiC4 + CsC4] system, but it even appears surprisingly with n = 2, [LiC2 + CsC2],29 descending from 6 and 12 (in the CsCn and LiCn series, respectively) to 2. The ILC phase exists in the [LiC4 + NaC4] phase diagram, but pure NaC4 is already mesogenic and the ILC phase is not stabilized in the binary system, since the temperature range of existence of such phase decreases with the composition of LiC4 until it disappears at x(LiC4) = 0.5 approximately. In the case of the [LiC4 + Pb(C4)2] system, no mesogenicity is observed. In the case of the [LiCn + TlCn] systems, the ones with n = 3 and 5 have been recently reported.18 In the case of the propionates, the mesogenic phase is not formed, but it is formed and greatly stabilized for the pentanoates (TlC5 is already mesogenic). As demonstrated in this work, the critical length is n = 4 (and not 5),18 since the ILC phase exists in the [LiC4 + TlC4] phase diagram. Taking into account this data, a direct relation between the different size of the cations and the formation of the ILC phase can be established, favoring the cases where that difference is bigger (Li-Rb, Li-Tl, and Li-Cs), and appearing at intermediate compositions. These results agree and reinforce the predictions done by Mirnaya and Volkov.17
Besides these considerations, it is worth remarking that the low polarizability of the thallium ion makes it form less ionic and weaker bonds than the alkali metal ions. Thus, melting points of the thallium(I) salts and their mixtures are remarkably low, and it is possible to design other mixtures to obtain ILC phases below 373 K.
5. Conclusions
The binary phase diagram between lithium and thallium(I) butyrates has been characterized in depth by DSC, XRD and polarizing light microscopy, from 250 K to 600 K approximately. This study has shown the formation of a homogeneous ionic liquid crystal phase, a complex, Li2Tl(C4)3, and a metastable solid solution for certain mixtures of the system.A direct comparison can be made between this system and others with one less and one more carbon atom in the alkyl chain: [LiC3 + TlC3] and [LiC5 + TlC5]. In all of them, the existence of a mixed salt with a composition of 2![[thin space (1/6-em)]](https://www.rsc.org/images/entities/char_2009.gif) :
:![[thin space (1/6-em)]](https://www.rsc.org/images/entities/char_2009.gif) 1 (in the lithium
1 (in the lithium![[thin space (1/6-em)]](https://www.rsc.org/images/entities/char_2009.gif) :
:![[thin space (1/6-em)]](https://www.rsc.org/images/entities/char_2009.gif) thallium(I) ratio) has been found. They have been first detected during the solution of the phase diagrams, and then obtained by crystallization. These salts, solved and refined by XRD, present the same arrangement in the ionic and lipidic layers, with the chain length the only difference. The thermal behavior is similar for members of this series of mixed salts, Li2Tl(Cn)3: they all melt incongruently and present solid-to-solid transitions, presumably from ordered crystal to a rotator phase.
thallium(I) ratio) has been found. They have been first detected during the solution of the phase diagrams, and then obtained by crystallization. These salts, solved and refined by XRD, present the same arrangement in the ionic and lipidic layers, with the chain length the only difference. The thermal behavior is similar for members of this series of mixed salts, Li2Tl(Cn)3: they all melt incongruently and present solid-to-solid transitions, presumably from ordered crystal to a rotator phase.
However, the main feature occurring in the present phase diagram corresponds to the formation of an ionic liquid crystal phase, from two non-mesogenic compounds (LiC4 and TlC4). The ILC phase extends up to a maximum interval of existence of 42.5 K, and, besides this, the melting and clearing temperatures are considerably low for organic salts. This fact confirms the predictions of Mirnaya and coworkers,17 and helps to find correlation rules to discover this kind of phases, in order to prepare “green solvent” from mixtures, with other cations different from thallium.
Finally, the study of these binary systems and the characterization combining several techniques (thermal and structural) proves to be powerful from the physical–chemical viewpoint, not only for the intermediate species and phases that may be found, but also as a way to study these phases and mesophases, in order to describe and comprehend the step-wise melting process, and to predict properties in other pure compounds and mixtures for organic salts in general. These studies in binary systems can also be extrapolated to analyze other phenomena, like cocrystallization or formation of mixed-ligand coordination polymers.18,25
Acknowledgements
Partial support of this research by the Beca de Especialización en Organismos Internacionales (ES-2006-0024) and by the DGICYT of the Spanish Ministerio de Ciencia e Innovación (Project CTQ2008-06328/BQU) are gratefully acknowledged. The authors wish to thank BM16-LLS and BM25 (Spanish beamlines at the ESRF, in Grenoble, France) and the CAI (Centro de Asistencia a la Investigación) of XRD of the UCM for the use of their technical facilities.References
- J. P. Ryckaert, M. Klein and I. R. McDonald, Phys. Rev. Lett., 1987, 58(7), 698–701 CrossRef.
- E. B. Sirota, Langmuir, 1997, 13(14), 3849–3859 CrossRef CAS.
- B. Wunderlich, M. Möler, J. Grebowicz and H. Baur, Conformational Motion and Disorder in Low and High Molecular Mass Crystals, In “Advances in Polymer Science. Number 87”, ed. H. Höcker, Springer-Verlag: Heidelberg, 1988. Search PubMed.
- J. A. R. Cheda, M. I. Redondo, M. V. García, F. L. López-de-la-Fuente, F. Fernández-Martín and E. F. Westrum, J. Chem. Phys., 1999, 111(8), 3590–3598 CrossRef CAS.
- M. Ramos Riesco, F. J. Martínez Casado, S. López-Andrés, M. V. García Pérez, M. I. Redondo Yélamos, M. R. Torres, L. Garrido and J. A. Rodríguez Cheda, Cryst. Growth Des., 2008, 8(7), 2547–2554 CAS.
- P. J. Collings, J. S. Patel, Handbook of Liquid Crystal Research, Oxford University Press: New York, 1997. Search PubMed.
- F. J. Martínez Casado, A. Sánchez Arenas, M. V. García Pérez, M. I. Redondo Yélamos, S. López de Andrés and J. A. R. Cheda, J. Chem. Thermodyn., 2007, 39(3), 455–461 CrossRef.
- F. J. Martínez Casado, M. Ramos Riesco, A. Sánchez Arenas, M. V. García Pérez, M. I. Redondo, S. López-Andrés, L. Garrido and J. A. R. Cheda, J. Phys. Chem. B, 2008, 112(51), 16601–16609 CrossRef.
- D. Vorländer, Ber. Dtsch. Chem. Ges., 1910, 43, 3120–3135 CrossRef.
- P. Franzosini, M. Sanesi, Thermodynamic and transport properties of organic salts, Pergamon Press: Oxford, 1980. Search PubMed.
- (a) A. Skoulios and V. Luzzati, Acta Crystallogr., 1961, 14, 278–286 CrossRef CAS; (b) B. Gallot and A. Skoulios, Acta Crystallogr., 1962, 15, 826–831 CrossRef CAS; (c) H. Abied, D. Guillon, A. Skoulios, P. Weber, A. M. Giroud-Codquin and J. C. Marchon, Liq. Cryst., 1987, 2(3), 269–279 CrossRef CAS.
- A. M. Giroud-Godquin, Handbook of Liquid Crystals, ed. D. Demus, J. Goodby, G. W. Gray, K. W. Spiess, V. Vill, Wiley-VCH: Weinheim, 1998, Vol. 2B, Chap. XIV, p. p. 901. Search PubMed.
- B. Donnio, Curr. Opin. Colloid Interface Sci., 2002, 7, 371–394 CrossRef CAS.
- B. Donnio, D. Guillon, R. Deschenaux, D. W. Bruce, Metallomesogens, In Comprehensive Coordination Chemistry II, ed.J. A. McCleverty, T. J. Meyer, Elsevier: Oxford, 2003. Vol. 7, chapter 7.9.; pp. pp. 357–627. Search PubMed.
- K. Binnemans and C. Görller-Walrand, Chem. Rev., 2002, 102(6), 2303–2345 CrossRef CAS.
- K. Binnemans, Chem. Rev., 2005, 105(11), 4148–4204 CrossRef CAS.
- T. A. Mirnaya, S. V. Volkov, Ionic Liquid Crystals as Universal Matrices (Solvents). Main Criteria for Ionic Mesogenicity. In Green Industrial Applications of Ionic Liquids., ed. R. D. Rogerset al., NATO Science Series; Kluwer Academic Publ, 2003. pp pp. 439–456. Search PubMed.
- F. J. Martínez Casado, M. Ramos Riesco, I. Da Silva, A. Labrador, M. I. Redondo, M. V. García Pérez, S. López-Andrés and J. A. R. Cheda, J. Phys. Chem. B, 2010, 114(31), 10075–10085 CrossRef.
- P. Franzosini, S. P. Ngeyi and E. F. Westrum, J. Chem. Thermodyn., 1986, 18(7), 609–618 CrossRef.
- J. A. R. Cheda, F. Fernández Martín, R. J. Burns and E. F. Westrum, J. Chem. Thermodyn., 1994, 26(8), 829–838 CrossRef CAS.
- P. Ferloni, M. Sanesi and P. Franzosini, Z. Naturforsch, 1975, 30a(11), 1447–1454 CAS.
- F. L. Fernández Martín, F. L. López de la Fuente and J. A. R. Cheda, Thermochim. Acta, 1984, 73(1–2), 109–115 CrossRef.
- T. Meisel, K. Seybold, Z. Halmos, J. Roth and Cs. Melykuty, J. Therm. Anal., 1976, 10, 419–431 CrossRef CAS.
- T. Meisel, K. Sybold and J. Roth, J. Therm. Anal., 1977, 12, 361–369 CrossRef CAS.
- F. J. Martínez Casado, M. Ramos Riesco, I. Da Silva, M. I. Redondo, A. Labrador and J. A. R. Cheda, Cryst. Growth Des., 2011, 11(3), 759–767 Search PubMed.
- F. J. Martínez Casado, M. Ramos Riesco, M. V. García Pérez, M. I. Redondo Yélamos, S. López-Andrés and J. A. R. Cheda, J. Phys. Chem. B, 2009, 113(39), 12896–12902 CrossRef.
- F. J. Martínez Casado, M. Ramos Riesco, M. I. Redondo, D. Choquesillo-Lazarte, S. López-Andrés and J. A. R. Cheda, Cryst. Growth Des., 2011, 11(4), 1021–1032 Search PubMed.
- P. Franzosini, P. Ferloni, Molten Alkali Metal Alkanoates, IUPAC Solubility Data Series, ed. A. Schiraldi, G. Spinolo, Pergamon Press: Oxford, 1988, Vol. 33..
- T. A. Mirnaya, G. G. Yaremchuk and V. D. Prisyazhnyi, Liq. Cryst., 1990, 8, 701–705 CrossRef CAS.
- F. J. Martínez Casado, M. Ramos Riesco and J. A. R. Cheda, J. Therm. Anal. Calorim., 2007, 87(1), 73–77 CrossRef.
- V. D. Prisyazhny, V. N. Mirny and T. A. Mirnaya, Ukr. Khim. Zh., 1983, 49, 668–669 Search PubMed.
- V. Busico, A. Ferraro and M. Vacatello, J. Phys. Chem., 1984, 88(18), 4055–4058 CrossRef CAS.
- (a) J. W. Mc Bain and A. Stewart, J. Phys. Chem., 1933, 37, 675–684 CrossRef CAS; (b) J. W. Mc Bain and M. C. Field, J. Phys. Chem., 1933, 37, 920–924 Search PubMed.
- P. Pacor and H. L. Spier, J. Am. Oil Chem. Soc., 1968, 45, 338–342 CrossRef CAS.
- M. Fernández-García, J. A. R. Cheda, E. F. Westrum and F. Fernández-Martín, J. Colloid Interface Sci., 1997, 185, 371–381 CrossRef.
- G. Tammann, Z. Anorg. Chem., 1903, 37, 303 CrossRef CAS.
- H. M. Rietveld, J. Appl. Crystallogr., 1969, 2, 65–71 CrossRef CAS.
- T. Roisnel and J. Rodriguez-Carvajal, Mater. Sci. Forum, 2002, 378–381, 118–126 Search PubMed.
- A. Boultif and D. Louër, J. Appl. Crystallogr., 2004, 37, 724–731 CrossRef CAS.
- A. Altomare, M. Camalli, C. Cuocci, C. Giacovazzo, A. G. G. Moliterni and R. Rizzi, J. Appl. Crystallogr., 2009, 42, 1197–1202 CrossRef CAS.
- A. Altomare, M. Camalli, C. Cuocci, I. da Silva, C. Giacovazzo, A. G. G. Moliterni and R. Rizzi, J. Appl. Crystallogr., 2005, 38, 760–767 CrossRef CAS.
- V. Favre-Nicolin and R. Cerný, J. Appl. Crystallogr., 2002, 35, 734–743 CrossRef CAS.
- (a) J. Rodríguez-Carvajal, Phys. B, 1993, 192, 55–69 CrossRef; (b) J. Rodriguez-Carvajal, Commission on Powder Diffraction (IUCr). Newsletter, 2001, 26, 12–19 Search PubMed.
- S. H. Huang, R. J. Wang and T. C. W. Mak, J. Chem. Soc., Dalton Trans., 1991, 5, 1379–1381 RSC.
- (a) G. Y. Chen, X. Y. Song and T. J. Richardson, J. Electrochem. Soc., 2007, 154(7), A627–A632 CrossRef CAS; (b) J. Cabana, J. Shirakawa, G. Y. Chen, T. J. Richardson and C. P. Grey, Chem. Mater., 2010, 22(3), 1249–1262 CrossRef CAS.
- F. J. Martínez Casado, M. V. García Pérez, M. I. Redondo Yélamos, J. A. R. Cheda, A. Sánchez Arenas, S. López de Andrés, J. García-Barriocanal, A. Rivera, C. León and J. Santamaría, J. Phys. Chem. C, 2007, 111(18), 6826–6831 Search PubMed.
- R. D. Shannon, Acta Crystallogr., Sect. A: Cryst. Phys., Diffr., Theor. Gen. Crystallogr., 1976, 32, 751–767 CrossRef.
Footnote |
| † CCDC reference number 819196. For crystallographic data in CIF or other electronic format see DOI: 10.1039/c1ra00089f |
| This journal is © The Royal Society of Chemistry 2011 |


